Article

Research on the Spillover Effect of China’s Carbon Market from the Perspective of Regional Cooperation

1
School of Economic, Shandong Technology and Business University, Yantai 264000, China
2
Department of Economic Management, Linyi Vocational University of Science and Technology, Linyi 276000, China
3
China Institute of Urban Governance, Shanghai Jiao Tong University, Shanghai 200030, China
4
School of International and Public Affairs, Shanghai Jiao Tong University, Shanghai 200030, China
5
College of Finance, Institute of High-Quality Development in Huaihai Economic Zone, Xuzhou University of Technology, Xuzhou 221018, China
6
School of Business, Macau University of Science and Technology, Macau 999078, China
*
Author to whom correspondence should be addressed.
Energies 2023, 16(2), 740; https://doi.org/10.3390/en16020740
Submission received: 23 November 2022 / Revised: 29 December 2022 / Accepted: 5 January 2023 / Published: 8 January 2023

Abstract

:
After the official launch of China’s unified carbon market, the potential for carbon emission reduction is huge. The pilot regional markets urgently need to be connected with the national carbon market to form a regional synergy and linkage mechanism and further promote the development of a unified carbon market. Spillover effects can be used to analyze the interaction between multiple markets. In this context, this study focuses on the overall spillover relationship among regional carbon trading markets. Using the VAR-GARCH-BEKK model and social network analysis (SNA), this study empirically analyzes the mean spillover effect and volatility spillover effect of regional carbon markets, and it establishes a spillover network between markets. The results show that the spillover effect of China’s regional carbon markets is widespread. Among them, the mean spillover effect is weak, and the impact period is short;. The volatility spillover effect is strong and has various directions; the spillover network connection between regional carbon markets is strong, but the spillover intensity is weak. Spillover effects will spread to the overall carbon market through information spillover paths and risk spillover paths. The stronger spillover effect and the stronger linkage between markets can bring more resource integration and unified supervision. Finally, we put forward policy recommendations, such as improving the carbon market mechanism and enhancing the maturity of carbon market development, increasing the participation and activity of the carbon market to encourage more participants to join the carbon market, improving the institutional system of the carbon market, and effectively supervising the process of information and risk spillover between carbon markets.

1. Introduction

In recent years, the climate issue has become a key social issue of common concern around the world. Countries have reached a consensus on the need to actively respond to climate change and jointly explore a low-carbon development path. The carbon market is a powerful starting point and an important measure [1,2]. The global carbon market has shown good market resilience under the economic impact brought by the COVID-19 pandemic. Although economic development has slowed, the carbon market’s operation process for green and low-carbon development has steadily advanced.
As the largest developing country and the country with the largest carbon emissions [3,4], China is also the market with the most potential for carbon emission reduction [5]. China’s carbon pilot market is an emerging and fragmented market [6]. If perceived as successful, it could serve as a model for other countries wishing to implement an ETS [7]. On 15 July 2021, the national unified carbon market was officially launched. The ETS includes the seven official pilot ETS programs as well as a range of sectoral climate and industrial policies. Several research studies have mentioned that carbon footprint assessment is also important for carbon reduction, which has been focused on the Czech Republic [8]. China’s ETS is essentially a tradable performance standard (TPS); it targets reductions in the CO2 intensity of economic activity rather than total CO2 emissions [9].Example sources of voluntary emission reductions include the development of domestic renewable energy, forest carbon sinks, methane utilization, and other domestic projects. The ETS is expected to support China’s goals of reaching its CO2 emissions goal by 2030 and achieving carbon neutrality by 2060 [10].
However, the current pilot region markets include price volatility and increased risk. The trading mechanism and management system of these carbon markets lack regional coordination and a linkage mechanism that can connect with the national carbon market. Therefore, it is of great significance to fully exploit the role of the regional carbon markets, integrate market resources, effectively utilize the overall spillover relationship between markets, and promote the coordinated development of the regional carbon markets and the national unified carbon market.
In order to explore the transformation of China’s carbon market from pilot markets to a national market and explore the best practices for developing the national carbon market, we took the six most active and representative pilot markets as research objects to analyze the spillover effects between carbon markets and explore the overall spillover network. We draw from the development and linkage experiences of these pilot markets and put forward constructive suggestions for the development of the national carbon market.
We assume that the spillover effect relationship between regional carbon markets can provide an effective reference for the development and construction of a national unified carbon market and can steadily promote the coordinated development of other regional carbon markets. To prove this hypothesis, this study is arranged as follows. After the introduction, Section 2 sorts out the core literature and explores the key points of research and innovation. Section 3 introduces the VAR-GARH-BEKK and social network analysis model in detail. Section 4 presents the research results, including mean spillovers, volatility spillovers, and social network analysis. Section 5 discusses the policy implications, and Section 6 draws the research conclusions.

2. Literature Review

Carbon emission rights and carbon allowances are new financial tools [11,12], and the carbon market is an important policy tool [13]. The spillover effects from the energy and financial markets are also becoming increasingly prominent [14]. With the global consensus on carbon emission reduction, the relationships between the carbon markets and conventional financial markets have been extensively studied [15]. In addition, economic events and policy changes can alter the structure of the dynamic linkage mechanism between the carbon market and other markets [16]. Carbon intensity in energy has the greatest impact on greenhouse gas emissions and air pollution [17]. Clean energy dominates all other markets [18]. Combustible renewable energy can be an effective instrument to confirm sustainable development and reduce CO2 emissions in developing countries [19]. One study found a significant positive effect of combustible energy and waste consumption and a negative impact of CO2 emissions on per capita Gross Domestic Product (GDP) [20]. Due to the uncertainty of energy markets [21], the time-varying spillover effects of different carbon markets and energy markets also have regional heterogeneity [22,23]. The power industry is an important element in the construction of China’s carbon emission trading system [24], and electricity demand plays a vital role in the spillover channel of heterogeneous information [25]. However, during crises, stock market uncertainty shows greater power than crude oil market uncertainty in transferring risk to the carbon market [26], and the green bond index remains the best hedging tool for carbon futures [27,28].
China’s carbon market is still in the early stage of construction; the development of regional carbon markets is unbalanced and insufficient. There are many obstacles to the coordinated development of the regional carbon markets [29]. The dual effects of the internal mechanism of the carbon market and the external environment lead to price fluctuations [30], which, in turn, lead to spillover relationships between markets [31]. Among them, the spillover fluctuation caused by the defects in the internal mechanism of China’s carbon market is more significant than that of the external environment, such as the energy market and the financial market. The overall linkage of spillover effects between China’s carbon markets is not strong [32]. The status quo of unbalanced economic development among regions and significant differences in low-carbon development levels pose challenges regarding how to promote balanced regional development under carbon trading conditions. By optimizing the design of allocation plans, one can promote the coordinated and balanced development of China’s reginal carbon markets [33], promote the connectivity of regional carbon trading and the coordination of carbon emissions prices, and effectively speed up the construction process of a unified national carbon market [34].
In the early stage of the construction of the national carbon market, it is worth considering how to effectively use the spillover relationship between markets to promote coordinated regional development. While building a national carbon trading system, in addition to strengthening the identification, control, and supervision of carbon market risks [35,36], it is also necessary to fully learn from the international carbon market [37] and China’s carbon trading pilots [38,39,40]. There are volatility spillovers in China’s carbon emissions trading pilots, but their extent is relatively low, while some characteristics of spillover effects are still worth exploring [41]. The trading price data of China’s carbon market are characterized by sharp peaks and thick tails, multi-fractality, and other characteristics [42]. The price fluctuations are not cyclical, the fluctuation range is large, and the volatility performance is poor [43]; the carbon price is mainly affected by its own historical prices [44]. There are large regional differences in trading activity, trading volume, and prices [45], among which the Hubei carbon market is relatively mature [46], and the yield fluctuations are stable [47]. Taking the rate of return as the research object, it is found that the volatility spillover effect of each carbon market is significantly asymmetric and highly correlated [48]. There is a significant two-way nonlinear Granger causality between markets [49]. There are different degrees of volatility spillover effects between every two carbon markets [50], and the yield and volatility spillover indices are time-variant, volatile, uncertain, and cyclical [51].
Scholars’ research on carbon market spillovers mostly focuses on external markets and environmental impacts, such as energy markets, financial markets, and international environments and policies. The research is relatively extensive and mature. However, the internal mechanism of the carbon market has a greater impact on the fluctuation of the spillover effect, and there are few studies on the spillover effect among the overall carbon market in China. As a tool to study the interaction relationship, social network analysis is interrelated with spillover effects. Few scholars have applied this method to the study of spillover effects. Therefore, on the basis of many studies and combined with social network analysis (SNA), we applied the VAR-GARCH-BEKK model to analyze the overall role relationship, linkage transmission mechanism, and spillover effect mechanism of China’s carbon market to solve the problem of market segmentation.
We aim to effectively integrate market resources, improve carbon market trading mechanisms and system construction, and promote the coordinated development of regional carbon markets and the national carbon market. We combined the six-element VAR-GARCH-BEKK model [42] with a social network to measure the spillover effect between carbon markets. From a pairwise relationship to a holistic relationship, independently operated carbon markets are woven into the network as nodes. We took the spillover effect empirical test results as the data source and the basis for social network analysis to clarify the price transmission mechanism and integration of markets. Starting from the characteristics of time series data, the empirical methods are progressively linked. Through regional coordination of carbon markets, we provide more referential experience for the construction of a national unified carbon market that will ensure reasonable carbon market prices.

3. Methods and Data

3.1. Model

The carbon market spillover effects are divided into mean spillover effects and volatility spillover effects. The mean value spillover effect means that the transaction price or income of the carbon market is not only affected by its own previous price factors and rate of return, but also the historical transaction statuses of other carbon trading markets. Generally, the VAR model is used to measure the mean spillover, and the VAR coefficient is used to reflect the inter-market interaction at the mean level. The carbon market volatility spillover effect refers to the transfer of fluctuations between carbon trading markets, and the volatility of one carbon trading market affects other trading markets. GARCH is generally used to measure the level of inter-market interaction at the level of volatility.

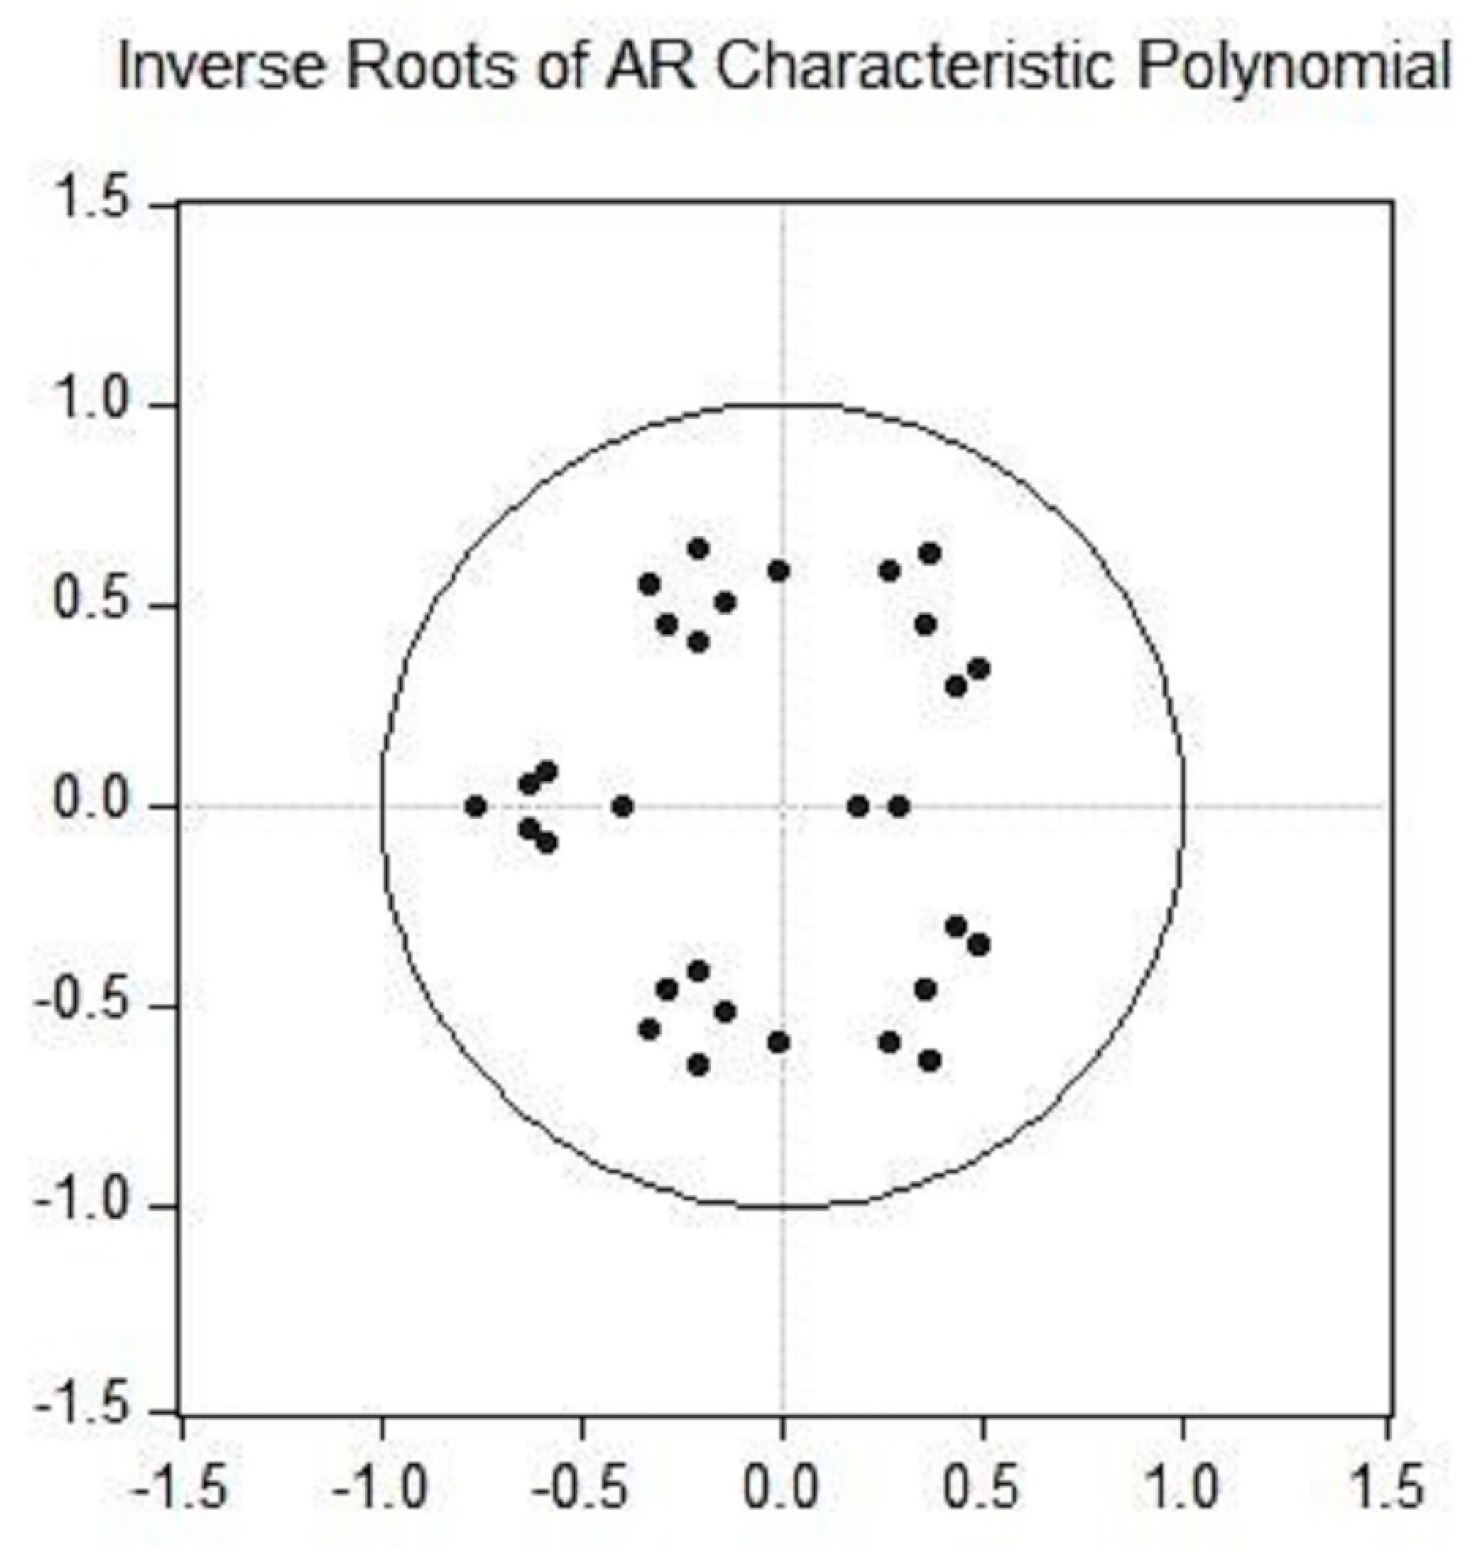
3.1.1. VAR-GARCH-BEKK

Sims proposed the vector autoregressive model (VAR model for short) in 1980 [52]. The VAR model is essentially the simultaneous form of the autoregressive model. All the explanatory variables in the model are the lag terms of each variable, and they are included in other variables in the equation to analyze the linkage effect among multiple variables. The VAR model with n variables in lag period k is expressed as follows:
Y t = C t + t 1 k w i Y t i + ε t
where Y t represents an n-dimensional endogenous column vector, C t represents an n-dimensional constant column vector; w i is an n × n parameter matrix, and ε t is an n-dimensional random perturbation column vector, where each element is non-autocorrelated.
In order to reduce the fluctuation in time series data and eliminate heteroscedasticity, we perform first-order logarithmic differencing on the daily closing price and obtain the return rate of the carbon market as an empirical test sample, which is expressed as follows:
R i , t = 100 × l n ( P i , t / P i , t 1 )
where i represents the abbreviation code of the city name of each carbon trading market—for example, the Shenzhen carbon market (SZ); R i , t represents the rate of return of market i on day t ; and P i , t is the corresponding price. In our case, we establish a multivariate VAR model with the return rate R i , t of the carbon market as a variable, and the simultaneous equations are expressed as follows:
{ R 1 t = c 10 + i = 1 k σ 1 i R 1 , t i + i = 1 k γ 1 i R 2 , t i + i = 1 k β 1 i R 3 , t i + i = 1 k α 1 i R 4 , t i + i = 1 k θ 1 i R 5 , t i + i = 1 k μ 1 i R 6 , t i + ε 1 t R 6 t = c 60 + i = 1 k σ 6 i R 1 , t i + i = 1 k γ 6 i R 2 , t i + i = 1 k β 6 i R 3 , t i + i = 1 k α 6 i R 4 , t i + i = 1 k θ 6 i R 5 , t i + i = 1 k μ 6 i R 6 , t i + ε 6 t
where R i , t represents the return rate sequence of each carbon market; C i represents an n-dimensional constant column vector; σ i , γ i , β i , α i , θ i represent n × n parameter matrices; and ε i t is an n-dimensional random perturbation column vector, where each element is non-autocorrelated.
In the multivariate GARCH model, the contemporaneous shocks of variables are correlated with each other, and the consideration of volatility diffusion is the main advantage of the GARCH model. BEKK is a representation of a class of vector GARCH models with fewer parameters to ensure the positive definiteness of H t . Its specific expression is as follows:
H t = C C + i = 1 q A i ε t i ε t i A i + i = 1 p B i H t 1 B i
where C is an N -dimensional lower triangular matrix, and A i and B i represent N × N parameter matrices. We take the transaction data of China’s regional carbon markets as the time series. So, we need to establish a multivariate GARCH-BEKK model. Due to space limitations, we take the binary model as an example, and set
H t = ( h 11 , t h 12 , t h 21 , t h 22 , t ) , C = ( c 11 0 c 21 c 22 ) , A = ( α 11 α 12 α 21 α 22 ) , B = ( b 11 b 12 b 21 b 22 )
Equation (4) can then be expressed as follows:
{ h 11 , t = c 11 2 + α 11 2 ε 1 , t 1 2 + 2 α 11 α 21 ε 1 , t 1 ε 2 , t 1 + α 21 2 ε 2 , t 1 2   + b 11 2 h 11 , t 1 + 2 b 11 b 21 h 12 , t 1 + b 21 2 h 22 , t 1 h 12 , t = h 21 , t = c 11 c 21 + α 11 α 12 ε 1 , t 1 2 + b 21 b 22 h 22 , t 1   + ( α 12 α 21 + α 11 α 22 ) ε 1 , t 1 ε 2 , t 1 + α 21 α 22 ε 2 , t 1 2   + b 11 b 12 h 11 , t 1 + ( b 11 b 22 + b 12 b 21 ) h 12 , t 1 h 22 , t = c 21 2 + c 22 2 + α 12 2 ε 1 , t 1 2 + 2 α 12 α 22 ε 1 , t 1 ε 2 , t 1 + α 22 2 ε 2 , t 1 2   + b 12 2 h 11 , t 1 + 2 b 12 b 22 h 12 , t 1 + b 22 2 h 22 , t 1
where h ii , t represents the volatility spillover between each carbon market and itself, h ij , t represents the mutual volatility spillover between carbon markets, h ii , t 1 and h ij , t 1 represent these fluctuation effects for the market lag period, respectively, and ε i , t 1 represents a series of carbon market returns.

3.1.2. Social Network Analysis

Social Network Analysis (SNA) is a sociological research method used to analyze the relationship between social actors [53] and the network structure and to study the impact of the group structure on group functions or individuals within groups [54]. Instead of emphasizing the study of individual attributes, it focuses on the social network relationship between individuals and regards the relationship as a basic statistical processing unit, rather than regarding an individual as an independent statistical unit [55]. It uses the centrality measure and the concept of structural equivalence to test network visualization or identify the locations of nodes in the network [56], among which the most widely used measures are density and centrality.
Network construction is performed on the fluctuating spillover relationship, and the network is converted into a simplified form of edges and nodes. Drawing on the method of defining the degree of volatility spillover in previous research results [57], we define the volatility spillover coefficient according to Equation (6) as
S pill ij = | a ij | + | b ij | ( i j )
where S pill ij represents the volatility spillover coefficient of variable i to variable j , and Equation (6) is valid if, and only if, the volatility spillover coefficients a ij and b ij are significant at the same time; otherwise, the volatility spillover coefficient is 0.

3.2. Data Processing

3.2.1. Data Source

We specify that the source of the data is the daily closing price of each carbon market in the WIND database. That is to say, the closing price is the original sample. All the data we study and apply are time series data.
Since there are many data vacancies in the Fujian carbon emission trading market and the Chongqing carbon emission trading center, we excluded them from the research objects based on the consideration of rigor and then selected the daily carbon trading markets of Hubei, Guangdong, Beijing, Shanghai, Tianjin, and Shenzhen. The sample interval started from 28 April 2014 (the starting date of the public data of the Hubei carbon trading market) and continued to 29 October 2021.
Excluding non-trading days, a total of 1827 sets of data are obtained. The details of data collection are shown in Table 1. Among them, when the trading volume of an individual carbon trading market on a certain trading day is 0, the closing price of the market is set to be equal to the closing price of the previous trading day. By performing a simple calculation of the daily trading price, we obtain the rate of return of each research subject, which is also the experimental data for time series measurement operations. We differentiate yields to analyze yield fluctuations across carbon markets.

3.2.2. Data Processing

We used EViews software to test the lag order of variables from 0 to 6 phases successively. According to the minimum value principle of information criterion, the fifth order was finally determined as the optimal order. The VAR(5) model was established for each carbon market yield series, and the non-autocorrelation and stationarity of its residuals were tested. If the VAR model is covariance stationary, the roots of all the eigenvalues of the characteristic equation are in the unit circle. The unit circle image obtained by the stationarity test of VAR(5) results is shown in Figure 1. All feature roots are in the central part of the unit circle. Therefore, VAR(5) established in this paper is stable, and its results are effective for subsequent applications.
After continuing to use EViews software to conduct subsequent stationarity tests and Granger causality analysis of the data, we used MATLAB software to conduct empirical analysis of ARCH and GARCH-BEKK. Finally, the obtained data results will be imported into Gephi software for social network drawing and analysis. Specific results will be analyzed in detail in the next section.
Our overall idea of the data is based on the time series data, using the empirical test results of spillover effects as the data source and analysis basis of social network analysis to measure the overall spillover relationship of the carbon market spillover effect. First, the ADF test is carried out on the return series to prove its stationarity. Second, the six-variable VAR-GARCH-BEKK volatility spillover model is constructed, and the BEKK test is carried out on the residual sequence obtained by the VAR model. Finally, the individual node data in the carbon market are the data source of the social network analysis to map the overall network relationship.

4. Results

4.1. Descriptive Statistics

The average returns of the three carbon markets in Shanghai, Beijing, and Hubei are positive, indicating that there are positive returns in the three carbon markets above the sample period, while the remaining three carbon markets have negative returns. The standard deviation of the Shenzhen carbon market and Guangdong carbon market is significantly higher than that of the other four. Combined with the mean value of negative returns, it can be seen that the Shenzhen and Guangdong carbon markets have the characteristics of strong carbon price volatility and high transaction risk. The Tianjin and Hubei carbon markets’ standard deviations are significantly lower than those of the other four, reflecting their high-yield and low-risk trading characteristics. Comprehensive analysis of skewness, kurtosis, and the JB value show that the returns of the six carbon markets all have the characteristics of “tip and thick tail”, volatility aggregation, and non-normal distribution. The ADF test results show that the six markets are stable at the 1% significance level, and there is no unit root; thus, they can be used for further empirical testing. The data are shown in Table 2.

4.2. Research on the Mean Spillover Effect

Mean spillover refers to the degree to which a market responds to the historical values of other markets. With the improvement of market effectiveness, the reception and processing of public information in each market become gradually consistent, the response of price fluctuations to information is strengthened, and the fluctuation law of historical values of transaction prices in each market can also be reflected in the entire market. At this time, the degree of effect is gradually increasing [58].
The test of the mean spillover effect mainly relies on the VAR model. Through Granger causal analysis and other applications, we analyzed the relationship and characteristics of the mean spillover effect between markets and the causes of the relationship. If the two variables are Granger reasons for each other, it means that there is a mutual influence relationship between the two variables. From Table 3, it can be seen that the one-way mean spillover effect is relatively obvious, and the two-way mean spillover effect only exists between the Tianjin and Hubei carbon markets. The average spillover effect among the return series of various carbon trading markets is weak, and the impact period is short, but the impact degree has an upward trend with the increase in the lag period.
China’s carbon trading pilot markets have been operating independently since their establishment. Each market has formulated trading rules and established a regulatory system according to its own regional characteristics and development status. There is a large gap in terms of trading status and market maturity, and there is a large difference in effectiveness. In the research range, China’s carbon markets are still in a state of separation, and their development is not yet mature. The national unified carbon market is still in the early stage of construction and development, and the construction of the relevant trading system and supervision system is not yet perfect. Therefore, it is reasonable that there are different degrees of mean spillover effect between markets.

4.3. Research on Volatility Spillover Effects

Vertical variables are ranked as i , and horizontal variables are ranked as j . The ARCH effect spillover coefficient a ij and the GARCH effect spillover coefficient b ij are shown in Table 4. The diagonal coefficients of the two parts of A and B are both significant at the 5% confidence level, indicating that the volatility spillover effect between the same markets is significant, and the current status of the carbon market in each region is significantly affected by its own fluctuations in the previous period. This is consistent with the mean spillover effect test. The results obtained by the impulse response and variance decomposition tests are in good agreement. Combining the two-part off-diagonal coefficient analysis, it is found that there is a widespread volatility spillover effect among various market variables.
The one-way spillover relationship and the two-way spillover relationship need further verification via the Wald test. The original hypothesis of the Wald test is (1) H 0 : a ij = b ij = 0 . If the test result rejects the null hypothesis significantly, this means that there is a relationship between the two variables in the one-way volatility spillover effect. (2) H 0 : a ij = b ij = a ji = b ji = 0 . If the test result rejects the null hypothesis significantly, this means that there is a two-way volatility spillover effect between the two variables. From the results in Table 5, it can be seen that the test coefficients of both single-term spillovers and two-way spillovers significantly reject the null hypothesis of the Wald test. The Wald test again verifies that the inter-market volatility spillover relationship obtained in the GARCH-BEKK model does exist.
The reasons for the mentioned spillover relationship are related to institutional factors such as the development maturity of each market, the importance attached to the construction of the carbon market, and the regulatory system.
First, markets with more mature development and higher participation have stronger spillover effects on other markets, such as the Hubei carbon market. As the most mature carbon market in the regional carbon markets, the Hubei carbon market has more obvious one-way spillover effects. The Hubei carbon market is open and active, and the participants in emission control include enterprises and individuals. The cumulative transaction volume of the secondary carbon allowance market accounts for approximately one-half of the national total, and the transaction volume exceeds one-half of the national total. Therefore, the Hubei carbon market, as the most mature carbon market among the pilot carbon trading markets, has obvious spillover relationships with other carbon markets. The Shenzhen carbon market is the first carbon trading pilot market established in China. It pays more attention to the coordinated development of the carbon market and has a stronger awareness of carbon market development. Moreover, its developed economy can also obtain more fiscal expenditure to support the development of the carbon market, so the volatility spillover relationship is active. The three carbon markets of “Beijing, Shanghai, and Guangzhou” are located in the economic and political centers, respectively. They have played a good role in promoting the construction and management of carbon markets in terms of coordinated economic development and policy support, and the spillover effect of fluctuations between markets is relatively significant.
Secondly, the regulatory system is not strict, and the carbon market with more obvious price fluctuations is affected by the spillover effects from other carbon markets, such as the Tianjin carbon market. The Tianjin carbon market has a small trading volume, and the participation and compliance rate of emission control entities are both low. The market was once cold. Therefore, the price fluctuation of the Tianjin carbon market is the most obvious. It is not only affected by its own market operation, but, in the overall network of the overall carbon market volatility, when the overall market environment changes, this will also cause significant fluctuations in the transaction price of the Tianjin carbon market.
With the continuous improvement in market maturity and the gradual improvement in policies related to the development of the national carbon market, the objects and intensity of spillover effects between regional carbon markets in China are also changing. The volatility spillover effect relationship between regional carbon markets in China is widespread, which can provide a more reasonable reference for the construction of the national carbon market and then promote the coordinated development of the regional carbon markets and the national carbon market.

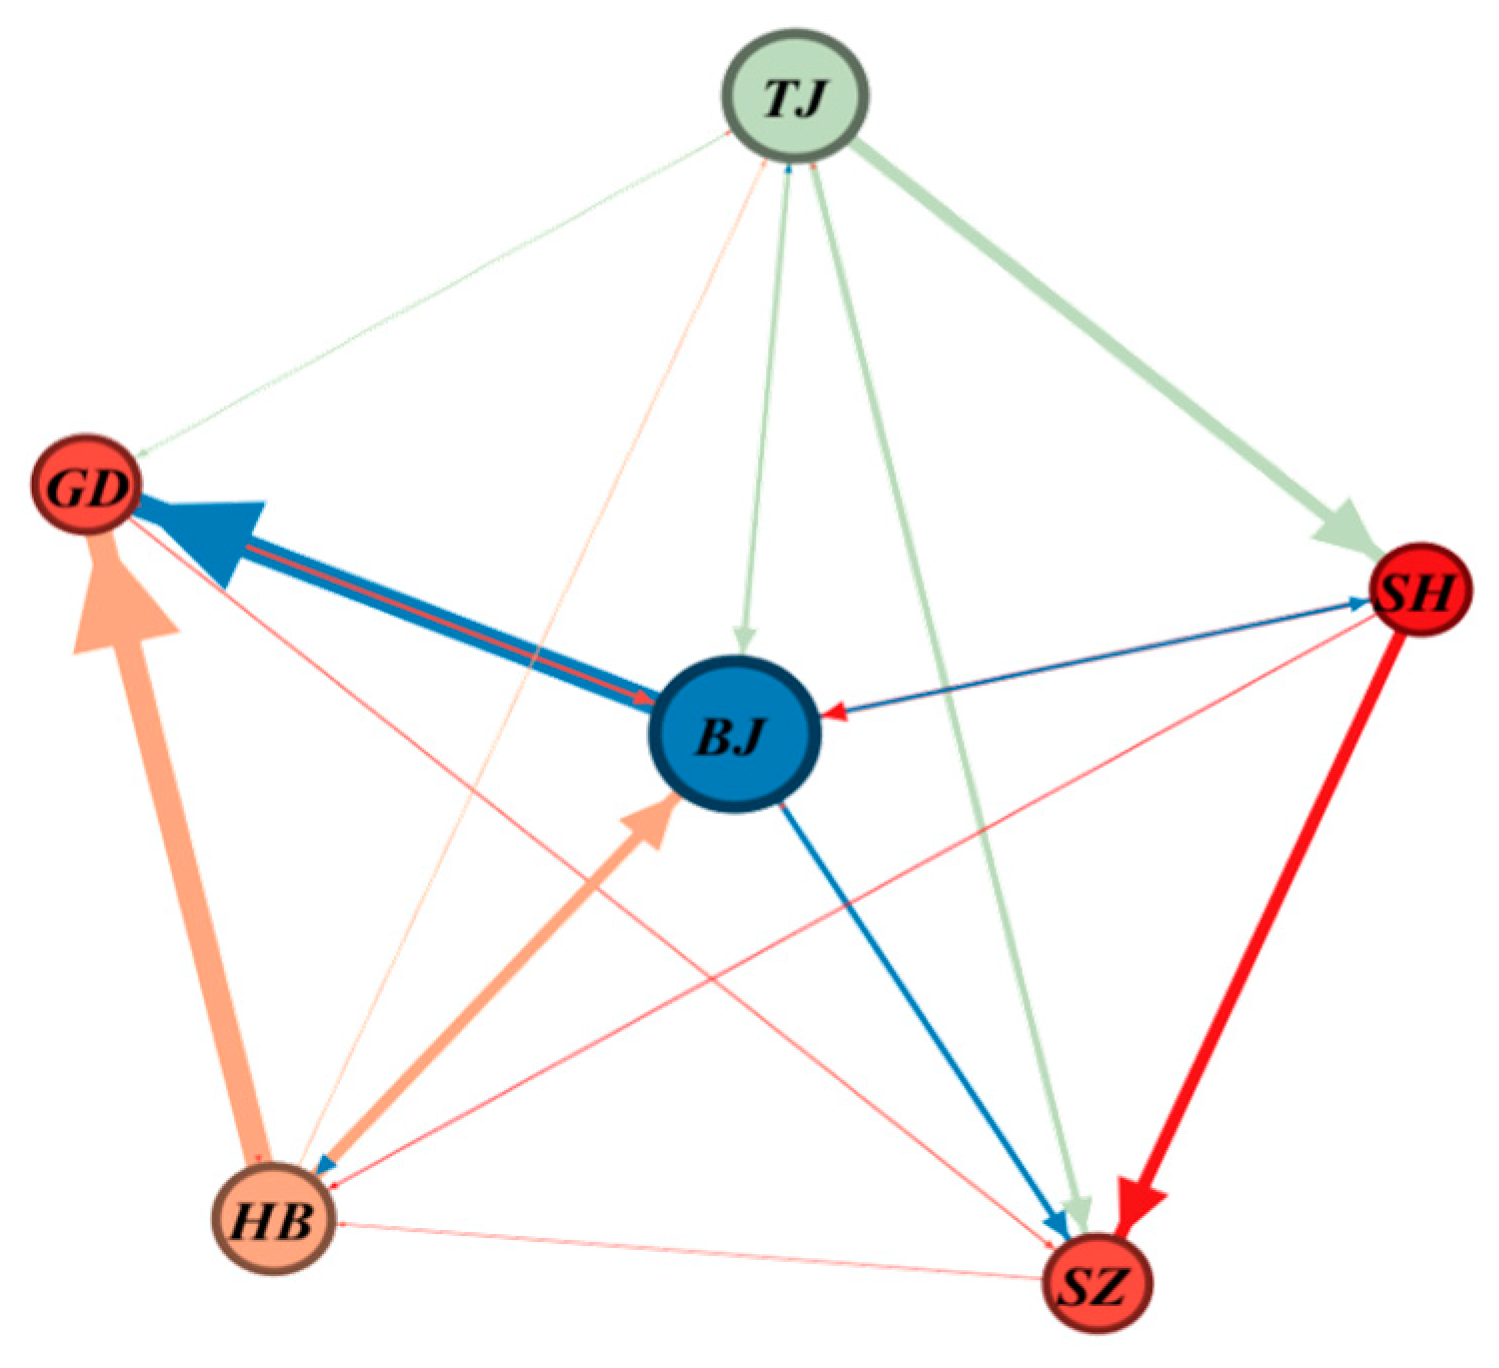
4.4. Network Research on Spillover Effects between Markets

With the help of Gephi 0.9.2, the mentioned fluctuation spillover relation is constructed, and the network is converted into a simplified form of edges and nodes. The specific calculation of the fluctuation spillover data is shown in Table 6.
Taking intermediate centrality as the principle of edge building and using “Fruchterman Reingold” as the layout algorithm, we draw a social network, as shown in Figure 2. Compared with other layout algorithms, this layout algorithm follows the principle of “connected nodes are close, but unconnected nodes are mutually exclusive”. The layout principle makes the network results more intuitive and systematic.
Based on the analysis of Table 6 and node characteristics, it can be seen that spillover effects are common among China’s regional carbon trading markets. Each node has different roles in the network regarding spillover effects, but their positions in the network are the same. The social network density of volatility spillover effects is strong, and the correlation is close, but the strength of the spillover effect between nodes is low, the market effectiveness needs to be further strengthened, and the degree of integration needs to be further improved.
The closeness of the economic relationship between the various markets determines the closeness of the carbon market. The linkage cycle between the carbon market, financial enterprises, and the real economy have a mutual influence and close connection. The price fluctuations in the regional carbon market are transmitted by financial institutions and various emission control entities to another regional carbon market, causing their price fluctuations. This is the main transmission channel of the spillover effect in China’s regional carbon market. The construction of the national carbon market takes the power generation industry as the breakthrough point, and it takes the lead in realizing carbon emission rights trading nationwide. In addition, the main types of entities participating in the emission control of the carbon market in various regions include the steel, petrochemical, cement, and chemical industries. Similar industrial structures mean that the industries are more closely related to economic development in the regions in which the carbon markets are located, and they also cause the spillover effect to be transmitted more smoothly. The close linkage effect between Chinese industrial enterprises has promoted the spillover effect between China’s regional carbon markets.
The media of spillover effects in carbon markets are information and risks, and spillover effects are realized by means of the close connection with the real economy. From the perspective of its own mechanism, China’s regional carbon markets are still in a state of parallel development. Although each market has different roles in the context of a unified national carbon market, they all operate under a set of planning and management systems, and their own mechanisms are unavoidable. For example, the participation of the control entity is not high, and the transaction is not active. From the perspective of the role of the external environment, the information received by the carbon market is all homogeneous. The difference in market maturity and the correlation between its market development and the real economy constitute the main basis for information and risk dissemination between markets.
The carbon market spillover effect is under dual pressure from its own market mechanism defects and the role of the external environment. Information and risks are transmitted between the market and emission control entities along the spillover path. The specific action path is shown in Figure 3. Therefore, when subject to the same policy constraints, changes in primary market allocation, changes in other market operations, and price fluctuations, spillover effects will spread to the overall carbon market through information spillover paths and risk spillover paths. The information spillover effect is conducive to improving the market effectiveness and contributing to the coordinated development of the carbon market. Risk spillovers will cause overall fluctuations between markets. For a carbon market with low development maturity, small changes in other markets will cause large fluctuations in the market, which is not conducive to the smooth transition of the regional carbon market to the national carbon market. Risk spillover follows the transmission of information. Although it is inevitable, an effective supervision and early warning system can be formulated to prevent it and resolve it in a timely manner.

5. Discussion

We applied the VAR-GARCH-BEKK model combined with the social network analysis method to explore the spillover effect of China’s regional carbon trading markets. The results show that there are generally mean and fluctuation spillover effects of different directions and intensities in China’s regional carbon markets. The social network analysis results also show that the spillover network connectivity between carbon markets is strong. The stronger the spillover effect of China’s regional carbon markets, the stronger the linkage between markets, and the more conducive it is to resource integration and unified supervision, which can provide a more effective construction experience for the development and supervision of a unified national carbon market. In order to promote the coordinated development of the regional carbon markets and the national carbon market, we propose the following policy recommendations.
First, it is necessary to improve the carbon market mechanism and enhance the maturity of carbon market development. The root cause of both the low spillover intensity and the degree of integration of China’s regional carbon markets lies in the mechanism setting of the carbon market itself. The fact that China’s regional carbon trading markets have always been in a fragmented state since their inception is attributed to the fact that the institutional mechanism construction of the national carbon market itself lags behind. China’s regional carbon markets lack a linkage mechanism. In the process of information transmission, the market maturity is low, and the ability to distinguish valid information is weak. The opaque information leads to information asymmetry between the supply and demand sides, which affects the transmission path of spillover effects and hinders the market. The absence of a tertiary market (derivative market) in the carbon market makes it impossible for carbon market information to be transmitted between the secondary and tertiary markets, which greatly limits the efficiency of the information transmission path and reduces the intensity of spillovers between markets. To this end, it is necessary to improve the carbon market mechanism and enhance the maturity of carbon market development. By including the exchange as the trading platform and link, the market and participating enterprises can be closely linked and cooperate; thus, one can build a market-oriented pricing mechanism to reduce the risk of price fluctuations, strengthen the research and development of financial products and continuously enrich the variety of market transactions, and establish and improve the supporting service system for the development of the carbon market.
Second, it is necessary to encourage as many participants as possible to join the carbon market so as to increase market participation and activity. On the one hand, it is important to gradually relax the scale of carbon emission standards, lower the entry threshold, and expand the scope of carbon emission entities. According to the development level of China’s carbon market, one should gradually reduce the scale of industrial and non-industrial carbon emission standards and clarify the access rules for transportation, financial institutions, and individuals to participate in the carbon market as soon as possible. Moreover, one should actively build a platform for individuals to participate in carbon trading, mobilize their willingness to actively participate in carbon emission reduction, and enhance their risk awareness and ability to participate in carbon trading. On the other hand, expanding the regional coverage will gradually cause the regional carbon market to transition to the national carbon market. This would allow one to fully learn from the mature experience of the regional carbon market and exploit the demonstration role of the carbon trading pilot market in the construction of a national unified carbon market. Combined with the maturity of the carbon market in each region and the local economic development, one can strengthen the multi-party linkage effect of emission control entities, verification agencies, and governments. Focusing on the regional carbon trading market, it is necessary to promote the spread of pilot areas to surrounding pilot areas and non-pilot areas and to strengthen inter-market and inter-regional information spillover, resource integration, and regional cooperation. Thus, one can gradually shorten the low-carbon development gap between regions, in addition to promoting balanced development of the carbon market between regions and the improvement of the national carbon market.
Finally, it is necessary to improve the construction of the carbon market system and effectively supervise the process of information and risk spillover between carbon markets. On the one hand, it is important to strengthen the management of carbon market information disclosure, incorporate the information disclosure system into national legislation, formulate and issue trading management measures and a voluntary emission reduction trading management system as soon as possible, and guide climate change responses in the form of legal provisions. Moreover, one should clarify the specific requirements for the information disclosure time, period, method, scope, and platform of carbon market authorities and trading institutions. At the same time, key emission units and third-party institutions such as emission reduction certification agencies should gradually establish the status of carbon information disclosure subjects. One should establish a multi-disciplinary co-governance supervision system for the specific management and collaborative management of the carbon market [59] and combine the forces of the government, the market, institutions, society, and even individuals to jointly supervise it. On the other hand, adopting the strategy of combining macro-prudential supervision and a micro-monitoring system would serve to reduce the degree and speed of risk diffusion. The object of risk monitoring and early warning is not limited to the risk spillover effect between its own carbon market and the regional carbon market, but it also pays attention to the risk spillover of China’s carbon market from the EU carbon market, the coal and other energy markets, and stocks and other financial markets. One should combine quantitative and qualitative analysis; improve risk monitoring, early warning, and crisis handling systems; identify risk types; track risk sources and spillover directions; and avoid causing systemic risks.

6. Conclusions

As a powerful tool and an important measure for countries around the world to respond to climate change and explore a low-carbon development path, the carbon market has already shown its important impact on carbon emission reduction. As the world’s largest developing country with the largest carbon emissions, China has huge potential to use the carbon market as a policy tool to reduce carbon emissions. Thus far, China’s unified carbon market has been officially launched and is progressing steadily. The pilot regional markets urgently need to be better connected with the national carbon market to form a regional synergy and linkage mechanism and further promote the development of a unified national carbon market. Spillover effects can be used to analyze the interactions between markets and are suitable for the study of regional carbon markets. In this context, this study focused on the overall spillover relationship among regional carbon markets. The VAR-GARCH-BEKK model was used to systematically analyze the spillover effects between regional carbon markets from two aspects: the mean spillover effect and volatility spillover effect. Afterwards, according to the analysis results of spillover effects, social network analysis (SNA) was used to establish a spillover network between markets.
We found that about the spillover effect of China’s regional carbon markets was widespread. Among them, the mean spillover effect has a weak impact intensity and a short impact period, while the volatility spillover effect of different directions and intensities is common among carbon markets. Meanwhile, social network analysis shows that the spillover network connection between China’s carbon markets is strong, but the spillover intensity is weak. These are all related to the actual development level of the carbon market in each region. When a regional market is affected by changes in the operation of other markets and price fluctuations, it will spread to the overall carbon market through information spillover paths and risk spillover paths, according to the results of spillover effects. Consequently, it is of great significance to effectively utilize the overall spillover relationship between markets, integrate market resources, and promote the coordinated development of the regional carbon markets and the national unified carbon market. In response to these research results, the policy suggestions can be put forward as follows: improve the setting of carbon market mechanisms and enhance the maturity of carbon market development; encourage more participants to join the carbon market, thus increasing the participation in and activity of the carbon markets; improve the construction of the carbon market institutional system; and effectively supervise the process of information and risk spillover between carbon markets.
We combined social network analysis (SNA) to analyze the spillover effect of carbon markets, providing new research direction and ideas for the subsequent application of this topic. This research guarantees the authenticity and validity of the empirical analysis results of the spillover effect and adds methodological support to the theoretical research of carbon markets. From a practical perspective, the analysis of the overall spillover relationship of carbon markets is helpful to promote the coordinated development of regional carbon markets and the national carbon market. Analyzing the linkage relationship between Chinese carbon markets and finding the spillover path between the markets can help promote the integration of resources while preventing risk transmission and stabilizing the trading price, thus promoting the smooth transition of Chinese regional carbon markets to the national carbon market. However, due to the lack of data in some markets, the overall analysis results are not complete, which is the first major shortcoming of this research. Although the model method can ensure the accuracy of data results, it is not novel, which is the second major regret of this research. Hopefully, they can be remedied in follow-up studies.

Author Contributions

Conceptualization, methodology, and writing—original draft, J.L.; formal analysis and writing—original draft, X.D.; formal analysis, writing—review and editing, investigation, supervision, and funding acquisition, X.S.; data curation and formal analysis, T.D.; data curation and formal analysis, A.Z.; review and editing, M.T. All authors have read and agreed to the published version of the manuscript.

Funding

This research was funded by the National Natural Science Foundation of China, grant numbers 72004130.

Institutional Review Board Statement

Not applicable.

Informed Consent Statement

Not applicable.

Data Availability Statement

Data will be made available on request.

Conflicts of Interest

The authors declare no conflict of interest.

Abbreviations and Symbols

AbbreviationsSymbols
SZShenzhen Y t n-dimensional endogenous column vector
BJBeijing C t n-dimensional constant column vector
SH Shanghai w i n × n parameter matrix
GD Guangdong ε t n-dimensional random perturbation column vector
TJ Tianjin i abbreviation code of the city name of each carbon trading market
HBHubei R i , t the rate of return of market i on day t
rszThe average returns of Shenzhen carbon market P i , t corresponding price
rshThe average returns of Shanghai carbon market C i n-dimensional constant column vector
rbjThe average returns of Beijing carbon market σ i , γ i , β i , α i , θ i n × n parameter matrices
rgdThe average returns of Guangdong carbon marketHtA positive qualitative set of spillovers
rtjThe average returns of Tianjin carbon market C N -dimensional lower triangular matrix
rhbThe average returns of Hubei carbon market A i N × N parameter matrices
B i N × N parameter matrices
h ii , t volatility spillover between each carbon market and itself
h ij , t mutual volatility spillover between carbon markets
h ii , t 1 , h ij , t 1 fluctuation effects for the market lag period
ε i , t 1 a series of carbon market returns
S pill ij volatility spillover coefficient of variable i to variable j
a ij , b ij volatility spillover coefficients

References

  1. Zhang, X.; Loschel, A.; Lewis, J. Emissions Trading Systems for Global Low Carbon Energy and Economic Transformation. Appl. Energy 2020, 279, 115858. [Google Scholar] [CrossRef]
  2. Wang, X.X.; Huang, J.L.; Liu, H.D. Can China’s carbon trading policy help achieve Carbon Neutrality?—A study of policy effects from the Five-sphere Integrated Plan perspective. J. Environ. Manag. 2022, 305, 114357. [Google Scholar] [CrossRef]
  3. Strand, J.; Miller, S.; Siddiqui, S. Long-run carbon emission implications of energy-intensive infrastructure investments with a retrofit option. Energy Econ. 2014, 46, 308–317. [Google Scholar] [CrossRef]
  4. Wu, L.P.; Zhu, Q.Y. Impacts of the carbon emission trading system on China’s carbon emission peak: A new data-driven approach. Nat. Hazards 2021, 107, 2487–2515. [Google Scholar] [CrossRef] [PubMed]
  5. Gao, Z.; Geng, Y.; Wu, R.; Chen, W.; Wu, F.; Tian, X. Analysis of energy related CO2 emissions in China’s pharmaceutical industry and its driving forces. J. Clean. Prod. 2019, 223, 94–108. [Google Scholar] [CrossRef]
  6. Chang, K.; Ge, F.; Zhang, C.; Wang, W. The dynamic linkage effect between energy and emissions allowances price for regional emissions trading scheme pilots in China. Renew. Sustain. Energy Rev. 2018, 98, 415–425. [Google Scholar] [CrossRef]
  7. Goulder, L.H.; Morgenstern, R.D.; Munnings, C.; Schreifels, J. China’s national carbon dioxide emission trading system: An introduction. Econ. Energy Environ. Policy 2017, 6, 1–18. [Google Scholar] [CrossRef]
  8. Šerešová, M.; Kočí, V. Proposal of Package-to-Product Indicator for Carbon Footprint Assessment with Focus on the Czech Republic. Sustainability 2020, 12, 3034. [Google Scholar] [CrossRef] [Green Version]
  9. Pizer, W.A.; Zhang, X. China’s New National Carbon Market. AEA Pap. Proc. 2018, 108, 463–467. [Google Scholar] [CrossRef]
  10. Valerie, J.K. China’s Emissions Trading System: History, Current Status and Prospects; Harvard Climate Pact Project: Cambridge, MA, USA, 2021. [Google Scholar]
  11. Zou, S.H.; Zhang, T. Correlation and Dynamic Volatility Spillover between Green Investing Market, Coal Market, and CO2 Emissions: Evidence from Shenzhen Carbon Market in China. Adv. Civ. Eng. 2022, 2022, 7523563. [Google Scholar] [CrossRef]
  12. Tan, X.P.; Sirichand, K.; Vivian, A.; Wang, X. How connected is the carbon market to energy and financial markets? A systematic analysis of spillovers and dynamics. Energy Econ. 2020, 90, 104870. [Google Scholar] [CrossRef]
  13. Zhou, A.H.; Xin, L.; Li, J. Assessing the impact of the carbon market on the improvement of China’s energy and carbon emission performance. Energy 2022, 258, 124789. [Google Scholar] [CrossRef]
  14. Liu, Y.; Yang, X.Q.; Wang, M. Global Transmission of Returns among Financial, Traditional Energy, Renewable Energy and Carbon Markets: New Evidence. Energies 2021, 14, 7286. [Google Scholar] [CrossRef]
  15. Meng, B.; Chen, S.Y.; Yang, M.; Kuang, H. Spillover effects between the carbon and linear shipping markets under COVID-19: A time-varying frequency-domain analysis with applications in portfolio management. Ocean. Coast. Manag. 2022, 229, 106351. [Google Scholar] [CrossRef]
  16. Yu, L.; Li, J.J.; Tang, L. Dynamic volatility spillover effect analysis between carbon market and crude oil market: A DCC-ICSS approach. Int. J. Glob. Energy Issues 2015, 38, 242–256. [Google Scholar] [CrossRef]
  17. Song, X.; Geng, Y.; Li, K.; Zhang, X.; Wu, F.; Pan, H.Y.; Zhang, Y.Q. Does environmental infrastructure investment contribute to emissions reduction? A case of China. Front. Energy 2020, 14, 57–70. [Google Scholar] [CrossRef]
  18. Tiwari, A.K.; Abakah, E.J.A.; Gabauer, D.; Dwumfour, R.A. Dynamic spillover effects among green bond, renewable energy stocks and carbon markets during COVID-19 pandemic: Implications for hedging and investments strategies. Glob. Financ. J. 2022, 51, 100692. [Google Scholar] [CrossRef]
  19. Ali, S.; Akter, S.; Ymeri, P.; Fogarassy, C. How the Use of Biomass for Green Energy and Waste Incineration Practice Will Affect GDP Growth in the Less Developed Countries of the EU (A Case Study with Visegrad and Balkan Countries). Energies 2022, 15, 2308. [Google Scholar] [CrossRef]
  20. Ali, S.; Akter, S.; Fogarassy, C. The Role of the Key Components of Renewable Energy (Combustible Renewables and Waste) in the Context of CO2 Emissions and Economic Growth of Selected Countries in Europe. Energies 2021, 14, 2034. [Google Scholar] [CrossRef]
  21. Xu, Y.Y. Risk spillover from energy market uncertainties to the Chinese carbon market. Pac. Basin Financ. J. 2021, 67, 101561. [Google Scholar] [CrossRef]
  22. Qiao, S.; Zhao, C.X.; Zhang, K.Q.; Ren, Z.Y. Research on Time-Varying Two-Way Spillover Effects Between Carbon and Energy Markets: Empirical Evidence From China. Front. Energy Res. 2021, 832. [Google Scholar] [CrossRef]
  23. Sun, X.; Li, H.H.; Xu, L.T. The Time-Varying Spillover Effects between China’s Carbon Markets and Energy Market: Evidence Using the TVP-DY Index Mode. Am. J. Ind. Bus. Manag. 2022, 12, 1105–1124. [Google Scholar] [CrossRef]
  24. Ma, Y.; Wang, L.; Zhang, T. Research on the dynamic linkage among the carbon emission trading, energy and capital markets. J. Clean. Prod. 2020, 272, 122717. [Google Scholar] [CrossRef]
  25. Yang, L. Idiosyncratic information spillover and connectedness network between the electricity and carbon markets in Europe. J. Commod. Mark. 2021, 25, 100185. [Google Scholar] [CrossRef]
  26. Yuan, N.N.; Yang, L. Asymmetric risk spillover between financial market uncertainty and the carbon market: A GAS–DCS–copula approach. J. Clean. Prod. 2020, 259, 120750. [Google Scholar] [CrossRef]
  27. Jin, J.; Han, L.Y.; Wu, L.; Zeng, H.C. The hedging effect of green bonds on carbon market risk. Int. Rev. Financ. Anal. 2020, 71, 101509. [Google Scholar] [CrossRef]
  28. Ren, X.F. The interrelationship between the carbon market and the green bonds market: Evidence from wavelet quantile-on-quantile method. Technol. Forecast. Soc. Change 2022, 179, 121611. [Google Scholar] [CrossRef]
  29. Fang, G.C.; He, Y.; Zhang, Y. Research on the driving mechanism and regional synergy path of carbon trading. Coal Econ. Res. 2020, 40, 37–46. [Google Scholar]
  30. Xu, Y.Y.; Salem, S. Explosive behaviors in Chinese carbon markets: Are there price bubbles in eight pilots? Renew. Sustain. Energy Rev. 2021, 145, 111089. [Google Scholar] [CrossRef]
  31. Wang, Z.H.; Hu, Y. Analysis of Influencing Factors of Carbon Emissions Trading Price in China. Ind. Technol. Econ. 2018, 37, 128–136. [Google Scholar]
  32. Li, Y.; Zheng, P.J. Research on the volatility characteristics of China’s carbon emission trading market returns. Sci. Technol. Manag. Land Resour. 2020, 37, 74–81. [Google Scholar]
  33. Fan, Y.; Mo, J.L. Major issues and suggestions on top-level design of China’s carbon market. Proc. Chin. Acad. Sci. 2015, 30, 492–502. [Google Scholar]
  34. Zhang, W. Emission reduction effect and carbon market efficiency of carbon emissions trading policy in China. Energy 2020, 196, 117117. [Google Scholar] [CrossRef]
  35. Zhu, B.; Huang, L.; Yuan, L.; Ye, S.; Wang, P. Exploring the risk spillover effects between carbon market and electricity market: A bidimensional empirical mode decomposition based conditional value at risk approach. Int. Rev. Econ. Financ. 2020, 67, 163–175. [Google Scholar] [CrossRef]
  36. Zhu, B.Z.; Zhou, X.X.; Liu, X.F.; Wang, H.F.; He, K.J.; Wang, P. Exploring the risk spillover effects among China’s pilot carbon markets: A regular vine copula-CoES approach. J. Clean. Prod. 2020, 242, 118455. [Google Scholar] [CrossRef]
  37. Pan, C.Y. A Linkage Framework for the China National Emission Trading System (CETS): Insight from Key Global Carbon Markets. Sustainability 2021, 13, 7459. [Google Scholar] [CrossRef]
  38. Deng, M.Z.; Zhang, W.X. Recognition and analysis of potential risks in China’s carbon emission trading markets. Adv. Clim. Change Res. 2019, 10, 30–46. [Google Scholar] [CrossRef]
  39. Chen, X.; Lin, B.Q. Towards carbon neutrality by implementing carbon emissions trading scheme: Policy evaluation in China. Energy Policy 2021, 157, 112510. [Google Scholar] [CrossRef]
  40. Yi, L. Evaluation on the effectiveness of China’s pilot carbon market policy. J. Clean. Prod. 2020, 246, 119039. [Google Scholar] [CrossRef]
  41. Guo, L.Y.; Feng, C. Are there spillovers among China’s pilots for carbon emission allowances trading? Energy Econ. 2021, 103, 105574. [Google Scholar] [CrossRef]
  42. Peng, W.Y.; Chen, S.Y. Analysis and forecast of carbon trading price in China’s carbon emission pilot market. Tech. Econ. 2020, 39, 102–110. [Google Scholar]
  43. Ji, C.-J.; Hu, Y.-J.; Tang, B.-J.; Qu, S. Price Drivers in the Carbon Emissions Trading Scheme: Evidence from Chinese Emissions Trading Scheme Pilots. J. Clean. Prod. 2021, 278, 123469. [Google Scholar] [CrossRef]
  44. Jiang, Y. Factors affecting the pilot trading market of carbon emissions in China. Pet. Sci. 2018, 15, 412–420. [Google Scholar] [CrossRef] [Green Version]
  45. Li, F.F.; Jiang, H.; Xu, Z.S. Characteristics of price fluctuations in carbon emission trading in pilot areas in China—Analysis based on GARCH family model and value-at-risk VAR. J. Jinling Inst. Sci. Technol. 2019, 33, 35–40. [Google Scholar]
  46. Chen, Y.Q. Efficiency of China’s carbon market: A case study of Hubei pilot market. Energy 2021, 222, 119946. [Google Scholar] [CrossRef]
  47. Fan, L.L.; Liu, L. Analysis of China’s carbon price yield fluctuation based on ARMA-GARCH model. Economics 2020, 25–32. [Google Scholar]
  48. Wang, Q.; Gao, C.Y. Research on the Spillover Effect of China’s Pilot Carbon Markets—Based on the Six-Element VAR-GARCH-BEKK Model and Social Network Analysis. J. Wuhan Univ. 2016, 69, 57–67. [Google Scholar]
  49. Zhao, L.L.; Wen, F.H.; Wang, X. Interaction among China carbon emission trading markets: Nonlinear Granger causality and time-varying effect. Energy Econ. 2020, 91, 104901. [Google Scholar] [CrossRef]
  50. Jiang, Y.H.; Liu, L.; Cheng, J. A study on the volatility spillover effect between China’s carbon markets from the perspective of time and frequency. Soft Sci. 2022, 1–18. [Google Scholar]
  51. Peng, H.F.; Ma, S.Q. Research on the dynamic spillover effect between China’s carbon trading markets. Account. Econ. Res. 2022, 36, 74–92. [Google Scholar]
  52. Doan, T.; Litterman, R.B.; Sims, C.A. Forecasting and conditional projection using realistic prior distributions. Econom. Rev. 1984, 3, 1–100. [Google Scholar] [CrossRef] [Green Version]
  53. Lin, H.; Lin, L.; Jia, B.; Zhu, Z.Q. Review and Prospect of Domestic Social Network Analysis Application Researc—Based on CiteSpaceIII Quantitative Analysis. J. Subtrop. Resour. Environ. 2018, 13, 85–94. [Google Scholar]
  54. Song, X.; Geng, Y.; Dong, H.; Chen, W. Social network analysis on industrial symbiosis: A case of Gujiao eco-industrial park. J. Clean. Prod. 2018, 193, 414–423. [Google Scholar] [CrossRef]
  55. Watson, D.; Krug, M.; Carbon, C. The relationship between citations and the linguistic traits of specific academic discourse communities identified by using social network analysis. Scientometrics 2022, 127, 1755–1781. [Google Scholar] [CrossRef]
  56. Wang, W.J.; Zhao, Y. Global carbon market research and enlightenment to China’s carbon market construction. Northeast. Asia Forum 2019, 28, 97–112. [Google Scholar]
  57. Zhou, X.; Wu, X.; Ding, P.; Li, X.; He, N.; Zhang, G.; Zhang, X. Research on Transformer Partial Discharge UHF Pattern Recognition Based on Cnn-lstm. Energies 2020, 13, 61. [Google Scholar] [CrossRef] [Green Version]
  58. Lv, J.Y.; Cao, M.; Zhang, J.S.; Fan, X.F. Research on the price volatility of China’s carbon emission rights market based on wavelet multi-resolution. Syst. Eng. Theory Pract. 2021, 41, 1699–1708. [Google Scholar]
  59. Kaifeng, L.; Chuanzhe, L. Construction of Carbon Finance System and Promotion of Environmental Finance Innovation in China. Energy Procedia 2011, 5, 1065–1072. [Google Scholar] [CrossRef]
Figure 1. Unit root test of VAR model stability.
Energies 16 00740 g001
Figure 2. Volatility spillover network of regional carbon trading markets. Note: The arrow line indicates the spillover relationship between markets, the arrow points indicate the direction of the spillover, and the thickness of the arrow line indicates the strength of the spillover effect. GD means Guangdong carbon trading market, BJ is Beijing carbon trading market, TJ is Tianjin carbon trading market, SH is Shanghai carbon trading market, HB is Hubei, SZ is Shenzhen carbon trading market.
Energies 16 00740 g002
Figure 3. The mechanism path diagram of carbon market spillover effects.
Energies 16 00740 g003
Table 1. Data sample collection table.
Carbon Market Abbreviation CodeOpening DaySample IntervalNumber of Samples
Shenzhen SZ19 June 20132 April 2014 to 29 October 20211827
BeijingBJ28 November 20132 April 2014 to 29 October 20211827
ShanghaiSH19 December 20132 April 2014 to 29 October 20211827
GuangdongGD19 December 20132 April 2014 to 29 October 20211827
TianjinTJ26 December 20132 April 2014 to 29 October 20211827
HubeiHB2 April 20142 April 2014 to 29 October 20211827
Data source: Statistical arrangement based on sample collection information.
Table 2. Descriptive statistics of carbon market returns and ADF test results.
VariableAverage ValueStandard DeviationSkewnessKurtosisJB ValueADF Test
rsz−0.12354131.369120.39724925.7336539369.34−31.31352 ***
rsh0.0012376.1086741.74629376.65056413634.9−45.38217 ***
rbj0.0052016.474637−0.5083369.1958622999.383−44.90281 ***
rgd−0.02746817.66717−0.46334545.03286134486.4−20.18001 ***
rtj−0.0179154.5955670.034742111.3978893985.5−47.51752 ***
rhb0.0277243.9097830.0797189.7038243421.214−36.47516 ***
Note: *** indicates that the variable significantly rejects the null hypothesis at the 1% confidence level.
Table 3. Granger causality test results between carbon market returns.
Market Variablesrszrshrbjrgdrtjrhb
rsz 1.01020.34701.9323 *2.8091 **3.5259 ***
rsh0.4634 1.03002.1775 *0.72030.3837
rbj0.88520.8097 1.09630.56331.0385
rgd0.91051.70581.2616 0.19420.3779
rtj0.17959.5647 ***2.1685 *1.1246 2.7937 **
rhb0.73021.23410.42524.0023 ***2.2786 **
Note: *, **, *** represent rejection of the null hypothesis “ R i is not a Granger cause of R j “ at 10%, 5%, and 1% confidence levels, respectively.
Table 4. GARCH-BEKK test results for six markets.
A rszrshrbjrgdrtjrhb
rsz0.2737 ***0.0015−0.0117 ***0.00790.0055 ***−0.0094 ***
rsh0.1589 ***0.4025 ***0.0994 ***−0.0020−0.0081−0.0309 ***
rbj0.1756 ***0.0436***0.2634 ***0.3939 ***−0.00150.0451 ***
rgd0.03180.00110.0439 ***0.6236 ***−0.00020.0064
rtj0.1997 ***0.3597 ***−0.01010.02990.4677 ***−0.0061
rhb0.03390.0291−0.1116 ***0.07810.00550.5987 ***
B rszrshrbjrgdrtjrhb
rsz0.9638 ***−0.0013−0.0037−0.0007−0.0015 ***0.0037 ***
rsh−0.2337 ***0.4696 ***−0.0444 ***−0.03760.0061−0.0132
rbj−0.0734−0.0595 ***−0.9227 ***0.3956 ***0.0288 ***0.0784 ***
rgd−0.0402 ***−0.00140.0578 ***0.7802 ***−0.0021 ***−0.0193 ***
rtj−0.0360 ***−0.0876 ***0.1740 ***−0.0550 ***0.9355 ***0.0048
rhb0.03540.03580.2755 ***0.8291 ***−0.0197 ***0.4114 ***
Note: Part A represents the ARCH effect spillover coefficient of the residual series between markets; B represents the GARCH effect spillover coefficient; the positive and negative signs represent positive spillovers and negative spillovers, respectively; the spillover coefficients of *** represent significant spillover effects between the two markets.
Table 5. Wald test results.
One-way spilloverShanghai→Shenzhen 70.5392 ***Tianjin→Shanghai 161.0404 ***
Shenzhen→Hubei
17.9050 ***
Hubei→Beijing 174.8486 ***
Two-way spillover
Shenzhen→Tianjin 46.4942 ***Tianjin→Shenzhen
13.4369 ***
Shenzhen ⇌Tianjin 58.64784 ***
Shanghai→Beijing 94.7533 ***Beijing→Shanghai
10.0796 ***
Shanghai ⇌Beijing 105.8683 ***
Beijing→Guangdong 477.125 ***Guangdong→Beijing 73.8282 ***Beijing ⇌Guangdong 516.3152 ***
Note: *** indicates that the null hypothesis is significantly rejected at the 1% confidence level.
Table 6. Fluctuation spillover intensity of regional carbon markets.
rszrshrbjrgdrtjrhb
rsz--0.0117-0.0070.0131
rsh0.3926-0.1438--0.0309
rbj0.17560.1031-0.78950.02880.1235
rgd0.0402-0.1017-0.00210.0193
rtj0.23570.44730.1740.055--
rhb--0.38710.82910.0197-
Data source: Calculated according to Table 4 and Equation (6).
Disclaimer/Publisher’s Note: The statements, opinions and data contained in all publications are solely those of the individual author(s) and contributor(s) and not of MDPI and/or the editor(s). MDPI and/or the editor(s) disclaim responsibility for any injury to people or property resulting from any ideas, methods, instructions or products referred to in the content.

