Article

A Study on Utilization of High-Ratio Biodiesel and Pure Biodiesel in Advanced Vehicle Technologies

1
Faculty of Mechanical and Aerospace Engineering, Institut Teknologi Bandung, Bandung 40132, Indonesia
2
Department of Mechanical Engineering, Pertamina University, Jakarta 12220, Indonesia
3
National Research and Innovation Agency, South Tangerang 15314, Indonesia
*
Authors to whom correspondence should be addressed.
Energies 2023, 16(2), 718; https://doi.org/10.3390/en16020718
Submission received: 3 December 2022 / Revised: 22 December 2022 / Accepted: 4 January 2023 / Published: 7 January 2023

Abstract

:
An experimental study was conducted to investigate the effect of high-ratio biodiesel and pure biodiesel on the emissions and performance of Euro4-compliant vehicles. The tested fuels were diesel fuel, biodiesel with a ratio of 30% by volume (B30), biodiesel with a ratio of 50% (B50) and pure biodiesel FAME (B100), while the tested vehicle is of the Euro4-compliant standard currently available in the Indonesian market. In this study, tests on emissions, performance and fuel economy were conducted based on the international standard of the UN ECE R83-05, adopted as UN ECE R-85 and UN ECE R-101 respectively. This study also investigated the effect of the carbon-to-hydrogen ratio on the carbon balance formula. Here, the paper proposed a modified R101 carbon balance formula to calculate the fuel economy for high-ratio and pure biodiesel fuels. The results showed that biodiesel had lower CO, HC and particulate emissions, while NOx emissions were higher compared to diesel fuel. However, pure biodiesel was within the limits imposed by the Euro4 emissions standard. Maximum power output with high-ratio biodiesel decreased by up to 10% with B100. The fuel economy of the B30, B50 and B100 biodiesels was lower than diesel fuel by 3%, 7% and 11%, respectively, based on the modified carbon balance formula for high-ratio biodiesel fuel.

1. Introduction

In a previous study, we reported the use of biodiesel fuel with a blend ratio of 20% by volume (B20) in laboratory and road tests. The results showed that the use of B20 could suppress CO, HC and particulate emissions while increasing slightly NOx emissions. The laboratory and the road tests also showed that B20 had similar power output and effect on engine components to market diesel fuels available in Indonesia [1]. The Indonesian government has committed to reducing greenhouse gas by 29% unconditionally by 2030 [2]. One of the strategies to achieve this reduction goal is promoting biofuel in the transportation sector. Since 2020, Indonesia has implemented mandatory limits for the upper ratio of biodiesel at 30% blended ratio by volume (B30). This ratio will be increased to 35% and 40% within one and two years, respectively. The Indonesian government has provided tax incentives for the use of engines fueled with high-ratio or pure biofuel to encourage engine manufacturers to produce flexible-fuel biofuel engines. Hongbo Du et.al reported that biodiesel could promote a decrease in greenhouse gas (GHG) emissions. They reported that the use of B20 in a 50% diesel vehicle in the Greater Houston Area could reduce daily GHG by 712.1 CO2 equivalent tons [3].
The use of high-ratio biodiesel and pure biodiesel has been conducted by many researchers. L.G. Anderson et.al studied the effect of high-ratio biodiesel fuel from B10 up to B100 on various types of vehicles including both light- and heavy-duty. They showed that biodiesel could decrease emissions of various vehicle types to a degree that varied with the blend ratio [4]. Robert L. McCormick et.al similarly reported that biodiesel could reduce emissions of CO, HC and particulate matter significantly. Moreover, they also reported that NOx emissions could also be suppressed to a similar degree with diesel fuel by adding a certain amount of 2-ethyl hexyl nitrate into biodiesel fuel [5]. A.T Hoang, et al., reported that the utilization of a nanoparticle additive in biodiesel could promote better spray and atomization as well as enhance the combustion process to achieve low exhaust gas emissions and higher thermal efficiency [6]. The use of a high ratio of biodiesel fuel and pure biodiesel could lead to a deterioration in fuel economy and performance due to its higher viscosity [7,8,9]. However, appropriate fuel injection pressure and fuel control strategy could improve B100 penetration, atomization and combustion duration resulting in better performance and fuel consumption of B100 [8,9]. Tongchit S, et.al also reported that the use of B100 in small diesel engines could have a similar operational result to ordinary diesel fuel for real applications without sacrificing reliability and durability as long as a high grade of oil and oil filter were utilized and maintained properly [10].
A number of papers have studied the characteristics of emissions, performance and combustion of high-ratio biodiesel fuel and pure diesel fuel. The performance and emissions characteristics of biodiesel engines are mainly determined by engine type and its settings, engine emissions control technologies, testing methodology and biodiesel resources [1,3,4,5,6,7,8,9,10,11,12,13,14,15,16,17,18,19,20,21,22]. However, there is a lack of studies investigating the impact of high-ratio biodiesel blends fuel and pure biodiesel (B100) on the performance and emissions of advanced vehicle technologies. Therefore, a study of the utilization of high-ratio biodiesel fuel on Euro4 vehicle technology is required to support the implementation of mandatory B35 or B40 biodiesels in 2023, the use of flexible-fuel vehicles with biofuel, and the implementation of 2022 Euro4 emission standards in Indonesia. The objective of this study is to further investigate the impact of high-ratio biodiesel and pure biodiesel on the emissions and performance of a Euro4-compliant vehicle without any engine adjustment by using international standards under UN-ECE. In addition, this paper also provides a study on the effect of the carbon-to-hydrogen ratio of high-ratio biodiesel and pure biodiesel on the carbon balance formula for calculating fuel economy. Here, a proposed modified carbon balance formula for biodiesel is also introduced based on the biodiesel ratio.

2. Materials and Methods

2.1. Tested Fuel

This study used four different fuels, diesel fuel—as a reference—biodiesel with a volume ratio of 30% (B30), biodiesel with a volume ratio of 50% (B50) and pure biodiesel (B100). Table 1 lists the properties of the diesel fuel (B0) and the pure FAME biodiesel (B100). The properties of B30 and B50 were calculated based on the results acquired for B0 and B100.
The diesel fuel (B0) used here was an imported fuel and conformed to the Euro4 standard. The biodiesel used was a FAME fuel available in the Indonesian market produced from palm oil by the esterification process known as Fatty Acid Methyl Ester (FAME) with a monoglyceride content of below 0.4%. Properties were determined by tests conducted at the Lemigas Laboratory in Indonesia. B100 showed higher cetane number, density, viscosity, distillation points and flash than B0. Moreover, B100 also had better lubricity properties than B0, as shown in Table 1. The measurement of lower heating value and density for all fuels was conducted to act as a reference for evaluating power output and calculating fuel economy using the carbon balance method. The result is shown in Table 2. The density increased as the biodiesel ratio increased, while the heating value showed the opposite effect.

2.2. Tested Vehicle

The vehicle used in the tests complied with Euro4 emission standards with the original setting from the manufacturer for diesel fuel. The tested vehicle was the market-leading light-duty passenger vehicle in Indonesia. The specification of the engine for this vehicle is shown in Table 3.

2.3. Testing Equipment and Cycle

Experiments were carried out at the laboratory for thermodynamics, engine and propulsion technology—National Research and Innovation Agency of Indonesia (LTMP-BRIN). Figure 1 illustrates the vehicle test system laboratory for measuring emissions, fuel economy and power at LTMP-BRIN. An AVL chassis dynamometer was used to simulate the road load of the tested vehicle for both emissions and fuel economy testing. Road simulation was carried out using a 4WD chassis dynamometer that simulated road load based on a coefficient as stated in the R83 regulation. Exhaust gas from the tested vehicle was diluted continuously with controlled air through an AVL constant volume sampling system and PSS i60 full-flow particulate sampling system. An AVL i60 advance emissions analyzer was utilized to analyze the exhaust gases from the tested vehicle including a Chemiluminescent detector CLD i60, non-dispersive infrared i60 NDIR and heated flame ionization detector FID i60 for measuring nitrogen oxide, carbon monoxide and hydrocarbons, respectively.
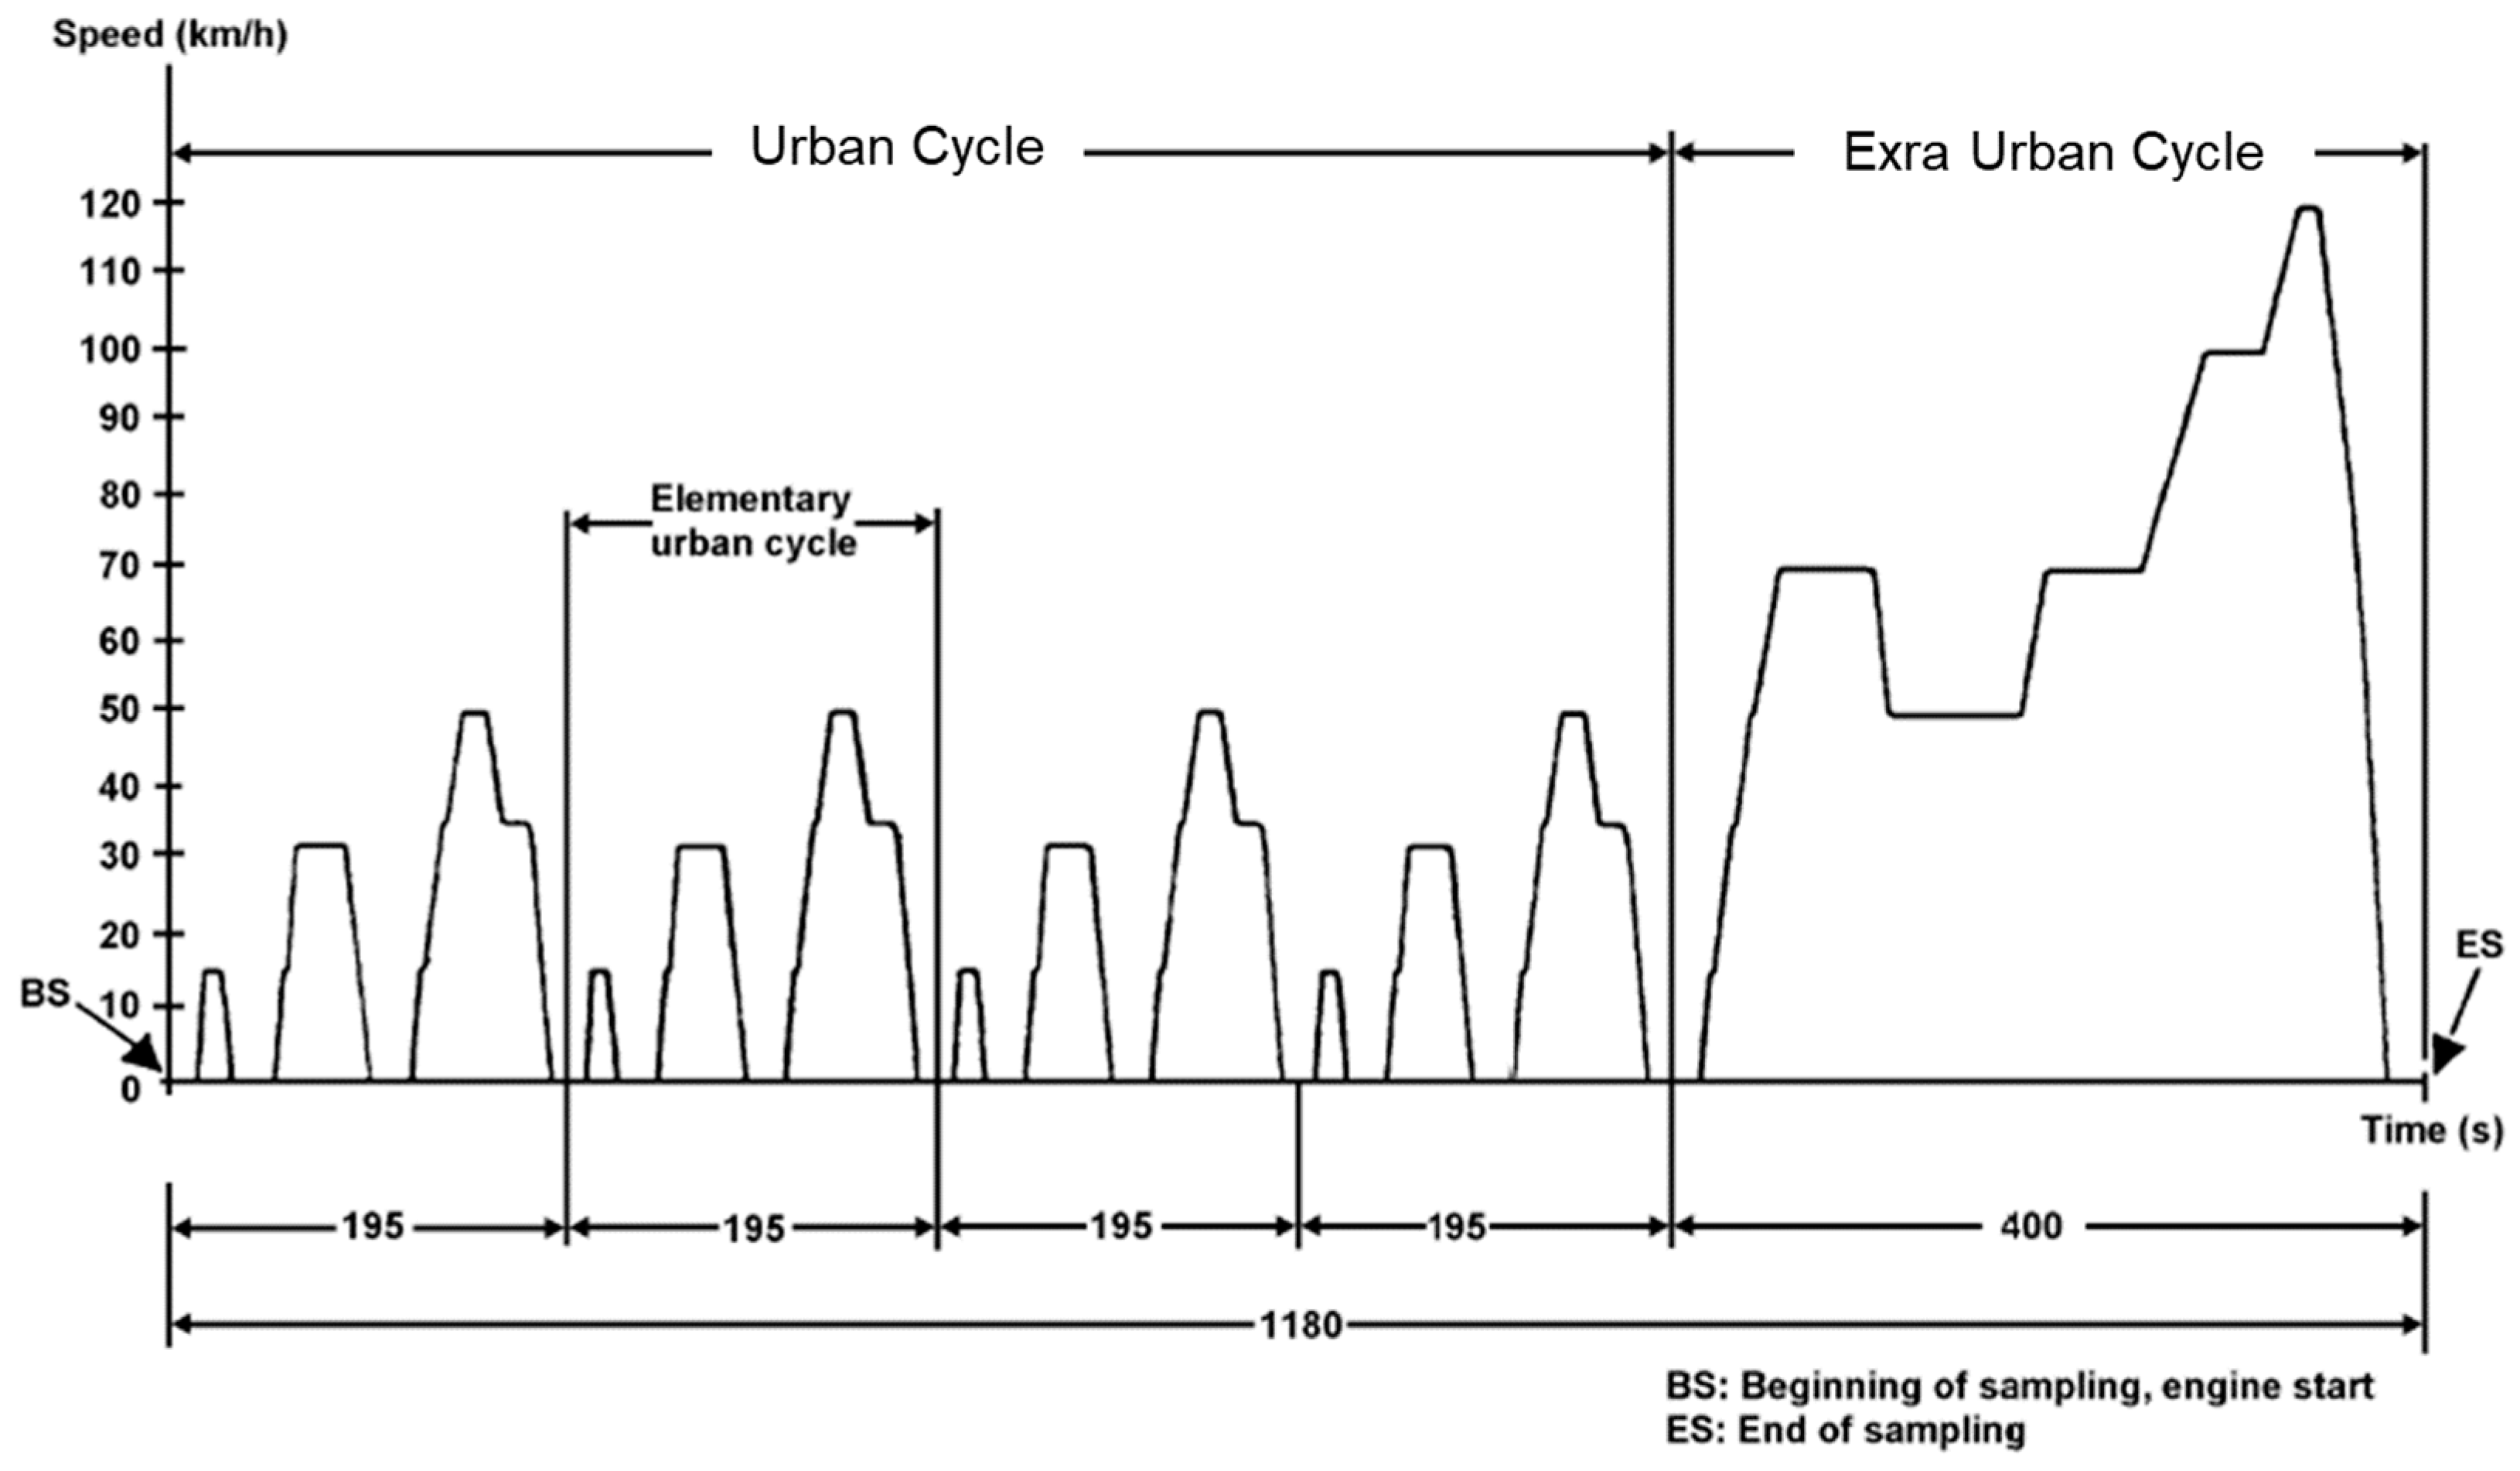
The R83-05 emission standard and R101 fuel economy standard were used to investigate the effect of various fuels on emissions and fuel economy, while the New European Driving Cycle (NEDC) was used as the standard test cycle. In this experiment, emissions and fuel economy tests were conducted once for each tested fuel with a measurement deviation of 2%. Figure 2 shows the NEDC test cycle, which consists of urban and extra-urban cycles with a total duration of 1180 s.

3. Results and Discussion

An evaluation of exhaust gas emissions, performance and fuel economy was conducted on a Euro4-compliant vehicle fueled by diesel fuel, B30, B50 and B100 at the Laboratory of Thermodynamics, Engine and Propulsion Technology (LTMP-BRIN). Here, the vehicle setup was that set by the manufacturer without any modification or engine resetting before the addition of the B30, B50 and B100 fuels. The results are discussed in the following section.

3.1. Emissions Test Result

Emissions test results for the urban and extra-urban cycles are shown in Figure 3. Carbon monoxide (CO) emissions for biodiesel were lower than those for diesel fuel in the urban cycle, while they were comparable for the extra-urban cycle. The urban cycle covered cold start, low engine speed and many acceleration and deceleration events, and was considered to emit higher CO emissions than the extra-urban cycle with fewer acceleration and deceleration events and normal engine conditions both for the vehicle fueled with diesel fuel and that fueled with biodiesel. It might be expected that lower CO emissions would be observed with B30, B50 and B100 due to their oxygen content, which promotes a better mixing process, leading to complete combustion [5,10]. In addition, biodiesel also had a higher cetane number than diesel fuel, giving it a shorter ignition delay, which promotes better combustion efficiency, which would, in turn, lead to lower CO emissions. However, in these tests, the increase in oxygen content of the biodiesel did not lead to any difference in CO emissions, as shown in Figure 3a. Moreover, the highest CO emissions for the urban and extra-urban cycles were seen with B50 and B100, respectively. In this study, the tested vehicle had a diesel oxidation catalyst (DOC) installed on the tailpipe to suppress CO and HC emissions. Therefore, the lower CO emissions were due in part to the significant role of the DOC. Biodiesel fuel with high oxygen content combined with DOC should have low CO emissions, but this could lead to a lower ignition temperature as the biodiesel ratio increases, which might lead to a decrease in the CO conversion efficiency of the DOC. A lower ignition temperature, which indicates the capability of DOC to convert CO emissions by the oxidation process, was due to a decrease in the catalyst load with the increase in oxygen in the biodiesel [19]. This may also explain the lower CO emissions with B30 compared to B50 and B100 as well as the diesel fuel for the extra-urban cycle. Here, the higher CO emissions for B50 during the urban cycle require further investigation to clarify the trends shown in Figure 3a.
Hydrocarbon emissions from diesel engines could be considered to be due to flame extinction in the cold region of the chamber, resulting in locally lean and rich regions. HC formation is influenced by fuel characteristics such as oxygen content, volatility, viscosity, and cetane number [11,13,14].
HC emissions of B30 and B100 were lower than those of the diesel fuel for both the urban and extra-urban cycles, while B50 HC emissions were comparable with those of the diesel fuel, as shown in Figure 3b. B30 had the lowest HC emissions for the urban cycle among the biodiesel fuels, which might be due to the smaller droplet size of B30 compared to B50 and B100. Droplet size can influence the evaporation of fuel during combustion influencing combustion speed [8]. A smaller droplet size would promote faster combustion, therefore, the smallest droplet size of B30 would result in a higher burn rate during premixed combustion, resulting in lower HC emissions compared to those of B50 and B100. Further, biodiesel with high oxygen content would also promote exothermic reactions during premixed combustion in addition to its shorter ignition delay due to high cetane number; therefore, combustion with biodiesel had low HC emissions. Here, the lower HC emissions of B100 compared to B50 might be due to a higher oxygen content that compensates for the bigger droplet size of B100 compared to B50 for both the urban and extra-urban cycles. In general, HC emissions for both diesel fuel and biodiesel were very low for both the urban and extra-urban cycles due to the effectiveness of the DOC in suppressing HC emissions at the tailpipe. The urban cycle has higher HC emissions due to worse engine operation conditions, which led to a lower conversion by the DOC compared to the extra-urban cycle [15,19]. In addition, the ignition temperature of the DOC was influenced by the oxygen content of the biodiesel, which also influenced HC emissions [19].
Figure 3c showed that NOx emissions for the urban cycle increased as the ratio of biodiesel increased, B100 emitted the highest NOx emissions at around 58% higher than diesel fuel. The increase in NOx emissions for B100 for the extra-urban cycle was also 56% higher than diesel fuel. This result is similar to that of the study of Pablo Fernandez Y., et al., which reported that pure biodiesel fuel had the highest NOx level compared with diesel fuel and hydrogenated paraffinic fuels [23]. Nevertheless, the B30 and B50 biodiesel blends had increasing emissions for the urban cycle with increasing biodiesel ratio, However, these blends had lower NOx emissions for the extra-urban cycle. An increase in the biodiesel blend ratio also had no significant effect on NOx emissions for the extra-urban cycle. The higher emissions of NOx with biodiesel could be considered to be due to the higher cetane number and oxygen content, which promote complete combustion and higher combustion temperature, resulting in an increase in thermal NOx formation [10,11,12]. For the urban cycle, high cetane number and oxygen content play an important role in NOx formation such that an increase in the ratio of biodiesel led to an increase in NOx emissions. However, comparable results for NOx emissions for diesel fuel, B30 and B50 for both the urban and extra-urban cycles might be due to the increase in gas flow motion in the cylinder as the speed rises during the extra-urban cycle, which causes a faster mixing and shorter ignition delay, leading to a reduction in in-cylinder temperature [7]. Moreover, exhaust gas recirculation (EGR) could also lead to significant NOx reduction during the extra-urban cycle as the ignition could be retarded, which results in a lower adiabatic flame temperature [24].
Particulate Matter (PM) emissions with biodiesel were lower than with diesel fuel. Moreover, PM emissions were significantly decreased as the biodiesel ratio increased for both the urban and extra-urban cycles, as shown in Figure 3d. For the urban cycle, B30, B50 and B100 showed 35%, 53% and 83% lower PM emissions than diesel fuel, respectively, while for the extra-urban cycle, the reduction was 26%, 37% and 78%, respectively. This significant reduction in PM with biodiesel could be considered to be due to the high cetane number of biodiesel resulting in a shorter ignition delay decreasing the duration of diffusive combustion. In addition, the oxygen content of biodiesel could oxidize hydrocarbon products during combustion, leading to complete combustion [11,12,14,25]. Therefore, as the ratio of biodiesel increased, which increased the oxygen content and cetane number, the PM emission for both the urban and extra-urban cycles decreased. Here, the higher temperature combustion during the extra-urban cycle could lead to more particulate oxidation than during the urban cycle. Moreover, the cold engine temperature condition at the start of the urban cycle with many acceleration operations would result in higher PM emissions for the urban cycle [5].
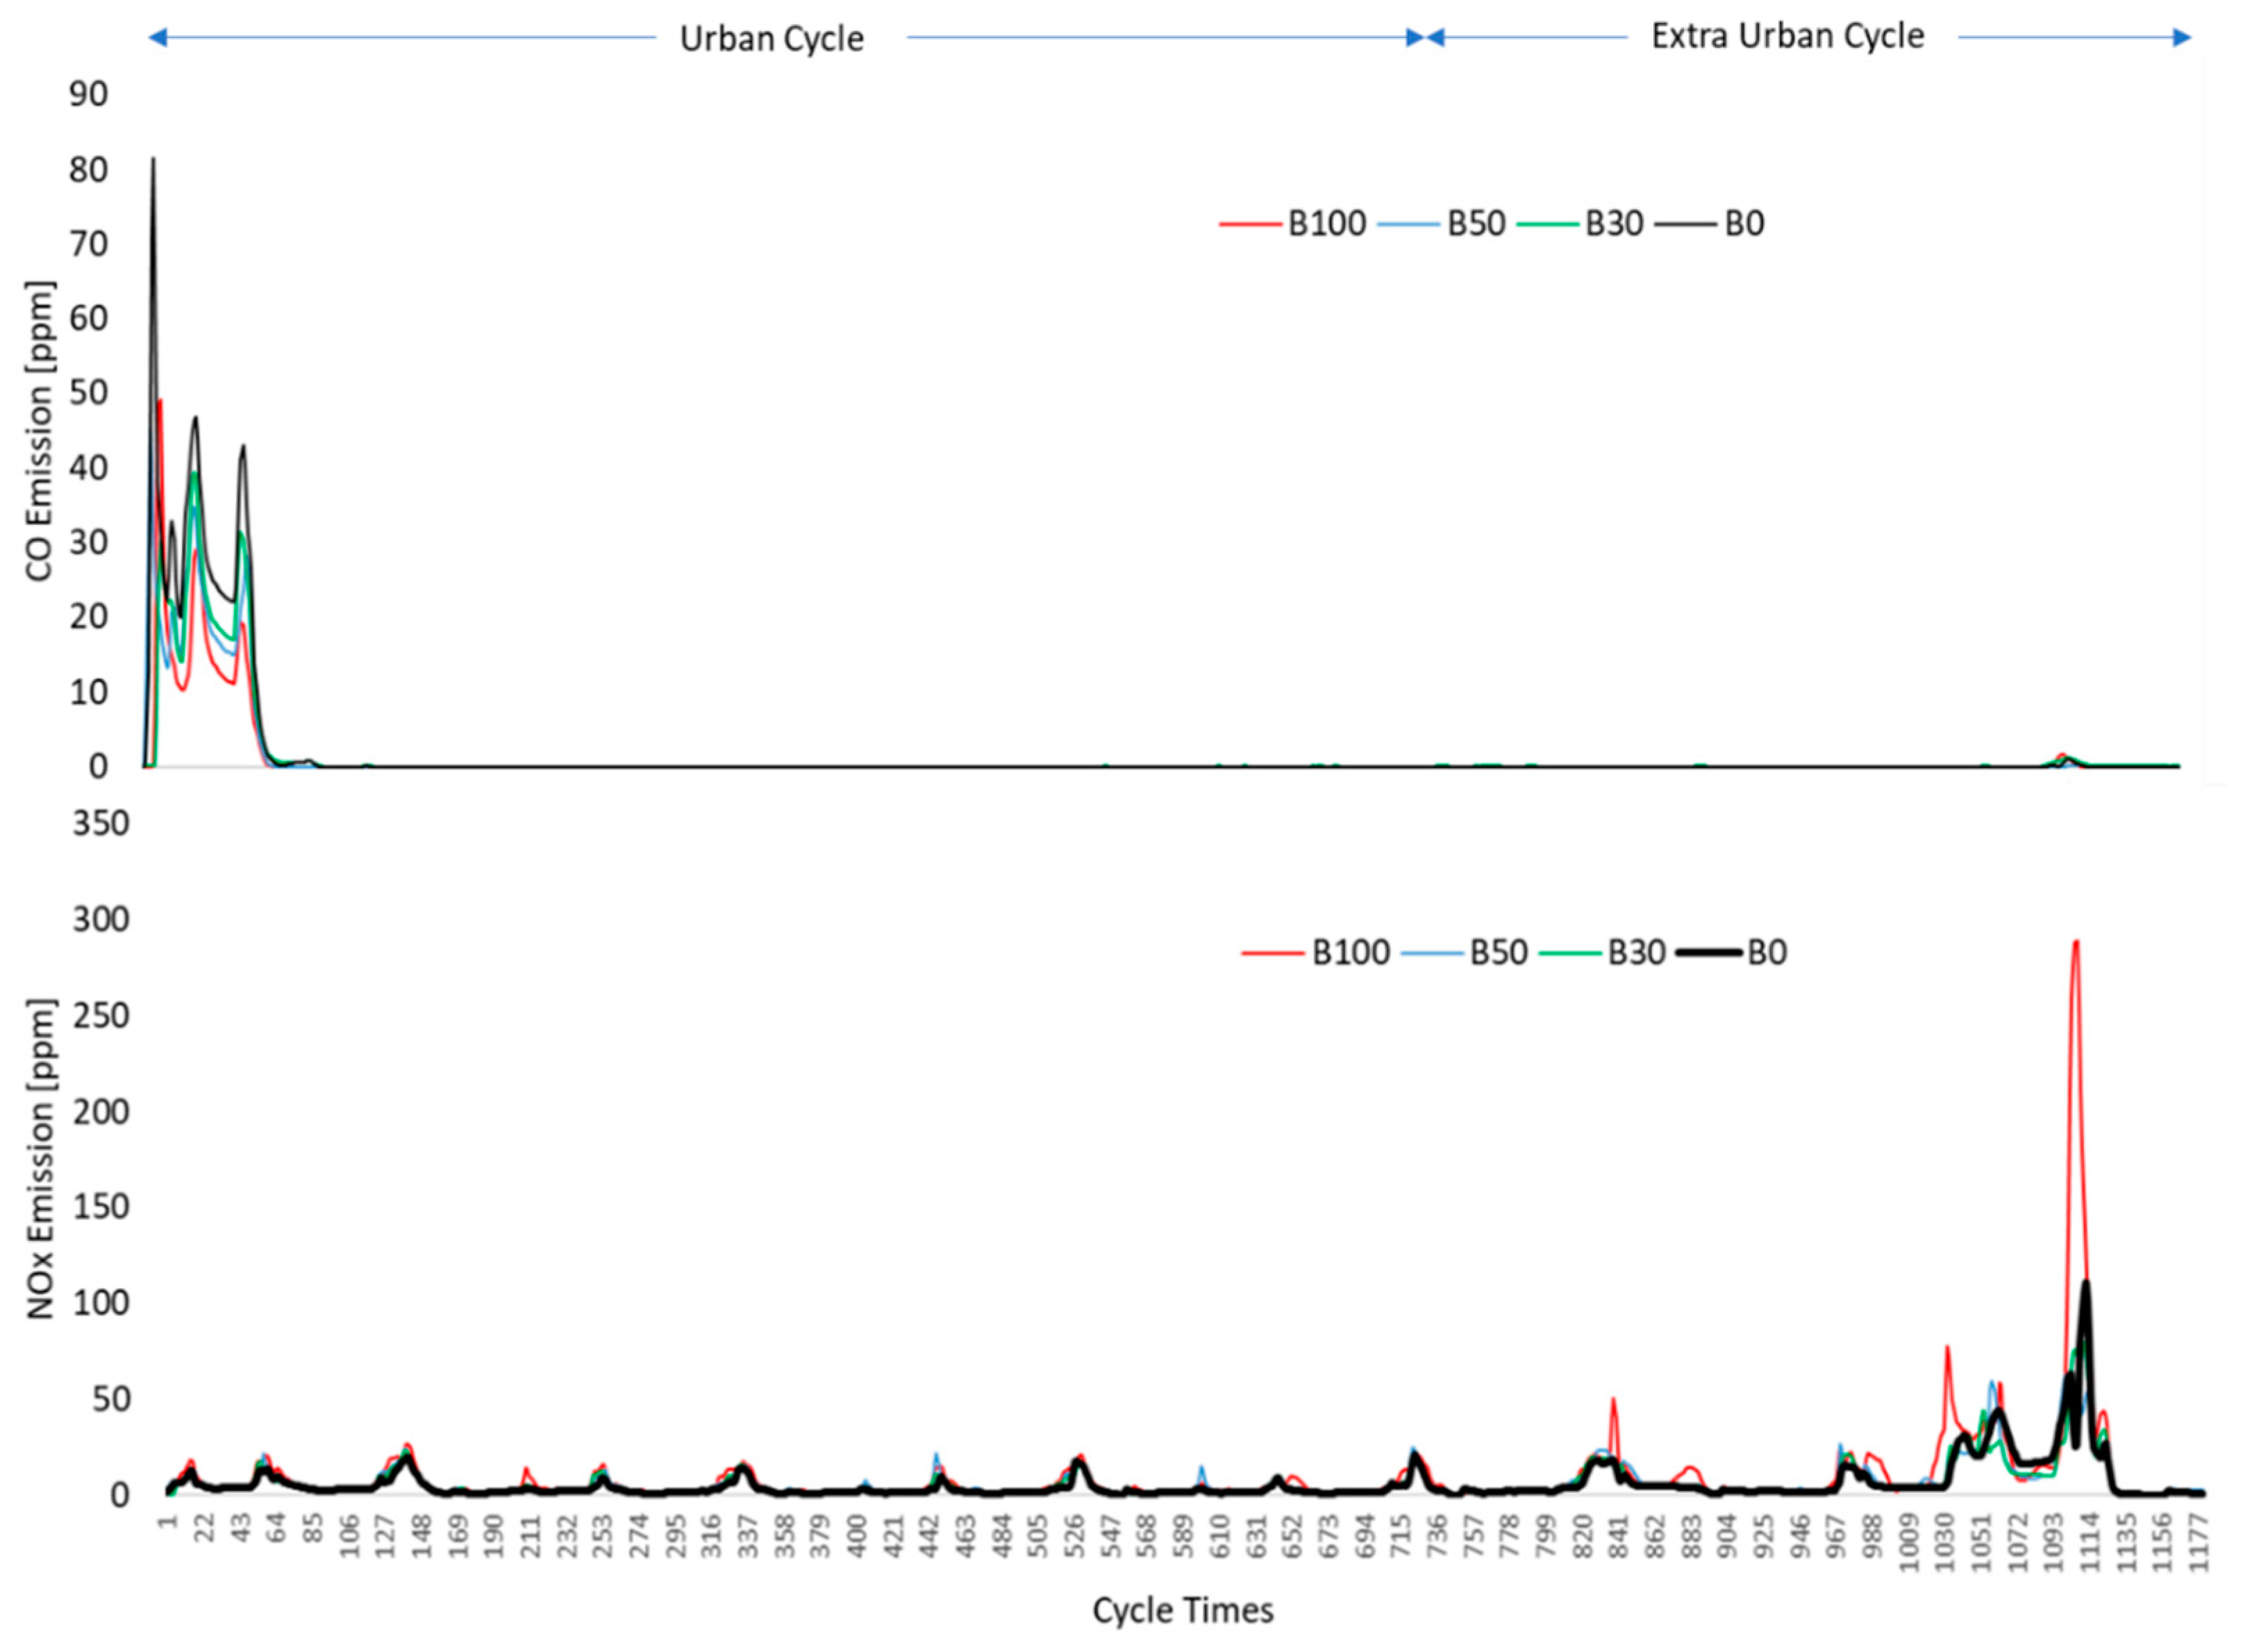
Figure 4 shows the CO and NOx emission transients during the urban and extra-urban driving cycles for vehicles fueled with diesel fuel (B0), B30, B50 and B100. CO emissions were high at the beginning of the urban cycle for all fuels due to its cold engine operation condition. Here, CO emissions at the beginning of the cycle could be suppressed as the biodiesel ratio increased due to the oxygen content of biodiesel [3,4,5,6,7,8,9,10,11]. CO emissions during the rest of the cycle were near zero except at the maximum vehicle speed of the extra-urban cycle, which reached 120 km/h, but were still low due to the DOC having reached its optimum ignition temperature [19]. Transient NOx emissions were lower for the whole urban cycle and the peak of NOx emissions was reached at the cruising speed of 32 km/h. Higher NOx emissions were released during the extra-urban cycle as vehicle speed was very much higher than during the urban cycle. The maximum NOx emissions were at the end of the extra-urban cycle, during which the vehicle accelerate from 80 km/h to 120 km/h and remained at 120 km/h for 20 s. These conditions accelerated NOx formation due to high combustion temperature, especially for B100 with its high cetane number and oxygen content. Figure 5 shows the results of the emission tests of the diesel fuel, B30, B50 and B100 compared to the emission limits set by Euro4. In this study, all fuels could satisfy the limits set by Euro4. CO and HC were not an issue for either the diesel fuel or biodiesel, while PM emissions were near the limit for diesel fuel and NOx was an issue for B100, although still within the limits imposed by Euro4, as shown in Figure 5. This trend was also reported by other studies, which report that there is a significant increase in NOx with an increase in biodiesel ratio but an increase in biodiesel ratio also significantly reduced PM emissions [3,4,5,6,7,8,9].

3.2. Power and Torque

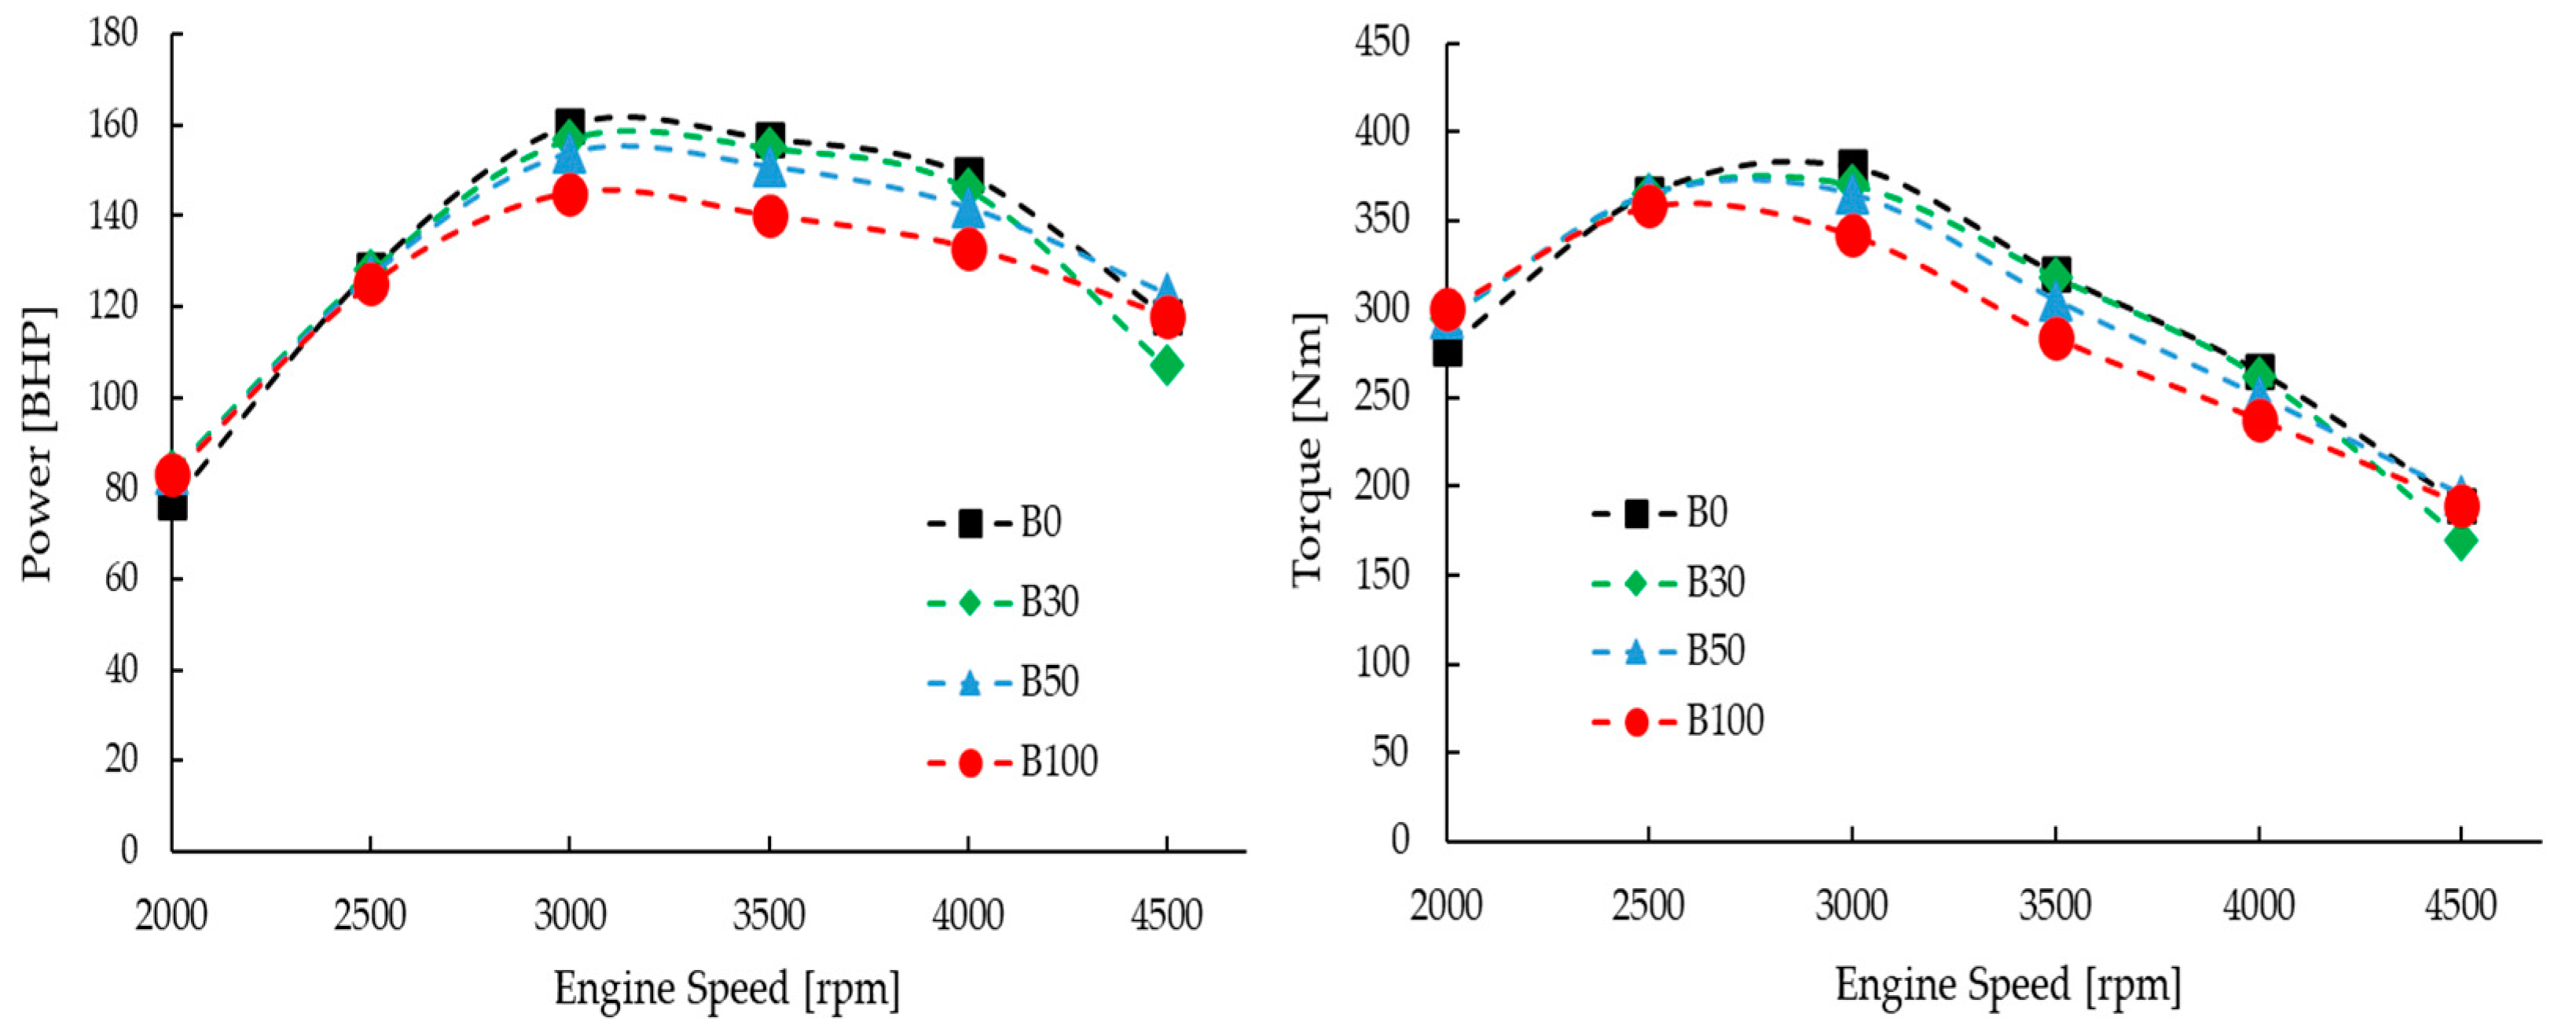
Power and Torque measurement was conducted on a chassis dynamometer at a gear ratio of 1:1. Acceleration time and speed were recorded during power testing. The vehicle was accelerated from a certain speed to the maximum speed with a cooling fan to avoid overheating. The angular acceleration and angular velocity of the drum were measured and recorded during the acceleration test. Then, the vehicle torque was calculated from the angular acceleration results considering the inertia of the chassis dyno drum. Similarly, the engine speed was calculated from the angular velocity results. Finally, the engine power output is calculated from the torque and engine speed. Here, measurements were conducted three times consecutively while considering engine temperature. The use of a chassis dynamometer to measure performance can be considered to be an alternative method to evaluate the effect of a fuel on engine tuning, although it cannot be a standardized test. However, some possibility of errors must be eliminated to achieve good repeatability during engine tuning [26]. A lower heating value was measured for each tested fuel as shown in Table 2. This fuel property is important as it could affect power output and torque [12,27]. The heating values of B30, B50 and B100 were 4%, 6% and 12% lower than that of the diesel fuel, respectively. Figure 6 shows the power output and torque for vehicles fueled with diesel fuel, B30, B50 and B100 at various engine speeds. The power output of biodiesel at any ratio was comparable with diesel fuel at engine speeds up to 2500 rpm. However, differences in power output could be observed between biodiesel and diesel fuel as the engine speed increased, as shown in Figure 6. Here, the power difference became higher as the biodiesel ratio increased. At an engine speed of 3000 rpm, which represented maximum power output, the power output with B30, B50 and B100 was 2%, 5% and 10% lower than with diesel fuel, respectively.
the power reduction with biodiesel could be considered due to the lower heating value of biodiesel compared with diesel fuel [12,27]. However, the power reduction percentage was lower than the reduction in heating value. Here, an improvement in thermal efficiency could be considered to influence the suppression of power reduction with biodiesel, especially at a 30% biodiesel ratio [12]. The torque characteristics of the diesel fuel and biodiesel fuels were similar to the trend in power output but the maximum torque reduction was smaller than that of the power reduction. Furthermore, the maximum torque reduction with B30, B50 and B100 compared to diesel fuel was 3%, 4% and 10 %, respectively. The lower torque with biodiesel also could be considered to be due to its lower heating value, as shown in Table 2.

3.3. Fuel Economy

Fuel economy (FE) was determined by using the carbon balance method based on the results of emission tests conducted by a constant volume sampling method. FE was calculated by using Equation (1), which refers to UN-ECE R101.
FE = 100 × D 0.1155 × [ (   0.866 × m   HC ) + ( 0.429 × m   CO ) + ( 0.273 × m   CO 2 ) ]  
where,
  • FE: Fuel Economy in km/liter
  • D: Tested Fuel Density in gr/cm3
  • mHC: Measured HC emissions in gr/km
  • mCO: Measured CO emissions in gr/km
  • mCO2: Measured CO2 emissions in gr/km
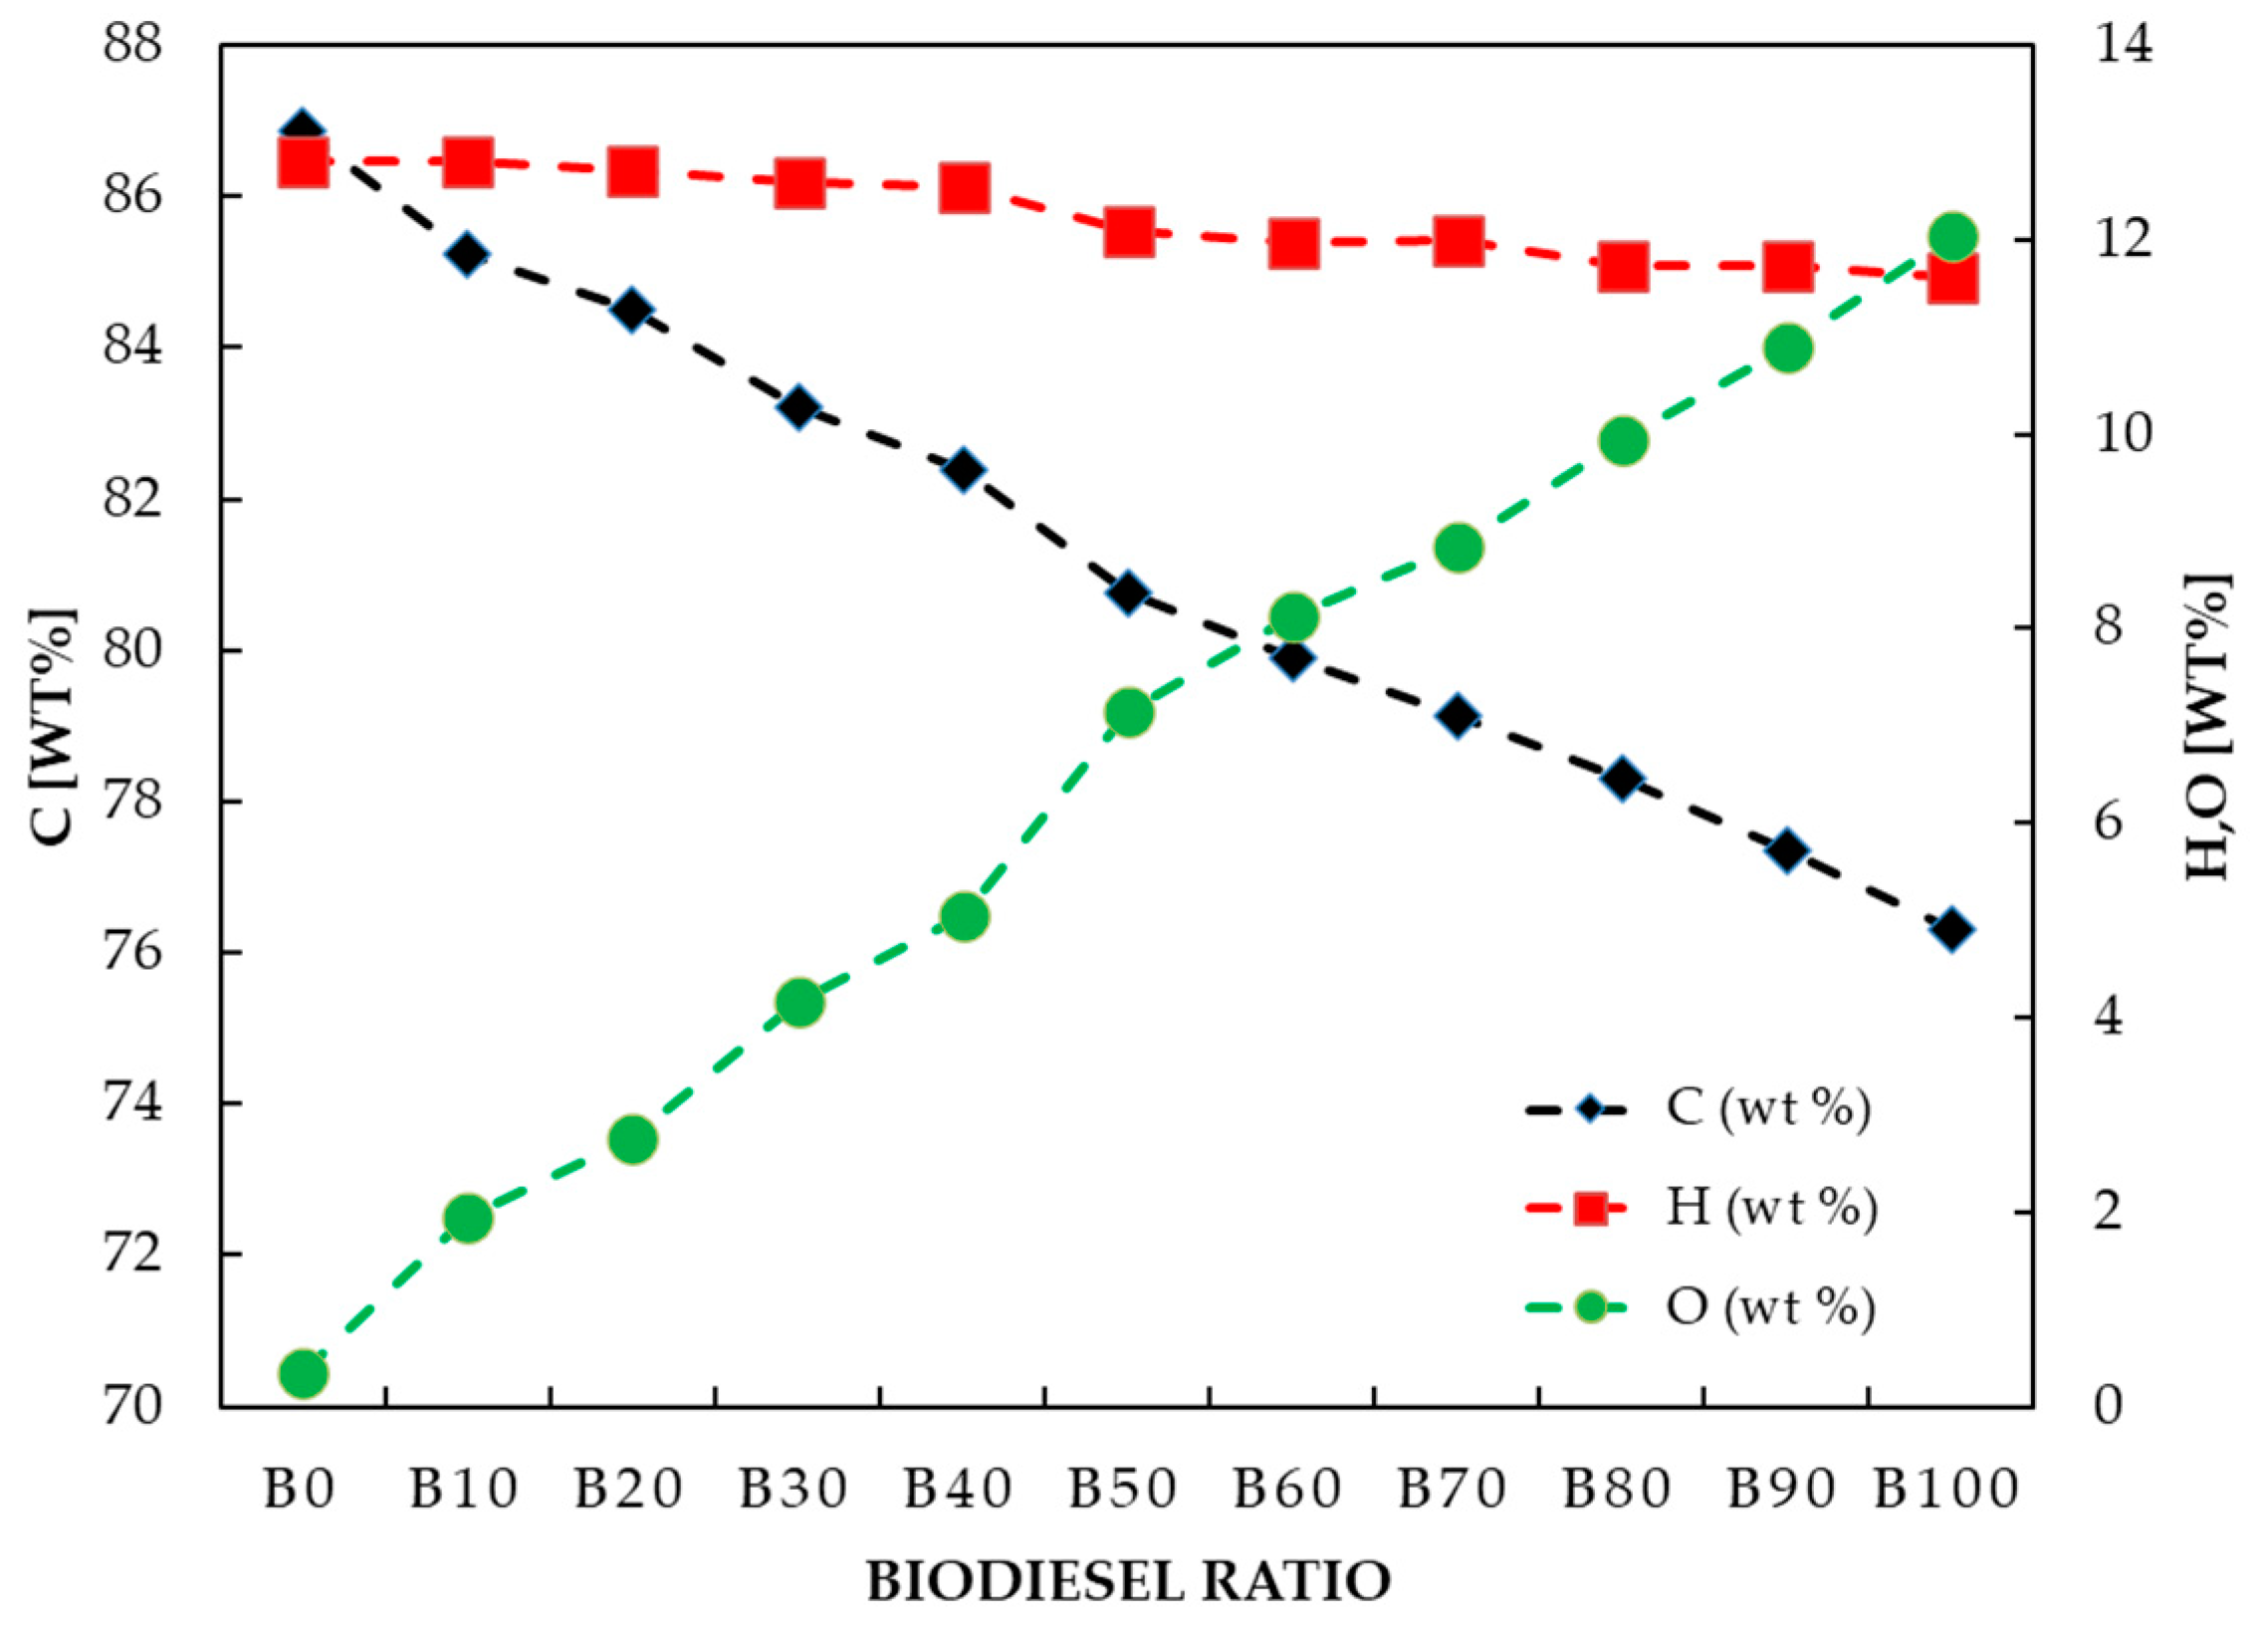
However, Tatsuki Kumagai reported that several causes could become sources of error in the calculation of fuel economy using carbon balance. Sources of error can arise due to input fluctuation, which consists of fuel difference, vehicle pre-conditioning, driving and control repeatability, and measuring instruments, including CVS flow accuracy, background level, zero/span gas accuracy, dilution ratio setting, etc. [28]. In this study, fuel difference would be investigated to study the effect of biodiesel ratio on the accuracy of the calculation of FE. Elemental fuel component analysis was conducted by using the elemental analysis LECO CHN628 series. Figure 7 shows the measurement result for elemental analysis for various biodiesel ratios, represented by the hydrogen-to-carbon (H/C) and oxygen-to-carbon (O/C) ratios.
Figure 7 shows that both the H/C ratio and O/C ratio increase with increasing biodiesel ratio. A difference in the H/C ratio would influence the carbon balance formula while the higher O/C ratio with biodiesel fuels shows their tendency for better combustion due to their oxygen content. The H/C ratio for diesel fuel (B0) in UN-ECE R101 is fixed at 1.86, while the measurement result for the tested B0 is 1.77. Therefore, the formula carbon balance was recalculated for all fuels based on the result of the elemental analysis to ensure a more accurate result. The modified carbon balance was obtained from the calculation of HC, CO and CO2 mass fraction in Formulas (2)–(4), respectively.
The hydrocarbon mass fraction (M HC) is calculated as follows:
M   HC = Mr   C ( n   C n   C × Mr   C ) + ( n   H n   C × Mr   H ) + ( n   O n   C × Mr   O )
where, nC, nH and nO are the mol of carbon, hydrogen and oxygen. Mr C, Mr H and Mr O are the atomic weight of carbon, hydrogen and oxygen.
For example, the hydrocarbon mass fraction for B30 by using Equation (2) is:
M   HC   ( B 30 ) = 12.01 ( 1 × 12.01 ) + ( 1.81 × 1.008 ) + ( 0.04 × 16 ) = 0.831
Then, the CO and CO2 mass fraction (M CO and M CO2) are calculated with Equations (3) and (4).
M   CO = Mr   C Mr   C + Mr   O
M   CO 2 = Mr   C Mr   C + ( 2 × Mr   O )
Finally, the modified carbon balance for B0, B30, B50 and B100 were obtained from Equations (2)–(4) as shown in Formulas (5)–(8) respectively.
The modified equation for diesel fuel (B0):
FE = 100 × D 0.1159 × [ (   0.863 × m   HC ) + ( 0.429 × m   CO ) + ( 0.273 × m   CO 2 ) ]
The modified equation for B30:
FE = 100 × D 0.1203 × [ (   0.831 × m   HC ) + ( 0.429 × m   CO ) + ( 0.273 × m   CO 2 ) ]
The modified equation for B50:
FE = 100 × D 0.1240 × [ (   0.806 × m   HC ) + ( 0.429 × m   CO ) + ( 0.273 × m   CO 2 ) ]
The modified equation for B100:
FE = 100 × D 0.1312 × [ (   0.762 × m   HC ) + ( 0.429 × m   CO ) + ( 0.273 × m   CO 2 ) ]
FE measurement was also conducted by the weighing method to study the deviation from the original R101 for the application of biodiesel fuel and its blends. Here, fuel inlet and fuel return from common rail systems were connected to a special reservoir instead of the vehicle fuel tank. The reservoir was put on the calibrated mass balance with a mass accuracy of 0.5%. The difference between the mass of fuel before and after the test was considered as the mass of fuel consumed. Then, FE was calculated from the distance traveled in an R101 cycle multiplied by fuel density divided by the mass of fuel consumed. Table 4 shows the comparison of the FE results for all fuels from R101 (Equation (1)), the modified carbon balance formula represented by Formula (2)–(5) and the weighing method. FE using the original carbon balance method in Equation (1) has a bigger difference compared with the modified carbon balance equation as the biodiesel ratio increases, as shown in Table 4. Moreover, the difference is more than 10% with B100. The same trend was also shown for the original R101 formula and weighing method comparison, with a difference of around 14.04% for B100. Table 4 also shows that the modified carbon balance had a comparable result to the weighing method, especially at biodiesel ratios of up to 50% (B50), where the difference was below 2%, while the difference was 2.65% for B100.
R101 and modified R101 did not show any significant difference with B0, with a percentage below 0.5%. However, an equation of R101 for both pure biodiesel (B100) and blended biodiesels should consider elemental content to achieve fewer errors.
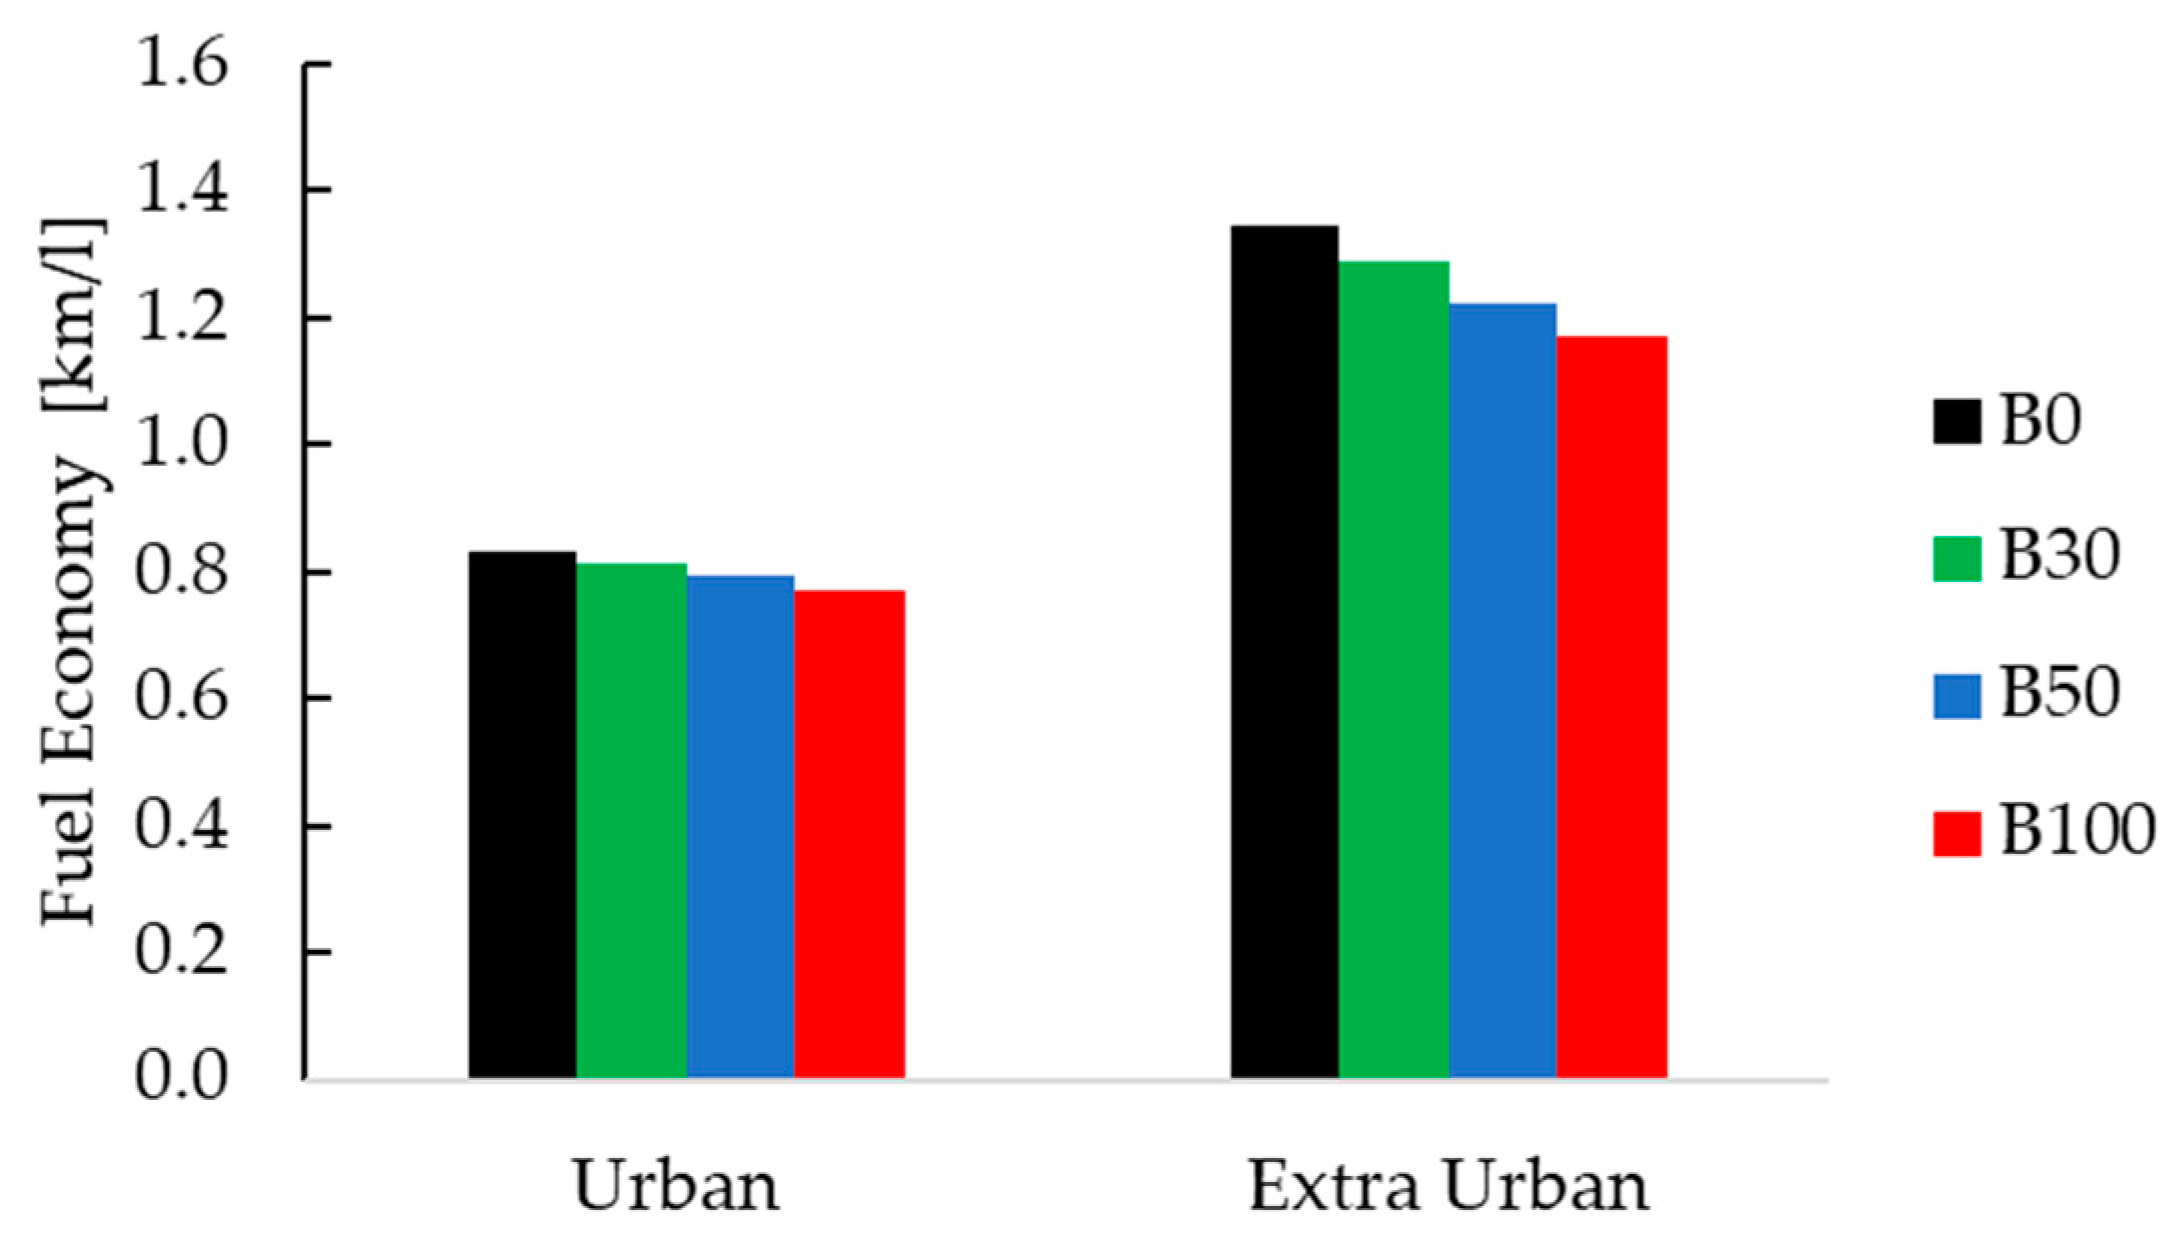
Figure 8 shows a comparison of the fuel economy of vehicles fueled with diesel fuel and biodiesel by using the modified carbon balance formula from Equations (5)–(8). Biodiesel fuel showed lower fuel economy compared to diesel fuel for both the urban and extra-urban cycles. An increase in the biodiesel ratio leads to a decrease in fuel economy. The FE of B30, B50 and B100 decreased by 2.4%, 4.8% and 7.2% compared with that of diesel fuel for the urban cycle, respectively. For the extra-urban cycle, the reduction was was 4.4%, 9.6% and 13.3%, respectively. The decrease in FE of biodiesel compared with diesel fuel can be considered to be due to its decreasing heating value, as shown in Table 2.

4. Conclusions

An investigation of high-ratio biodiesel blends and pure biodiesel in a Euro4-compliant vehicle was carried out in this paper. The results could be summarized as follows:
  • The use of high-ratio biodiesel and pure biodiesel leads to a decrease in emissions of CO, HC and Particulates. Here, B100 could suppress particulate emissions by up to 80%. Conversely, NOx emissions increased with increasing biodiesel ratio. In this study, tests with a Euro4-compliant vehicle showed that emissions of CO, HC, NOx and particulates using the B0, B30, B50 and B100 fuels were all below the limits imposed by the Euro4 standard.
  • The power output of the vehicle tested at wide-open throttle and fueled by B30, B50 and B100 was 3%, 4% and 10% lower than that of a diesel-fueled vehicle, respectively.
  • The fuel economy using high-ratio biodiesel and pure biodiesel should be calculated by a new formula of carbon balance factoring in the carbon-to-hydrogen ratio instead of the standard R101 carbon balance formula. Using the modified carbon balance formula with the New European Driving Cycle (NEDC) showed that the FE with B30, B30 and B100 was 3%, 7% and 11% lower than with diesel fuel, respectively.

Author Contributions

Conceptualization; methodology; validation; investigation; data curation; writing—original draft preparation, I.K.R. and H.S.; writing—review and editing, I.K.R., H.S., S.Y. and D.M.; visualization, H.S.; supervision, I.K.R. and H.S.; Experiment, H.S., S.Y., M., A.K.P. and D.M. All authors have read and agreed to the published version of the manuscript.

Funding

This research was funded by Indonesian Palm Oil Estate Fund (BPDPKS), No: PRJ-6/DPKS/2018.

Data Availability Statement

Not applicable.

Acknowledgments

The authors would like to express their gratitude and highest appreciation to Tatang Hernas Soerawidjaja and members of the vehicle laboratory of BRIN for conducting an excellent testing program, PT Pertamina, Gaikindo and IKABI for their support in this project.

Conflicts of Interest

The authors declare that they have no known competing financial interest or personal relationships that could have appeared to influence the work reported in this paper.

References

  1. Reksowardojo, I.K.; Setiapraja, H.; Fajar, R.; Wibowo, E.; Kusdiana, D. An Investigation of Laboratory and Road Test of Common Rail Injection Vehicles Fueled with B20 Biodiesel. Energies 2020, 13, 6118. [Google Scholar] [CrossRef]
  2. Groom, B.; Palmer, C.; Sileci, L. Carbon emissions reductions from Indonesia’s moratorium on forest concessions are cost-effective yet contribute little to Paris pledge. Proc. Natl. Acad. Sci. USA 2022, 119, e21026131. [Google Scholar] [CrossRef] [PubMed]
  3. Du, H.; Huque, Z.; Kommalapati, R.R. Impacts of Biodiesel Applied to the Transportation Fleets in the Greater Houston Area. J. Renew. Energy 2018, 2018, 7350715. [Google Scholar] [CrossRef] [Green Version]
  4. Anderson, L.G. Effects of Biodiesel Fuels Use on Vehicle Emissions. J. Sustain. Energy Environ. 2012, 3, 35–47. [Google Scholar] [CrossRef] [Green Version]
  5. McCormick, R.L.; Tennant, C.J.; Hayes, R.R.; Black, S.; Ireland, J.; McDaniel, T.; Williams, A.; Frailey, M.; Sharp, C.A. Regulated Emissions from Biodiesel Tested in Heavy-Duty Engines Meeting 2004 Emission Standards. In Proceedings of the the 2005 SAE Brasil Fuels & Lubricants Meeting, Rio de Janiero, Brazil, 11 May 2005. [Google Scholar]
  6. Hoang, A.T.; Le, M.X.; Nižetić, S.; Huang, Z.; Ağbulut, Ü.; Veza, I.; Said, Z.; Le, A.T.; Tran, V.D.; Nguyen, X.P. Understanding behaviors of compression ignition engine running on metal nanoparticle additives-included fuels: A control comparison between biodiesel and diesel fuel. Fuel 2022, 326, 124981. [Google Scholar] [CrossRef]
  7. Volpato, C.E.S.; Conde, A.d.P.; Barbosa, J.A.; Salvador, N. Performance of Cycle Diesel Engine Using Biodiesel of Olive Oil (B100). Ciência E Agrotecnologia 2012, 36, 348–353. [Google Scholar] [CrossRef] [Green Version]
  8. Tziourtzioumis, D.N.; Stamatelos, A.M. Experimental Investigation of the Effect of Biodiesel Blends on a DI Diesel Engine’s Injection and Combustion. Energies 2017, 10, 970. [Google Scholar] [CrossRef] [Green Version]
  9. Noukpo, M.L.; Abbe, C.V.N.; Anyi, J.N.; Essola, D.; Mezoue, C.; Mouangue, R.; Nzengwa, R. Experimental and Numerical Investigation on the Influence of the Rate of Injection (Roi) on Engine Performance for B100 Fuel Control Strategy in Diesel Engines. J. Eng. 2020, 2020, 8884754. [Google Scholar] [CrossRef]
  10. Suthisripok, T.; Semsamran, P. The impact of biodiesel B100 on a small agricultural diesel engine. Tribol. Int. 2018, 128, 397–404. [Google Scholar] [CrossRef]
  11. Chiavola, O.; Recco, E. Emission Performance of a Diesel Engine Fuelled with Petrol Diesel, Green Diesel, and Waste Cooking Oil Blends. J. Combust. 2018, 2018, 4819175. [Google Scholar] [CrossRef]
  12. Abu-Hamdeh, N.H.; Alnefaie, K.A. A Comparative Study of Almond Biodiesel-Diesel Blends for Diesel Engine in Terms of Performance and Emissions. BioMed Res. Int. 2015, 2015, 529808. [Google Scholar] [CrossRef] [Green Version]
  13. Tutunea, D.; Dumitru, I. Analysis of performance and emissions of diesel engine using sunflower biodiesel. IOP Conf. Series Mater. Sci. Eng. 2017, 252, 012085. [Google Scholar] [CrossRef]
  14. Islam, M.S.; Ahmed, A.S.; Islam, A.; Aziz, S.A.; Xian, L.C.; Mridha, M. Study on Emission and Performance of Diesel Engine Using Castor Biodiesel. J. Chem. 2014, 2014, 451526. [Google Scholar] [CrossRef] [Green Version]
  15. Kaya, T.; Kutlar, O.A.; Taskiran, O.O. Evaluation of the Effects of Biodiesel on Emissions and Performance by Comparing the Results of the New European Drive Cycle and Worldwide Harmonized Light Vehicles Test Cycle. Energies 2018, 11, 2814. [Google Scholar] [CrossRef] [Green Version]
  16. Nguyen, V.H.; Duong, M.Q.; Nguyen, K.T.; Pham, T.V.; Pham, P.X. An extensive analysis of biodiesel blend combustion characteristics under a wide range of thermal conditions of a cooperative fuel research engine. Sustainability 2020, 12, 7666. [Google Scholar] [CrossRef]
  17. Rojas, J.C.P.; Miguel, C.R.T.S.; Medina, R.V.; Naranjo, J.A.L.; Hernàndez, F.E.O.; Castelló, R.C. Pollutant Emissions and Combustion Efficiency Assessment of Engines Using Biodiesel. Appl. Sci. 2020, 10, 8646. [Google Scholar] [CrossRef]
  18. Ge, J.C.; Choi, N.J. Soot Particle Size Distribution, Regulated and Unregulated Emissions of a Diesel Engine Fueled with Palm Oil Biodiesel Blends. Energies 2020, 13, 5736. [Google Scholar] [CrossRef]
  19. Lu, J.-H.; Ku, Y.-Y.; Liao, C.-F. The effects of biodiesel on the performance and the durability of diesel engine active-DPF. In Proceedings of the SAE 2012 World Congress & Exhibition, Detroit, MI, USA, 24–26 April 2012. [Google Scholar] [CrossRef]
  20. Li, Y.X.; McLaughlin, N.B.; Patterson, B.S.; Burtt, S.D. Fuel efficiency and exhaust emissions for biodiesel blends in an agricultural tractor. In Proceedings of the CSAE/SCGR 2005 Meeting, Winnipeg, MB, Canada, 26–29 June 2005; Volume 48. [Google Scholar]
  21. Puškár, M.; Kopas, M.; Sabadka, D.; Kliment, M.; Šoltésová, M. Reduction of the Gaseous Emissions in the Marine Diesel Engine Using Biodiesel Mixtures. J. Mar. Sci. Eng. 2020, 8, 330. [Google Scholar] [CrossRef]
  22. Rajaeifara MATabatabaei, M.; Aghbashloe, M.; Nizamif, A.-S.; Heidrich, O. Emissions from urban bus fleets running on biodiesel blends under realworld operating conditions: Implications for designing future case studies. Renew. Sustain. Energy Rev. 2019, 111, 276–292. [Google Scholar] [CrossRef]
  23. Fernández-Yáñez, P.; Soriano, J.A.; Soto, F.; Armas, O.; Pla, B.; Bermúdez, V. Pollutant emissions from Euro 6 light duty vehicle tested under steady state and transient operation on a roller test bench with hydrogenated paraffinic and biodiesel fuels. Fuel 2022, 323, 124173. [Google Scholar] [CrossRef]
  24. Godiño, J.A.V.; García, M.T.; Aguilar, F.J.J.-E. Experimental analysis of late direct injection combustion mode in a compression-ignition engine fuelled with biodiesel/diesel blends. Energy 2022, 239, 121895. [Google Scholar] [CrossRef]
  25. Fontana, G.; Galloni, E.; Ianniello, R.; Lanni, D.; Beatrice, C.; Di Blasio, G. Numerical analyses of spray development and combustion process with dieselgasoline-ethanol mixtures in compression-ignition engines. AIP Conf. Proc. 2019, 2191, 020078. [Google Scholar] [CrossRef]
  26. Chojnowski, J.; Karczewski, M. Influence of the working parameters of the chassis dynamometer on the assessment of tuning of dual-fuel systems. Energies 2022, 15, 4869. [Google Scholar] [CrossRef]
  27. Khan, M.M.; Sharma, R.P.; Kadian, A.K.; Hasnain, S.M.M. An assessment of alcohol inclusion in various combinations of biodiesel diesel on the performance and exhaust emission of modern day compression ignition engines—A review. Mater. Sci. Energy Technol. 2022, 5, 81–98. [Google Scholar] [CrossRef]
  28. Kumagai, T. Improving the Accuracy of Fuel Consumption Measurement in CVS System. Technical Journal Readout English Edition; Horiba: Tokyo, Japan, 2014. [Google Scholar]
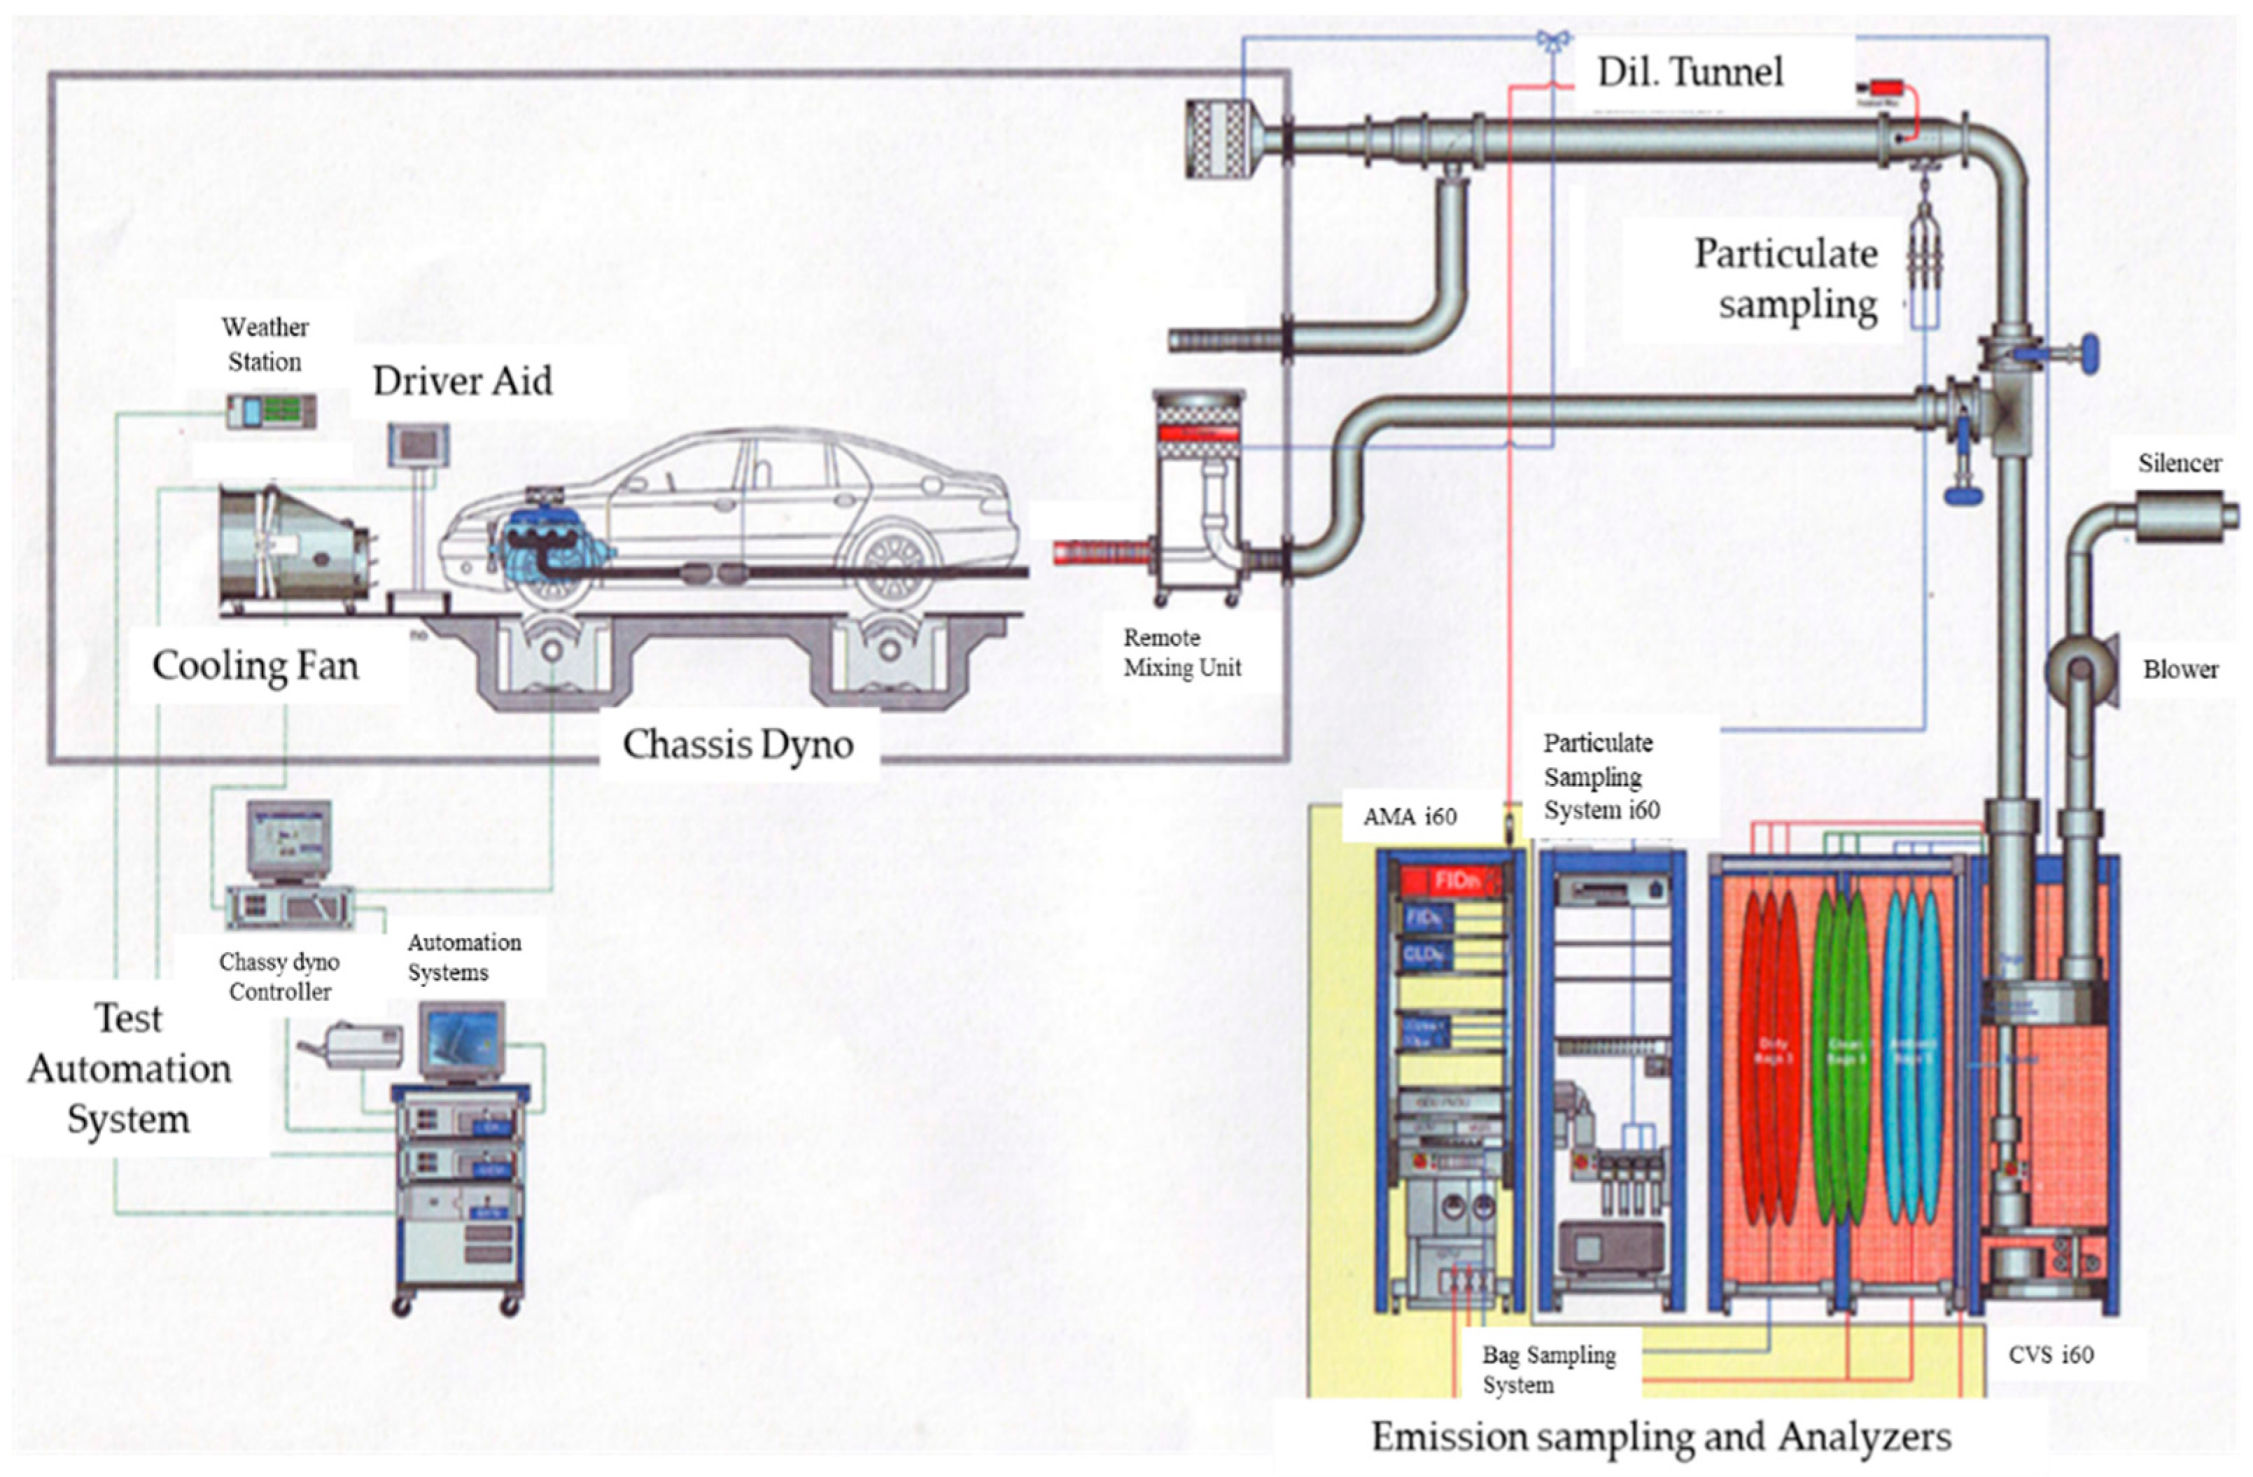
Figure 1. Schematic diagram of vehicle testing facility [1].
Energies 16 00718 g001
Figure 2. NEDC test cycle [1].
Energies 16 00718 g002
Figure 3. Regulated exhaust gas emissions for B0, B30, B50 and B100.
Energies 16 00718 g003
Figure 4. Transient CO and NOx emissions for diesel fuel and biodiesel.
Energies 16 00718 g004
Figure 5. Diesel fuel and biodiesel vs limits imposed by the Euro4 standard.
Energies 16 00718 g005
Figure 6. Power and torque of diesel fuel, B30, B50 and B100.
Energies 16 00718 g006
Figure 7. An effect of biodiesel ratio on the H/C and O/C ratios.
Energies 16 00718 g007
Figure 8. Fuel Economy using modified carbon balance equation for B0, B30, B50 and B100.
Energies 16 00718 g008
Table 1. Properties for diesel fuel and B100.
NoParameterUnitDiesel Fuel (B0)Limit *1FAME (B100)Limit *2
MinMaxMinMax
1Cetane Number-49.251-6351-
2Index Cetane-48.848-58.3--
3Density at 15 °Ckg/m3828.5810850873.5810850
4Viscosity at 40 °Cmm2/s2.2624.54.372.36
5Sulfur Contentppm10-5016-10
6Distillation
IBP°C190--316--
90% vol°C344--334--
95% vol°C363-370337-360
FBP°C371--341--
7Flash Point°C74-55174-130
8Pour Point°C-24-1815--
9Carbon Residue% m/mnil-0.10.045-0.05
10Water Contentmg/kg18-28062-350
11Oxidation Stabilityg/m3>48--16--
12Cu Strip Corrosionmerit1B-1A1A-1A
13Ash Content% m/m0.005-0.010.002-0.02
14Sediment Content% m/m0.005-0.010.002-0.01
15Total Acid Numbermg KOH/g0.07-0.30.18-0.4
16Lubricity (HFRR wear scar diameter @60 °C)micron600-460203--
Note *1: Decree of Directorate General Oil and Gas—Ministry of Energy and Mineral Resources of Indonesia No. 146.K/10/DJM/2020. *2: Decree of Directorate General of New, Renewable Energy, and Energy Conservation—Ministry of Energy and Mineral Resources of Indonesia No. 189.K/10/DJE/2019
Table 2. Density and heating value for all tested fuels.
NoParameterUnitB0B30B50B100
1Density at 15 °Ckg/m3841.7851.3867.5873.5
2Lower Heating ValueMJ/kg45.543.842.840.1
Table 3. Vehicle Specification.
No.ItemsSpecifications
1Engine Displacement (cc)2755
2Maximum Power Output (HP/rpm)174/3400
3Maximum Torque (Nm/rpm)450/1600-2400
4Number of Cylinders4
5Valve SystemIn-line 16 valve DOHC
6Intake systemVariable Turbo Charger with Intercooler
7Fuel SupplyCommon Rail Injection Systems
8Exhaust After TreatmentDiesel Oxidation Catalyst
9Vehicle Emissions CategoryEuro4
Table 4. Comparison of FE calculated by different carbon balance and weighing methods.
FuelWeighing [km/L]R101 [km/L]Modified R101 [km/L]Difference of R101 & Modified R101 [%]Difference of R101 & Weighing [%]Difference of Modified R101 & Weighing [%]
B010.921110.970.270.730.46
B3010.4211.0410.613.895.621.79
B5010.3410.9610.266.395.66−0.78
B1009.5511.119.8111.7014.042.65
Disclaimer/Publisher’s Note: The statements, opinions and data contained in all publications are solely those of the individual author(s) and contributor(s) and not of MDPI and/or the editor(s). MDPI and/or the editor(s) disclaim responsibility for any injury to people or property resulting from any ideas, methods, instructions or products referred to in the content.