Article

Novel Hybrid Optimization Techniques to Enhance Reliability from Reverse Osmosis Desalination Process

by
Mohammad Abdul Baseer
1,
Venkatesan Vinoth Kumar
2,
Ivan Izonin
3,*,
Ivanna Dronyuk
4,
Athyoor Kannan Velmurugan
5 and
Babu Swapna
6
1
Department of Electrical Engineering, College of Engineering, Majmaah University, Al-Majmaah 11952, Saudi Arabia
2
School of Information Technology, Vellore Institute of Technology University, Vellore 632014, India
3
Department of Artificial intelligence, Lviv Polytechnic National University, 79013 Lviv, Ukraine
4
Faculty of Science & Technology, Jan Dlugosz University in Czestochowa, 24200 Czestochowa, Poland
5
Department of Computer Science and Engineering, Koneru Lakshmaiah Education Foundation, Guntur 522302, India
6
Department of Electronics and Communication Engineering, Dr. MGR Educational and Research Institute, Chennai 600095, India
*
Author to whom correspondence should be addressed.
Energies 2023, 16(2), 713; https://doi.org/10.3390/en16020713
Submission received: 28 November 2022 / Revised: 21 December 2022 / Accepted: 4 January 2023 / Published: 7 January 2023
(This article belongs to the Special Issue Renewable Energy, Environmental Quality and Sustainability)

Abstract

:
Water is the most important resource of the Earth and is significantly utilized for agriculture, urbanization, industry, and population. This increases the demand for water; meanwhile, the climatic condition decreases the supply of it. A rise in temperature of 1 degree Celsius might dry up 20% of renewable water resources, and to circumvent the water scarcity, it is necessary to reuse, create, and consume less water without wasting it. Water desalination is the process used to reuse the used or saline water by promptly extracting the salt or unwanted minerals and producing fresh consumable water. Based on the International Desalination Association, around 300 million people rely on desalination and the people of the Middle East region rely the most upon it. Around 7% of desalination plants are located in countries such as Saudi Arabia, Bahrain, Kuwait, and the United Arab Emirates. Reverse osmosis (RO) is the relevant desalination process in this type of area however, the conventional methods include more complexities, and hence to address this issue we proposed a novel approach known as Hybrid Capuchin and Rat swarm algorithm (HCRS) for effective water desalination technology using conventional sources and renewable energy in the middle east region. Moreover, a hybrid reverse osmosis plant model is developed for identifying renewable sources such as wind and solar energy. The proposed optimization can be used to mitigate the life cycle cost and enhances the reliability of the hybrid schemes. The experiment is conducted in a MATLAB simulator and compared the results with state-of-art works over the metrics such as relative error, system cost, and reliability. Our proposed method outperforms all the other approaches.

1. Introduction

Renewable energy [1] is the process of energy from different natural sources such as wind and sun providing a time frame. It uses space, transportation, electricity generation, water cooling, and heating. Solar energy and wind power are naturally constant sources of energy [2]. It is also known as sustainable energy [3]. Finite energy sources such as gas and coal face fossil fuels from renewable energy sources. Other sources, such as nuclear, geothermal, solar, and hydro, are observed for a vast area. Renewable energy individuates into hydropower, wind energy, solar energy, geothermal energy, and biomass.
The largest source of energy is hydropower which produces electricity by transferring the natural flow of water. In the U.S., the total electricity generation is 37% and renewable energy electricity generation is 7%. It monitors floods, supports irrigation, and supplies clean drinking water. It is suitable and the cost of electricity is inexpensive. The efficient part of electrical energy [4] is hydropower which, produces 90% of the energy in electricity. By using the power of the wind, a wind turbine generates electricity. Mechanical power is converted into kinetic energy by the turbines. Thus, the generation of electricity reduces carbon footprint. Moreover, wind energy is not harmed by the electrical grid. Wind turbines [5] are a more potent energy source with less noise. The ability of solar radiation to generate electricity fuels chemical reactions [6].
Electrical energy is received by converting sunlight into solar radiation from photovoltaic panels. The capacity to provide electricity which limits the production of solar power. The Earth produces heat to produce electricity through heating buildings and bathing. Earth’s core is generated by renewable energy, which formulates the planet and radioactive decay material to store thermal energy as rocks and fluids. The living organism generates energy and creates biomass energy [7]. Plants use energy to produce electricity by converting heat from any organisms. Both, commercial and noncommercial [8] natural sources are subdivided into conventional resources.
Non-conventional resources will not make pollution worse. Earlier, this is a non-renewable source which then becomes a renewable source. Thermal power plants, nuclear energy, oil, natural gas, and coal are conventional energy sources [9]. Hydro energy, geothermal energy, and solar energy are examples of unconventional energy sources. It is simple to distinguish between conventional, and non-conventional energy methods. Tidal energy, wind energy, and bioenergy are examples of renewable energy sources, also known as non-conventional energy sources.
The emission of greenhouse gas increases the use of harnesses in environments. Natural energy sources such as coal, gas, and oil determine which energy sources become conventional energy. Hydroelectric power is categorized as a non-renewable energy source along with thermal, nuclear, and hydroelectric power. The concerns about carbon dioxide (CO2) emissions contributing to potential global warming arose as electricity demand increased, with supply relying primarily on fossil fuels, with some hydropower and later nuclear energy. The focus once more shifted to the enormous energy sources in nature that are always pulsing around us, particularly the sun, wind, and seas. There was never any question as to their size; the difficulty was always in harnessing them to fulfill the need for dependable and affordable electricity.
Several works have been performed to achieve the optimized ROD; however, the life cycle cost and reliability of the work are low. In context, with this, we proposed a novel hybrid system based on the HCRS approach. The significant contribution of the work is listed below:
  • The optimum sizing of the hybrid solar and wind energy with storage and ROD is constructed using the proposed HCRS algorithm.
  • The system’s reliability is estimated by using the loss of power supply probability (LPSP) factor along with the estimation of life cycle cost (LCC). The LCC is used to estimate the environmental impacts of the system. Even though solar based has less impact than fossil fuel, it is necessary to estimate the impact.
  • Moreover, the continuous and integer decision variables are considered to describe the power required for RO desalination.
  • Finally, the proposed approach can be used to analyze these parameters and optimize the results.
  • Further, our proposed method mitigates the maintenance and repair cost using the least resources.
  • The utilization of energy required for the conversion process is reduced with our proposed approach.
The remainder of the work is organized so that in Section 2, the relevant works are examined together with their benefits and drawbacks. Section 3 explains the proposed work. In Section 4, the experimental analysis is made. Finally, Section 5 provides the conclusion.

2. Literature Survey

Mostafa et al. [10] have proposed a computational fluid dynamics (CFD) model to modify conventional solar stills using solar chimneys. Computational fluid dynamics (CFD) defines the statistical approach to assembling solar chimneys to define airflow. The temperature distribution and airflow are used to communicate inside the solar chimney. The water depth, salt concentration, seasonal temperature, and solar desalination are the parameters to investigate operation conditions. It decreases the cost and maintenance and classic design; moreover, it gained better experimental results and improved water desalination by 30%. However, the optimized performance metrics are yet to be obtained.
Oikonomou et al. [11] have presented the flexible power water flow (FlexPWF) model for power and water distribution systems. Water and power distribution are linked by the operation of desalination, water treatment, and conveyance subsystems. The storage of fresh water in the tank necessitates sufficient pressure in the water pipes to generate electricity. It is affordable, flexible, and secure. It is challenging to achieve the integration of multiple elements.
To control and monitor greenhouse temperature, Subahi et al. [12] have implemented a Petri Nets (PN) model based on IoT technology. The transformations are divided into three concepts which are, platform-independent model, platform-specific model, and computation-independent model. The entire system is handled to initiate the reference temperature and accept the proposed method to observe the greenhouse environment. It decreases the cost, high temperature, and energy consumption and it is also efficient, scalable, flexible, and feasible. However, it is not easy to achieve the management information system in a scalable design.
Mohamed et al. [13] have demonstrated an efficient energy management approach for the smart island (SI). It consists of different modules combined with a microgrid, electric vehicles, and a smart energy hub. The proposed method examines the water, electricity, and thermal systems in the sea. Primary and secondary tanks examine the water to model the desalination unit using an energy hub. The investment and subway costs are low. Furthermore, it is difficult to achieve cyber stability and security.
Semshchikov et al. [14] have presented a fuel-efficient control strategy to enhance fuel consumption and renewable energy control. The hybrid isolated power system combines renewable energy and conventional sources. The isolated power system regulates access to ancillary services for technology in order to reduce stability issues. It reduces fuel consumption by 16.7% and boosts predictions of renewable energy by 14%. The economy’s efficiency and dependability are improved, and costs are decreased. The renewable penetration must be reduced.
Atallah et al. [15] describe a reverse osmosis desalination plant based on hybrid renewable energy. The converter, wind turbines, and solar panels are the hybrid system to lower gas excretion and fuel exhaustion. Different energy systems will choose the configuration and sizing to optimize the configuration. It is feasible, reliable, and stable. However, optimized performance is yet to obtain.
Wang et al. [16] have presented combined cooling, heating, and power system (CCHP) based on the multi-energy complementary distributed system. The calculation stages are the decision-making and optimal power flow stages. The operation framework interchanges the capacity, demand load, and structure. Different energy systems will choose configuration and sizing to optimize the configuration. It is feasible, reliable, and stable. However, optimized performance is yet to obtain. Renewable energy, natural gas, and energy conversion are devices with complex configurations in commercial buildings with more profit and less expensive, moreover; the optimal strategy is low.
Ouammi et al. [17] have described a high-level centralized control approach based on a smart network of greenhouses integrated micro-grid (NGIM). The network level multiplies the crop production to operate the indoor climate and determine crop growth. The optimal plant growth is determined by micro-control and a self-regulating environment. The reference signals were studied to assess how well the proposed method produces results. It is difficult to achieve the optimized output on a larger scale.
Poudel et al. [18] have evaluated a small modular reactor renewable energy source (SMR-RES) for district heating and electricity. The frequency regulation and load following are the modes to formulate the multi-time scale operational scheme. The different hosting levels implement to operate the framework by the IEEE 30-bus system. It is feasible and 50% of renewable energy sources increased. It is difficult to apply the same system in different areas and thus reduce the optimized output. M.A.Baseer et al. proposed a novel Hobbled Shepherd Optimization (HSO) to enhance converter management and Multi-Objective Based Golden Eagle (MOGE) algorithm for inverter control, these systems use the hybrid RES in a grid machine too complicated the learn about the place the fee of the gadget decreased from USD 21,235,200 to USD 151,300 by means of the accelerated reliability of the device [19].
M.A.Baseer et al. describe six different case studies to analyze the proposed Hybrid Krill Heard Spider Monkey-based MPPT by using the normalized reasoning herd spider monkey control technique. The effectiveness of the solar PV-connected smart grid system has also been demonstrated for the adjustment of reactive power for load balancing, harmonic abatement, and reducing voltage variations. This system’s performance has been satisfactory and best in class. The load current and grid current of the planned solar PV have reached 1.70% and 3.7%, respectively, which met within the IEEE standard range [20]. For a PV array to be effective, the maximum power must be transmitted continuously regardless of the weather conditions; the contribution of the thermal storage energy revealed the dependency on fossil fuels [21]. Additionally, shadowing and resistive loss are assessed and predicted prior to installing PV, and the approximation of optimum power was analyzed. The cost of electricity is calculated during the optimization and performance of solar PV. The array, reference yield, and final result are calculated to measure the output energy of solar radiation and standard test conditions [22]. Other studies should improve the output energy and efficiency of PV panels for a growing country such as India. Few companies manufacture PV systems, and R&D is of poor quality [23]. The PV junction produces direct voltage before receiving a PV light [24].
To explore the correlation between renewable energy resources and the demand for freshwater Alhaj et al. [25] presented a novel optimized solar-driven thermal desalination plant. The authors stated that the proposed approach could treat the brackish and seawater treatment.
Alqaed et al. [26] delineate a small-scale reverse osmosis (RO) that formed with the hybrid photovoltaic/thermal (PVT) for a remote area of Saudi Arabia. The viscosity of the feedwater can be mitigated by preheating with the aid of electric pumps and thermal energy at low temperatures. This reduces pumping energy and states that the system utilizes 70% of renewable energy and reduces 18% of the annual cost.

3. Materials and Methods

The framework of the hybrid energy system is shown in Figure 1. It includes components such as (i) photovoltaic panels, (ii) wind generator, and an (iii) a storage system. A Photovoltaic (PV) panel [27] and a wind turbine [28] are employed in the main power system. Various energy sources are connected to one another by enabling the power management unit.
Charge state for the Battery (BAT) system
The backup of the renewable resources is performed in the storage system to reduce the mitigation of energy while optimizing; the power unit’s excess energy produced when the load is lower can be used to charge the battery. The battery specification relies on the battery life and depth of discharge (DD) [29]. Henceforth, the charging state of the battery (CS) can be estimated with the following equation,
During the charging state:
C S ( T ) = C S ( T 1 ) ( 1 ρ ) + [ E G ( T ) E D l ( T ) μ I N V ] μ b c
During the discharging state:
C S ( T ) = C S ( T 1 ) ( 1 ρ ) + [ E D l ( T ) μ I N V E G ( T ) ] / μ b f
Here, we take E D l ( T ) the energy demand for the particular hour and the energy generated by the PV collectors and wind turbines [30] as E G ( T ) , while charging and discharging the battery bank the efficacy can be represented as μ b c and μ b f , respectively. Moreover, the inverter efficacy can be denoted as μ I N V and the self-discharge per hour is ρ . Subsequently, the life cycle cost (LCC) of the battery bank is estimated by,
L C C B A T = C B A T + M B A T
C B A T = S B A T P W B A T C R F
P W B A T = H B A T k = 0 , 5 , 10 , 15 1 ( 1 + j ) k
M B A T = S B A T H M n t B A T
C R F ( j , n ) = j ( 1 + j ) n ( 1 + j ) n 1
The capital cost of batteries used are C B A T , the maintenance and operation cost of the batteries undertaken as M B A T . The cost and batteries are indicated as S B A T and H B A T correspondingly. The current value of the battery is indicated as P W B A T . J is the interest for n life span and the annual maintenance cost of the battery [31] can be represented as H M n t B A T .
The economic model of Reverse Osmosis Desalination (ROD)
The central processing unit of the desalination [32,33] is ROD which includes of energy recovery device, a high-pressure pump, and RO membranes. Moreover, the correlation between the electric power of desalination E D E M and energy consumption S D C are used for the volumetric demand for water W W D . It can be formulated as,
E D E M = W W D S D C
The average electrical energy consumed by the ROD is approximately equal to 2–6 kWh/m3 which includes the desalination unit, pumps energy recovery devices, and membranes. Moreover, the daily desalination water production can be estimated as,
D A W C = 24 h o u r s d a y × ( E D S D C )
The desalination installed power can be represented as E D (kW) the ROD unit usually operated among the minimum load E M D and nominal load E D I :
E M D E D E S E D I
The instantaneous usage of electric power can be indicated as E D E S .
The daily volumetric demand for freshwater is indicated as D A W D and is determined by the volumetric capacity of the freshwater tank (FWT) of the ROD system, it can be expressed as,
V F W T = 2 D A W D
Moreover, the LCC [34] of the ROD is defined as the cumulative results of the system’s capital cost C R O D and the capital cost of a freshwater tank C F W t along with the cost of chemicals C C H t , operations and maintenance cost M R O D and the cost for the replacement of membrane C M R . It can be formulated as,
L C C R O D = C R O D + C F W t + M R O D + C M R + C C H
Here,
C R O D = S R O D C a W D C R F
C F W l = C F W l V F W l C R F
M R O D = C M n t R O D . D W D
T C M R = C M R . C a W D . S M e
T C C H = C C H . D W D
The annual number of membrane replacements is S M e and the cost for the membrane replacement is C M R .
Objective function and limitations
The decision variable in the optimization process is the TLCC, i.e., total LCC. The assessment of various renewable energy plans based on reverse osmosis desalination that are now accessible can reduce TLCC. The objective function can be given as,
O b j e c t i v e f u n c t i o n = Re d u c e T L C C ( X P V , X W T , S B A T ) = M i n m = P V , W T , B A T , R O D , I N V L C C M
X P V is the decision variable of PV surface area and is distributed continuously. The total number of batteries is represented as S B A T an integer in nature. Another continuous variable is the area of the turbine blades [35] X W T which satisfies the following conditions:
0 X P V X P V M A X
0 X W T X W T M A X
0 S B A T S B A T M A X
The X P V M A X and X W T M A X are the area occupied by the WT blades and PV arrays correspondingly and selected accordingly. S B A T M A X is the maximum available battery in the hybrid system. Moreover, the CS value must satisfy the following conditions:
C S ( T ) C S min
For simplification, we have to consider that the C S ( T ) = C S min and the loss of power supply (LPS) can be determined as,
L P S ( T ) = F D l ( T ) μ I N V F G ( T ) [ C S ( T 1 ) . ( 1 ρ ) C S min ] μ b f
The limitations of battery bank CS for all times are given as
C S min C S ( T ) C S max
Here, we have considered the LPSP (loss of power supply probability) as the reliability index and can be expressed as,
L P S P = T = 1 Z L P S ( T ) T = 1 Z F L o a d ( T )
Moreover, during the optimization, the following limitations are applied L P S P m L P S P and here L P S P m is the maximum allowable LPSP.
HCRS algorithm for the Hybrid system
In this section, we demonstrate the proposed HCRS algorithm for the optimization of all the factors of the hybrid system.
  • Hybrid CRS algorithm:
The following section explains the mathematical formulation of the hybrid CRS algorithm.

3.1. Capuchin Search Algorithm

This algorithm is developed using food-finding techniques and is based on the distinctive features of Capuchin monkeys [36]. The global and local schemes are clarified mathematically as shown below. Since the Capuchins’ movement from one tree to another resembles projectile motion [37], the motion is given as follows:
a = a 0 + ν 0 t + 1 2 r t 2
b = b 0 + V E L 0 t + 1 2 s t 2
In this case, b represents the separation between the source and destination trees, or the source and the targeted nodes. The node’s initial location is b 0 . The velocity is indicated V E L and can be calculated using the first law of motion as shown below. The acceleration is denoted as s under the time instance t.
V E L = V E L 0 + s t
The initial velocity components of the vehicles are given by the capuchin monkey as b and c, which can be represented as,
V E L 0 b = V E L 0 cos ( ϕ 0 )
V E L 0 c = V E L 0 sin ( ϕ 0 )
where V E L 0 b and V E L 0 c are the initial velocities and ϕ 0 is the angle direction.
V E L b = V E L 0 b + s b t = V E L 0 cos ( ϕ 0 )
From this equation, s b is the acceleration based on the horizontal direction.
b = b 0 + V E L 0 cos ( ϕ 0 ) t

3.2. Rat Swarm Optimizer (RSO) Algorithm

This is dependent on the rat’s trying [38] to chase and trying to fight habits when looking for food. The numerical representation seems to be as follows.
(i).
Prey chasing:
The rat’s trying to chase actions are based on their agonistic nature and on searching for prey upon learning its location [39]. According to the most effective search agent, the location of the search agents is updated. The prey location improvement is represented as follows:
E = X . E i ( e ) + F . ( E o ( e ) E i ( e ) )
The obtaining the optimal node is E i ( e ) and the position is indicated as E o ( e ) . The estimated values for F and X are displayed as,
F = 2 . r a n d o m ( )
X = R e × ( R I t e r a t i o n M a x )
e = 0 , 1 , 2 , , I t e r a t i o n M a x
The values of the F and R are arbitrary decimal digits with variations of one to five and zero to two. The exploration and exploitation phase of iterations uses the specifications F and X.
(ii).
Fighting with prey:
When choosing the location and upgrade process is similar to how rats fight for their prey.
E i ( e + 1 ) = | E o ( e ) E |
E i ( e + 1 ) denotes the vehicle’s most recent location. Additionally, it is chosen as the ideal base station, as well as the other nodes are arranged around it. In addition, it can be used to locate the best node in an n-dimensional search space.

3.3. Hybrid CRS Algorithm

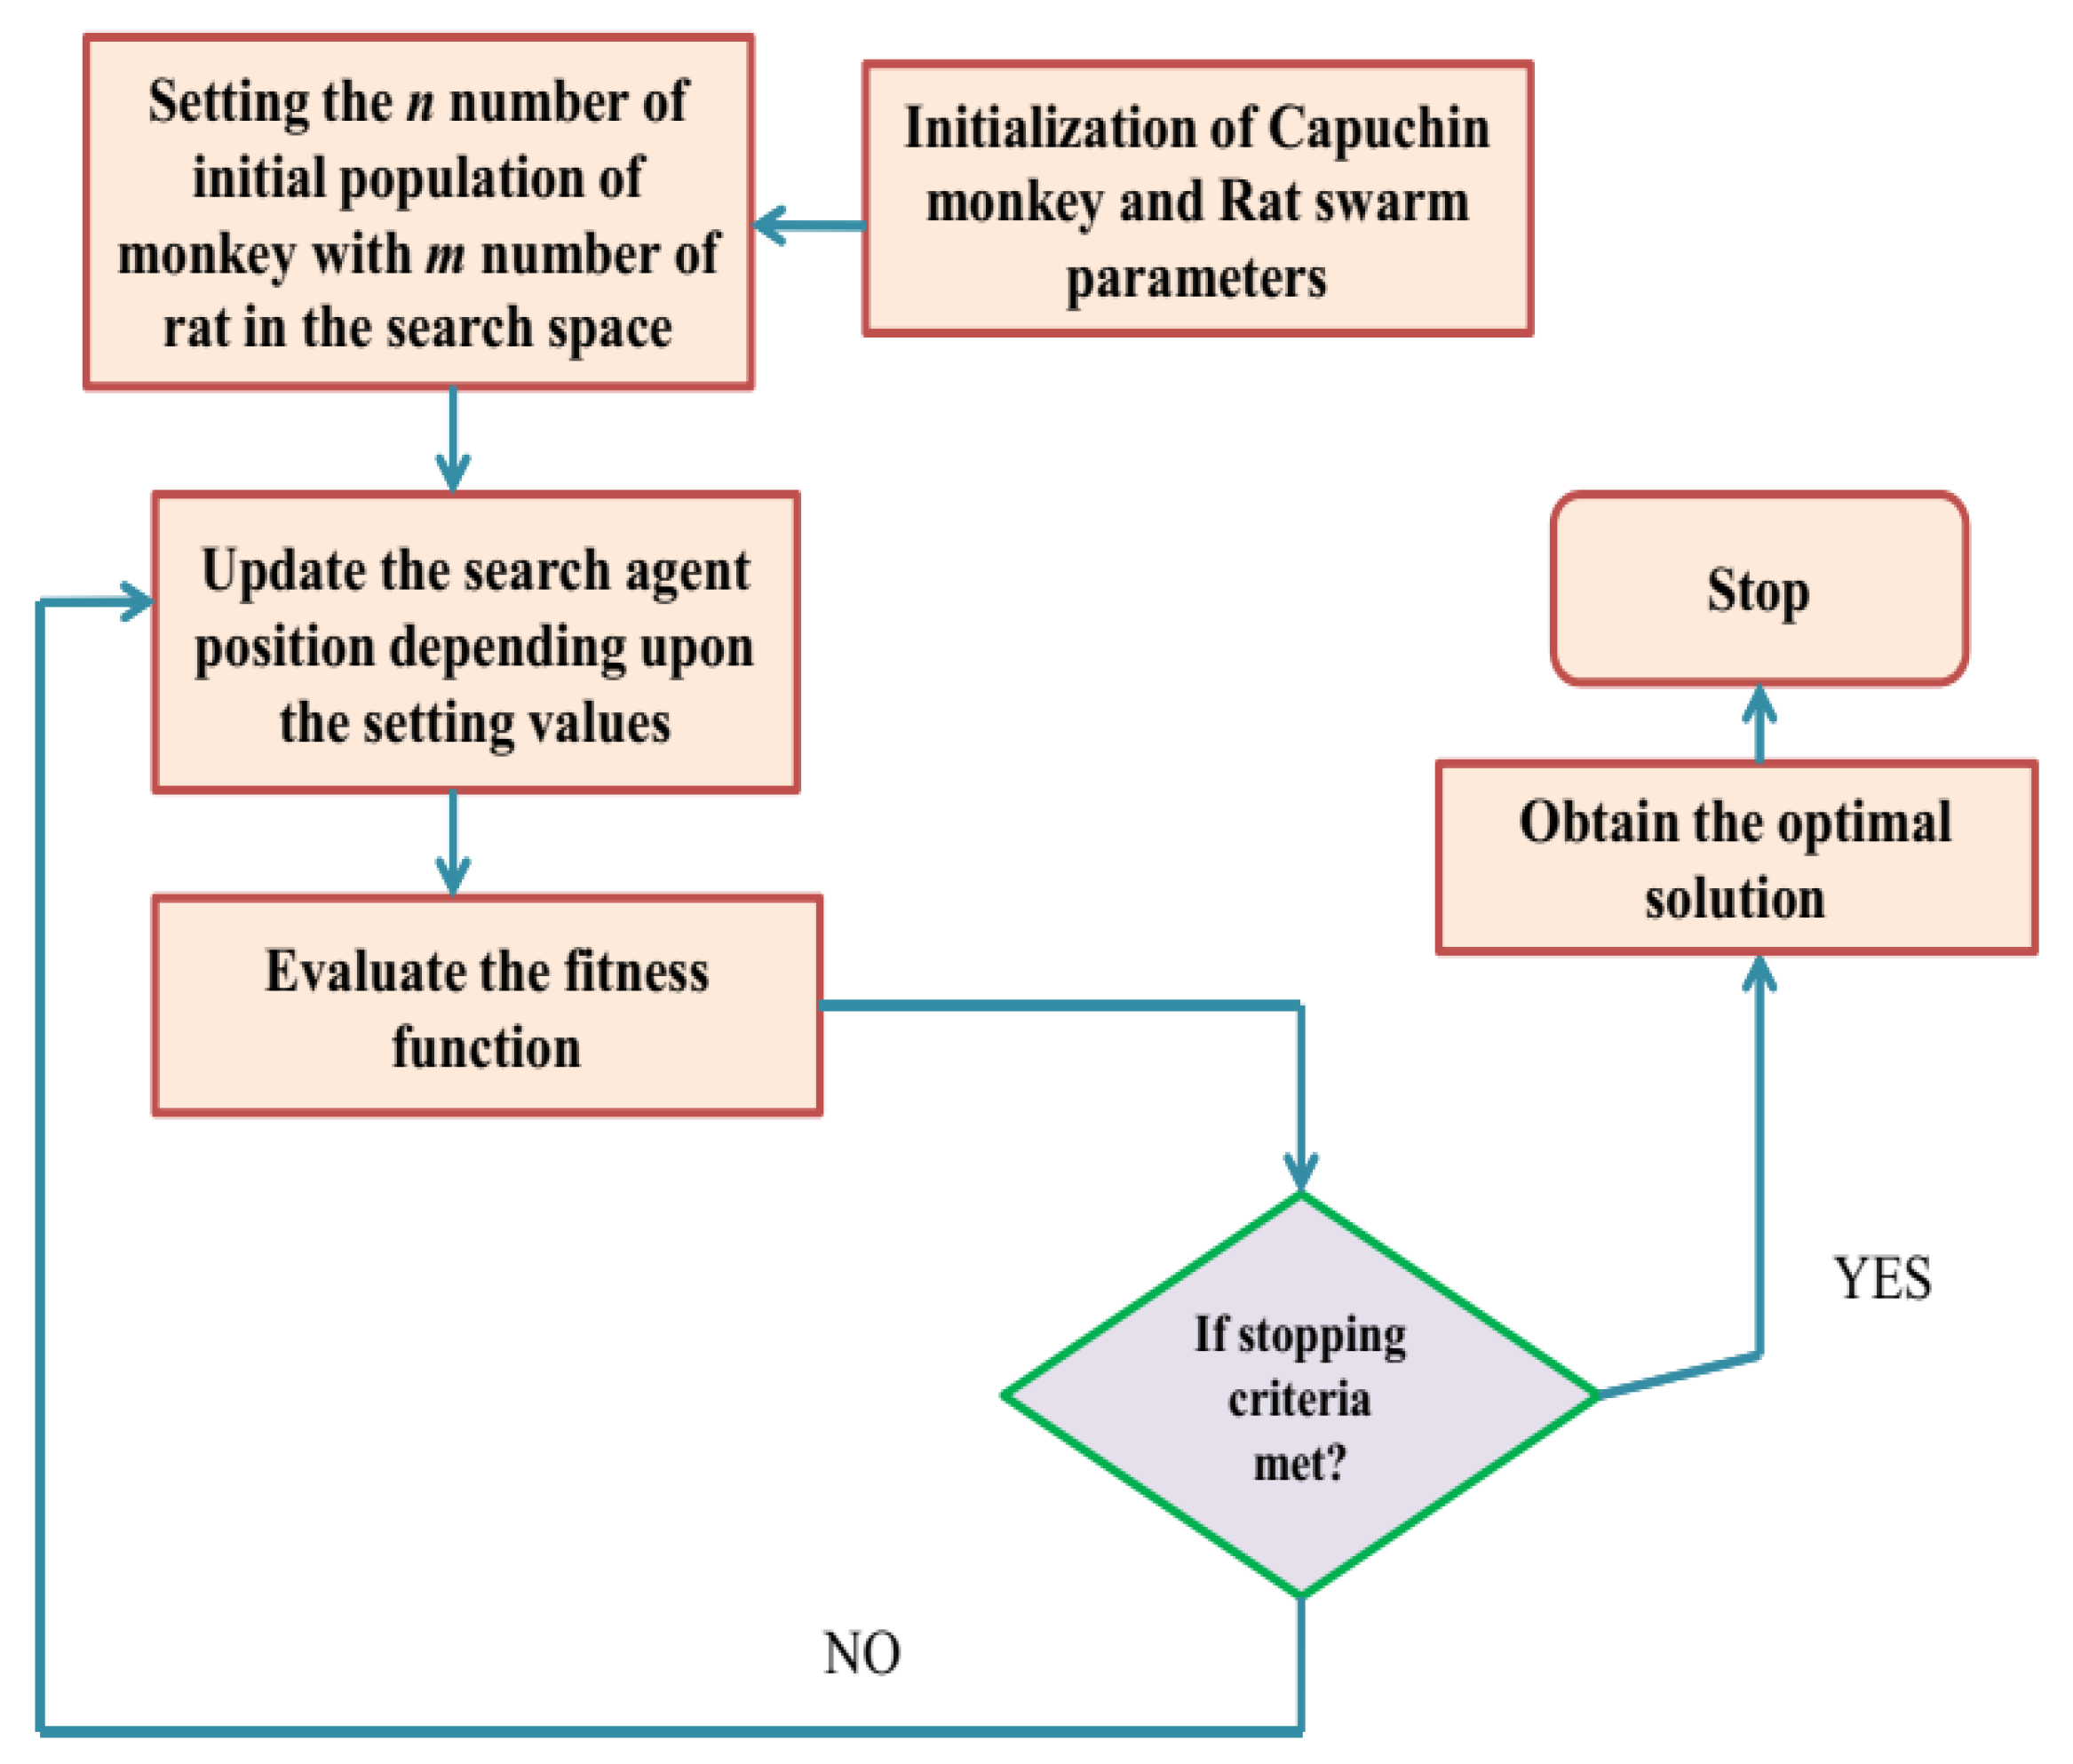
The major goal of combining the CSA and RSO methods is to use the key components of each approach when choosing the cluster head. To do this, we have combined the location upgrade feature from the RSO method with the predicting velocity and acceleration characteristics from the CSA method. The Hybrid CRS algorithm is depicted schematically in Figure 2.
  • Initialize the capuchin search algorithm parameters with the maximum number of iterations.
  • Capuchins’ movement from one tree to another resembles projectile motion.
  • Update the acceleration and velocity.
  • Rat’s trying to chase actions are based on their agonistic nature and on searching for prey upon learning its location.
  • The process of selecting a location and upgrading is comparable to how rats compete for their prey.
  • After calculating the ideal solution, update the search agent locations.
The proposed approach can be used to attain the optimization of the area because of the inclusion of ergodic characteristics and dynamic nature. The suggested method for space transformation and data-driven resources can be used to maximize the decision variables indicated in the aforementioned section.

4. Results and Experimental Outcomes

This study utilizes the freshwater demand, load demand, solar irradiation on a horizontal plane, and wind speed and air temperature of hourly mean values. The load demand is met via solar/battery/desalination, wind/battery/desalination, and solar/wind/battery/desalination respectively. From this, the availability of fresh water is increased and we are using the system design data. Somewhere at the beginning, it is expected that all device is working to 30% of their maximum capability.
The comparative results of total life cycle cost are tabulated in Table 1. Here, we have used different state-of-art methods such as whale optimization (WO) [40], particle swarm optimization (PSO) [41], and genetic algorithm (GA) [42] and the proposed method. From Table, 1 the proposed method offers a minimum of USD 202,302, a maximum of USD 1,523,134, a standard deviation of USD 123,454, and a mean of USD 1,213,823 cycle cost.
  • Total life cycle cost (TLCC)
The proposed method offers less life cycle cost than the previous methods such as WO, PSO, and GA, respectively. Table 1 represents the TLCC of minimum, maximum, standard deviation, and mean of WO, PSO, GA, and the proposed model.
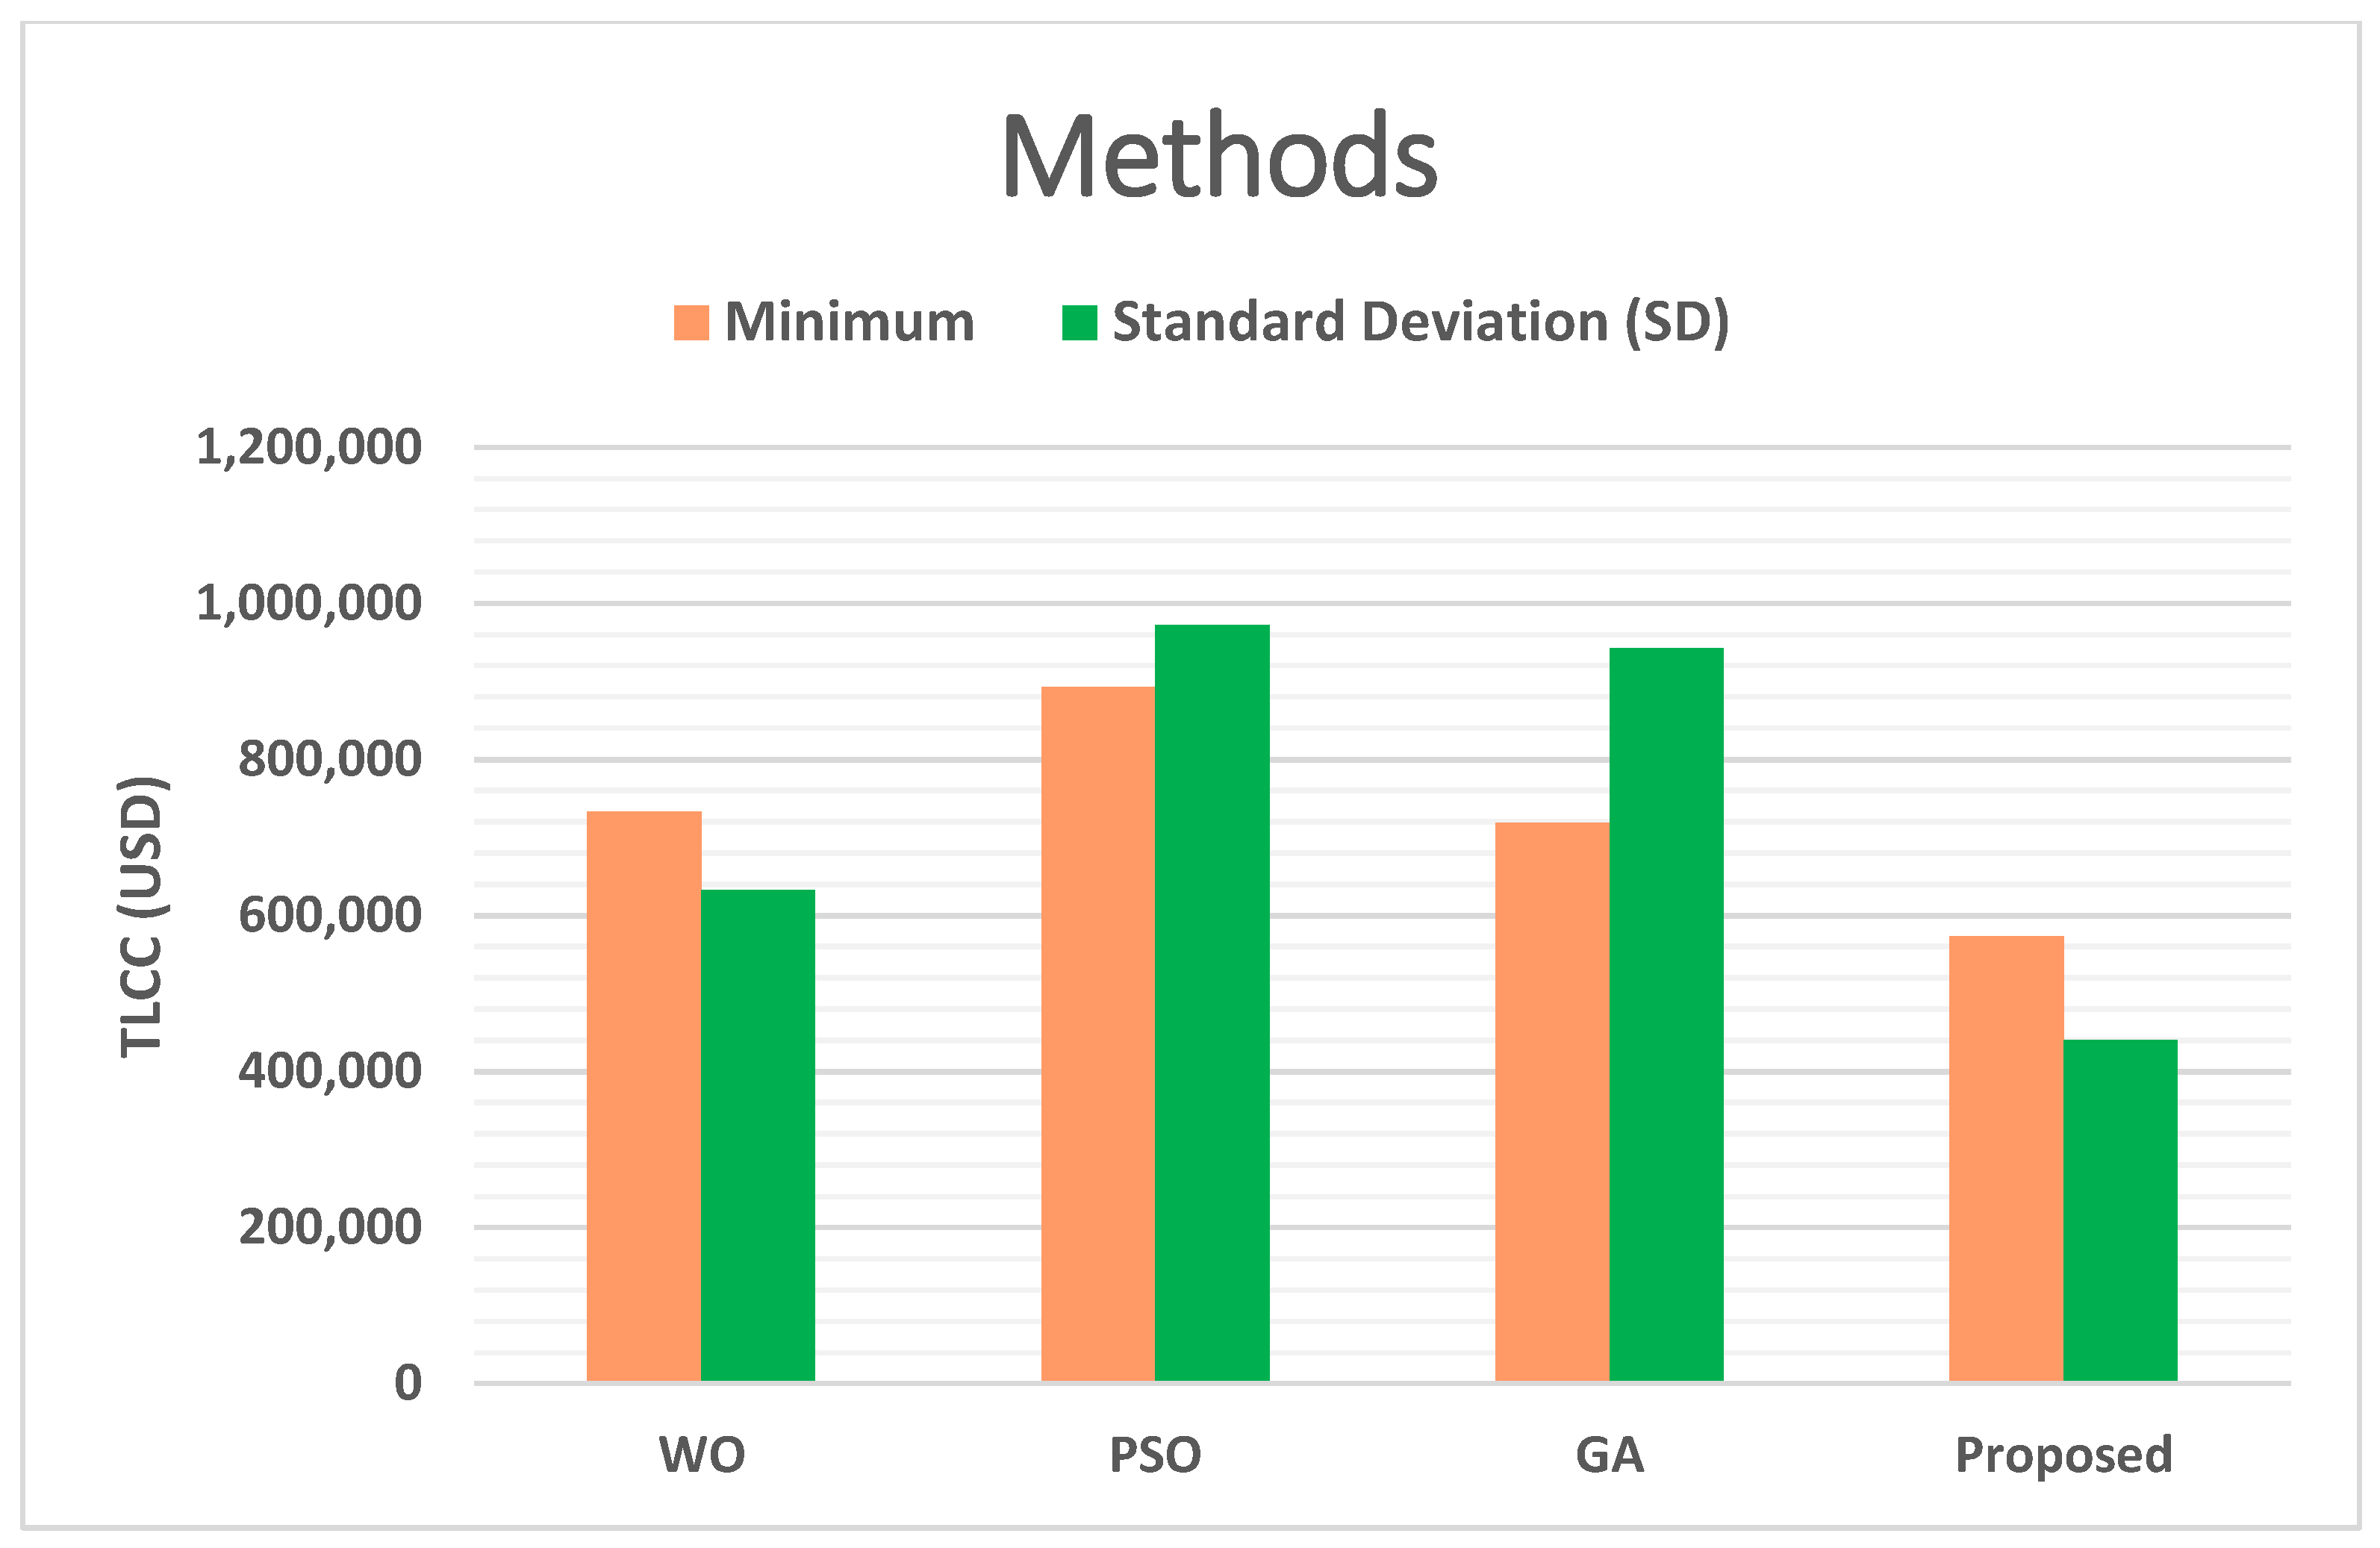
The comparison of TLCC for solar/wind/battery/ROD is plotted in Figure 3. which represents the gained TLCC rate of WO, PSO, GA, and the proposed model with minimum and standard deviation TLCC cost.
The methods such as PSO, GA, WO, and the proposed method are selected. The methods such as WO, PSO, GA, and the proposed model offer USD 732,319, USD 892,322, USD 717,892, and USD 572,590 results for minimum TLCC. The methods such as WO, PSO, GA, and the proposed model offer USD 952,952, USD 942,083, USD 972,394, and USD 631,952 results for TLCC standard deviation. The proposed method offers a lesser cost than the previous method.
The comparison of TLCC concerning wind/battery/ROD is represented in Table 2. Methods such as PSO, GA, WO, and the proposed technique are chosen. Results from approaches such as WO, PSO, GA, and the proposed model are USD 1,527,834, USD 1,423,124, USD 1,232,121, and USD 1,141,010 respectively for minimum TLCC. Methods such as WO, PSO, GA, and the proposed model offer USD 1,854,372, USD 1,943,032, USD 1,696,384 and USD 1,563,900 results for TLCC standard deviation. The suggested method is less expensive than the earlier methods.
Table 3 describes the comparison of TLCC for solar/battery/ROD. PSO, GA, WO, and the suggested approach are the methods chosen. USD 650,804, USD 823,184, USD 446,171, and USD 353,210, respectively, are the results from methods such as WO, PSO, GA, and the proposed model for minimum TLCC. The methods such as WO, PSO, GA, and the proposed model offer USD 854, 372, USD 943, 032, USD 106,384, and USD 663,900 results for TLCC standard deviation. The suggested approach is more affordable than the alternatives.
  • CPU time
The comparative result of CPU time result is shown in Table 4 as a result in seconds. Here, we have applied a variety of previous techniques, including the proposed method, genetic algorithm (GA), particle swarm optimization (PSO), and whale optimization (WO). According to Table 2, the proposed technique gives a CPU time in seconds that provides a minimum of 34.21 s, a maximum of 40.23 s, and a mean of 38.10 s in CPU time. In comparison to earlier methods such as WO, PSO, and GA, the proposed method has lower life CPU time results.
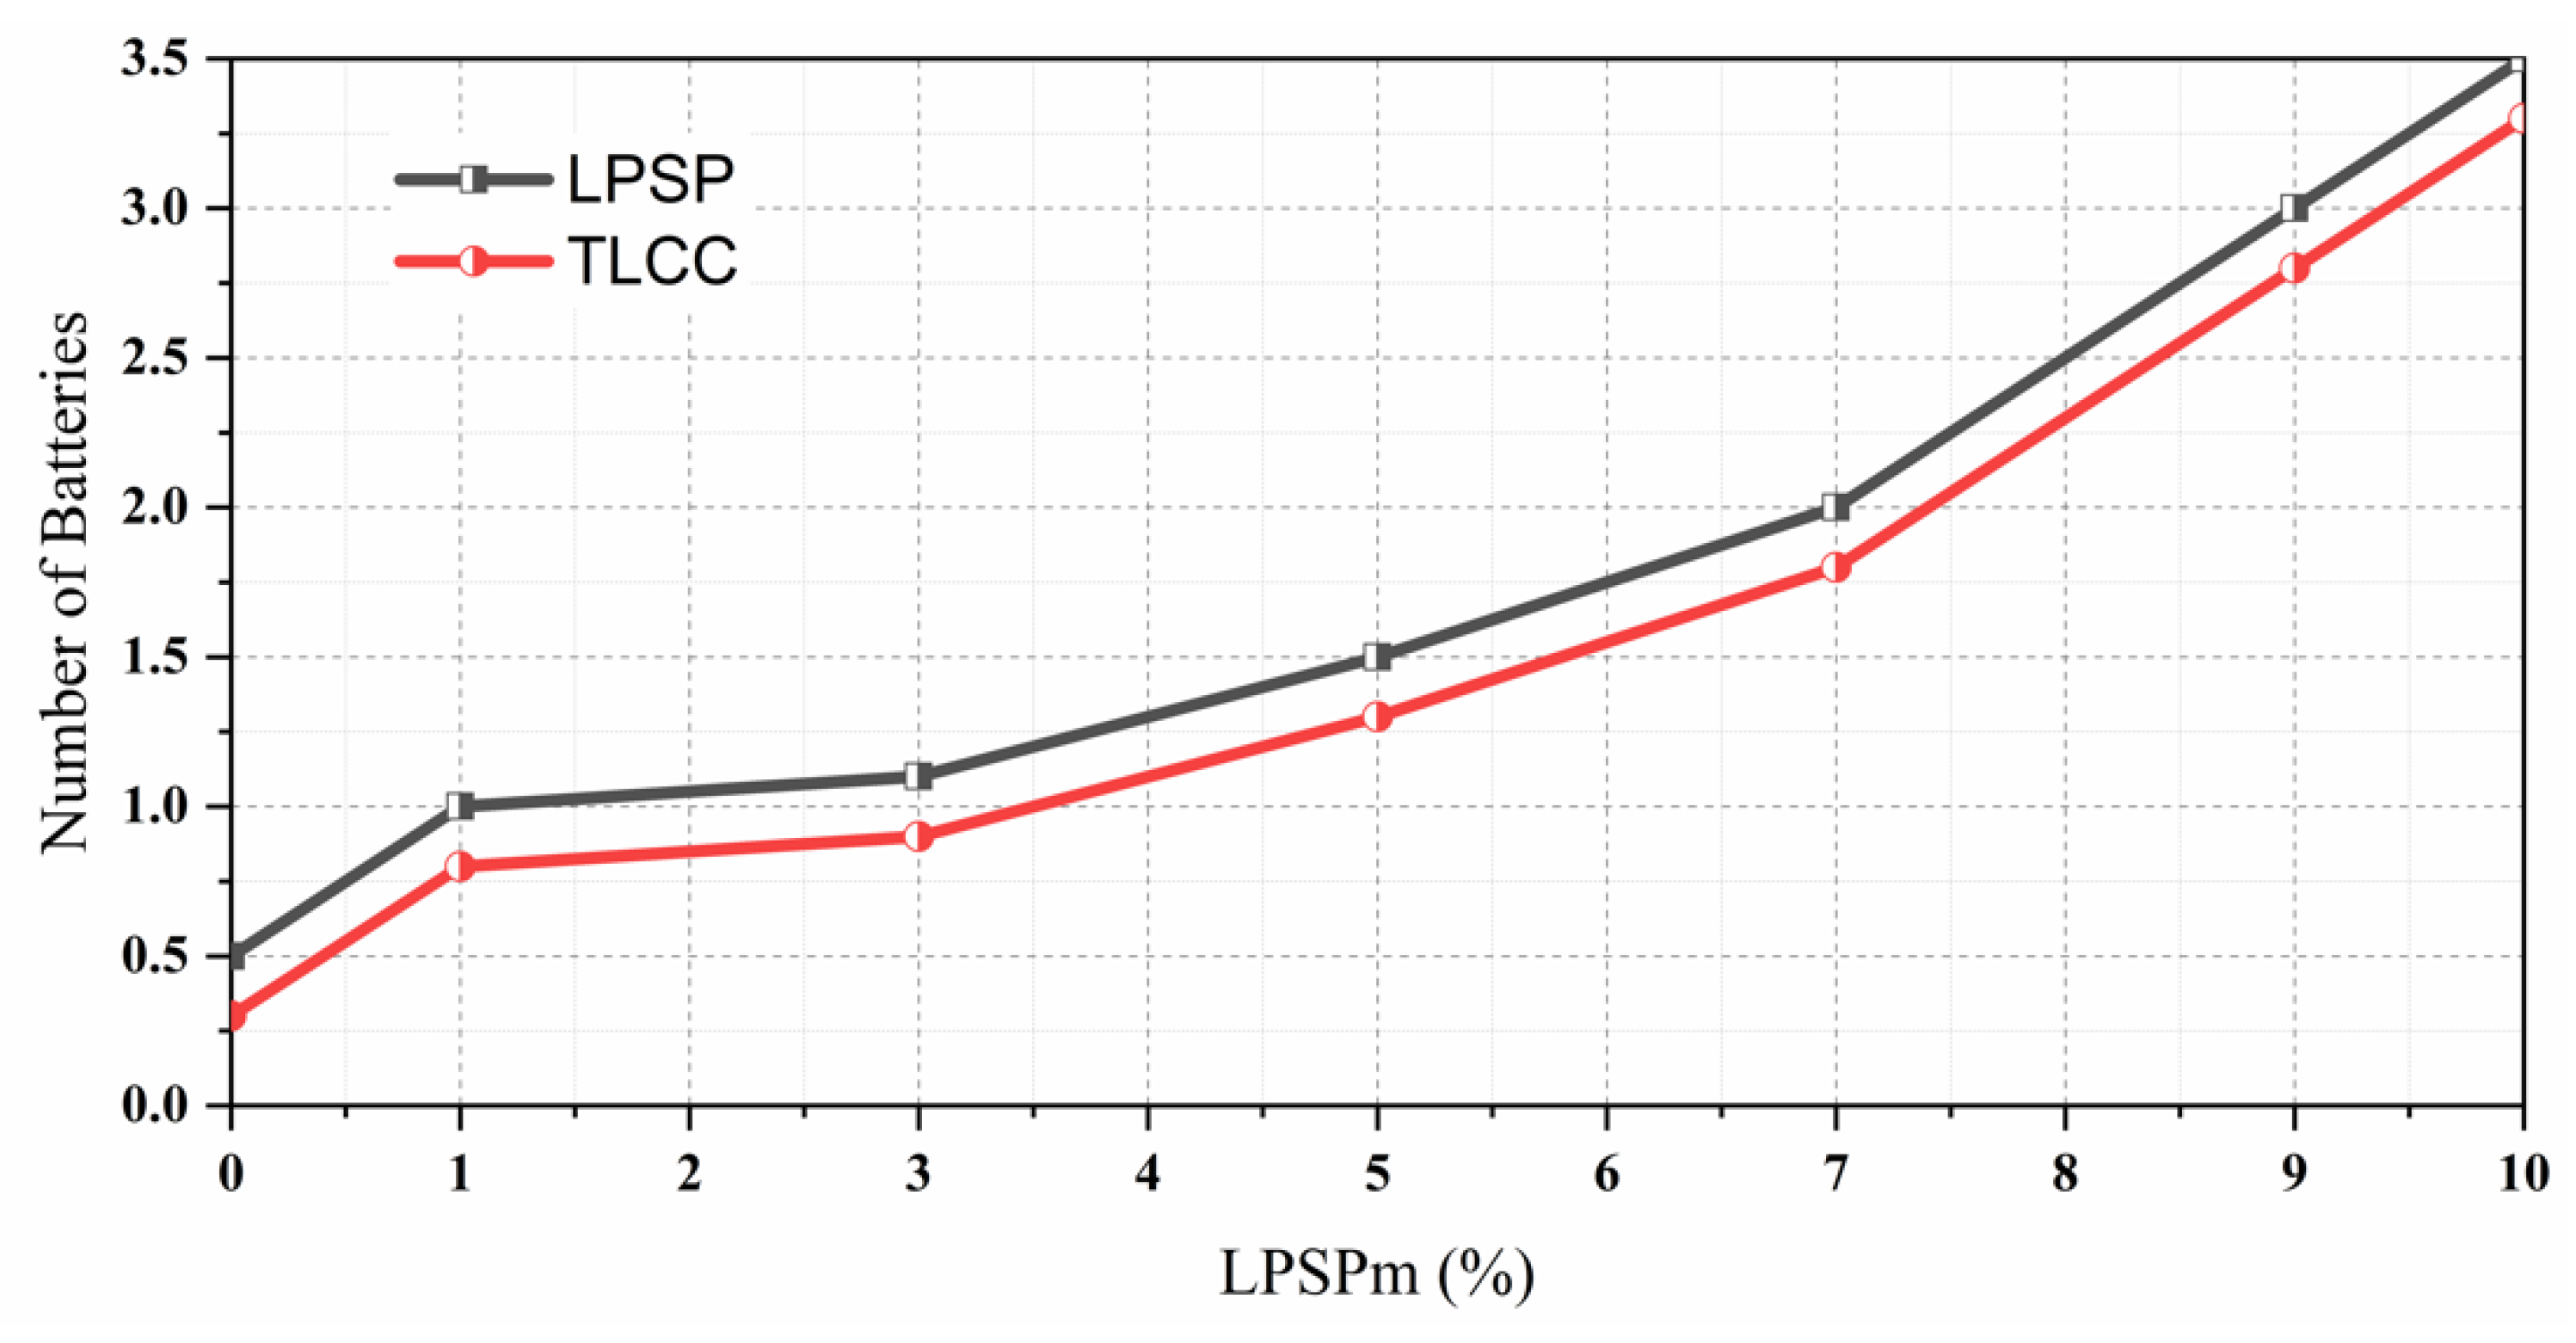
The comparative result of an optimized hybrid ROD system/battery/solar to various loss of power supply probability is plotted in Figure 4. The battery bank provides the residual energy whenever the renewable energy source is unable to supply it but when electricity production is lower than the load demand. In the storage system, store the surplus generation if the load demand is less than the power generation. During the year decreases, both battery losses of power supply probability, as well as the number of batteries, get minimized.
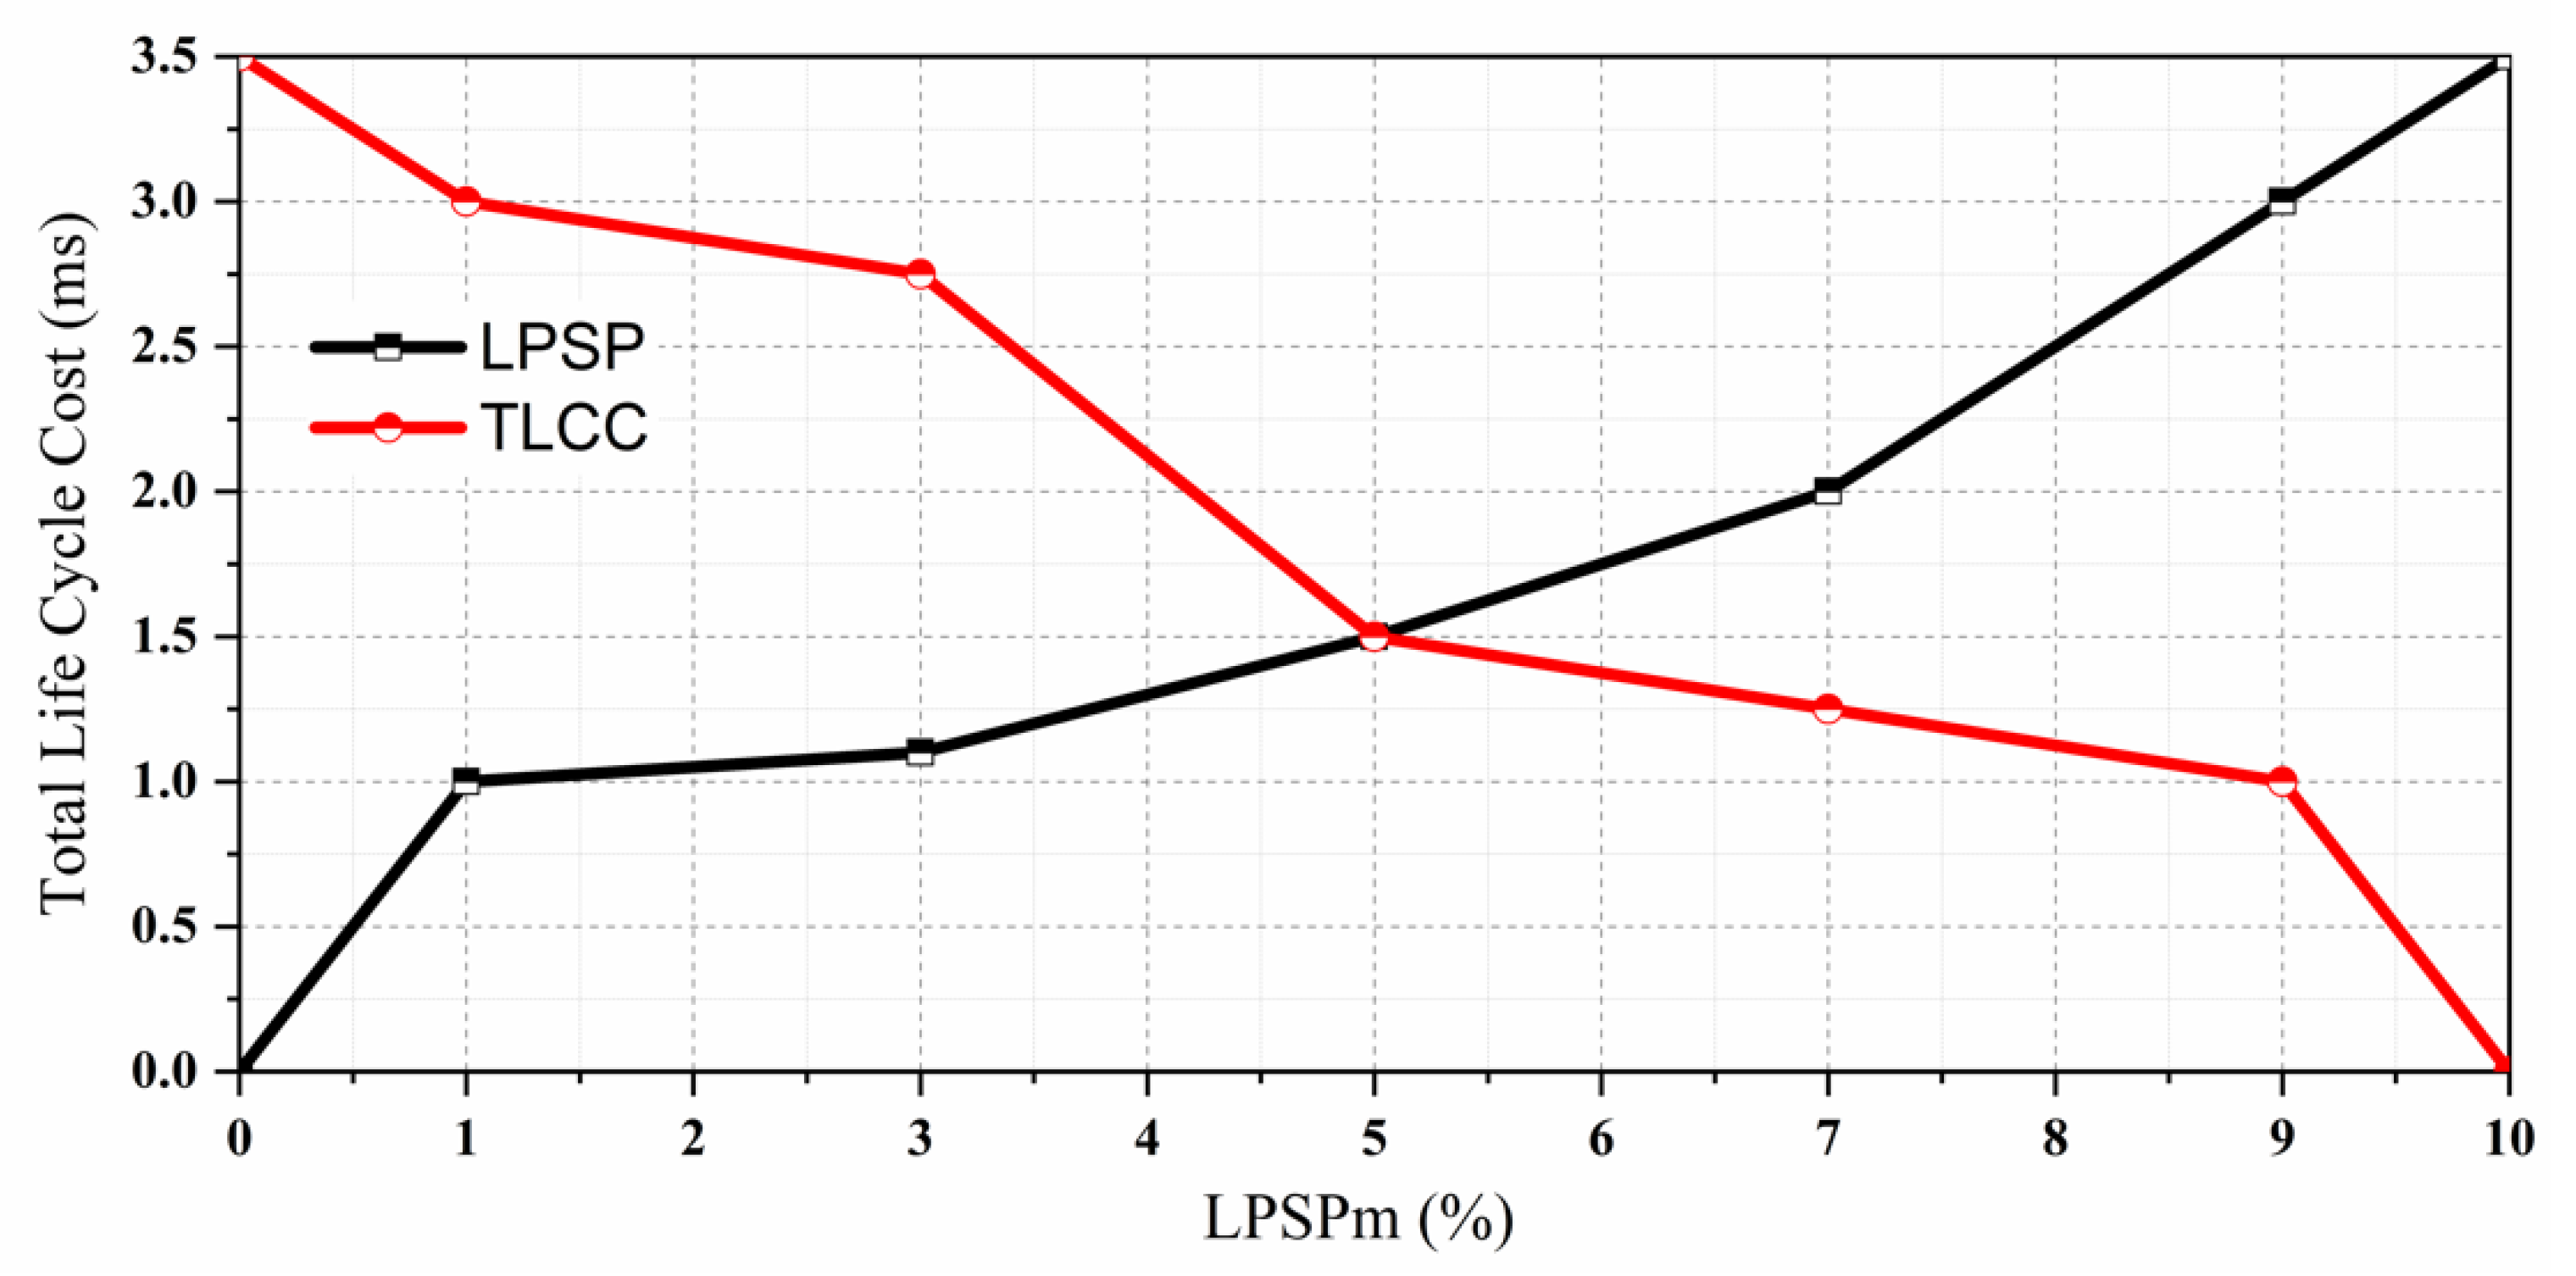
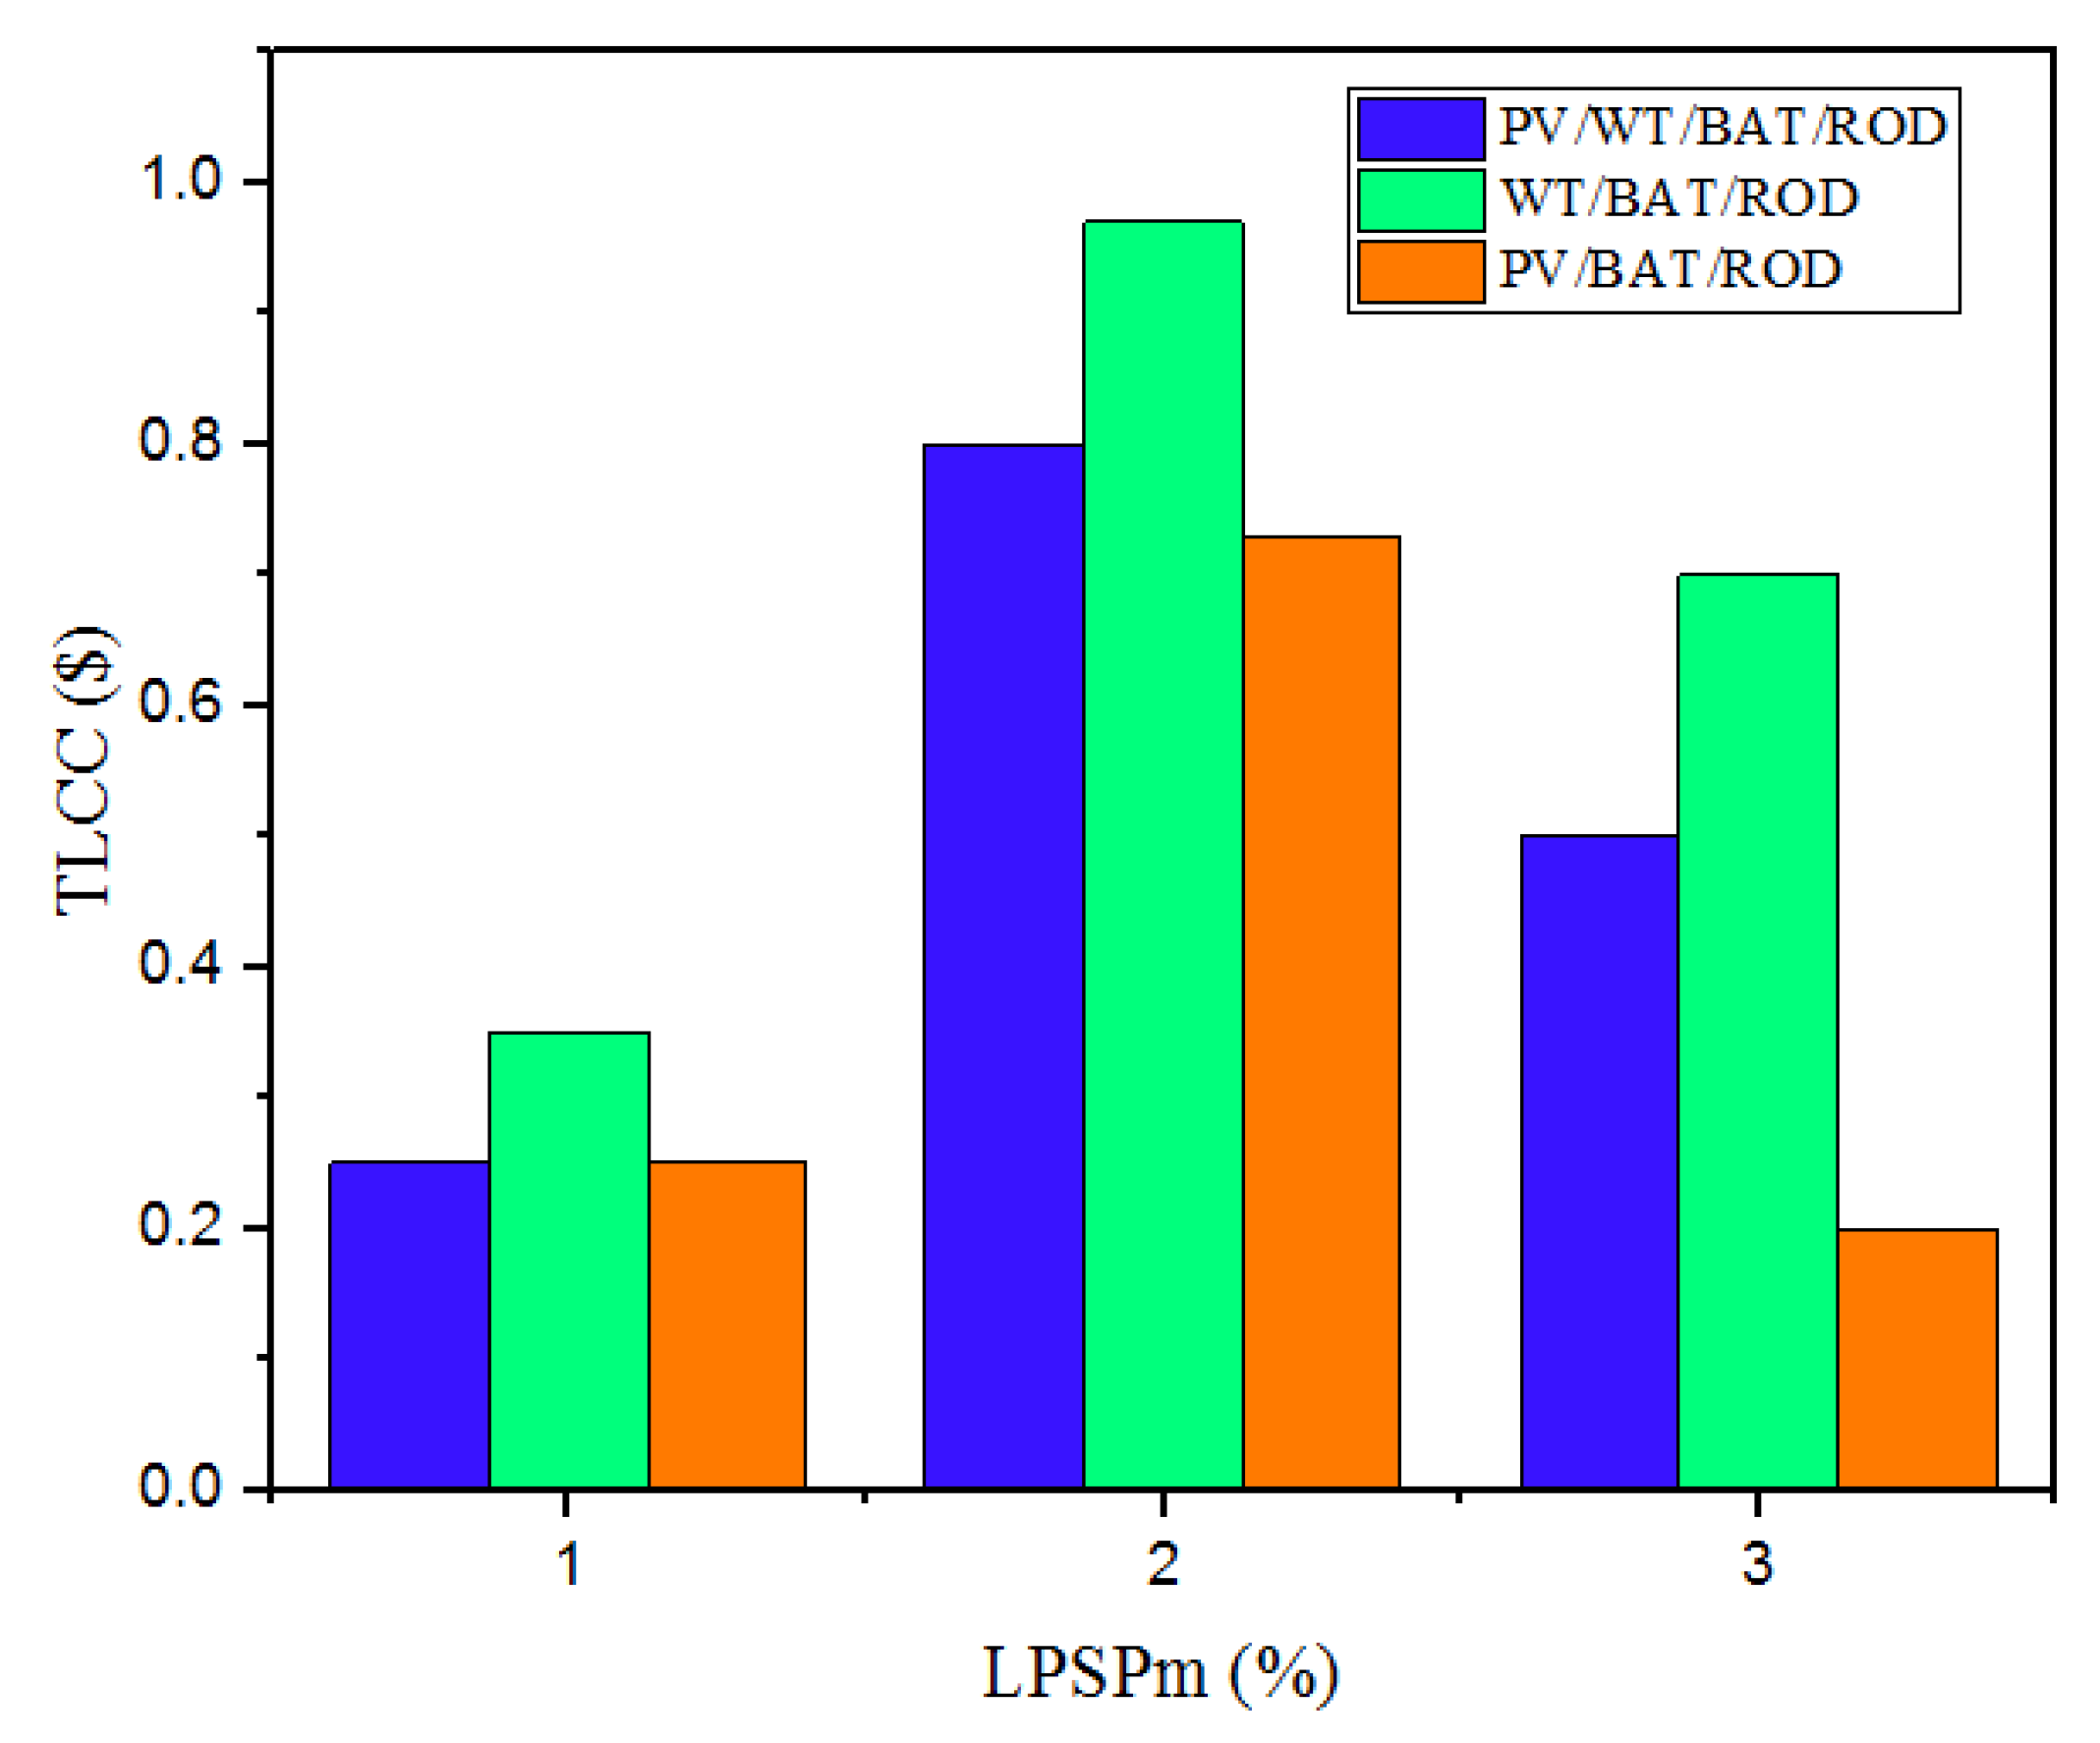
The TLCC and LPSP to various losses of power supply probabilities are plotted in Figure 5 and Figure 6 which plot different loss of power supply probabilities for the system configurations. The relationship between both losses of power supply probability and system configurations is plotted in the following figures. This shows that to give water and load capacity, a bigger photovoltaic area and quantity of battery is also necessary to increase system reliability.
A hybrid energy system based on total life cycle cost (USD) for loss of power supply probability variations is described in Figure 7. The loss of power supply probability variations such as ROD/battery/wind, ROD/battery/solar, and ROD/wind/battery/solar are considered hybrid energy systems. When the hybrid total life cycle cost decreases, the loss of power supply probability variations is increased rapidly.

5. Conclusions

The work in this article is based on the hybrid ROD with the combination of wind and solar energy. The life cycle cost of the battery based on the charging and discharging of the batteries used are analyzed. The life cycle cost of the ROD is also analyzed and also various continuous and discrete decision variables are considered to achieve the optimized hybrid ROD system. this has been achieved with the proposed HCRS approach and the minimization of LCC is utilized to estimate the feasibility of the available renewable resources. The reliability of the proposed system has been achieved with the inclusion of LPSP. Experimental analyses were performed in the MATLAB tool and analyzed different parameters and compared with state-of-art works. Our proposed work provides better reliability and minimized LCC to a great extent.

Author Contributions

Conceptualization, M.A.B. and V.V.K.; methodology, M.A.B.; software, I.I.; validation, I.D., A.K.V. and B.S.; formal analysis, V.V.K.; investigation, M.A.B.; resources, I.D.; data curation, B.S.; writing—original draft preparation, M.A.B. and V.V.K.; writing—review and editing, M.A.B., I.I. and V.V.K.; visualization, I.D.; supervision, I.I.; project administration, V.V.K.; funding acquisition, I.D. All authors have read and agreed to the published version of the manuscript.

Funding

This research received no external funding.

Data Availability Statement

The data analyzed in this study is in the paper.

Conflicts of Interest

The authors declare no conflict of interest.

References

  1. Hlalele, T.G.; Naidoo, R.M.; Zhang, J.; Bansal, R.C. Dynamic Economic Dispatch With Maximal Renewable Penetration Under Renewable Obligation. IEEE Access 2020, 8, 38794–38808. [Google Scholar] [CrossRef]
  2. Alam, S.; Al-Ismail, F.S.; Salem, A.; Abido, M.A. High-Level Penetration of Renewable Energy Sources Into Grid Utility: Challenges and Solutions. IEEE Access 2020, 8, 190277–190299. [Google Scholar] [CrossRef]
  3. Rehman, W.U.; Bhatti, A.R.; Awan, A.B.; Sajjad, I.A.; Khan, A.A.; Bo, R.; Haroon, S.S.; Amin, S.; Tlili, I.; Oboreh-Snapps, O. The Penetration of Renewable and Sustainable Energy in Asia: A State-of-the-Art Review on Net-Metering. IEEE Access 2020, 8, 170364–170388. [Google Scholar] [CrossRef]
  4. Schefer, H.; Fauth, L.; Kopp, T.H.; Mallwitz, R.; Friebe, J.; Kurrat, M. Discussion on Electric Power Supply Systems for All Electric Aircraft. IEEE Access 2020, 8, 84188–84216. [Google Scholar] [CrossRef]
  5. Yu, S.S.; Guo, J.; Chau, T.K.; Fernando, T.L.; Iu, H.H.-C.; Trinh, H. An Unscented Particle Filtering Approach to Decentralized Dynamic State Estimation for DFIG Wind Turbines in Multi-Area Power Systems. IEEE Trans. Power Syst. 2020, 35, 2670–2682. [Google Scholar] [CrossRef]
  6. Atif, A.; Khalid, M. Saviztky–Golay Filtering for Solar Power Smoothing and Ramp Rate Reduction Based on Controlled Battery Energy Storage. IEEE Access 2020, 8, 33806–33817. [Google Scholar] [CrossRef]
  7. Irfan, M.; Zhao, Z.-Y.; Panjwani, M.K.; Mangi, F.H.; Li, H.; Jan, A.; Ahmad, M.; Rehman, A. Assessing the energy dynamics of Pakistan: Prospects of biomass energy. Energy Rep. 2019, 6, 80–93. [Google Scholar] [CrossRef]
  8. Yu, L.; Sun, Y.; Xu, Z.; Shen, C.; Yue, D.; Jiang, T.; Guan, X. Multi-Agent Deep Reinforcement Learning for HVAC Control in Commercial Buildings. IEEE Trans. Smart Grid 2020, 12, 407–419. [Google Scholar] [CrossRef]
  9. Chawda, G.S.; Shaik, A.G.; Mahela, O.P.; Padmanaban, S.; Holm-Nielsen, J.B. Comprehensive Review of Distributed FACTS Control Algorithms for Power Quality Enhancement in Utility Grid With Renewable Energy Penetration. IEEE Access 2020, 8, 107614–107634. [Google Scholar] [CrossRef]
  10. Mostafa, M.; Abdullah, H.M.; Mohamed, M.A. Modeling and Experimental Investigation of Solar Stills for Enhancing Water Desalination Process. IEEE Access 2020, 8, 219457–219472. [Google Scholar] [CrossRef]
  11. Oikonomou, K.; Parvania, M. Optimal Coordinated Operation of Interdependent Power and Water Distribution Systems. IEEE Trans. Smart Grid 2020, 11, 4784–4794. [Google Scholar] [CrossRef]
  12. Subahi, A.F.; Bouazza, K.E. An intelligent IoT-based system design for controlling and monitoring greenhouse temperature. IEEE Access 2020, 8, 125488–125500. [Google Scholar] [CrossRef]
  13. Mohamed, M.A.; Almalaq, A.; Awwad, E.M.; El-Meligy, M.A.; Sharaf, M.; Ali, Z.M. An Effective Energy Management Approach within a Smart Island Considering Water-Energy Hub. IEEE Trans. Ind. Appl. 2020, 1. [Google Scholar] [CrossRef]
  14. Semshchikov, E.; Negnevitsky, M.; Hamilton, J.M.; Wang, X. Cost-Efficient Strategy for High Renewable Energy Penetration in Isolated Power Systems. IEEE Trans. Power Syst. 2020, 35, 3719–3728. [Google Scholar] [CrossRef]
  15. Atallah, M.O.; Farahat, M.; Lotfy, M.E.; Senjyu, T. Operation of conventional and unconventional energy sources to drive a reverse osmosis desalination plant in Sinai Peninsula, Egypt. Renew. Energy 2019, 145, 141–152. [Google Scholar] [CrossRef]
  16. Wang, Q.; Liu, J.; Hu, Y.; Zhang, X. Optimal Operation Strategy of Multi-Energy Complementary Distributed CCHP System and its Application on Commercial Building. IEEE Access 2019, 7, 127839–127849. [Google Scholar] [CrossRef]
  17. Ouammi, A.; Achour, Y.; Zejli, D.; Dagdougui, H. Supervisory Model Predictive Control for Optimal Energy Management of Networked Smart Greenhouses Integrated Microgrid. IEEE Trans. Autom. Sci. Eng. 2019, 17, 117–128. [Google Scholar] [CrossRef]
  18. Poudel, B.; Gokaraju, R. Optimal Operation of SMR-RES Hybrid Energy System for Electricity & District Heating. IEEE Trans. Energy Convers. 2021, 36, 3146–3155. [Google Scholar]
  19. Baseer, M.A.; Alsaduni, I.; Zubair, M. A Novel Multi-Objective Based Reliability Assessment in Saudi Arabian Power System Arrangement. IEEE Access 2021, 9, 97822–97833. [Google Scholar] [CrossRef]
  20. Baseer, M.A.; Alsaduni, I.; Zubair, M. Novel Hybrid Optimization Maximum Power Point Tracking and Normalized Intelligent Control Techniques for Smart Grid Linked Solar Photovoltaic System. Energy Technol. 2021, 9, 2000980. [Google Scholar] [CrossRef]
  21. Zubair, M.; Awan, A.B.; Praveen, R.P.; Baseer, M.A. Solar energy export prospects of the kingdom of saudi arabia. J. Renew. Sustain. Energy 2019, 11, 045902. [Google Scholar] [CrossRef]
  22. Praveen, R.P.; Abdul Baseer, M.; Awan, A.; Zubair, M. Performance analysis and optimization of a parabolic trough solar power plant in the middle east region. Energies 2018, 11, 741. [Google Scholar] [CrossRef] [Green Version]
  23. Baseer, M.; Praveen, R.P.; Zubair, M.; Khalil, A.G.A.; Al Saduni, I. Performance and Optimization of Commercial Solar PV and PTC Plants. Int. J. Recent Technol. Eng. 2020, 8, 1703–1714. [Google Scholar] [CrossRef]
  24. Zubair, M.; Awan, A.B.; Baseer, M.A.; Khan, M.N.; Abbas, G. Optimization of parabolic trough based concentrated solarpower plant for energy export from Saudi Arabia. Energy Rep. 2021, 7, 4540–4554. [Google Scholar] [CrossRef]
  25. Alhaj, M.; Al-Ghamdi, S.G. Integrating concentrated solar power with seawater desalination technologies: A multi-regional environmental assessment. Environ. Res. Lett. 2019, 14, 074014. [Google Scholar] [CrossRef]
  26. Alqaed, S.; Mustafa, J.; Almehmadi, F. Design and Energy Requirements of a Photovoltaic-Thermal Powered Water Desalination Plant for the Middle East. Int. J. Environ. Res. Public Health 2021, 18, 1001. [Google Scholar] [CrossRef]
  27. Ershad, A.M.; Brecha, R.J.; Hallinan, K. Analysis of solar photovoltaic and wind power potential in Afghanistan. Renew. Energy 2016, 85, 445–453. [Google Scholar] [CrossRef]
  28. Al-Dousari, A.; Al-Nassar, W.; Al-Hemoud, A.; Alsaleh, A.; Ramadan, A.; Al-Dousari, N.; Ahmed, M. Solar and wind energy: Challenges and solutions in desert regions. Energy 2019, 176, 184–194. [Google Scholar] [CrossRef]
  29. Hlal, M.I.; Ramachandaramurthy, V.K.; Sarhan, A.; Pouryekta, A.; Subramaniam, U. Optimum battery depth of discharge for off-grid solar PV/battery system. J. Energy Storage 2019, 26, 100999. [Google Scholar] [CrossRef]
  30. Ortiz, X.; Rival, D.; Wood, D. Forces and Moments on Flat Plates of Small Aspect Ratio with Application to PV Wind Loads and Small Wind Turbine Blades. Energies 2015, 8, 2438–2453. [Google Scholar] [CrossRef] [Green Version]
  31. Magnor, D.; Sauer, D.U. Optimization of PV Battery Systems Using Genetic Algorithms. Energy Procedia 2016, 99, 332–340. [Google Scholar] [CrossRef]
  32. Krishna, H.J. Introduction to desalination technologies. Tex. Water Dev. 2004, 2, 1–7. [Google Scholar]
  33. Spiegler, K.; El-Sayed, Y. The energetics of desalination processes. Desalination 2001, 134, 109–128. [Google Scholar] [CrossRef]
  34. Ramu, S.; Ranganathan, R.; Ramamoorthy, R. Capuchin search algorithm based task scheduling in cloud computing environment. Yanbu J. Eng. Sci. 2022, 19, 18–29. [Google Scholar] [CrossRef]
  35. Wu, Z.; Chen, T.; Wang, H.; Shi, H.; Li, M. Investigate aerodynamic performance of wind turbine blades with vortex generators at the transition area. Wind Eng. 2022, 46, 615–629. [Google Scholar] [CrossRef]
  36. Braik, M.; Sheta, A.; Al-Hiary, H. A novel meta-heuristic search algorithm for solving optimization problems: Capuchin search algorithm. Neural Comput. Appl. 2020, 33, 2515–2547. [Google Scholar] [CrossRef]
  37. Ma, Y.; Zhao, F.; Hao, H.; Liu, Z. Life-Cycle Cost Analysis of Low-Speed Electric Vehicles Using Different Kinds of Battery Technologies Based on Chinese Market. In Proceedings of the International Conference on Applied Energy, Västerås, Sweden, 12–15 August 2019; p. 4. [Google Scholar]
  38. Dhiman, G.; Garg, M.; Nagar, A.; Kumar, V.; Dehghani, M. A novel algorithm for global optimization: Rat Swarm Optimizer. J. Ambient. Intell. Humaniz. Comput. 2020, 12, 8457–8482. [Google Scholar] [CrossRef]
  39. Tamilarasan, A.; Renugambal, A.; Vijayan, D. Parametric estimation for AWJ cutting of Ti-6Al-4V alloy using Rat swarm optimization algorithm. Mater. Manuf. Process. 2022, 37, 1871–1881. [Google Scholar] [CrossRef]
  40. Mirjalili, S.; Lewis, A. The whale optimization algorithm. Adv. Eng. Softw. 2016, 95, 51–67. [Google Scholar] [CrossRef]
  41. Bansal, J.C. Particle Swarm Optimization. In Evolutionary and Swarm Intelligence Algorithms; Springer: Cham, Switzerland, 2019; pp. 11–23. [Google Scholar]
  42. Mirjalili, S. Genetic Algorithm. In Evolutionary Algorithms and Neural Networks; Springer: Cham, Switzerland, 2019; pp. 43–55. [Google Scholar]
Figure 1. Proposed overlay of the hybrid energy system.
Energies 16 00713 g001
Figure 2. Flow chart representation of hybrid CRS algorithm.
Energies 16 00713 g002
Figure 3. Comparison of TLCC (minimum and SD) for solar/wind/battery/ROD.
Energies 16 00713 g003
Figure 4. The comparative result of an optimized hybrid ROD system/battery/solar to various loss of power supply probability.
Energies 16 00713 g004
Figure 5. The TLCC and LPSP to various loss of power supply probability.
Energies 16 00713 g005
Figure 6. Various loss of power supply probability for the system configurations.
Energies 16 00713 g006
Figure 7. Hybrid energy system-based total life cycle cost (USD) for loss of power supply probability variations.
Energies 16 00713 g007
Table 1. Comparative results of total life cycle cost.
MethodsTotal Life Cycle Cost (USD)
MinimumMaximumStandard Deviation (SD)Mean
WO325,3431,423,423241,8811,231,910
PSO302,1231,532,452202,3211,613,808
GA337,1631,614,552210,5321,432,723
Proposed202,3021,523,134123,4541,213,823
Table 2. Comparison of TLCC for wind/battery/ROD.
MethodsTLCC (USD)
MinimumStandard Deviation
WO1,527,8341,854,372
PSO1,423,1241,943,032
GA1,232,1211,696,384
Proposed1,141,0101,563,900
Table 3. Comparison of TLCC for solar/battery/ROD.
MethodsTLCC (USD)
MinimumStandard Deviation
WO650,804854,372
PSO823,184943,032
GA446,171106,384
Proposed353,210663,900
Table 4. Comparative results of CPU time in seconds.
MethodsCPU Time in Seconds
MinimumMaximumMean
WO35.4550.1242.34
PSO39.3252.6740.26
GA37.3248.2345.32
Proposed34.2140.2338.10
Disclaimer/Publisher’s Note: The statements, opinions and data contained in all publications are solely those of the individual author(s) and contributor(s) and not of MDPI and/or the editor(s). MDPI and/or the editor(s) disclaim responsibility for any injury to people or property resulting from any ideas, methods, instructions or products referred to in the content.