Abstract
In a proton exchange membrane fuel cell (PEMFC) system, proper management of water and heat transport is essential to improve its overall performance and durability. To comprehensively investigate the internal processes of PEMFCs, an improved two-phase non-isothermal model based on heat and water transfer mechanisms inside the fuel cell is developed. The results show that the model proposed in this work can predict the fuel cell’s performance accurately and is capable of exploring water and heat transfer phenomena inside fuel cells. Additionally, the water and heat transfer of cathodes and anodes under different relative humidity and temperatures are studied. It can be concluded that when the PEMFC operates under a constant voltage, the anode water content gradually increases, while the cathode water content gradually decreases. The maximum water content occurs at the interface between cathode catalyst layer and cathode gas diffusion layer, while the minimum value is attained at the interface between anode catalyst layer and anode gas diffusion layer. When the fuel cell operates at 0.75 V, although the water content of CCL is the highest, no back-diffusion of dissolved water occurs.
1. Introduction
The proton exchange membrane fuel cell (PEMFC) has been regarded as one of the most promising power sources for future green energy automobiles due to its high energy conversion efficiencies, quick start response, and zero emission [1,2,3]. As shown in Figure 1 [4], PEMFC consumes hydrogen and oxygen to produce electricity, heat, and water through electrochemical reactions during operation. In a typical single PEMFC, a proton exchange membrane (PEM) is sandwiched between anode and cathode, which allows only the cross-membrane transport of protons and water [5]. On the anode side, hydrogen in the gas channel diffuses through the anode gas diffusion layer (AGDL) to the anode catalyst layer (ACL). In ACL, hydrogen splits into protons and electrons under the catalysis of platinum during the hydrogen oxidation reaction (HOR). The protons travel to the cathode catalyst layer (CCL) through PEM, while the electrons pass through an external circuit to the cathode, which generates electricity. Meanwhile, in the cathode side, air in the gas channel diffuses through the cathode gas diffusion layer (CGDL) to the cathode catalyst layer (CCL), where oxygen reacts with the protons and electrons from HOR during the oxygen reduction reaction (ORR), producing water and heat. The overall electrochemical reaction can be simply described by the interaction generating water, heat and electrical energy between hydrogen and oxygen.
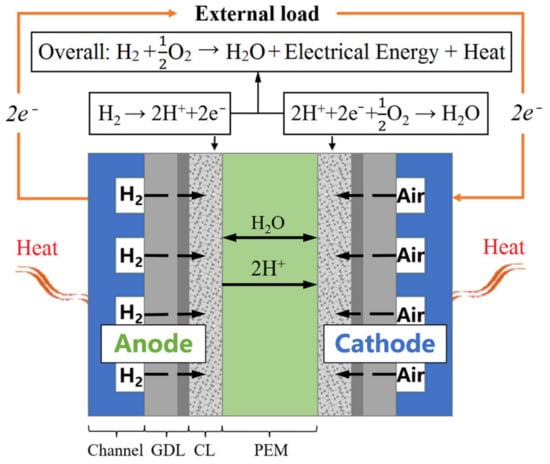
Figure 1.
Schematic diagram of a single PEMFC [4].
A major challenge that affects the performance of PEMFC is the management of water and heat transport. In order to optimize its overall performance and durability, the internal water and heat transfer should be regulate appropriately [6]. If the produced water cannot be blown out in time, the gas transportation will be hindered and flooding and gas starvation will possibly occur. These will cause the uneven distribution of local current density and the reversal of electrode polarity, which will eventually lead to the decline of output performance and durability [7]. If the produced large amount of heat cannot be dissipated effectively, an uneven temperature distribution inside the PEMFC may bring about local hot spots, dehydrate PEM, and lower its proton conductivity. Moreover, the catalyst inside cannot achieve the best activity at very low temperature [8]. Once there are huge temperature differences between internal and external single cells, voltage uniformity of the stack will be strongly affected, leading to poor performance [9]. Consequently, the water and heat management is crucial to improve the performance, reliability and durability of PEMFCs.
Numerical modeling is always an important method for studying complex physical and chemical phenomena inside the PEMFC. Currently, PEMFC models concerned with water and heat management can generally be divided into three-dimension, one-dimension and zero-dimension/lumped-parameter model [10,11]. The three-dimensional models can further be classified into homogenous and two-phase models. The gas phase and liquid phase in porous media are regarded as one single uniform phase (or gaseous mixture) in homogenous models. Sinha et al. [12] established a three-dimensional homogeneous model to study the water distribution characteristics during a PEMFC stack’s shutdown purging process. Jiang and Wang [13] developed a three-dimensional transient model to investigate the liquid water formation, accumulation and transport in gas channels of a PEMFC. Instead, two-phase models solve two phases separately, and the interaction between two phases are represented by source terms and a ratio of gas velocity to liquid velocity in governing equations. Based on the two-phase flow principle, Takallo et al. [14] developed a steady-state single-phase three-dimensional model to prove that increasing the humidity of both anode and cathode inlet gases leads to the improvement of PEMFC performance. Higher humidity in anode could prevent the membrane from dehydration, while lower humidity in cathode could avoid flooding. Zhang et al. [15] proposed a non-isothermal two-phase three-dimensional model to simulate the temperature distribution and liquid water transport process in PEMFCs. They concluded that the optimal working temperature is close to 80 °C. When exceeding the critical value, rising temperature would dehydrate PEM and increase the proton transfer resistance. Furthermore, when the relative humidity in cathode is high, the PEMFC will be flooded, causing air starvation and performance degradation. Due to the importance of water and temperature distribution in PEMFC, water and thermal management is critical to improve PEMFC’s performance.
Three-dimensional models have the advantages of high precision, convenient post-processing and intuitive results [16]. However, three-dimensional modeling costs a lot of computing power and time because of the large number of grids. In recent years, one-dimensional PEMFC models have drawn much attention because they can reveal actual internal physical and chemical processes with relatively high calculation efficiency and expansibility. Rakhshanpouri and Rowshanzamir [17] built a seven-layer non-isothermal steady-state model to study the influences of various factors on water transportation. In order to simplify the complexity of the model, Liso et al. [6] proposed a steady-state zero-dimensional model considering the water adsorption/desorption process in PEM. Hu et al. [18] adopted a one-dimensional two-phase isothermal model and applied the infinite phase change rate assumption to solve two-phase problems in porous layers. Nalbant et al. [19] built a one-dimensional, stead-state model using empirical data obtained from the experiments. They furtherly studied the performance of a high temperature PEMFC under different operating temperatures, Pt loadings, percentages of phosphoric acid and binders. Jiang et al. [20] developed a one-dimensional two-phase non-isothermal analytical model and revealed how to conduct analysis of parameter sensitivity.
Although a lot of researchers have been done to develop PEMFC models, there are three major deficiencies: three-dimensional models tend to consume substantial time and computing resources; lumped-parameter and one-dimensional models simplify certain electrochemical and physical mechanisms; comprehensive considerations of water, heat and gas transferring in PEMFC models are inadequate. Therefore, an improved one-dimensional two-phase non-isothermal model was proposed for this study. In order to comprehensively investigate variations of the water and heat distribution in a dominating through-plane transport process, gases’ diffusion, liquid and dissolved water transport, phase-change between liquid water and water vapor and heat conduction were taken into account in this model. Variations of the water and heat distribution in dominating through-plane transport processes were investigated under several working conditions of different relative humidities and temperatures. The thermal effects such as water phase-change induced flow, distribution of water vapor and concentration of saturated vapor were also presented as the result from exploring the relationship between the operating strategies and the cell performance. Based on this light-weighted model, sensitivity analysis of PEMFC operating strategies in both anode and cathode would provide an efficient and simple way to obtain rational information. Thus, with the valuable guidance from the model, proper combinations of the inlet relative humidity and operating temperate for seeking the optimum output performance, and mitigating the degradation in the PEMFC system can be determined.
2. Model Development
For the purpose of studying internal processes of PEMFCs under various operation conditions, an improved two-phase non-isothermal model was built, as demonstrated in Figure 2. The computational domain of the model is composed of PEM, AGDL, CGDL, ACL and CCL. In this model, the convection process in the direction parallel to PEM, gas species permeation and pressure-driven hydraulic permeation through the PEM are neglected, and the diffusion of gas, heat, liquid and dissolved water in the direction perpendicular to PEM is evaluated. While operating at ambient temperature, the gas phase diffuses in the pores of the gas diffusion layer (GDL) and the GDL is assumed to be isotropic. The catalyst layer (CL) consisting of polymers and platinum-carbon particles is also porous, where diffusion of vapor and dissolved water occurs, and the phase change between them takes place at the surface of polymers. The dissolved water diffuses through PEM, the proton conductivity of which strongly relies on its water content. Because the electrochemical reaction takes place at a cathode, it is necessary to add liquid water transfer into CGDL and CCL, as the liquid water in channels is neglected. Additionally, the water phase change mechanism is triggered by thermal effects and, as shown in Figure 2b, in the relevant direction, the diffusion of gas, liquid and dissolved water are major determinants of its volume. In contrast, convective fluxes have little impact. Therefore, the convection of heat and species can be ignored. In this model, the water content and water saturation are used to characterize the water amount.
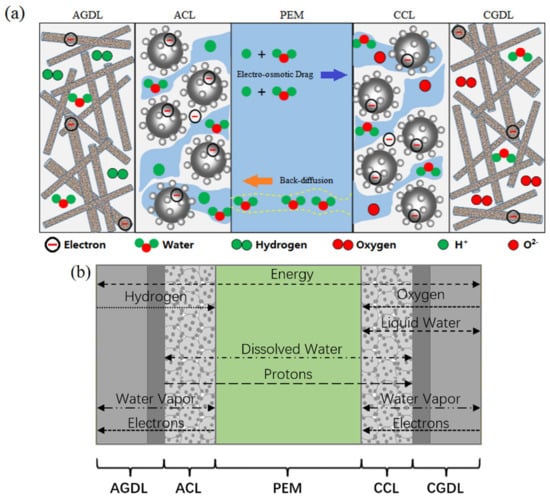
Figure 2.
Schematic of (a) single cell and (b) computational domain.
2.1. Water Content
As shown in Figure 3, the PEM is composed of a hydrophobic polytetrafluoroethylene skeleton attached with sulfonic acid groups (). When the polymer in PEM absorbs water, will combine with free water molecules to become hydrated hydrogen ions. Due to the mutual attraction between and , adjacent will attract each other as well as the hydrated hydrogen ions, thus accomplishing the proton migration. It has to be noted that water in the polymer is also called dissolved water. The wettability level of PEM can be represented by the number of water molecules carried by each , which is also known as water content and can be solved as:
where is the water concentration, (kg∙m−3) is the membrane density and (g∙mol−1) is the membrane’s equivalent weight denoted by [21]:
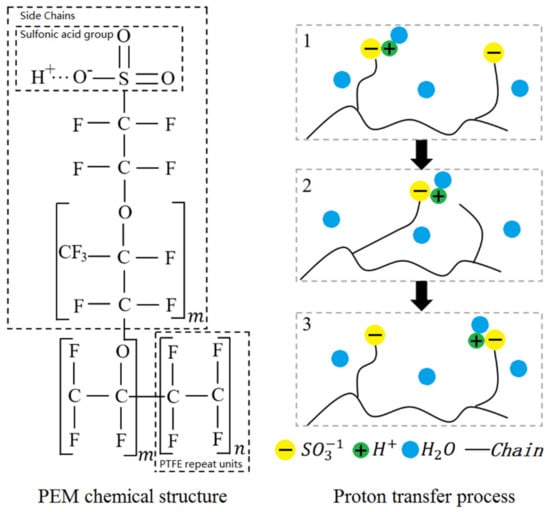
Figure 3.
Schematic of chemical structure for Nafion and proton transfer.
As there are polymers in both ACL and CCL, the definition of water content can also apply. The phase change between water vapor inside pores and dissolved water in the polymer will occur on the surface of CL. To characterize the phase change, the equilibrium water content can be calculated [22] as shown below:
where is the water activity in pores, which can be calculated by the following equation [23]:
where is the mole fraction of water vapor, (Pa) and (Pa) are the pressures of the gaseous mixture and saturated vapor, respectively, and is the volume fraction of liquid water.
According to Equation (3), the relation between the water activity and the equilibrium water content can be obtained. When the gaseous mixture becomes saturated (the water activity reaches 1), the water content of dissolved water will reach 14. When the water activity exceeds 1, water vapor begins to condense into liquid water, and the water content of dissolved water will increase linearly from 14. To ensure the high performance of PEMFC, a higher water content in PEM must be maintained. The specific reason is that low water content in PEM leads to an increase of its ohmic resistance, and the output voltage will be reduced. However, the PEM should not have too much water, so as to prevent cathode from flooding, which will decline the membrane’s durability and reliability.
2.2. Water Saturation
In this study, water saturation is defined as
where (m3/mol) and (m3/mol) are the molar volumes of liquid water and pores in polymers. Before simulations, for the sake of modeling simplicity and computational efficiency, the water saturation at the interface of CGDL and cathode gas channel should be given as a boundary condition, which can be calculated by the fitted relation between capillary pressure and saturation [24]:
where (Pa) represents the capillary pressure and can be calculated with a Young–Laplace equation:
where (N/m) represents the surface tension of water, (°) represents the effective contact angle and (μm) represents the equivalent capillary radius.
2.3. Governing Equations
As shown in Figure 1b, the computational domain is discretized into five parts. The energy equation is solved in each domain, the governing equations of oxygen and liquid water are solved in CGDL and CCL, the governing equations of dissolved water and proton are solved in CCL, ACL and PEM, and the governing equations of water vapor and electron are solved in all domains except for PEM. Those governing equations are explained in further detail below.
2.3.1. Dissolved Water Transport
The governing equation of dissolved water in CL and PEM is described as:
where (m3/mol) is the equivalent volume of polymers, is the Faraday constant, is the electro-osmosis coefficient, (A/cm2) is the proton flux, and (mol/m3∙s−1) is the source term. (m2/s) is the diffusion coefficient of dissolved water in PEM, which can be calculated by revising the Arrhenius equation from the measurement in the experiments [25]:
where is the diffusion coefficient, which is closely related to the hydration state of the PEM, the can be reliably measured by the experiment on a Nafion electrolyte at operating temperature between 30 and 80 °C [26]. The calculation method can be calculated by:
Thus, the dissolved water diffusion coefficient can be obtained by combining Equations (9) and (10):
where and are the fuel cell temperature and the reference temperature.
In ACL, the dissolved water content varies with the phase change. In CCL, water produced by the electrochemical reaction initially exists in the form of dissolved water, and the change of dissolved water content results from the electrochemical reaction and phase change. The source term of dissolved water in ACL, CCL and PEM can be calculated as:
where (A/m3) in the formula means the electrochemical reaction rate and can be obtained by the Butler–Volmer equation [27]:
where, β is transport coefficient of reaction interfacial potential.
2.3.2. Liquid Water Transport
The governing equations of liquid water transport in CCL and CGDL is:
where is the permeability, is the dynamic viscosity, and is the volume of liquid water. The source term can be calculated as:
where (mol/m3∙s−1) and (mol/m3∙s−1) are the source terms of phase change between dissolved water and vapor and that between liquid water and vapor.
2.3.3. Water Vapor Transport
Water vapor diffuses in the porous structure of GDL and CL, and its governing equation can be expressed as:
where (m2/s) is the oxygen diffusion coefficient, and is the oxygen mole fraction. The source term (mol/m3∙s−1) can be described by:
2.3.4. Phase Change
The electrochemical reaction happens at the three-phase boundary composed of polymer, catalyst and gas. The generated water will be absorbed by polymers immediately. When dissolved water becomes equilibrium, it starts to separate from polymers and enters the pores in CL in the form of water vapor [28,29]. (mol/m3∙s−1) can be expressed by:
where (μm) is the thickness of CL, and (m/s) and (m/s) are the vapor absorption rate and dissolved water desorption rate, respectively. is the equilibrium water content, which can be calculated by Equation (3). (mol/m3∙s−1) can be expressed by [30]:
where (1/s) and (1/s) are the evaporation rate of liquid water and condensation rate of water vapor, respectively. is the mole fraction of saturated vapor, which can be calculated as:
where (Pa) is the saturated vapor pressure.
2.3.5. Hydrogen Transport
Hydrogen mole fractions in AGDL and ACL are calculated as:
where (mol/m3) in this formula is gas concentration attained by state equation of idea gas, (m2/s) is the hydrogen diffusion coefficient, and is the hydrogen mole fraction. The source term (mol/m3∙s−1) can be described by:
2.3.6. Oxygen Transport
Oxygen mole fractions in CGDL and CCL are calculated as:
where (m2/s) is the oxygen diffusion coefficient, and is the oxygen mole fraction. The source term (mol/m3∙s−1) can be described by:
2.3.7. Electrochemical Model
In CL and PEM, the electrolyte potential is described as:
where (S/m) in the formula is proton conductivity, and (V) is the potential. (A/m3) is the source term related to electrochemical reaction, which can be calculated as [31]:
Except to the PEM, electrode potential in other domains is described by the following equation:
where (S/m) in the formula is electron conductivity, and (V) is the potential. (A/m3) is the source term related to electrochemical reaction, which can be calculated as [31]:
2.3.8. Energy Conservation Model
The energy equations in each domain are expressed by:
where (W/m∙K−1) is the thermal conductivity, and (W/m3) is the source term. It should be noted that, except for the PEM, other components have ohmic heat terms (W/m3) caused by the resistance impeding electronic conduction and there is a heat loss term (W/m3) caused by proton conduction resistance in the PEM and CL of anode and cathode. Besides, there is a thermal change term (W/m3) caused by the phase transition between dissolved water and water vapor in the cathode catalyst layer, so the source terms of formulas are listed below [32]:
2.4. Boundary Conditions and Computational Process
Proper boundary conditions are crucial to the accuracy of the numerical solution. Ideally, no gas, electron or liquid water transfers through PEM, so the flux of those substances at both sides of PEM is 0. Because protons and dissolved water exist only in polymers, their flux outside polymers is also 0. In the proposed model, the initial fuel cell voltage and initial liquid water mole fraction in CGDL are calculated using Dirichlet’s boundary condition. The model is solved by the finite difference method, and the boundary of ordinary differential equations is solved by function bvp4c in Matlab R2019a. The specific flow chart of the numerical solution is presented in Figure 4. At first, operation conditions are input and all variables in the computational domain are initialized. Then, the derivatives equations are solved to obtain physical variables including potentials and fluxes. At last, simulation output the physical variables.
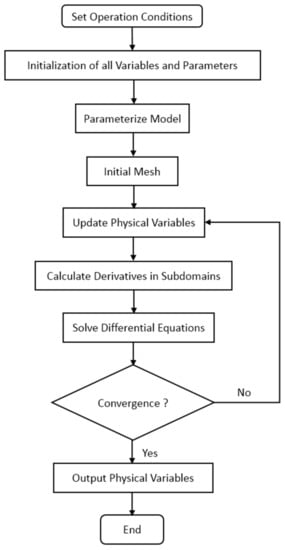
Figure 4.
Illustration of the numerical solution procedure.
3. Results and Discussion
3.1. Model Validation
To ensure the accuracy of the proposed one-dimensional two-phase model, simulations were validated with experimental results from Ozen et al. [33] and the experiment data of a single fuel cell on G20 fuel cell test station, respectively. Schematic diagram of the test bench for the G20 fuel cell is shown in Figure 5. When the model is validated, the operating conditions and model parameters used in the simulation are identical to those in Ozen’s experiments and G20 bench tests. The specific working conditions are listed in Table 1.
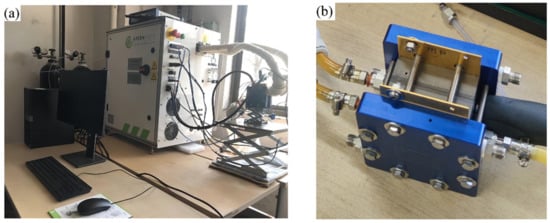
Figure 5.
The photographs of the test bench: (a) G20 fuel cell test station; (b) PEMFC single cell.

Table 1.
Operating conditions in the experiments for comparison.
The comparison between the proposed one-dimensional two-phase model and experiments is shown in Figure 6. The results indicate that the simulated polarization curve is similar to Ozen’s. When the current density is 1.2 A/cm2, the maximum relative error is 13.04% and the other relative error remained below 7.58%. Besides, as shown in Figure 6b, the simulation results are in good agreement with the G20 bench tests and the maximum relative error is less than 3.82%. In conclusion, the one-dimensional two-phase PEMFC model developed in this work can provide accurate results.
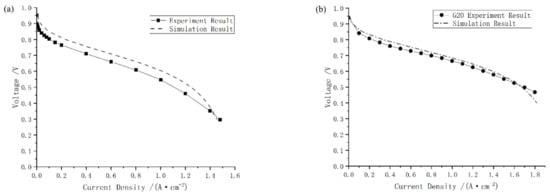
Figure 6.
Comparison between simulation results and experimental ones from (a) paper [33], and (b) test on G20 station.
3.2. Sensitivity Analysis of Fuel Cell Operating Conditions
In this section, the effects of output voltage, working temperature and relative humidity on performance and internal water distribution of PEMFC are investigated based on the proposed model. The model parameters and simulation conditions are stated in Table 2 and Table 3.
Table 2.
Physical parameters of the model.
Table 3.
Simulation conditions of the model.
3.2.1. Effects of Output Voltage
In order to investigate the characteristics of PEMFC internal water content under a constant voltage, seven cases was selected in which the voltage increased from 0.4 to 1.0 V with an increment of 0.1 V. As shown in Figure 7, when the voltage is 0.6 V, the peak value of water content occurs at the interface between CCL and CGDL, while the minimum water content occurs at the interface between ACL and PEM. In PEM, the water content increases almost linearly with the thickness parameter x in the direction from anode to cathode. In addition, since the water content of CCL reaches the maximum value 16, the liquid water will appear in CCL. When the voltage is lower than 0.8 V, liquid water may exist in the pores of CCL in each case.
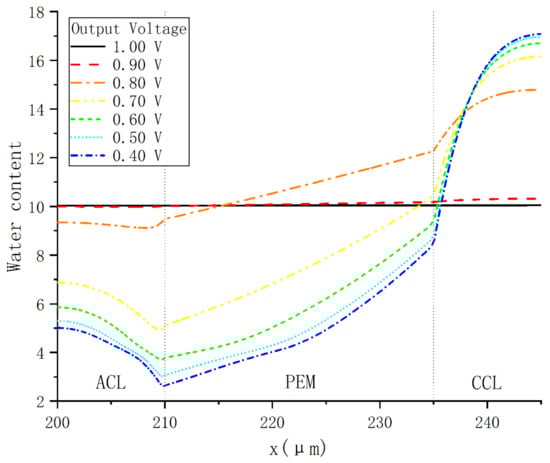
Figure 7.
Water content distribution under various operating voltages.
By comparing all cases, it can be found that the water content variations with output voltage in each domain are inconsistent. In ACL, the water content increases with voltage, and the largest increase occurs when the voltage rises from 0.7 to 0.8 V. In PEM, it follows the same variation trend, except that the water content near CCL drops slightly and remains around 10 when the voltage exceeds 0.9 V.
3.2.2. Effects of Relative Humidity
To study the influences of gas relative humidity at both the cathode and anode on water distribution, the temperature and the voltage in simulations are fixed at 70 °C and 0.75 V. The polarization curves and power curves are demonstrated in Figure 8. For Cas. 9, when the relative humidity is 90%, the PEMFC has better output performance and larger limited current density than the other two cases. For the other cases, the output voltage in Cas. 10 is always superior to that in Cas. 8 as long as the current density is lower than 1.25 A·cm−2. However, the limiting current density of Cas. 8 is higher.
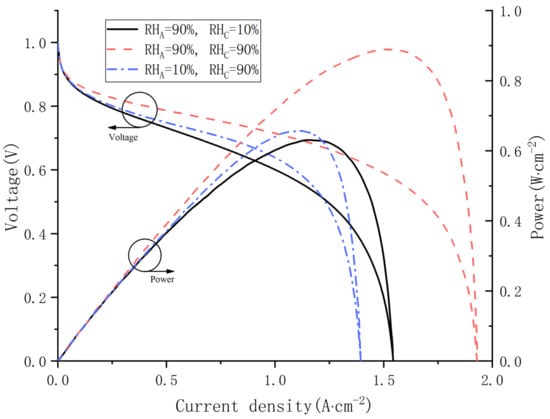
Figure 8.
Polarization curves and power curves under various inlet relative humidity.
The influences of gas relative humidity at both cathode and anode on water distribution are shown in Figure 9. It can be found in Figure 9a that the water content in Cas. 9 is the highest at any position from ACL to CCL. When the anode gas relative humidity is 90%, the cathode water content will decrease from 16 to about 4 as the cathode relative humidity decreases from 90% to 10%. Meanwhile, when the cathode gas relative humidity is 90%, the anode water content will decrease from 8 to about 2 as the anode relative humidity decreases from 90% to 10%. Therefore, it can be concluded that the influence of reducing inlet relative humidity on the water content at cathode is more significant than at the anode. Besides, as shown in Figure 9b, all the values of water content flux are positive in Cas. 8 and 9. In Cas. 10, the relative humidity of anode and cathode gas is 10% and 90%, respectively, and the water content flux becomes negative. This is mainly caused by the back-diffusion in PEM, and it can be seen from Figure 9a that the difference of water content between the anode and cathode is about 9 under this working condition, and the concentration gradient of the water content is relatively large. The distributions of the water vapor mole fraction in each case are demonstrated in Figure 9c, and they follow the strategies of the inlet relative humidity. The max output power at Cas. 8 is fairly close to that at Cas. 10 as depicted in Figure 8, but the rather dry cathode affects the water content of CCL because of the sufficient moisture in the anode side promoting the electro-osmosis of protons, which made exothermic CCL maintaining a relatively high water vapor flux as shown in Figure 9d. Conversely, low inlet relative humidity hinders the protons migrating, resulting in a lower water vapor flux.
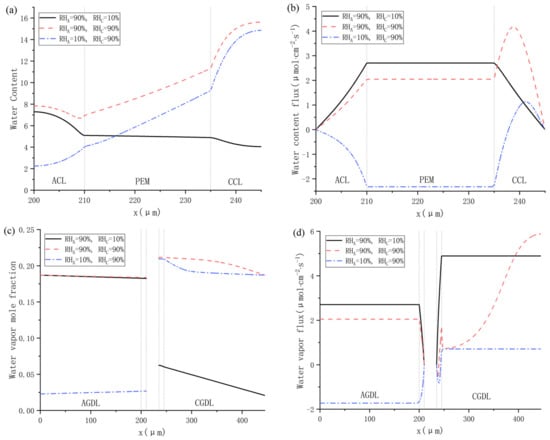
Figure 9.
Water distributions under various inlet relative humidity: (a) water content; (b) water content flux; (c) water vapor mole fraction; and (d) water vapor flux.
3.2.3. Effects of Working Temperature
In order to investigate the effect of operating temperature on water content distribution, the fuel cell performance is explored at 50, 60 and 70 °C separately. As shown in Figure 10, significant improvement of PEMFC performance is obtained with the ascent of operating temperature.
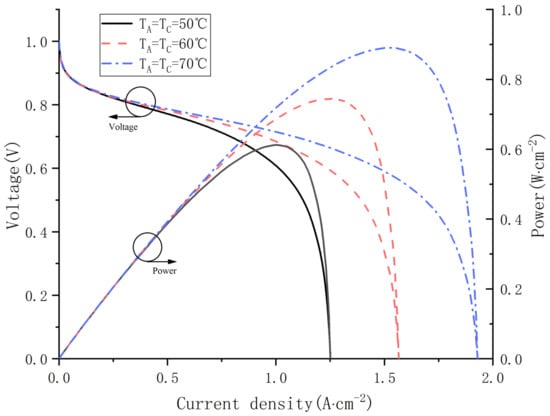
Figure 10.
Polarization curves and power curves at different operating temperature.
The internal characteristics of PEMFC including water content, water content flux, water saturation and liquid water flux are figured out in Cas. 11, 12, 13, as shown in Figure 11. It can be seen in Figure 11a that the water content in ACL and PEM both rises with the increase of operating temperature, while the change of water content of CCL shows the opposite trend. Besides, whether the fuel cell is operated at 50, 60 or 70 °C, the water content in CCL is much higher than in ACL and PEM, which means that there will probably be dissolved water back-diffusion. As for the water content flux, the variation trend of different water content is shown in Figure 11b, and the results indicate that the dissolved water keeps transferring from anode to cathode because the water content flux is always positive. It can be concluded that the current density is relatively high under 0.75 V, and the protons are continuously migrating from ACL to CCL. Therefore, the water molecules keep transferring to cathode under the force of electro-osmotic drag. In addition, the change trend of the water saturation can be seen in Figure 11c, the water saturation gradually decreases from CCL to CGDL, and a sudden fall occurs at the interface between CCL and CGDL. Figure 11d shows the change trend of liquid water flux at different temperatures, and the results show that the liquid water flux is also positive, indicating that the liquid water is flowing towards the cathode gas channel. From the literature [12,34], we know that liquid water migration is mainly driven by the capillary force when the saturation is higher than 0.1. In CGDL, the liquid water flux decreases with the working temperature as it gets closer to the gas channel.
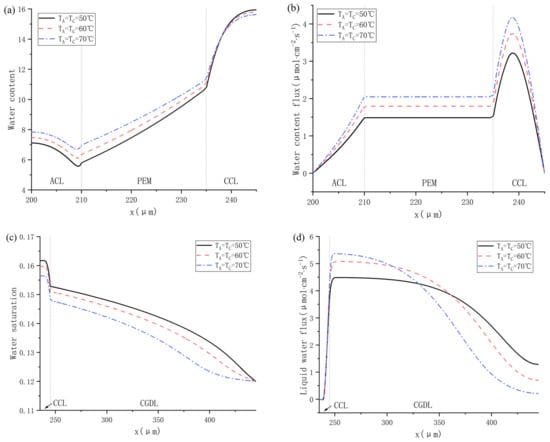
Figure 11.
Water distribution under 50 °C, 60 °C and 70 °C: (a) water content; (b) water content flux; (c) water saturation; and (d) liquid water flux.
3.2.4. Effects of Different Inlet Gas Temperature
In this section, the influence of different inlet gas temperature on fuel cell performance is investigated in depth. Cas. 14, 15, 16 were simulated with a fixed voltage and relative humidity. Figure 12 shows the polarization curve and power curve at different inlet temperatures. As shown in Figure 11, Cas. 16 outputs the highest voltage and power at any current density and produces the largest limited current density. However, the performance differences between the three cases are not noticeable when the current density is less than 0.8 A·cm−2.
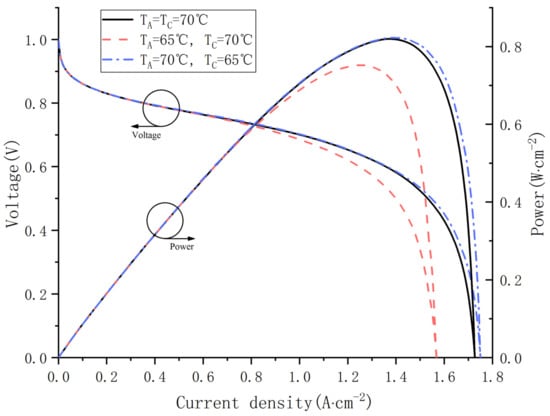
Figure 12.
Polarization curves and power curves at different gas inlet temperature.
The influence of different inlet gas temperatures on water distribution is shown in Figure 13. As shown in Figure 13a, Cas. 16 realizes the highest water content in PEM, which is mainly due to low ohmic resistance in a highly hydrated membrane. Figure 13b indicates that no back-diffusion happens in any cases. A higher inlet gas temperature of anode promotes the dissolved water to migrate towards the cathode, providing more power as depicted in Figure 12. Besides, Figure 13c compares the simulated heat flux across the membrane. Because the electrochemical reaction takes place in CCL, the heat flux in CCL is commonly higher than in ACL and PEM. The heat flux becomes negative when the cathode temperature is 5 °C higher than the anode one, which means the total heat in the cathode including the heat generated from ORR and the heat carried by supplying air are higher than that in the anode, which consists of the heat from HOR and the heat carried by hydrogen. In addition, higher temperature brings about higher saturation vapor pressure and higher capacity for water vapor in a moist gas. As a result, the water vapor mole fraction rises with increasing working temperature, as shown in Figure 13d.
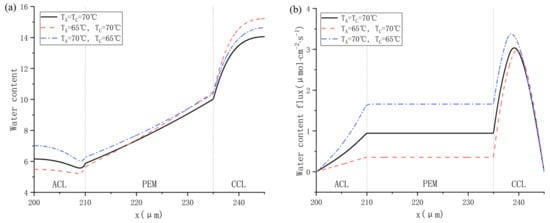
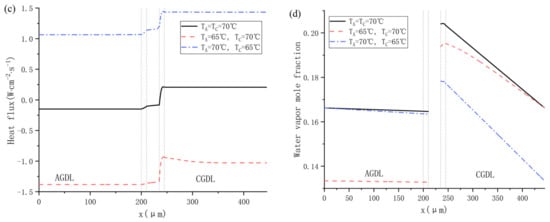
Figure 13.
Water distribution at different gas inlet temperature of cathode and anode: (a) water content: (b) water content flux; (c) heat flux; and (d) water vapor mole fraction.
4. Conclusions
In this work, an improved one-dimensional two-phase non-isothermal model is proposed to comprehensively analyze the internal processes of PEMFC. Compared to homogenous models and lumped-parameter models, the proposed model can precisely predict the PEMFC’s performance and is capable of exploring water and heat transfer phenomena inside PEMFCs. After simulation and further analysis, heat and water transfer mechanisms under various operation conditions such as different working temperatures, relative humidity and output voltages are studied. Some conclusions are achieved as follows.
(1) The heat of a working PEMFC stack is chiefly generated in CCL, while is mainly dissipated in anode and cathode gas channels as well as coolant flow channels in the bipolar plates. Besides, heat generally transfers from CCL to both cathode and anode gas channels. When the inlet gas relative humidity and the differential temperature in PEMFC are high, the dissolved water content inside CCL near CGDL will exceed 14, leading to liquid water formation.
(2) Under a steady-state condition, the peak value of membrane water content occurs at the interface between CCL and CGDL regardless of the output voltage. The minimum value occurs at the interface between ACL and AGDL. Moreover, when the voltage is in the range of 0.4 to 1.0 V, the anode water content gradually decreases with the increase of current density, while the cathode water content increases. When the voltage is below 0.8 V, liquid water is generated in the pores of CCL, with the peak cathode water content exceeding 14.
(3) When the fuel cell operates at 0.75 V, the back-diffusion of dissolved water from cathode to anode might occur. When the relative humidity of the anode and cathode are 90% and 10% separately, the water content in CCL is lower than that in the anode, indicating no back-diffusion. In the other cases, although the water content in CCL is the highest, the dissolved water is constantly migrating from the anode to cathode. This occurs because the current density is high, which causes water molecules to migrate towards the cathode under the force of electro-osmotic drag.
(4) Comparing all cases, the best PEMFC performance is obtained when the inlet gas temperature and relative humidity are 70 °C and 90%. When the current density is 1.524 A∙cm−2, the power density reaches the highest value 0.891 W∙cm−2. When the temperature is in the range of 50 to 70 °C, the output voltage and power increases as the anode temperature is raised. Lowering the relative humidity will reduce the cell performance, and a decrease in anode relative humidity has more significant effect than a decrease in cathode relative humidity. The reason is that the anode water content will constantly decrease because of electro-osmotic drag. When the anode relative humidity is very low, the flux of membrane water content becomes negative, which harms the electrochemical reaction.
Author Contributions
Conceptualization, D.G. and S.X.; methodology, Y.G.; software, D.G.; validation, D.G.; formal analysis, D.G.; investigation, Y.G.; resources, S.X.; data curation, D.G.; writing—original draft preparation, D.G.; writing—review and editing, Y.G.; visualization, Y.G.; supervision, S.X.; project administration, D.G.; funding acquisition, S.X. All authors have read and agreed to the published version of the manuscript.
Funding
This research was funded by the National Natural Science Foundation of China (Grant No.22279091) and The National Key R&D Program of China (Grant No. 2017YFB0102802).
Data Availability Statement
Not applicable.
Conflicts of Interest
The authors declare no conflict of interest.
Abbreviations
| CL | catalyst layer |
| GDL | gas diffusion layer |
| AGDL | anode gas diffusion layer |
| ACL | anode catalyst layer |
| CGDL | cathode gas diffusion layer |
| CCL | cathode catalyst layer |
| PEM | proton exchange membrane |
| PEMFC | proton exchange membrane fuel cell |
| EW | equivalent weight |
| RH | relative humidity |
| HOR | hydrogen oxidation reaction |
| ORR | oxygen reduction reaction |
References
- Guo, J.Q.; He, H.W.; Li, J.W.; Liu, Q.W. Driving information process system-based real-time energy management for the fuel cell bus to minimize fuel cell engine aging and energy consumption. Energy 2022, 248, 123474. [Google Scholar]
- Kandidayeni, M.; Macias, A.; Boulon, L.; Kelouwani, S. Investigating the impact of ageing and thermal management of a fuel cell system on energy management strategies. Appl. Energy 2020, 274, 115293. [Google Scholar] [CrossRef]
- Tang, X.W.; Guo, Q.; Li, M.; Wei, C.H.; Pan, Z.Y.; Wang, Y.Q. Performance analysis on liquid-cooled battery thermal management for electric vehicles based on machine learning. J. Power Sources 2021, 494, 229727. [Google Scholar] [CrossRef]
- Gong, D.P.; Xu, S.C.; Wang, X.H.; Gao, Y. Numerical Study on the Effects of Water and Heat Transport on Two-Phase Flow in a Polymer Electrolyte Membrane Fuel Cell. Energies 2022, 15, 8318. [Google Scholar] [CrossRef]
- Alaswad, A.; Palumbo, A.; Dassisti, M.; Olabi, A.G. Fuel Cell Technologies, Applications, and State of the Art. A Reference Guide; Reference Module in Materials Science and Materials Engineering; Elsevier: Amsterdam, The Netherlands, 2016. [Google Scholar]
- Liso, V.; Araya, S.S.; Olesen, A.C.; Nielsen, M.P.; Kær, S.K. Modeling and experimental validation of water mass balance in a PEM fuel cell stack. Int. J. Hydrog. Energy 2016, 41, 3079–3092. [Google Scholar] [CrossRef]
- Liu, H.; Chen, J.; Hissel, D.; Lu, J.G.; Hou, M.; Shao, Z.G. Prognostics methods and degradation indexes of proton exchange membrane fuel cells: A review. Renew. Sustain. Energy Rev. 2020, 123, 109721. [Google Scholar] [CrossRef]
- Nolan, J.; Kolodziej, J. Modeling of an automotive fuel cell thermal system. J. Power Sources 2010, 195, 4743–4752. [Google Scholar] [CrossRef]
- Han, J.; Park, J.; Yu, S. Control strategy of cooling system for the optimization of parasitic power of automotive fuel cell system. Int. J. Hydrog. Energy 2015, 40, 13549–13557. [Google Scholar] [CrossRef]
- Pan, Y.W.; Wang, H.Z.; Brandon, N.P. A fast two-phase non-isothermal reduced-order model for accelerating PEM fuel cell design development. Int. J. Hydrog. Energ. 2022, 47, 38774–38792. [Google Scholar] [CrossRef]
- Gong, D.; Xu, S.; Zhang, B. Control Strategies for Prevention of PEMFC Oxygen Starvation: A Review; SAE WCX Digital Summit; SAE Technical Paper 2021-01-0743; SAE International: Warrendale, PA, USA, 2021; p. 1e17. [Google Scholar]
- Sinha, P.K.; Wang, C.-Y. Two-phase modeling of gas purge in a polymer electrolyte fuel cell. J. Power Sources 2008, 183, 609–618. [Google Scholar] [CrossRef]
- Jiang, F.M.; Wang, C.-Y. Numerical modeling of liquid water motion in a polymer electrolyte fuel cell. Int. J. Hydrog. Energy 2014, 39, 942–950. [Google Scholar] [CrossRef]
- Takalloo, P.K.; Nia, E.S.; Ghazikhani, M. Numerical and experimental investigation on effects of inlet humidity and fuel flow rate and oxidant on the performance on polymer fuel cell. Energy Convers. Manag. 2016, 114, 290–302. [Google Scholar] [CrossRef]
- Zhang, Z.Q.; Liu, W.; Wang, Y.L. Three dimensional two-phase and non-isothermal numerical simulation of multi-channels PEMFC. Int. J. Hydrog. Energy 2019, 44, 379–388. [Google Scholar] [CrossRef]
- Mu, Y.T.; He, P.; Bai, F.; Chen, L.; Qu, Z.-G.; Tao, W.-Q. Numerical analyses on oxygen transport resistances in polymer electrolyte membrane fuel cells using a novel agglomerate model. Int. J. Hydrog. Energy 2022, in press. [Google Scholar] [CrossRef]
- Rakhshanpouri, S.; Rowshanzamir, S. Water transport through a PEM (proton exchange membrane) fuel cell in a seven-layer model. Energy 2013, 50, 220–231. [Google Scholar] [CrossRef]
- Hu, J.M.; Li, J.Q.; Xu, L.F.; Huang, F.S.; Ouyang, M.G. Analytical calculation and evaluation of water transport through a proton exchange membrane fuel cell based on a one-dimensional model. Energy 2016, 111, 869–883. [Google Scholar] [CrossRef]
- Nalbant, Y.; Colpan, C.O.; Devrim, Y. Development of a one-dimensional and semi-empirical model for a high temperature proton exchange membrane fuel cell. Int. J. Hydrog. Energy 2018, 43, 5939–5950. [Google Scholar] [CrossRef]
- Jiang, Y.; Yang, Z.R.; Jiao, K.; Du, Q. Sensitivity analysis of uncertain parameters based on an improved proton exchange membrane fuel cell analytical model. Energy Convers. Manag. 2018, 164, 639–654. [Google Scholar] [CrossRef]
- Kusoglu, A.; Weber, A.Z. New insights into perfluorinated sulfonic-acid ionomers. Chem. Rev. 2017, 117, 987–1104. [Google Scholar] [CrossRef]
- Springer, T.E.; Zawodzinski, T.; Gottesfeld, S. Polymer electrolyte fuel cell model. J. Electrochem. Soc. 1991, 138, 2334. [Google Scholar] [CrossRef]
- Jiao, K.; Li, X. Water transport in polymer electrolyte membrane fuel cells. Prog. Energy Combust. Sci. 2011, 37, 221–291. [Google Scholar] [CrossRef]
- Nguyen, T.V.; Lin, G.; Ohn, H.; Wang, X. Measurement of capillary pressure property of gas diffusion media used in proton exchange membrane fuel cells. Electrochem. Solid-State Lett. 2008, 11, B127–B131. [Google Scholar] [CrossRef]
- Zawodzinski, T.A.; Derouin, C.; Radzinski, S.; Sherman, R.J.; Smith, V.T.; Springer, T.E.; Gottesfeld, S. Water-Uptake by and Transport through Nafion(R) 117 Membranes. J. Electrochem. Soc. 1993, 140, 1041–1047. [Google Scholar] [CrossRef]
- Ijaodola, O.S.; El-Hassan, Z.; Ogungbemi, E.; Khatib, F.N.; Wilberforce, T.; Thompson, J.; Olabi, A.G. Energy efficiency improvements by investigating the water flooding management on proton exchange membrane fuel cell (PEMFC). Energy 2019, 179, 246–267. [Google Scholar] [CrossRef]
- Weber, A.Z.; Borup, R.L.; Darling, R.M.; Das, P.K.; Dursch, T.J.; Gu, W.B.; Harvey, D.; Kusoglu, A.; Litster, S.; Mench, M.M.; et al. A Critical Review of Modeling Transport Phenomena in Polymer-Electrolyte Fuel Cells. J. Electrochem. Soc. 2014, 161, F1254–F1299. [Google Scholar] [CrossRef]
- Anders, C.O.; Torsten, B.; Kær, S.K. On the diffusion coefficient of water in polymer electrolyte membranes. ECS Trans. 2013, 50, 979. [Google Scholar]
- Ge, S.H.; Li, X.G.; Yi, B.L.; Hsing, I.M. Absorption, desorption, and transport of water in polymer electrolyte membranes for fuel cells. J. Electrochem. Soc. 2005, 152, A1149–A1157. [Google Scholar] [CrossRef]
- Jiao, K.; Li, X.G. Effects of various operating and initial conditions on cold start performance of polymer electrolyte membrane fuel cells. Int. J. Hydrog. Energy 2009, 34, 8171–8184. [Google Scholar] [CrossRef]
- Jiao, K.; Li, X.G. Three-dimensional multiphase modeling of cold start processes in polymer electrolyte membrane fuel cells. Electrochim. Acta 2009, 54, 6876–6891. [Google Scholar] [CrossRef]
- Guo, Q.; Luo, Y.Q.; Jiao, K. Modeling of assisted cold start processes with anode catalytic hydrogen-oxygen reaction in proton exchange membrane fuel cell. Int. J. Hydrog. Energy 2013, 38, 1004–1015. [Google Scholar] [CrossRef]
- Ozen, D.N.; Timurkutluk, B.; Altinisik, K. Effects of operation temperature and reactant gas humidity levels on performance of PEM fuel cells. Renew. Sustain. Energy Rev. 2016, 59, 1298–1306. [Google Scholar] [CrossRef]
- Pasaogullari, U.; Wang, C. Liquid water transport in gas diffusion layer of polymer electrolyte fuel cells. J. Electrochem. Soc. 2004, 151, A399. [Google Scholar] [CrossRef]


Disclaimer/Publisher’s Note: The statements, opinions and data contained in all publications are solely those of the individual author(s) and contributor(s) and not of MDPI and/or the editor(s). MDPI and/or the editor(s) disclaim responsibility for any injury to people or property resulting from any ideas, methods, instructions or products referred to in the content. |
© 2023 by the authors. Licensee MDPI, Basel, Switzerland. This article is an open access article distributed under the terms and conditions of the Creative Commons Attribution (CC BY) license (https://creativecommons.org/licenses/by/4.0/).