Abstract
The phenomenon of voltage asymmetry is common in electricity networks and is the cause of many unfavourable phenomena occurring, such as an increase in power and energy losses, as well as the abnormal operation of certain loads. Voltage asymmetry can be caused by several different factors, which include the design of the transmission line (e.g., routing of conductors in relation to each other and the earth), the parameters of consumer circuits (e.g., unequal loading of individual phases), or the design of network equipment (e.g., generators or transformers). An asymmetrical condition also occurs during system disturbances such as single-phase short circuits or lightning. One of the many factors impinging on voltage asymmetry in the electrical network is also the effect of load, but in the case of medium voltage power networks, this effect is neglected in the literature. This paper presents and evaluates the influence of the power consumed by consumers on the values of zero-voltage asymmetry factor indices in medium voltage compensated power networks with the neutral point earthed by an inductance (Petersen coil) operating with wind and photovoltaic power plants.
1. Introduction
Voltage asymmetry is called a condition in which the values of the phase voltages or the angles between successive voltages are not equal to each other. Asymmetrical voltage systems can be decomposed into symmetrical voltage systems (symmetrical components). By denoting the complex values of the phase voltages in a three-phase system by UA, UB, and UC, respectively, the equations are obtained, which enable the calculation of the symmetrical components [].
where: U0, U1, U2—the composite values of the voltages symmetrical components of the zero, positive and negative sequence, UA, UB, UC—the composite values of the phase voltages, a—the rotation operator described by the equation:
Composite values of phase voltages, without specialised instruments (power quality analysers), are difficult to obtain by measurement. They can be calculated from measurements of the rms values of the phase voltages UA, UB, UC and two line voltages, e.g., UAB and UAC, which will be used to calculate the shift angles of the phase voltages according to the relations resulting from the voltage vector system (Figure 1) and the cosine theorem [].
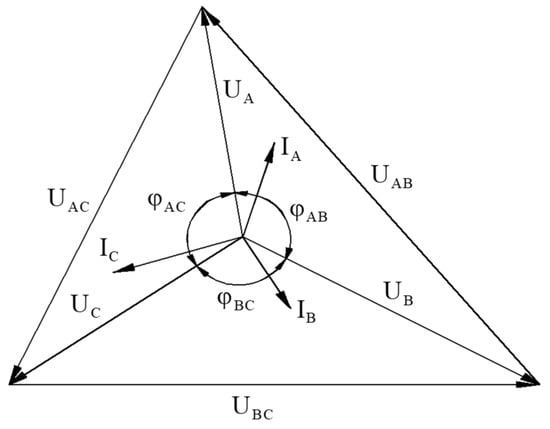
Figure 1.
Vector diagram of currents and voltages at asymmetry (own elaboration based on []).
Assuming that the phase shift of the voltage UA is equal to 0°, the complex values of the phase voltages will be of the form []:
The asymmetry of the supply voltage system results in the appearance of symmetrical components of the negative or zero-sequence. The zero-sequence component of the voltage, when ignoring the longitudinal impedances of the power line, illustrates the voltage between the neutral point of the grid and the earth [,]. Most often, the inequality of voltages or phase angles is described by the zero-voltage asymmetry factor (voltage imbalance), described as the ratio of the zero-sequence component to the positive-sequence component of the voltage []:
Medium-voltage distribution networks in Poland usually operate with the neutral point indirectly earthed by inductance or resistance. Phenomena related to voltage asymmetry are particularly evident in networks earthed by inductance (Petersen coil) and must be taken into account, among other things, when determining the operating conditions of earth fault protection []. In networks with predominantly cable lines, the voltage is usually more symmetrical than in networks with overhead lines [].
The corresponding general diagram of a medium voltage (MV) power network supplied from an HV/MV substation is shown in Figure 2. The HV/MV transformer is usually made with windings in the Yd (star-delta) arrangement, while the MV/LV consumer and power plant transformers operate in the reverse Dy (delta-star) arrangement [,]. The effect of using such a combination in transformers is that zero-voltage asymmetry is not transferred from the medium voltage network to the low voltage network, where loads, most sensitive to zero-voltage asymmetry, are connected []. The situation is different at substations supplying rectifiers feeding voltage to the railway overhead line. In such stations, the transformers operate with the windings connected in a Yyd (star-star-delta) arrangement. Such a connection is necessary for the proper operation of the 12-pulse rectifiers but results in the transmission of zero-voltage asymmetry to the low-voltage network [,]. The supply of unbalanced voltage to the rectifiers, in turn, causes additional harmonics and an increase in the pulsation of the rectified voltage, which interferes with the operation of the railway and tramway traction [,,].
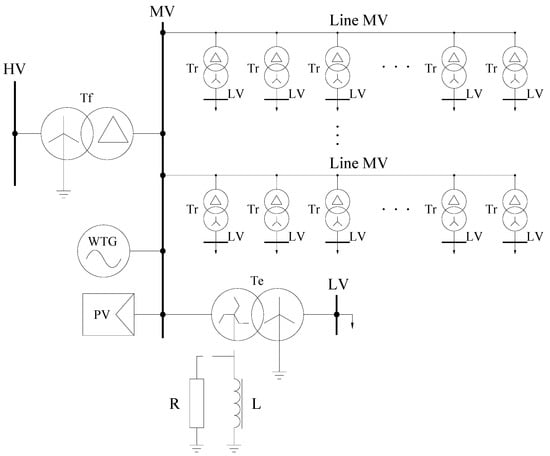
Figure 2.
General diagram of MV power network supplied from HV/MV substation. HV—high voltage, MV—medium voltage, LV—low voltage, Tf—feeder transformer, Tr—receiving transformer, Te—earthing transformer, WT—wind turbine generator, PV—photovoltaic power plant, R—resistor earthing the neutral point of the transformer, L—inductance (coil) earthing the neutral point of the transformer.
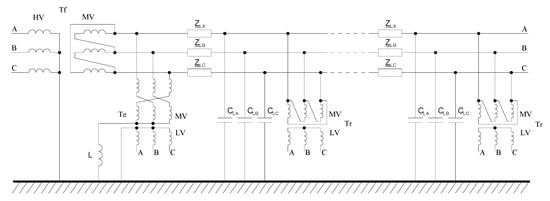
Figure 3.
Equivalent model of MV power network with neutral point earthed by inductance (earth fault compensation). HV—high voltage, MV—medium voltage, LV—low voltage,, Tf—feeder transformer, Tr—receiving transformer, Te—earthing transformer, L—neutral point earthing inductance, ZLA, ZLB, ZLC—longitudinal impedances of MV line in individual phases, CLA, CLB, CLC—shunt capacitance of MV line in individual phases.
In the currently available literature, the longitudinal impedance of the line and the load impedance are often not considered when determining the voltage zero-voltage component [,]. When ignoring longitudinal line impedance and load impedance, based on the model in Figure 3, it is possible to draw an equivalent diagram of the MV power network (most commonly used in the literature [,]). It consists of the voltage sources taking into account the total electromotive force of the feeding transformer, wind turbines and photovoltaics (EA, EB, EC), the capacitance of the conductors concerning earth (CLA, CLB, CLC) and the impedance of the earthing reactor (Z0). The diagram is shown in Figure 4. In the power system under analysis, the operation of renewable energy sources causes a change in the amount of energy generated in voltage sources. Due to the high dynamics of changes in the power generated by wind and photovoltaic power plants [], voltage analysis should be carried out over short time periods or take averaged values for calculations.
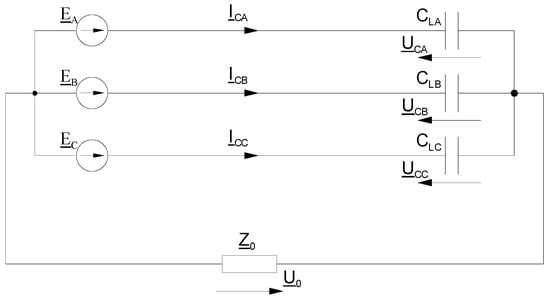
Figure 4.
Equivalent diagram of MV power network without consideration of line loading. EA, EB, EC—the total electromotive force of the feeding transformer, wind turbines and photovoltaics, UCA, UCB, UCC—voltages of individual phases concerning earth, ICA, ICB, ICC—charging currents in individual phases, U0—voltage on the earthing reactor, I0—current flowing in the quenching reactor, CLA, CLB, CLC—capacitance of individual phase conductors concerning earth, Z0 = R0 + jωL0—impedance of the earthing reactor (own elaboration based on [,]).
Based on the equivalent diagram in Figure 4, a relation for calculating the voltage on the quenching choke is derived [,]:
By dividing the zero-sequence component of the voltage U0 by the positive-sequence component of the voltage U1, the value of the zero-voltage asymmetry factor (αU0) is obtained. In the model shown above (Figure 4), this value is not dependent on the line load. However, as shown by preliminary analyses elaborated by the authors [,], the value of this factor is affected not only by the active power flowing through the line but also by the value of the reactive power transmitted through it. Therefore, it was decided to take a closer look at this issue.
Zero-voltage asymmetry in power grids is also affected by grid-connected renewable energy sources. It primarily depends on the ratio of RES power to conventional sources. Moloi (et al.) [] proposed solutions to monitor transients occurring in wind power plants. The dependence of the parameters describing the quality of electricity on the compensation systems used in the grid was described in Muljadi’s work []. According to the data (obtained from laboratory tests conducted on a power plant model) presented by Shalukho [], wind power plants negatively affect power quality parameters. However, this was not confirmed by other works [,], in which the presented results of tests conducted on real facilities showed a positive effect of wind farms on the voltage parameters present in the power grid. From the graphs presented there, it can be seen that the operation of a wind power plant affects not only the increase in the voltage occurring at the point of connection of the source but also the reduction of the values of the factors of zero and negative voltage asymmetry. Based on the results of the work [,], it can be concluded that the values of the factors of zero-voltage asymmetry would be greater than those recorded and described by the authors in this paper if the power grid without the participation of renewable energy sources were analysed. However, this topic will require additional research and analysis.
2. Materials and Methods
In order to determine the effect of the load on the value of the zero-voltage asymmetry factor, a load was attached to the equivalent diagram in Figure 4, which was represented by the interfacial impedances (ZrAB, ZrBC, ZrAC—connected in a delta, like the primary winding of the receiving transformer), through which the load currents (IrAB, IrBC, IrAC) flow—Figure 5. The arrangement of voltage vectors corresponding to the loaded network is shown in Figure 6.
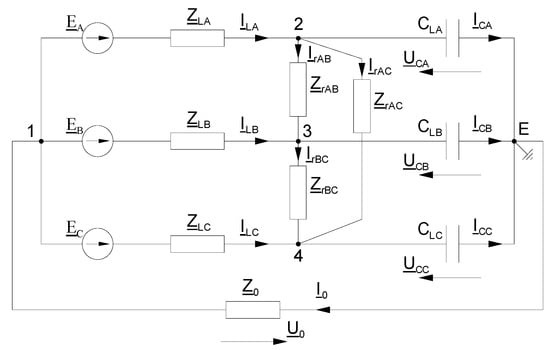
Figure 5.
Equivalent diagram of MV power network with consideration of line loading. EA, EB, EC—the total electromotive force of the feeding transformer, wind turbines and photovoltaics, ZLA, ZLB, ZLC—longitudinal impedances of MV line, ICA, ICB, ICC—line currents, ZrAB, ZrBC, ZrAC—load impedances, IrAB, IrBC, IrAC—load currents, CLA, CLB, CLC—capacitance of MV line concerning earth, UCA, UCB, UCC—voltages of individual phases concerning earth at the receiving end, U0—voltage on the earthing reactor, I0—current flowing in the earthing reactor, Z0—impedance of the earthing reactor.
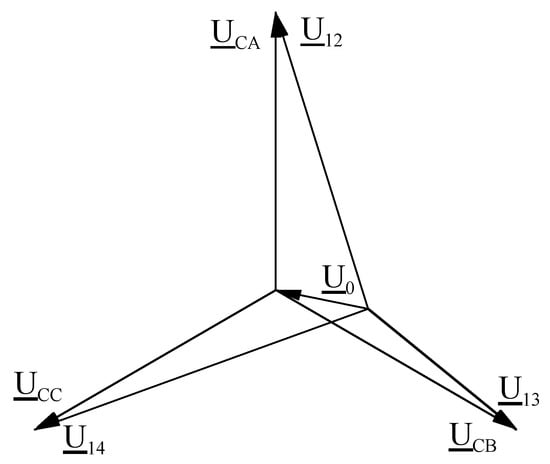
Figure 6.
Voltage vector system for the diagram in Figure 5.
The relationship between voltages for the equivalent diagram in Figure 5 can be converted by equations using the nodal potential method in relation to node “E”:
where
after substitution we get
and then
After transformation to matrix form, Equation (10) can be represented as follows:
Using Cramer’s method, a relation describing the voltage on the earthing reactor U0 was determined from the system of Equation (11):
In order to verify the effect of taking the line load into account in the determination of the zero-voltage asymmetry factor, an example power system was modelled, for which the values of voltages U0, UCA, UCB, and UCC were then determined. It was assumed that the power line is made in a flat system with steel-aluminium ACSR conductors with a nominal cross-section of 70 mm2. The line operates at 15 kV and has a length of 50 km. The following equivalent line parameters were assumed for the calculations:
- ZLA = 0.4881 + j0.7674 Ω/km
- ZLB = 0.4881 + j0.7692 Ω/km
- ZLC = 0.4881+ j0.7674 Ω/km
- CLA = 0.0093 μF/km
- CLB = 0.0103 μF/km
- CLC = 0.0093 μF/km
It was assumed that the line would be loaded in the range from 0 to 4 MW of active power and from −1 to 1 Mvar of reactive power (from capacitive to inductive character). In all cases, it was a symmetrical load (the same value in each phase). The model shown in Figure 5 and Equations (1) and (11) were used for the calculations, and the values obtained at the beginning of the medium-voltage line (at the point of its connection to the HV/MV substation) were analysed.
In order to verify the correctness of the description of the phenomena occurring in the system by the proposed mathematical model, field tests were carried out at one of the HV/MV substations located in Poland in the Podlaskie Voivodeship. The investigated substation was characterised by the following technical data:
- -
- Rated voltage of MV switchgear: 15 kV,
- -
- Number of HV/MV transformers: 2,
- -
- Power of HV/MV transformers: 10 MVA,
- -
- Method of grounding the neutral point: through a choke,
- -
- Number of MV lines fed from the substation: 10,
- -
- Number of MV/LV substations fed from the substation: 310,
- -
- Total length of MV lines fed from substations: 406 km,
- -
- Total power of connected photovoltaic power plants: 4.5 MW,
- -
- Total power of connected wind power plants: 6 MW.
The outlets from the 15 kV switchgear are made by cable lines with a cross-section of 120 mm2, and the main lines are made by overhead lines with ACSR 70 mm2 or ACSR 50 mm2 conductors. Branch lines are made by overhead lines with ACSR 35 mm2 or ACSR 25 mm2 conductors.
A portable MAVOWATT 240 power quality analyser from GOSSEN METRAWATT was used to record changes in the values of electrical quantities. The analyser is designed to measure and record the operating parameters of a single-phase or three-phase power network according to the highest internationally accepted standards, such as IEC 61000-4-30 Class A (all measurands). It allows measurements to be made in CAT III and CAT IV installations. This allows measurement of true rms, peak and fundamental harmonic values of voltage and current for the three phases and the neutral and protective conductor, as well as DC voltage and current. The MAVOWATT 240 allows the measurement and recording of electrical quantities in steady-state and fault conditions.
All parameters characterising power quality were recorded for a period of one week, with an interval of one second. Based on the recorded quantities, the dependencies of the zero-voltage asymmetry factor as a function of the active and reactive power of the load were determined.
3. Results and Discussion
As a result of analytical calculations, using the model and relations allowing for the determination of the zero-sequence component of the voltage in the medium-voltage power grid, taking into account the line load, the values of the zero-sequence voltage asymmetry factor as a function of the load power were obtained. Figure 7 shows the determined dependence of the zero-voltage asymmetry factor (αU0) as a function of the active power (P) of the load.
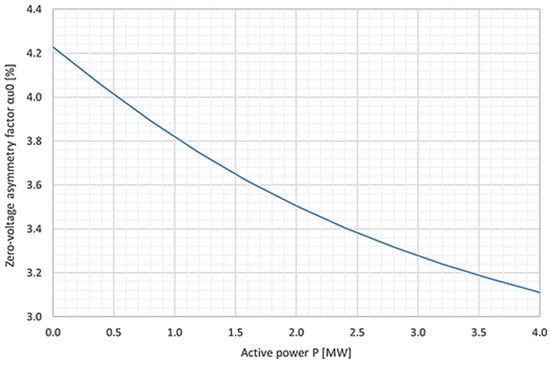
Figure 7.
Dependence diagram of the zero-voltage asymmetry factor (αu0%) on the active power of the load (P), determined by the analytical method.
When analysing the values shown in Figure 7, a clear relationship between the value of the zero-voltage asymmetry factor and the active power of the line load is noticeable. As the active power increases, the value of the asymmetry factor decreases, with this change over the entire power range analysed—being 1.12% of the maximum value. This means that failure to take into account the active power of the load in the analysed system results in a calculation error that increases as the load increases. The maximum percentage error (for an active power load of 4 MW) is:
Analogous calculations, as before, were performed for the system loaded with reactive power, and the results obtained are presented in Figure 8. From the analysis of the values contained therein, it can be seen that as the reactive power increases, the value of the zero-voltage asymmetry factor decreases, which is the inverse of the dependence on a load of active power. In this case, over the entire reactive power range analysed, the change in the value of the factor αu0% is 0.77%. If the line is loaded with capacitive reactive power, the calculation error is negative and for a reactive power load of 1 Mvar is at maximum:
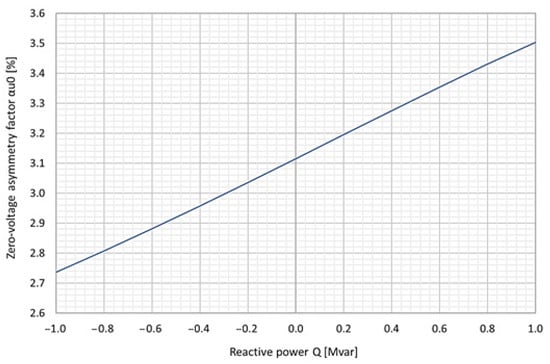
Figure 8.
Diagram of the dependence of the zero-voltage asymmetry factor (αu0%) on the reactive power of the load (Q), determined by the analytical method.
If the line is loaded with inductive reactive power, the calculation error is positive and for a reactive power load of 1 Mvar is at maximum:
In order to verify the results obtained using the analytical method, the dependence of the zero-voltage asymmetry factor on the active power of the load was measured, and the results obtained are presented in Figure 9. It is noticeable there that there is a rather significant scatter of the measured values, causing that for one value of the load, multiple values of the factor αu0% were registered. This is mainly because the actual system is not ideal like the analytical system.
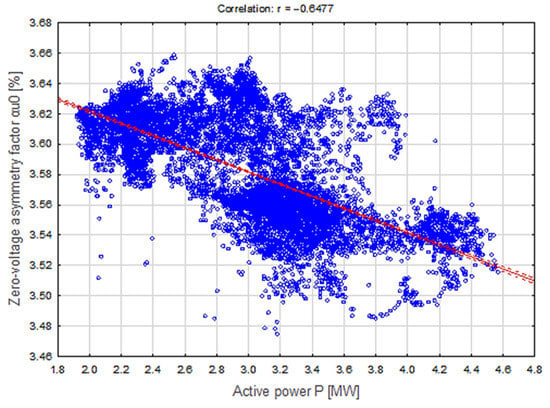
Figure 9.
Dependence diagram of the zero-voltage asymmetry factor (αu0%) on the active power of the load (P), determined during field tests.
Drawing a trend line from the values obtained, with a correlation of nearly 65%, it can be seen that a relationship between the measured quantities analogous to that obtained from analytical calculations is obtained. The value of the zero-voltage asymmetry factor decreases with increasing active load power. This change, over the entire power range analysed, is significant, amounting to more than 3%. It is worth emphasising the fact that no load smaller than 1.92 MW was registered, which makes it possible to conclude that this change, as well as the error resulting from the omission of the load in the determination of αu0%, will be greater, maintaining the rectilinear relationship, it will be a value of approximately 5%.
Analogously, measurements were made of the dependence of the zero-voltage asymmetry factor of voltages as a function of reactive power load. The recorded values, shown in Figure 10, show that, as before, a large discrepancy resulting mainly from the non-idealities of the power system under study.
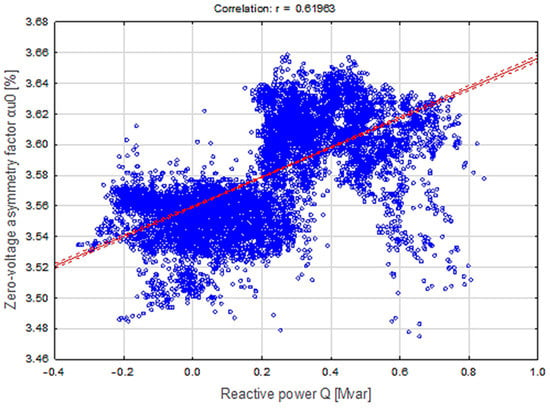
Figure 10.
Dependence diagram of the zero-voltage asymmetry factor (αu0%) on the reactive power of the load (Q), determined during field tests.
By approximating the obtained results with a linear relationship (with a correlation of nearly 62%), a directly proportional relationship was obtained between the measured quantities. This is consistent with the relationship obtained from the analytical calculations. Analogously as before, it can be seen that the values of the zero-voltage asymmetry factor decrease with increasing capacitive reactive power. This change, as well as the error due to the omission of the line load from the calculation, for a load change of 0.4 Mvar is just over 1%. The recorded change in αu0% as a function of inductive reactive power is greater and amounts (for a power change of 0 to 0.8 Mvar) to more than 2%.
Comparing the curves of changes in zero-voltage asymmetry factors for the model and the real grid (Figure 7, Figure 8, Figure 9 and Figure 10), one can see differences in the strength of the load’s effect on asymmetry. This may be due to simplifications in the model in Figure 5, ignoring the distributed capacitances of transmission lines and the insignificant impact of renewable generation.
4. Conclusions
Zero-voltage asymmetry factor is an important parameter characterising medium-voltage lines, in particular those supplying traction stations. High values of asymmetry can cause malfunctions of equipment installed in stations, especially rectifier equipment in railway traction stations. Many articles can be found in the literature on this issue. However, when determining the zero-voltage asymmetry factor, none of the authors took into account the load present in the line under study. As shown in this article, the values of the factor αu0% depend strictly on the value of the load power. They are directly proportional to the reactive power and inversely proportional to the active power of the load. These conclusions are analogous to the model analysed analytically and also result from field tests conducted by the authors at one of the HV/MV substations. The recorded changes may not be significant (not exceeding 5% in the investigated power range), but they can be very important in the design process of real power systems. Therefore, in detailed analyses, according to the authors, when determining the value of the zero-voltage asymmetry factor, both the nature and the value of the load occurring in the studied system should be taken into account. In addition, when performing analyses of systems with connected unstable energy sources (wind and photovoltaic power plants), it is necessary to determine the effect of source operation (especially during power plant switching on and off) on the values of the zero-voltage asymmetry factor. This issue will be the subject of further research by the authors.
Author Contributions
Conceptualization, G.H.; methodology, G.H.; software, G.H.; validation, G.H.; formal analysis, G.H.; investigation, G.H.; resources, Z.S. and G.H.; data curation, Z.S. and G.H.; writing—original draft preparation, Z.S. and G.H.; writing—review and editing, Z.S. and A.B.; visualization, Z.S.; supervision, A.B.; project administration, G.H.; funding acquisition, G.H. All authors have read and agreed to the published version of the manuscript.
Funding
This research received no external funding.
Data Availability Statement
Not applicable.
Conflicts of Interest
The authors declare no conflict of interest.
References
- Kochura, D.; Tsivilyov, I.; Sarin, L. Influence of neutral grounding method on voltage unbalance in 10 kV network with cable lines and overhead lines. In Proceedings of the 2014 Electric Power Quality and Supply Reliability Conference (PQ), Rakvere, Estonia, 11–13 June 2014; pp. 359–362. [Google Scholar] [CrossRef]
- Mizia, W. Transformers; Wydawnictwo Politechniki Śląskiej: Gliwice, Poland, 1996. (In Polish) [Google Scholar]
- Robak, S.; Pawlicki, A.; Pawlicki, B. The analysis of the voltage and current asymmetry in the power transmission lines. Electrotech. Rev. (In Polish). 2014, 7, 23–31. [Google Scholar]
- Lorenc, J. Admitant Earth Fault Protection; Wydawnictwo Politechniki Poznańskiej: Poznań, Poland, 2007. (In Polish) [Google Scholar]
- Winkler, W.; Wiszniewski, A. Protection Automation in Electric Power Systems; WNT: Warszawa, Poland, 2004. (In Polish) [Google Scholar]
- Kujszczyk, S.; Brociek, S.; Flisowski, Z.; Gryko, J.; Nazarko, J.; Zdun, Z. Electric Power Transmission Systems; (In Polish). WNT: Warsaw, Poland, 1997. [Google Scholar]
- Lorenc, J.; Staszak, B. Modelling of phenomena leading to asymmetry of the phase voltages in mv networks. Electrical Engineering. Pozn. Univ. Technol. Acad. J. 2016, 86, 117–127. [Google Scholar]
- Toman, P.; Drapela, J.; Orsagova, J. Solution of voltage asymmetry and reduction of outage time in MV compensated networks. In Proceedings of the 2008 13th International Conference on Harmonics and Quality of Power, Wollongong, Australia, 28 September 2008; pp. 1–7. [Google Scholar] [CrossRef]
- Musierowicz, K.; Lorenc JMarcinkowski ZKwapisz, A. A fuzzy logic- based algorithm for discrimination of damaged line during intermittent earth faults. In Proceedings of the 2005 IEEE Russ Power Tech, St. Petersburg, Russia, 27–30 June 2005; pp. 1–5. [Google Scholar] [CrossRef]
- Lorenc, J.; Musierowicz, K.; Kwapisz, A. Detection of the intermittent earth faults in compensated MV network. In Proceedings of the 2003 IEEE Bologna Power Tech Conference Proceedings, Bologna, Italy, 23–26 June 2003; Volume 2, p. 6. [Google Scholar] [CrossRef]
- Lowczowski, K.; Lorenc, J.; Andruszkiewicz, J.; Nadolny, Z.; Zawodniak, J. Novel Earth Fault Protection Algorithm Based on MV Cable Screen Zero Sequence Current Filter. Energies 2019, 12, 3190. [Google Scholar] [CrossRef]
- Qian, G.; Wang, Q.; He, S.; Dai, W.; Wei, N.; Zhou, N. Harmonic Modeling and Analysis for Parallel 12-Pulse Rectifier under Unbalanced Voltage Condition in Frequency-Domain. Energies 2022, 15, 359–362. [Google Scholar] [CrossRef]
- Kassas, M. Analysis of 12-pulse rectifier operation under balanced and unbalanced voltage source with input impedance. In Proceedings of the 2011 IEEE International Conference on Industrial Technology, Chengdu, China, 10–12 June 2011; pp. 115–120. [Google Scholar] [CrossRef]
- Sikora, A.; Kulesz, B.; Zielonka, A. Application of swarm algorithm to solving voltage unbalance problem in DC tram traction supply system. In Proceedings of the 2018 Innovative Materials and Technologies in Electrical Engineering (i-MITEL), Sulecin, Poland, 18–20 April 2018; pp. 1–6. [Google Scholar] [CrossRef]
- Maswood, A.I.; Wei, S. Harmonic propagation in high power converter under unbalanced and distorted input voltages. In Proceedings of the 2003 IEEE Power Engineering Society General Meeting (IEEE Cat. No.03CH37491), Toronto, ON, Canada, 13–17 July 2003; Volume 3, pp. 1486–1491. [Google Scholar] [CrossRef]
- Maswood, A.I.; Wei, S. A twelve-pulse converter under unbalanced input voltages. In Proceedings of the 2005 International Power Engineering Conference, Singapore, 29 November–2 December 2005; Volume 2, pp. 809–814. [Google Scholar] [CrossRef]
- Toman, P.; Paar, M.; Orsagova, J. Possible Solutions to Problems of Voltage Asymmetry and Localization of Failures in MV Compensated Networks. In Proceedings of the 2007 IEEE Lausanne Power Tech, Lausanne, Switzerland, 1–5 July 2007; pp. 1758–1763. [Google Scholar] [CrossRef]
- Skibko, Z.; Hołdyński, G.; Borusiewicz, A. Impact of Wind Power Plant Operation on Voltage Quality Parameters—Example from Poland. Energies 2022, 15, 5573. [Google Scholar] [CrossRef]
- Hołdyński, G.; Skibko, Z. Influence of the method of operation of the neutral point on voltage asymmetry in MV power network. Electrotech. Rev. 2013, 9, 190–192. (In Polish) [Google Scholar]
- Moloi, K.; Hamam, Y.; Jordaan, J.A. Power Quality Assessment of A Wind Power-Integrated System into the Power Grid. In Proceedings of the 2020 5th International Conference on Renewable Energies for Developing Countries (REDEC), Marrakech, Morocco, 29–30 June 2020; pp. 1–6. [Google Scholar] [CrossRef]
- Muljadi, E.; Butterfield, C.P.; Chacon, J.; Romanowitz, H. Power quality aspects in a wind power plant. In Proceedings of the 2006 IEEE Power Engineering Society General Meeting, Montreal, QC, Canada, 18–22 June 2006; p. 8. [Google Scholar] [CrossRef]
- Shalukho, A.V.; Lipuzhin, I.A.; Voroshilov, A.A. Power Quality in Microgrids with Distributed Generation. In Proceedings of the 2019 International Ural Conference on Electrical Power Engineering (UralCon), Chelyabinsk, Russia, 1–3 October 2019; pp. 54–58. [Google Scholar] [CrossRef]
- Pawelek, R.; Wasiak, I.; Gburczyk, P.; Mienski, R. Impact of wind power plant on electrical power system—Comparison of calculation method and measurements. In Proceedings of the 11th International Conference on Electrical Power Quality and Utilisation, Lisbon, Portugal, 17–19 October 2011; pp. 1–5. [Google Scholar] [CrossRef]
Disclaimer/Publisher’s Note: The statements, opinions and data contained in all publications are solely those of the individual author(s) and contributor(s) and not of MDPI and/or the editor(s). MDPI and/or the editor(s) disclaim responsibility for any injury to people or property resulting from any ideas, methods, instructions or products referred to in the content. |
© 2023 by the authors. Licensee MDPI, Basel, Switzerland. This article is an open access article distributed under the terms and conditions of the Creative Commons Attribution (CC BY) license (https://creativecommons.org/licenses/by/4.0/).