Article

The Contribution of Petroleum Charging Episodes to Different Strike-Slip Fault Zones in the Shunbei Area, the Tarim Basin, NW China

1
Department of Petroleum Geology, School of Earth Resources, China University of Geosciences (Wuhan), Wuhan 430074, China
2
Department of Petroleum, School of Geosciences, Yangtze University, Wuhan 430100, China
3
Sinopec Shengli Oilfield, Dongying 012408, China
*
Author to whom correspondence should be addressed.
Energies 2023, 16(2), 579; https://doi.org/10.3390/en16020579
Submission received: 30 November 2022 / Revised: 24 December 2022 / Accepted: 27 December 2022 / Published: 4 January 2023
(This article belongs to the Section H1: Petroleum Engineering)

Abstract

:
In recent years, newly discovered ultra-deep fault-karst reservoirs in the Shunbei area of the Tarim Basin have greatly increased the prospectivity of the basin and become a hotspot for further hydrocarbon exploration. In this study, the diagenetic sequences of the Lower-Middle Ordovician reservoir were established through observation of thin sections under transmitted light, reflected light, and cathode luminescence. The hydrocarbon charge history in the Shunbei area was reconstructed and associated with a series of diagenetic events using fluid inclusion microthermometric measurements combined with one-dimensional basin modeling. The results show that the Shunbei area has experienced three hydrocarbon charging episodes in total, in the late Caledonian, late Hercynian, and late Himalayan. Finally, the relationship between measured QF-535 factors and the API gravity of crude oil was used to quantify the level of contribution of each of the petroleum charging episodes to the No. 1, No. 5, and No. 7 fault zone reservoirs. The contribution of early hydrocarbon charging episodes gradually increases from west to east in the Shunbei area. This increase was driven by different tectonic events throughout geological history and the subsequent evolution of paleo-structural patterns. This study has a significant impact on marine carbonate reservoir evaluation in strike-slip fault zones in China.

1. Introduction

Worldwide, carbonate reservoirs are known to be rich in hydrocarbon resources and are an important frontier in the field of deep oil and gas exploration [1]. Carbonate reservoirs are mainly distributed across the Middle East, North America, and Central Asia, with a burial depth typically less than 3000 m [2,3]. Normally, deep carbonate rocks are compacted during diagenesis, resulting in poor porosity and permeability, which is not considered suitable for reservoir units [4,5,6]. However, fracture–cave systems can develop along the strike-slip faults after undergoing multi-stage tectogenesis and dissolution–cementation transformation by deep or subsurface-derived fluids, accompanied by the development of dissolution caves and various pore spaces, thus forming ultra-deep carbonate fault-karst reservoirs with commercial value, which is fundamentally different from the formation mechanism of shale and tight sandstone gas reservoirs [7,8,9]. Chinese exploration companies have discovered several large oilfields in these ultra-deep strata, such as the Puguang gas field in the Sichuan Basin, the Tahe Oilfield and Halahatang Oilfield in the Tarim Basin, etc., and consequently, the exploration prospectivity and distribution of ultra-deep marine strata have been the subject of a large number of investigations and exploration programs [10,11]. One such program, in the Shunbei area, located in the northern Shuntuoguole Low Uplift area of the Tarim Basin, resulted in the discovery of large-scale commercial reserves, specifically an oil field with an annual oil and gas output exceeding one million tons. This area’s main exploration target strata are carbonate rocks of Ordovician age, with an average burial depth of over 7500 m and a calculated resource of 17 × 108 t oil equivalent. The oil and gas enrichment zone is distributed along strike-slip faults [12,13,14], indicating that the faults play an important role in controlling the distribution of high-quality reservoirs.
Following the discovery of this oil field in the Shunbei area, considerable research with important theoretical and practical significance was undertaken on the structural characteristics of the strike-slip faults and the reservoir formation mechanisms of oil reservoirs in the Shunbei area. Most researchers concluded that there is a strong coupling between oil migration and the structural evolution of the strike-slip fault zone in the Shunbei area. Previous studies based on the microthermometry of fluid inclusions and analysis of hydrocarbon geochemical characteristics proposed multi-episodes of oil and gas charging in the Shunbei area. Qi (2016) and Jiao (2018) concluded that the hydrocarbon charging period in the Shuntuoguole Low Uplift was the late Hercynian and Himalayan [12,15]. Wang et al. (2020) investigated the fluid inclusion assemblage (FIA) data to determine the homogenization temperature of primary oil inclusions and coeval aqueous inclusions and subsequently “projected” this temperature data onto burial history curves marked with isotherms [16]. This allowed them to determine that there were two episodes of oil and gas accumulation in the Shunbei No. 5 fault zone, which included the late Caledonian and late Hercynian–Indosinian, the second charging episode comprising the main hydrocarbon accumulation period. Lu et al. (2020) considered that the petroleum accumulation of the Shunbei No. 5 fault zone reservoir occurred in the late Ordovician, and petroleum accumulation of the Shunbei No. 1 fault zone reservoir occurred in the Silurian [17]. Wang et al. (2019) and Han (2021) combined data from coeval aqueous inclusions in oil inclusions with burial history data and concluded that three stages of hydrocarbon accumulation occurred in the Shunbei No. 1 fault zone reservoir in the late Caledonian, late Hercynian, and late Himalayan [18,19]. Chen et al. (2020), using the same approach, concluded that there were at least two episodes of hydrocarbon accumulation in the Shunbei area, in the late Hercynian and the late Himalayan [20]. The hydrocarbon accumulation process in the Shunbei area is very complicated due to the large burial depths, the great age of the reservoir rocks, and the effects of multi-stage tectonic activities. Previous research on the hydrocarbon charging history in the Shunbei area arrived at wildly different conclusions and lacked information on the difference in petroleum charging events into different fault zone reservoirs and their contribution at different periods through geological history. In the present study, the Lower Ordovician carbonate rocks in the No. 1, No. 5, and No. 7 fault zones in the Shunbei area were sampled. On the basis of reservoir calcite cement vein microscopic observations, microthermometry, and fluorescence analysis of fluid inclusions, combined with organic geochemical data from the reservoir oils, we reconstructed the oil and gas accumulation history of the Shunbei area and quantitatively calculated the fractional contribution of different petroleum charging episodes in the No. 1, No. 5, and No. 7 fault zone reservoirs by determining the API of the oil inclusions. Furthermore, the factors controlling the different contributions made by the different charging episodes are analyzed. This study offers new insights into marine carbonate oil and gas exploration and will ideally eventually be used as a reference on the hydrocarbon accumulation and distribution in ultra-deep carbonate reservoirs.

2. Geological Setting

The Tarim Basin is located in the northwest of China and covers an area of about 5.6 × 10⁴ square kilometers. It is rich in hydrocarbon resources but geologically extremely complex; hence, hydrocarbon exploration is difficult [21]. The Shuntuoguole Low Uplift is located in a desert-covered area in the center of the Tarim Basin, close to the Katake Uplift, the Guchengxu Uplift, the Awati Depression, and the Manjiaer Depression [22], including the Shunbei, Shuntuo, Shunxi, and Shunnan exploration areas. The present-day structure is in a relatively low-lying position (Figure 1). The region has experienced at least four tectonic episodes, namely, the middle Caledonian, the late Caledonian–early Hercynian, the late Hercynian–Indosinian, and the Yanshan–Himalayan [12,23,24]. Each of these episodes had different effects controlling the formation and evolution of strike-slip faults. In the middle Caledonian tectonic episode, large-scale strike-slip faults developed, and the last three tectonic movements resulted in the superimposition of strike-slip strain re-activating the original middle Caledonian age strike-slip faults. The structural setting of a western platform and an eastern basin within the Tarim Basin continued from the Cambrian to the Ordovician, during which time the Shuntugoule Low Uplift was completely infilled. At the beginning of the Cambrian, influenced by the early Caledonian orogeny, the basin underwent rapid extension. Sea level rose, and the Yuertusi Formation (Є1y) source rocks were widely deposited. The Ordovician strata in the Shunguole Low Uplift were strongly compressed by the middle Caledonian Tectonic Episode I. The sedimentary facies changed from the restricted–semi-restricted–opening platform of the early–middle Ordovician to shallow sea incorporated shelf facies in the late Ordovician. This resulted in the well-developed Lower Paleozoic source–reservoir–cap play in the Shunbei area with ideal conditions for the formation of large oil and gas fields. The reservoirs and caprocks of the Lower Paleozoic age in the study area were all developed in the Ordovician, and the Yijianfang Formation (O1–2y) and the Yingshan Formation (O2yj) carbonate rocks are the main hydrocarbon exploration targets. From bottom to top of the Ordovician strata, the lithologically of the Penglaiba Formation (O1p) is relatively uniform, which is characterized by grey dolostones interbedded with lime dolostones with a small amount of dolomitic limestone, unconforming contact with the underlying Cambrian strata. The Yingshan Formation’s member is mainly characterized by micritic limestone and sparry granular limestone in lithology. In contrast, the lower member is formed of dolomitic limestone and micritic limestone, conforming contact with the underlying Penglaiba dolostone formation. The lithology of the Yijianfang Formation is described as a sandy-clastic micritic limestone and a grainy limestone, which conformably overlies the underlying Yingshan Formation. The sedimentary thickness of the Qiaerbake (O3q) and Lianglitage (O3l) Formations is relatively thin; these formations consist lithologically of mudstones interbedded with thin limestones and argillaceous siltstones. The overlying fine-grained sediments of the Sangtamu Formation (O3s) act as regional cap rock.
Multiple faults trending NW, NE, and SN developed in the Shunbei area [25]. The No. 1 strike-slip fault is NE-trending, while the No. 5 and No. 7 strike-slip faults are NW-trending. The No. 5 fault has a recognizable length of about 270 km and runs from the Taibei Uplift to the Tazhong Uplift [24]. The No. 1 and No. 5 fault zones show deformation at both deep and shallow levels. These faults extend into the basement. In contrast, the No. 7 fault zone is relatively constrained vertically (Figure 1). At present, major hydrocarbon discoveries have been made in the No. 1 fault zone reservoir and the north section of the No. 5 fault zone reservoir, with oil fields distributed along the major faults. It is concluded that the reservoir presence/absence is primarily controlled by structural activity and fluid dissolution. The strike-slip fault system that experienced repeated reactivation provided migration pathways for multi-stage fluid-related diagenesis of the carbonate rocks and vertical hydrocarbon migration [15,26,27].
Figure 1. The location of the study area within the Tarim Basin and the regional stratigraphic column of the Ordovician formation (Modified after [17]).
Energies 16 00579 g001

3. Materials and Methods

A total of 41 samples ranging in depth from 7357.50 m to 8121.61 m were collected for fluid inclusion system analysis. The experiments were conducted at the Key Laboratory of Tectonics and Petroleum Resources, Ministry of Education, China University of Geosciences (Wuhan). All collected samples were prefabricated into double-sided polished wafers approximately 100 to 150 μm thick. The instrument used for cold cathode luminescence (CL) observation was RELIOTRON III with an operating current of 300~500 μA and an operating voltage of 8~13 KV. The thin sections were observed with a Nikon 80I dual-channel fluorescence microscope to identify the oil inclusions and determine their maturity, and the excitation wavelength of ultraviolet light was 330–380 nm. The hydrocarbon inclusions and coeval aqueous inclusions were subjected to microthermometry and salinity measurements using a Linkam THMGS600 heating-freezing stage with an accuracy of ±0.1 °C. Firstly, the thin sections were cut into suitable sizes with a glass knife and put into a heating-freezing stage. Then, the initial heating rate was 10 °C/min, which decreased to 5 °C/min when the bubble beat rapidly in the inclusion, and finally rose at the rate of 1 °C/min until the homogenization temperatures (Th) were measured. When cooling, it was cooled naturally first, and when it was close to room temperature, the freezing stage was started, and then cooled down to –90~–100 °C at the rate of 10 °C/min, then rose to –30 °C at 10 °C/min, then rose to –22 °C at 5 °C/min, and finally rose at the rate of 1 °C/min until the ice final melting temperatures (Tm) were measured. The conversion of salinity from the final melting temperature was based on Bodnar’s (1993) formula [28].

4. Results

4.1. Petrology and Mineralogy

Core samples from the Yijianfang Formation and the Yingshan Formation are comprised lithologically of micritic limestone, dolomitic limestone, and bioclastic limestone (Figure 2 and Figure 3), showing siliceous alteration (Figure 2b,c). Observed available hydrocarbon pore space includes fractures, dissolution pores, and caves (Figure 2a). The fractures are tectonic in origin and include high-angle and horizontal fractures, completely or partially filled with calcite cement, with residual bitumen observed proximal to fracture walls and stylolites (Figure 2c and Figure 3b). From observation of fracture cross-cutting relationships, at least three episodes of fracturing can be identified, resulting in fracture sets F1, F2, and F3 (Figure 2b,c). F1 fractures are filled with near-surface derived calcite cement, F2 fractures are filled with two generations of calcite cement mineralization and bitumen during the burial stage, and F3 fractures are either unfilled or partially infilled with bitumen. There are four generations of fluid inclusion-bearing calcite cements. Under Cathode Luminescence, these different cements show CL colors that are dark brown, orange, and bright yellow. The calcite cement (C1), showing dark CL color, is characterized by axial-radial and equal-thickness fibrous ring edges (Figure 3c). C1 is developed in biological moldic pores (Figure 2d) and dissolution pores formed during early diagenetic karstification, where it shows geopetal structures (Figure 2g), indicating early calcite cementation. The calcite cement C2 showing brown CL color has the characteristics of shallow burial diagenetic stage alteration. It is mostly symbiotic with stylolites and pyrobitumen, and in thin sections, cracks or compacted broken particles can be observed (Figure 2e). The calcite cements C3 (orange CL color) and C4 (bright-yellow CL color) have the characteristics of being deposited during the deep burial stage. These cements consist of coarse calcite cement crystals showing a rough crystal mosaic texture, with some crystals developing growth zoning (Figure 2f,h).
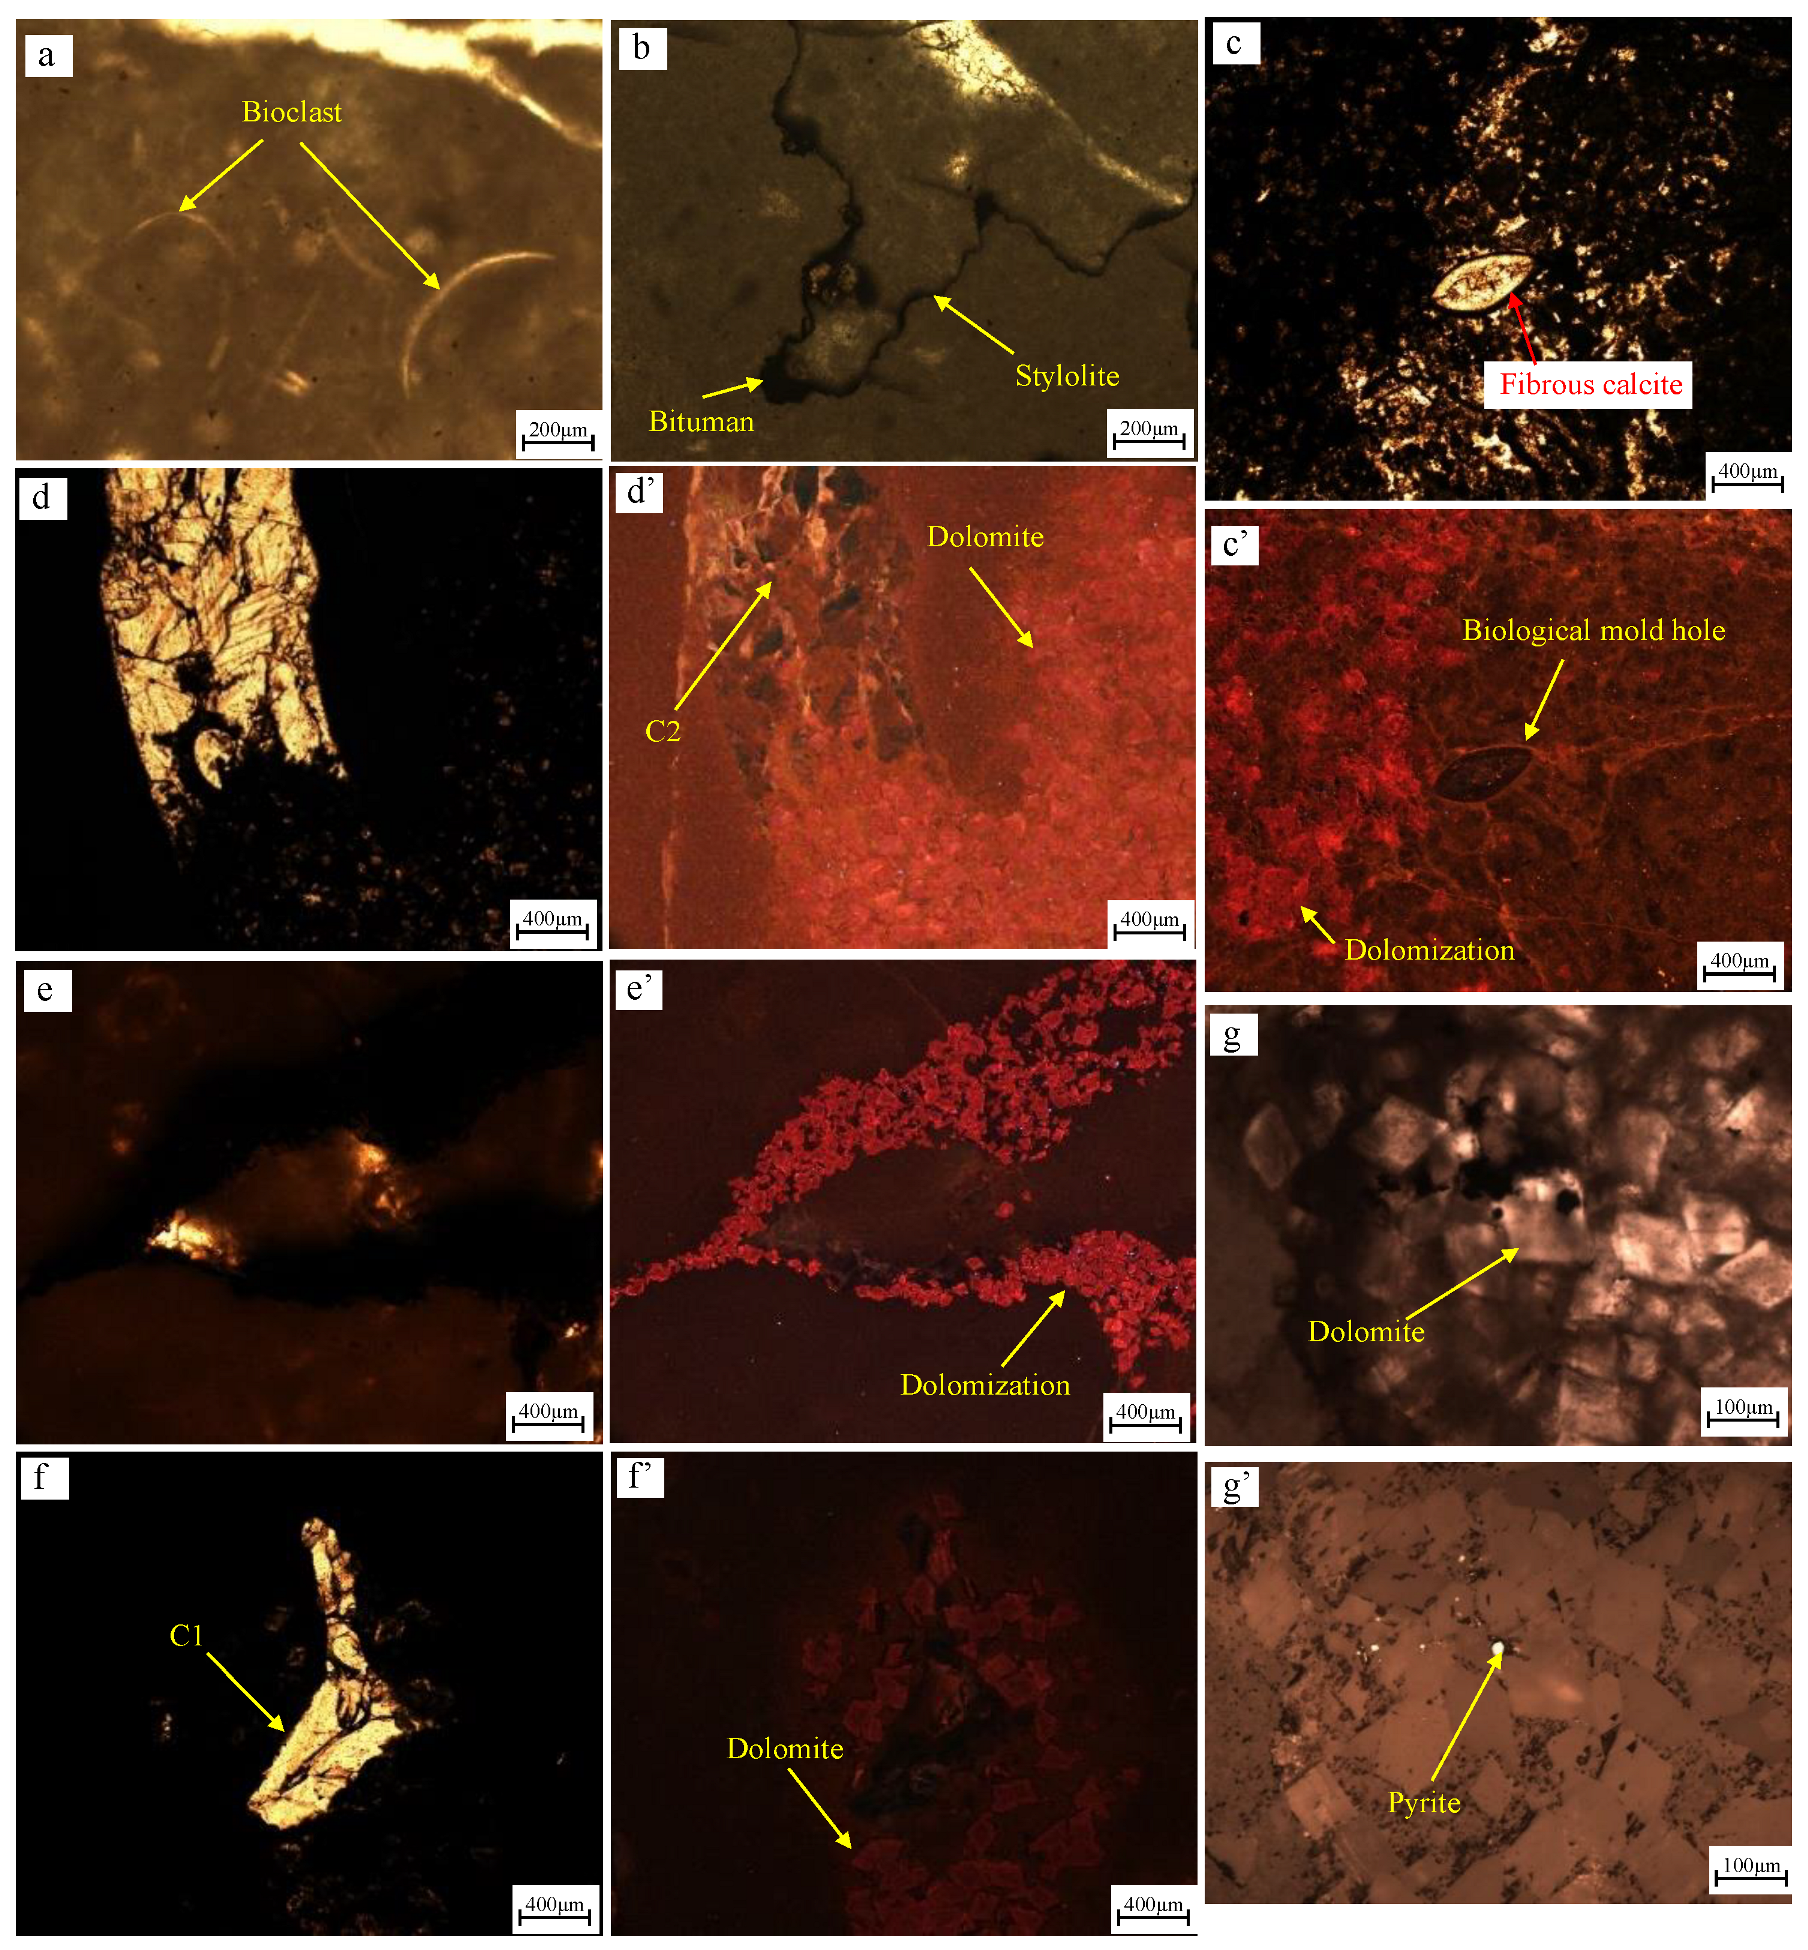
Dolomitization is also common in the Shunbei area. There are three types of dolomite: matrix dolomite (Figure 3c,d), dolomite distributed along stylolites (Figure 3e), and dolomite in the dissolution pores (Figure 3f). The matrix dolomite is widely distributed. Two generations of matrix dolomite can be recognized. The first-generation dolomite is characterized by subhedral to anhedral crystals and shows scarlet CL color. The second-generation dolomite is characterized by subhedral to euhedral crystals of about 100 μm–200 μm in size and shows crimson CL color. The second-generation dolomite overlies the C2 calcite cement, indicating that dolomitization occurred after the second generation of calcite cementation. The dolomite distributed along pressure-dissolution stylolites is characterized by subhedral to euhedral crystals of about 50 μm–100 μm in size. It shows scarlet luminescence CL color, indicating that the dolomite and stylolites were formed contemporaneously. Encountering dolomite fill in dissolution pores is relatively rare and, where observed, is characterized by subhedral to euhedral crystals about 100 μm–250 μm in size. It shows scarlet CL color and is commonly associated with solid bitumen. Additionally, pyrite is observed in the dolomite of the Ordovician Yijianfang Formation (O2yj) in a sample from the SHBL1 well (Figure 3g), indicating that pyritization occurred after dolomitization.
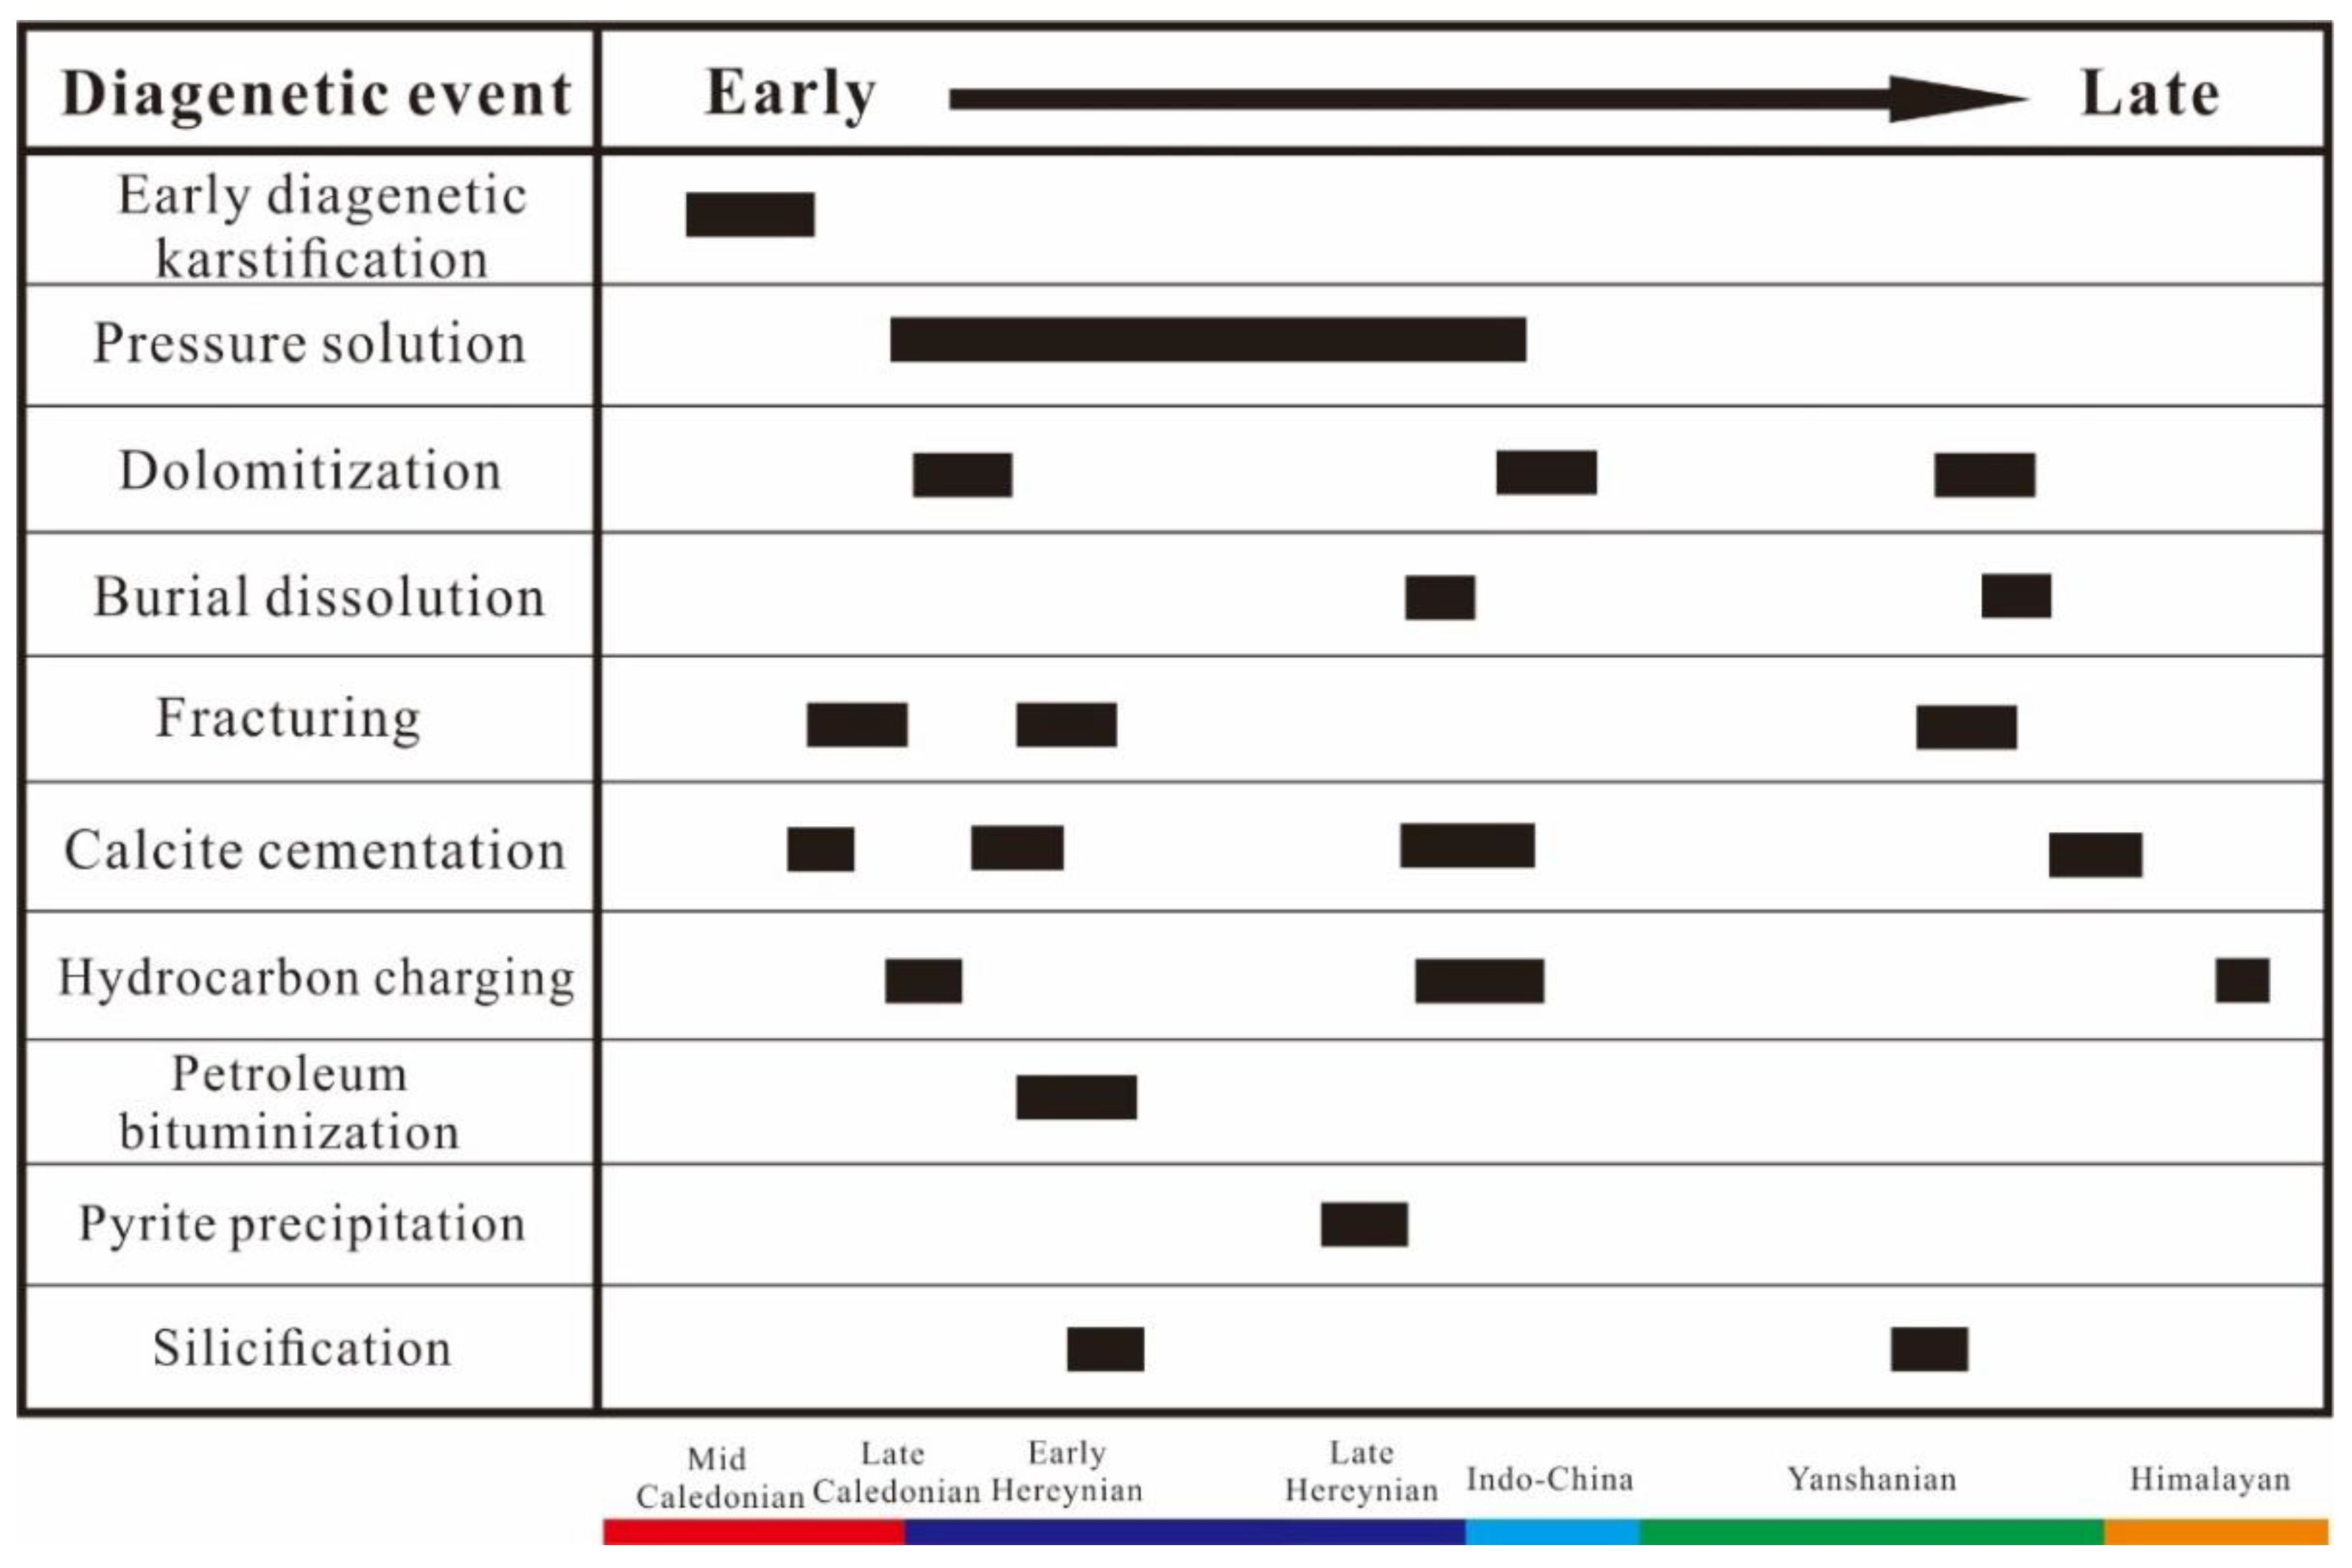
Based on information from petrographic analysis in combination with vein cross-cutting relationships [29], the diagenetic sequence and the relative timing of hydrocarbon-bearing fluid migration can be delineated. The sequence of diagenetic alteration in the Lower-Middle Ordovician in different fault zones in the Shunbei area is the same. In the early diagenetic stage, the Shunbei area suffered from syngenetic–quasi-syngenetic karstification related to a relative fall in sea level. This resulted in the observed biological moldic pores and intragranular dissolution pores, characteristic of selective dissolution. At the same time, seafloor cementation occurred, resulting in fibrous calcite cement formation, and calcite cement was deposited on the walls of the karstification-related dissolution cavities. The first episode of fracture formation also occurred in the early diagenetic stage. With the continued burial in the middle–shallow burial stage, compaction, pressure dissolution, and burial dolomitization took place, forming pressure-dissolution stylolites with dolomite distributed along the stylolites. The second-generation calcite cement filled the first-stage fractures F1 and early diagenetic dissolution pores that had not been completely filled by the first-generation calcite cement. The first episode of hydrocarbon charging accompanied the fluid movement during this stage. During the late Caledonian to early Hercynian period, tectonic uplift resulted in the second stage of fracturing of the formation and the bituminization of the early charged crude oil. During the middle–deep burial stage, the first stage of burial dissolution occurred. Subsequently, the third generation of calcite cement filled fractures and dissolution pores, and this stage is associated with the second hydrocarbon charging episode. With further tectonic uplift, the third stage of fracturing occurred, and subsequent deep burial of the formation resulted in late dolomitization, dissolution, and calcite cement deposition, accompanied by the final episode of hydrocarbon charging (Figure 4).

4.2. Fluid Inclusions

4.2.1. Fluid Inclusion Petrography

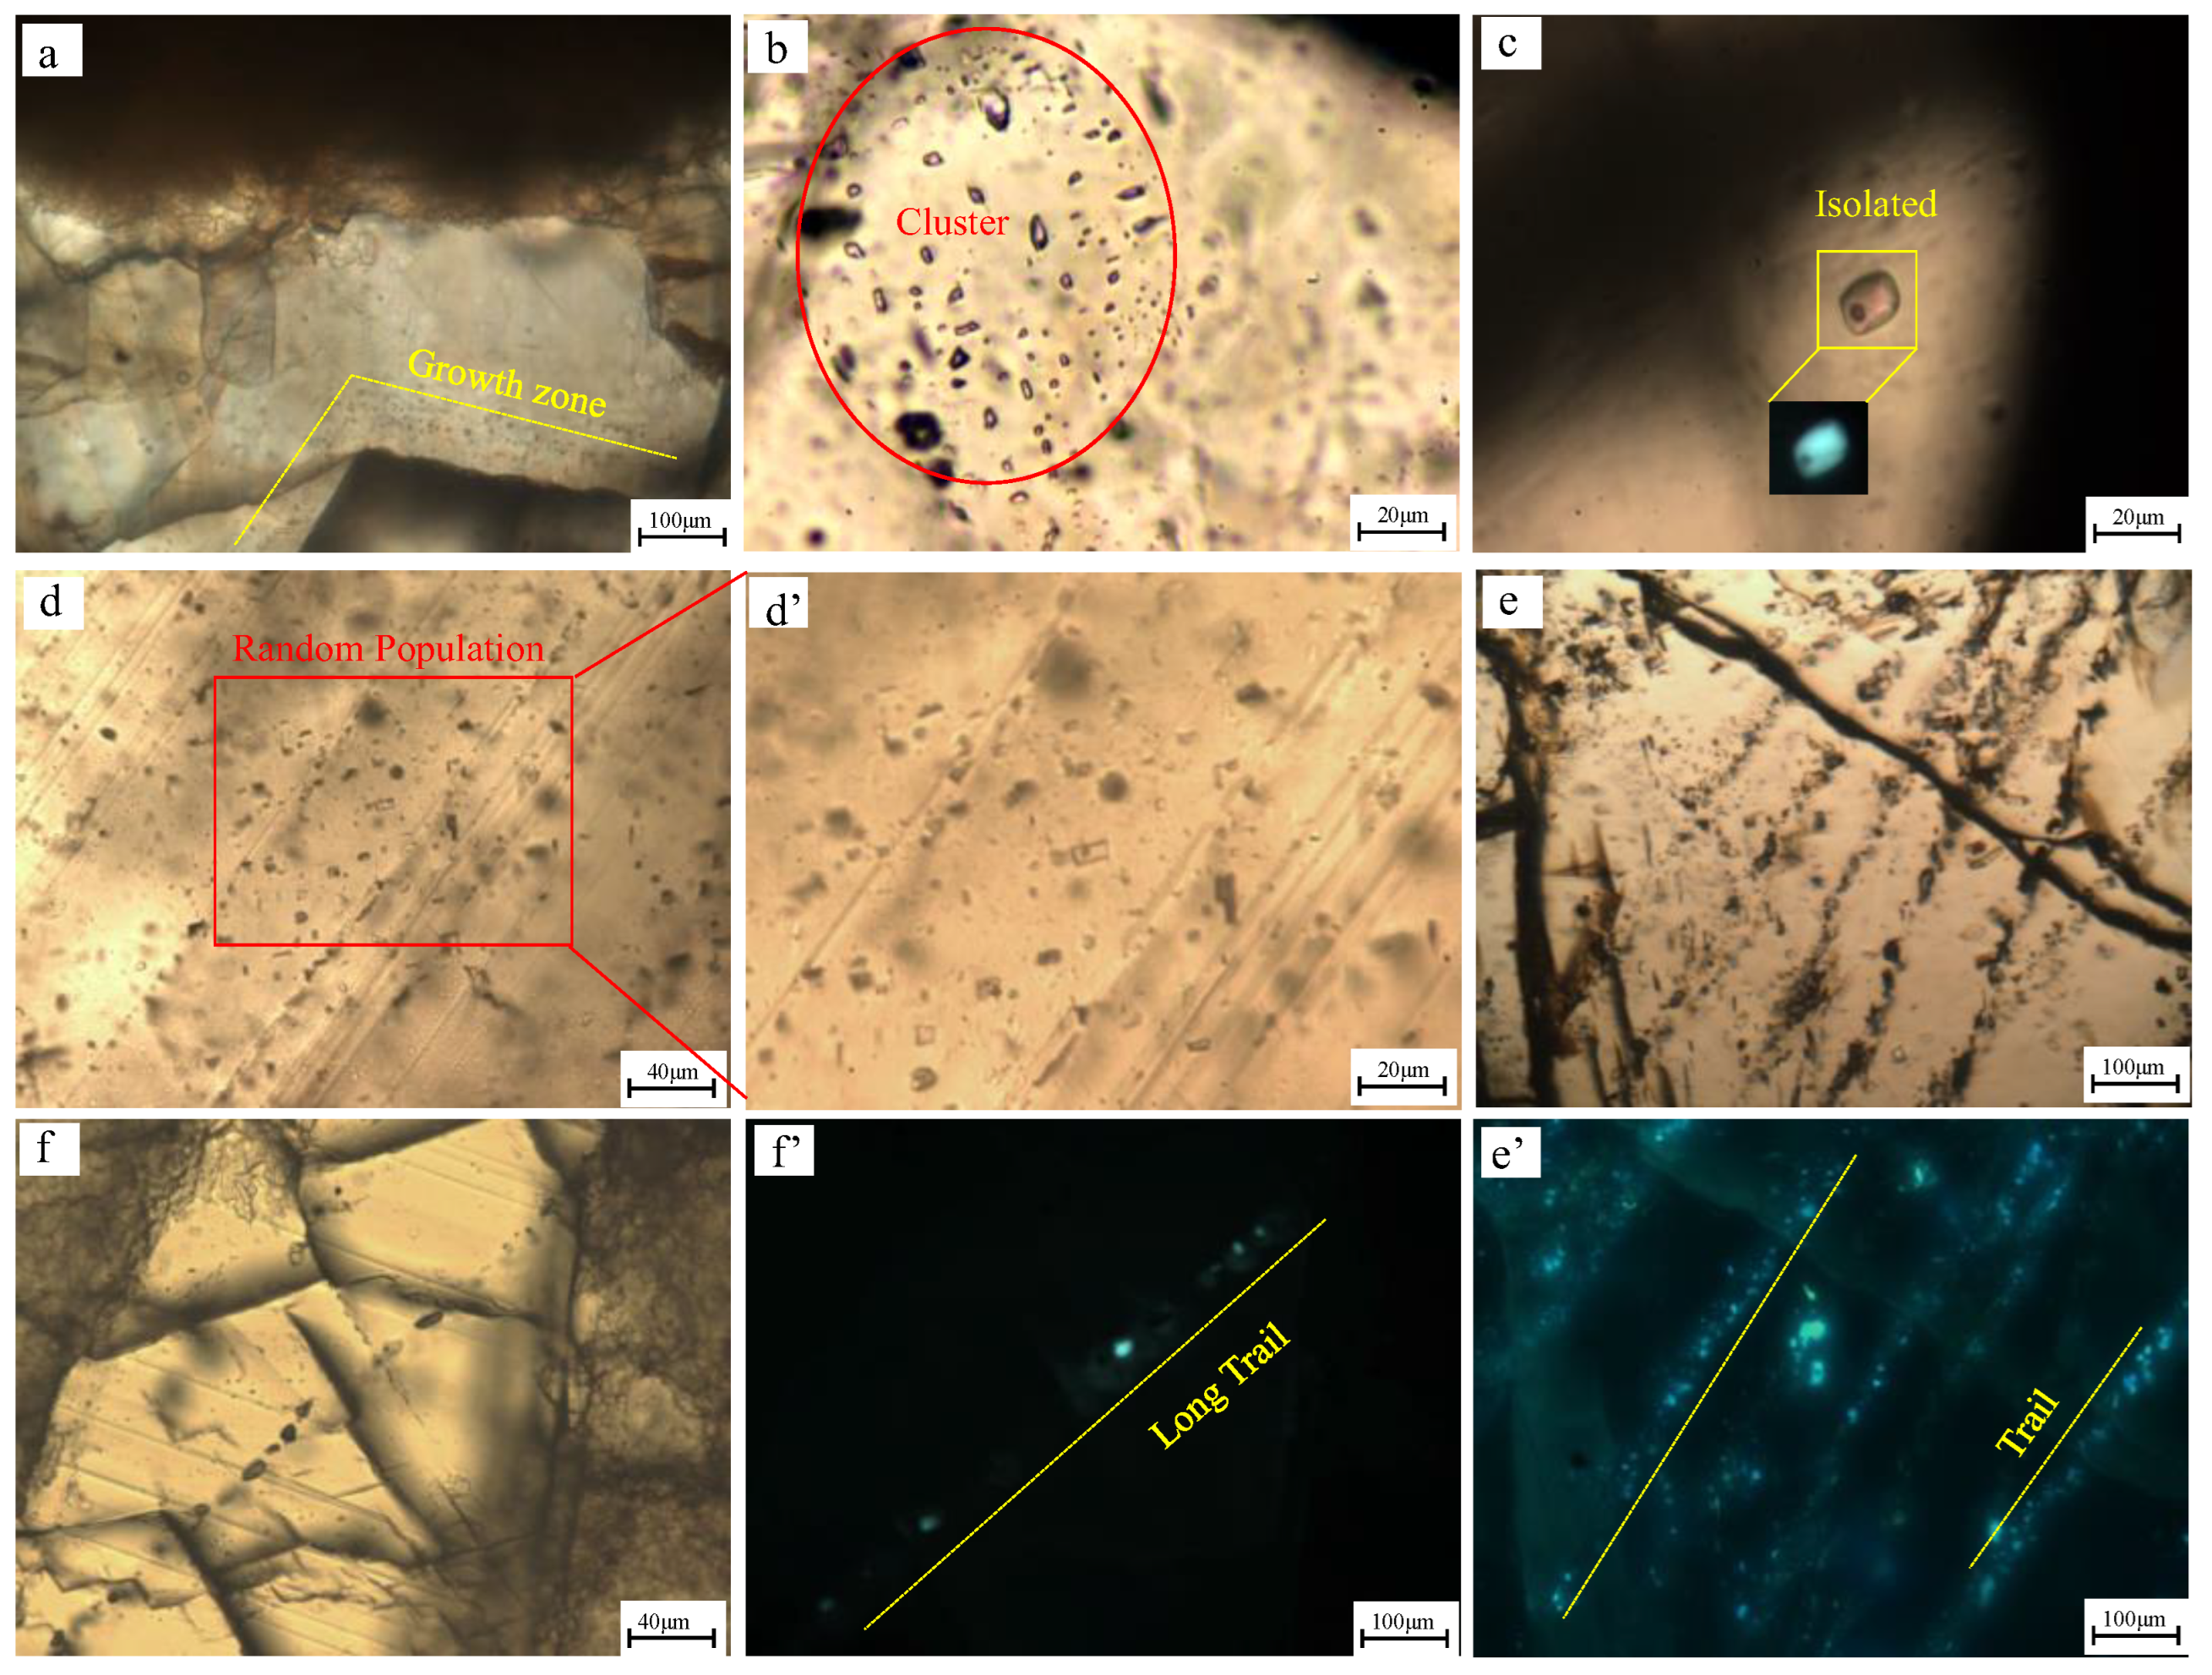
Four types of fluid inclusions were observed in the coarse crystalline calcite cements at room temperature: mono-phase liquid (oil or aqueous) inclusions, mono-phase gas inclusions, di-phase gas-liquid inclusions (aqueous-dominant or oil-dominant), tri-phase gas-oil-aqueous inclusions, which are mainly in sub-circular, elliptical, irregular, and elongate shapes. These fluid inclusions’ long axis was measured in the range of 3–18 μm. The gas-phase volume fraction is in the range of 5–20%. The distribution modes of inclusions include growth zone distribution, cluster distribution, isolated distribution, random population, and fluid inclusions in annealed micro-fractures (Figure 5). The growth zone is a characteristic feature of mineral growth, so the inclusions located in mineral growth zones are considered to be reliable primary inclusions (Figure 5a). The second most important inclusions are cluster-distributed and isolated inclusions, which are also considered to be most likely primary inclusions (Figure 5b,c). Fluid inclusions observed in annealed micro-fractures may be primary or secondary. Because annealed micro-fractures may be formed during mineral growth, they may capture inclusions, which are then distributed along micro-fractures. The information inclusions carry can describe the physical properties, components, and physicochemical compositions of the hydrocarbon fluids and pore waters at the time of mineral formation. In the case of micro-fractures formed after mineral precipitation, the information carried by captured inclusions in micro-fractures does not reflect the conditions at the time of mineral formation. These micro-fractures are mainly long trail micro-fractures that cut through mineral boundaries, and the associated fluid inclusions in long annealed micro-fractures are considered to be secondary inclusions (Figure 5f).

4.2.2. Fluorescence Spectroscopy

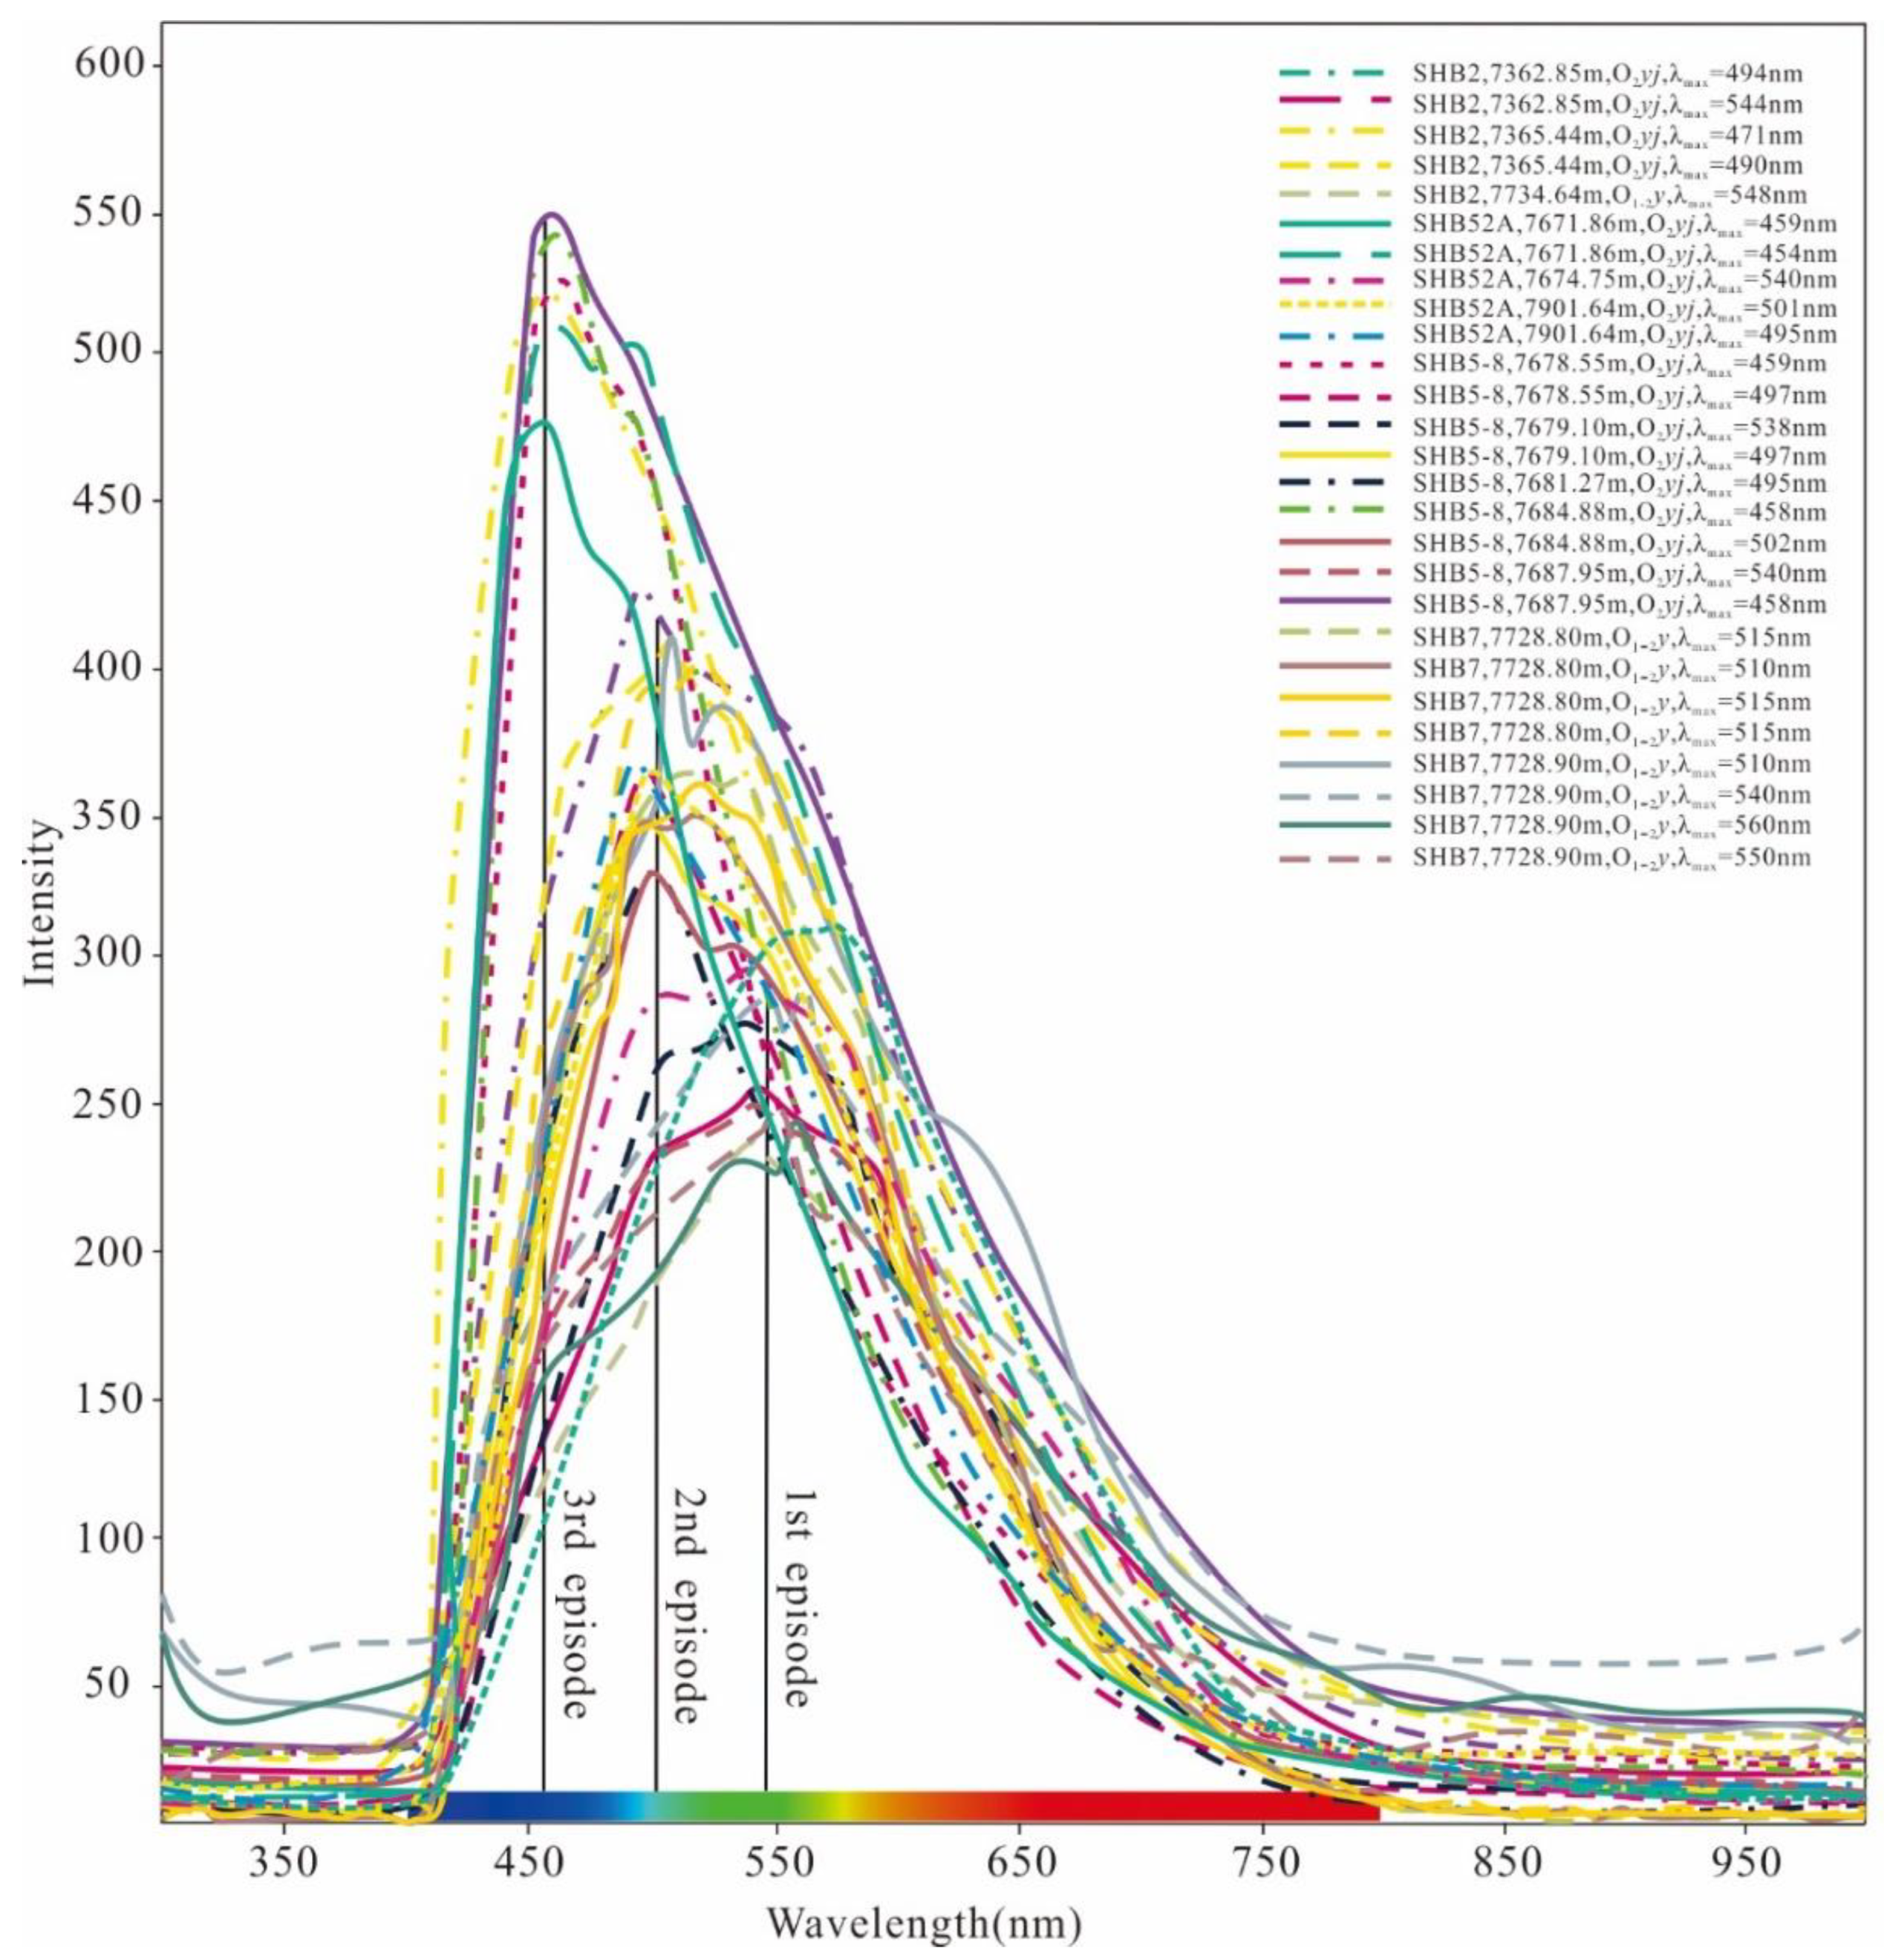
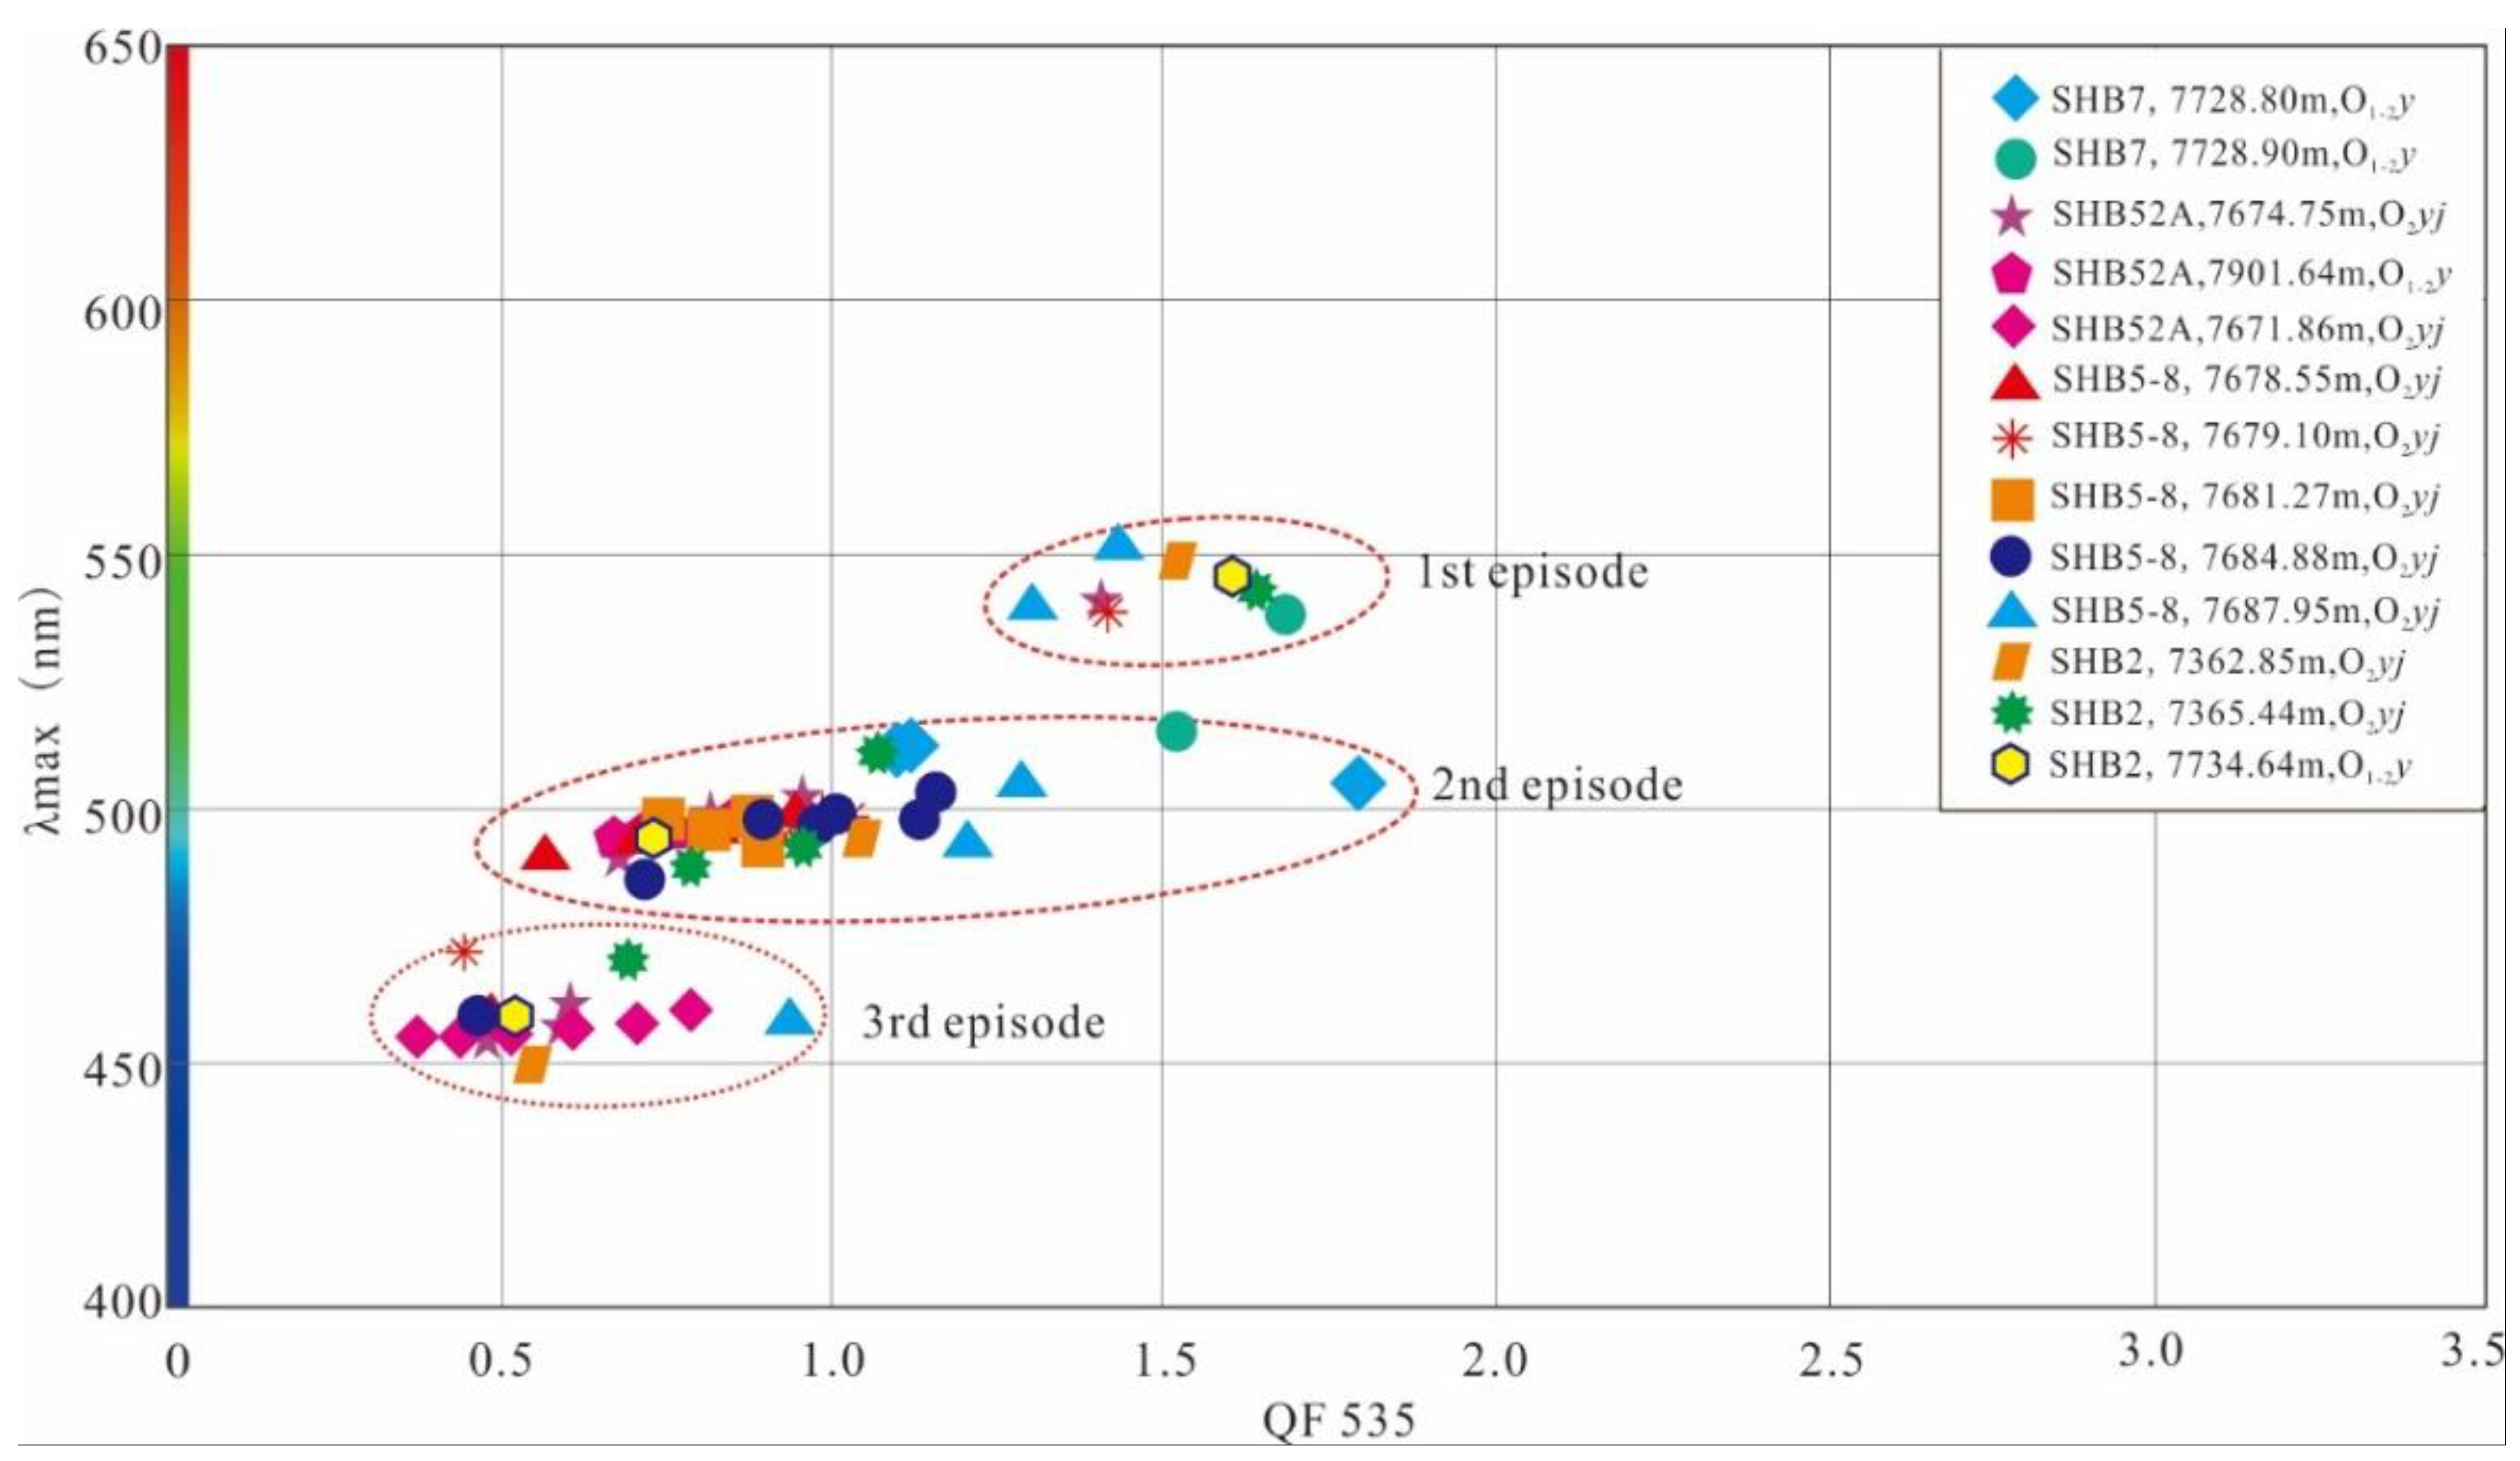
The fluorescence spectrum characteristics of oil inclusions investigated from different fault zone reservoirs exhibit systematic variations (Table 1). The wavelength of the maximum intensity (λmax) of the spectra and the QF-535 factor values of the No. 1 fault zone reservoirs are 455.6 nm–548.1 nm and 0.47–1.63. The oil inclusions have different fluorescence colors (yellow-green, blue-green, and bright blue), indicative of three different maturities of charging oil. The λmax and QF-535 values of the No. 5 fault zone reservoirs are 452.0 nm–576.9 nm and 0.37–2.02, and the oil inclusions show three different fluorescence colors. The λmax and QF-535 values from the No. 7 fault zone reservoirs are 505.6 nm–550.8 nm and 1.06–1.85, and the inclusion oils only show two different fluorescence colors. According to the value range distribution of λmax and QF-535, three distinct periods can be defined, representing three episodes of hydrocarbon expulsion. The fluorescence spectra from several reservoir oil samples were also obtained, as shown in Table 1. The λmax and QF-535 values of reservoir oil from the SHB2, SHB52A, and SHB5-8 wells are similar, whereas the λmax and QF-535 values from the SHB7 well are larger, indicative of a lower maturity oil.

4.2.3. Microthermometry

When oils are captured in fluid inclusions while migration from source rocks into the reservoir rocks is taking place, this gives information on the oil charge. In this case, the bi-phase oil inclusions’ homogenization temperatures can be significantly lower than their trapping temperatures because of the presence of a flat isochore and the complex composition of the oil inclusions [30]. For this reason, compared with oil inclusions, coeval aqueous inclusions are more suitable for recovering the entrapment temperature and pressure of inclusions. Table 2 shows partial homogenization temperatures (Th) and salinity data; the complete microthermometric data from this study can be found in Supplementary Table S1. For core samples from the No. 1 fault zone reservoir, the Th values of oil inclusions are in the range of 37.3 °C–97.2 °C, while the Th values of coeval aqueous inclusions are in the range of 89.4 °C–164.1 °C with salinities of 3.5 wt%–19.4 wt% NaCl. For core samples from the No. 5 fault zone reservoir, the Th values of oil inclusions are in the range of 47.9 °C–136.8 °C, while coeval aqueous inclusions have Th values in the range of 84.3 °C–149.4 °C with salinities of 1.4 wt%–10.9 wt% NaCl. For the core samples from the No. 7 fault zone reservoir, the Th values of oil inclusions are in the range of 59.8 °C–86.3 °C, while coeval aqueous inclusions have Th values in the range of 96.7 °C–158.6 °C with salinities of 4.2 wt%–17.9 wt% NaCl.

5. Discussion

5.1. Hydrocarbon Charging History

5.1.1. Fluorescence Spectrum Analysis

The fluorescence color of oil inclusions is widely used to indicate the maturity of the inclusion oil because it is measurable [31,32,33,34]. With increasing maturity, the fluorescence color of oil inclusions changes from yellow to blue [35,36]. In addition, data such as fluorescence color combined with fluorescence spectrum parameters, such as the wavelength of maximum intensity (λmax) and/or the QF-535 factor, are helpful in delineating the reservoir oil charging history and estimating the API gravity of the oil inclusions [37,38]. The fluorescence spectrum of oil inclusions in the Shunbei area was analyzed, and the λmax revealed that there were three oil inclusion fluorescence colors: yellow-green, blue-green, and bright blue, representing three episodes of petroleum charge with increasing hydrocarbon maturities (Figure 6 and Figure 7). In addition, only yellow-green fluorescing and blue-green fluorescing oil inclusions were observed in the calcite cement veins of the No. 7 fault zone reservoir, indicating that oil charging in this fault zone reservoir mainly took place in the early charging episodes, resulting in a lack of late high-maturity oils.

5.1.2. Timing of Petroleum Charge

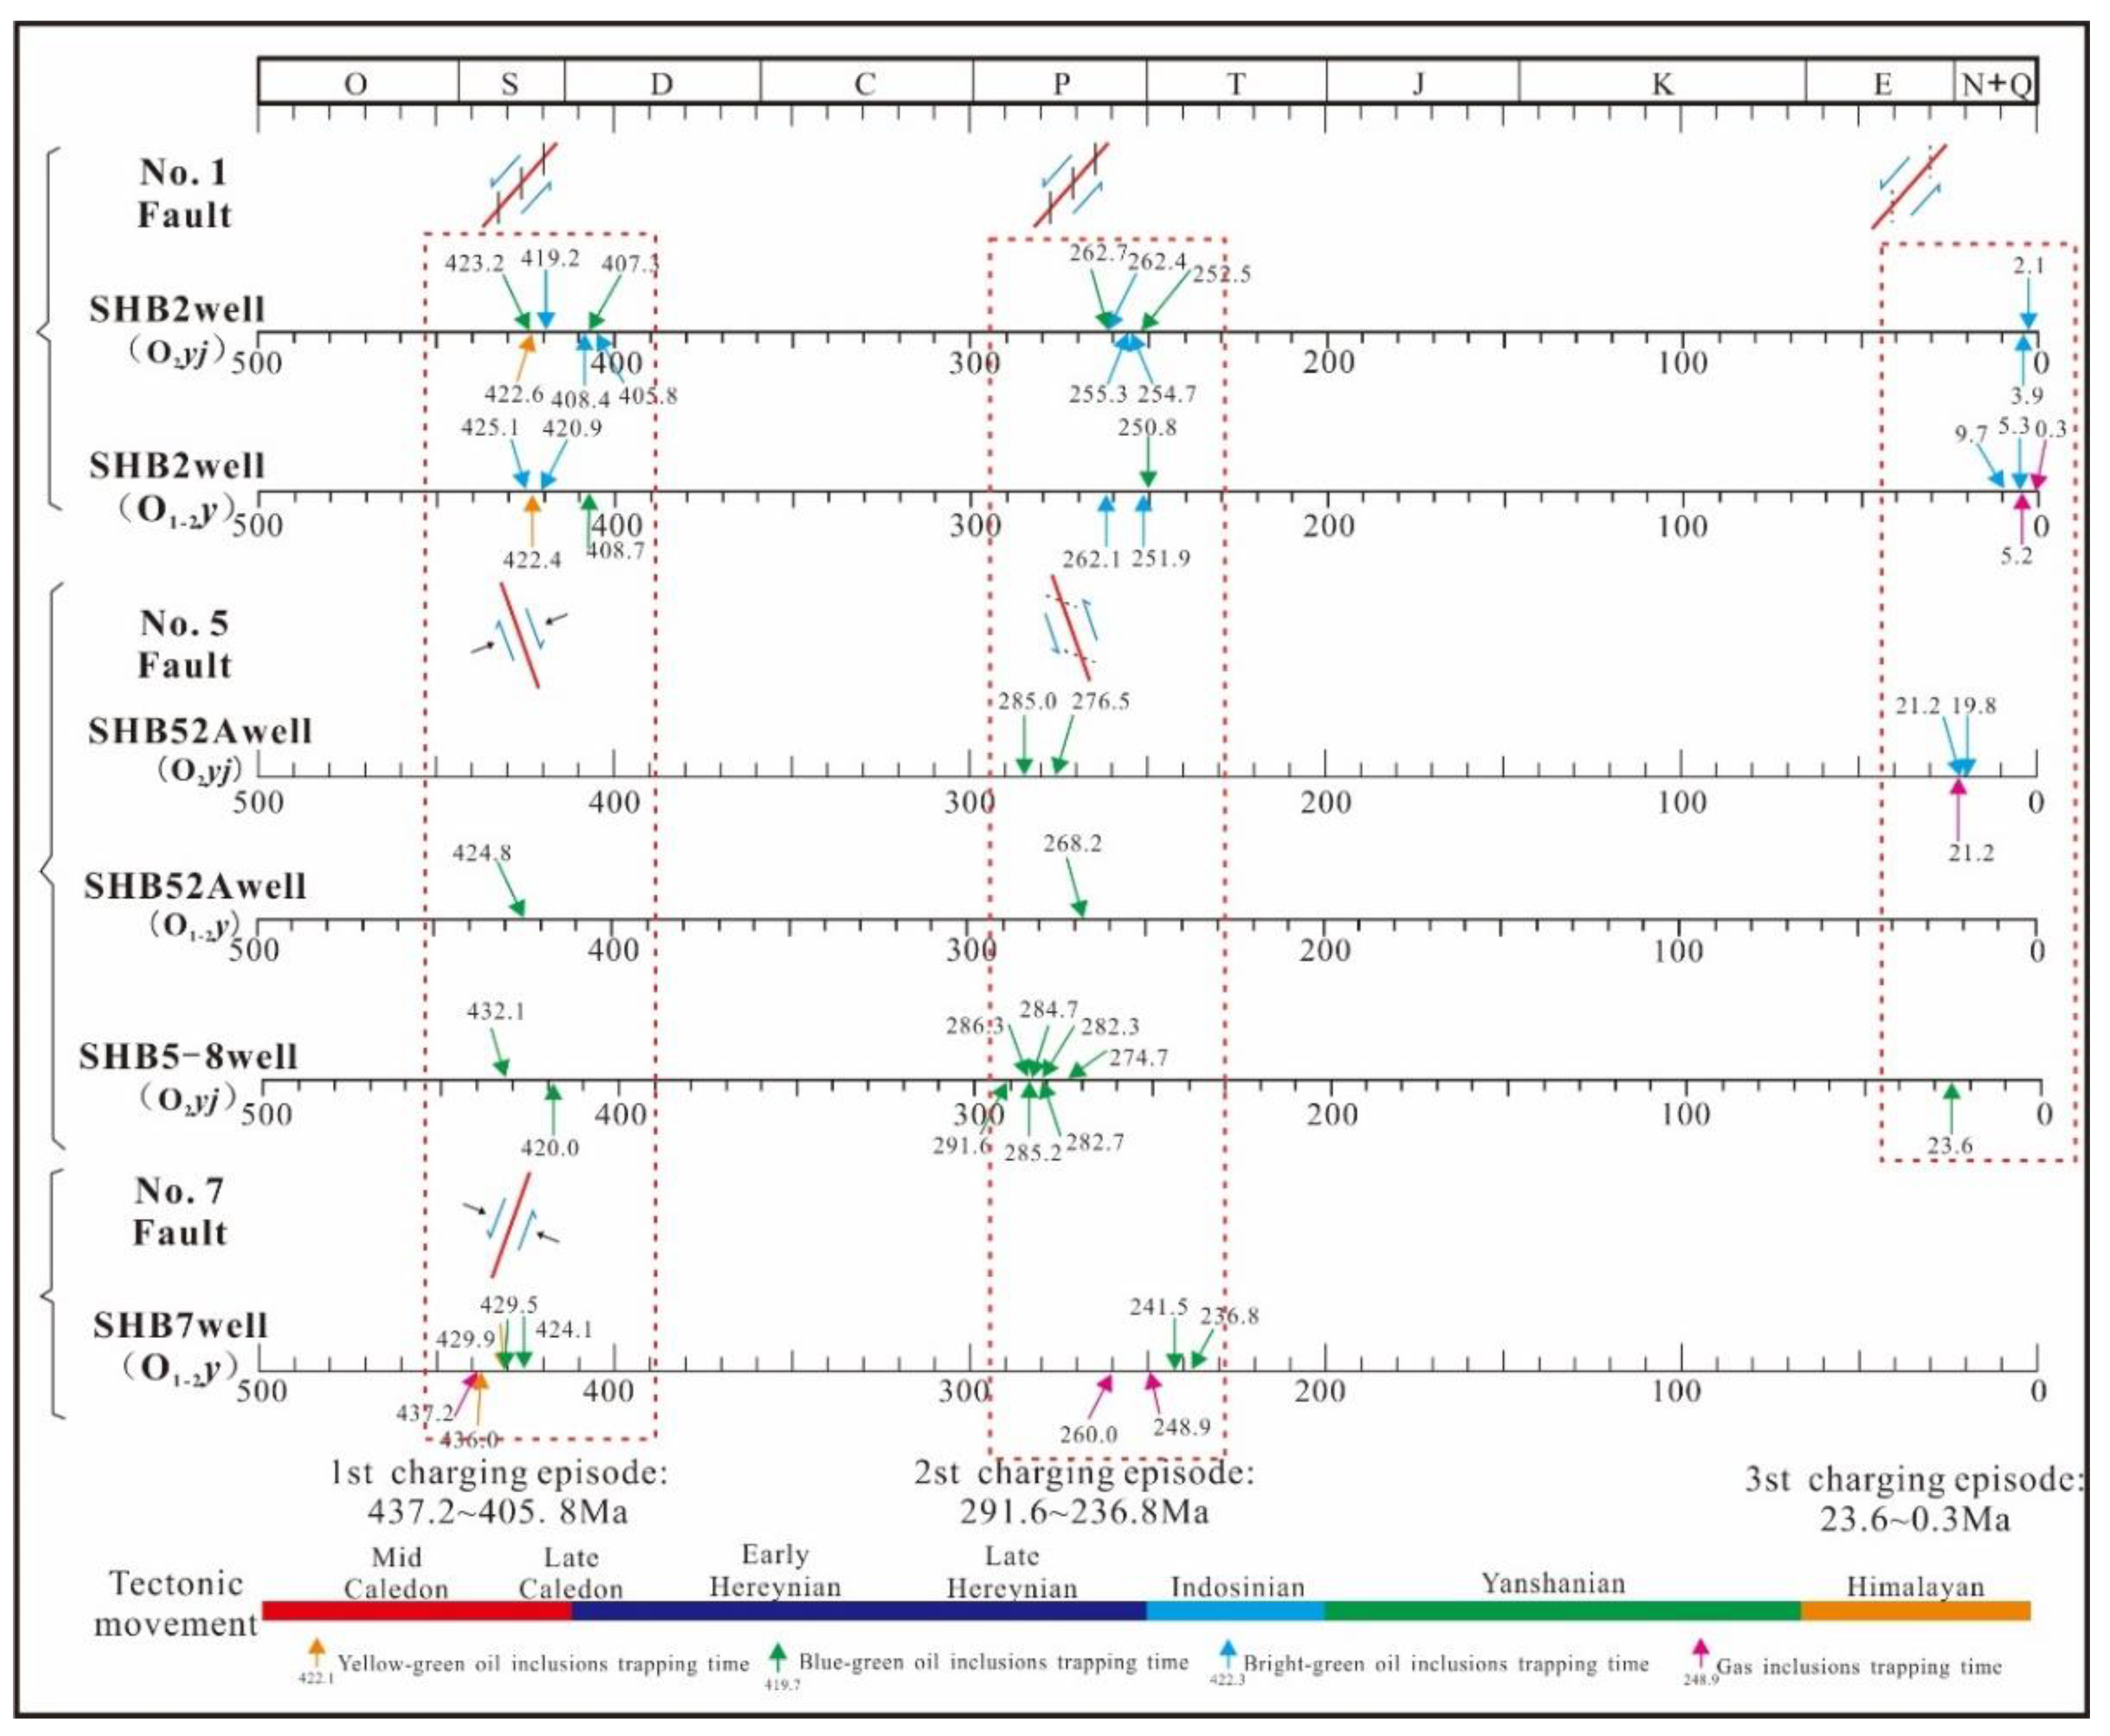
Projecting the homogenization temperatures from several coeval aqueous inclusions onto the burial history curves from different wells allows the determination of the timing of each episode of petroleum charging, eliminating the influence of burial depth [18,39,40]. The burial history curves were derived using one-dimensional simulation with BasinMod software (version 2014) incorporating parameters such as geothermal gradient and denudation thickness in the Shunbei area. The geothermal gradient and denudation thickness data came from the Sinopec Northwest Petroleum Bureau. Combined with homogenization temperatures from coevel aqueous inclusions in the Yijianfang and Yingshan reservoir Formations from the No. 1, No. 5, and No. 7 fault zones, it can be determined that the fault-karst trap in the strike-slip fault zone in the Shunbei area experienced three episodes of hydrocarbon accumulation (Figure 8 and Figure 9).
The first stage of hydrocarbon charging in the Shunbei area occurred during the late Caledonian. Yellow-green, blue-green, and bright blue fluorescing oil inclusions were detected in moldic pores, dissolution pores, and fracture-filling calcite cement and are associated with a hydrocarbon charging episode that occurred between 437.2–405.8 Ma. The second stage of hydrocarbon charging occurred during the late Hercynian. Blue-green and bright blue fluorescing oil inclusions were detected in dissolution pores, caves, and fracture-filling calcite cement and are associated with a hydrocarbon charging episode that occurred between 291.6–236.8 Ma. The third stage of hydrocarbon accumulation occurred during the late Himalayan. Blue-green and bright blue fluorescing oil inclusions and non-fluorescent gas inclusions were detected in dissolution pores, caves, and fracture-filling calcite cement and are associated with a hydrocarbon charging episode that occurred between 23.6–0.3 Ma. Generally, all three episodes of hydrocarbon accumulation were detected in No. 1 and No. 5 fault reservoirs in the Shunbei area, whereas the No. 7 fault reservoir did not experience late hydrocarbon accumulation (Figure 8). There is a good coupling relationship between petroleum charging episodes and strike-slip fault activity, which indicates that tectonic activity controlled hydrocarbon charging.

5.2. Paleoenvironment and Paleoclimate Changes

5.2.1. Principle and Methodology of Calculating Contributions

Reservoir oil is usually a mixture of oils from multiple discrete petroleum charging episodes [39], and the contribution of each charging episode to the present reservoir differs. Defining the contribution from each charging episode is very challenging but very important in understanding a reservoir’s hydrocarbon charging history [38]. In the study of petroleum accumulation processes, the relationship between the fluorescence color of oil inclusions and API gravity has been widely implemented [37,41]. Ping et al. (2012, 2017) proposed the following approach to calculate the contribution of ancient oil accumulations based on the API gravity predicted from oil inclusions; we describe it below [36,42].
During the episodic process of migration and accumulation of crude oil, frequency distribution plots of API gravity from oil inclusions captured by diagenetic minerals should show normal distribution. This allows the API gravity of crude oil from the same petroleum system to be used to calculate the contribution of each episode of petroleum charging. When the API gravity of the current reservoir oil lies within the normal distribution of API gravity from two charging episodes of oil inclusions, it indicates that the existing reservoir oil composition is the result of the joint contribution of two episodes of petroleum charging (Figure 10a). If the API gravity of a reservoir oil is closer to the peak API gravity of oil inclusions from the first episode, it indicates that the first episode of petroleum charging contributed more to the present reservoir oil composition; if the reverse is observed, it suggests that the second episode of petroleum charging contributed disproportionally to the current reservoir oil composition. The percentage line in area B in Figure 10a indicates the fractional contribution of the first episode of petroleum changing to the composition of the present reservoir oil accumulation. For two episodes of petroleum charging, the fractional contribution to the reservoir oil of any stage can be calculated using the following formula:
API ° = 141.5 ρ o i l / ρ w 131.5
C ( A ) = API R API A API B API A × 100 %
In the formula, C(A) is the contribution of the A episode of petroleum charging into reservoir formation; APIR is the present reservoir oil API gravity; APIA is the average API gravity within the peak range of the A episode of petroleum charging; APIB is the average API gravity within the peak range of the B episode of petroleum charging; ρoil is the density of crude oil in-situ, which in this study is replaced by the liquid-phase density of oil inclusions at room temperature (20 °C) (g/cm3) because they are very close in value; ρw is the density of pure water at 4 °C (g/cm3). If there are more than two episodes of petroleum charging, the following formula can be used:
C ( i ) = ρ i ( ρ o ρ i + 1 ) ρ o ( ρ i ρ i + 1 ) × 100 %
First determine the main two episodes of petroleum charging, and then use Formula (3) for the calculation. In cases where the API gravity of the reservoir oil is higher or lower than that of inclusion oil, this method is not applicable. It is worth noting that the formula is only applicable to a reservoir comprised of a single lithology. The crude oil from the Ordovician reservoir in the Shunbei area comes from the Lower Cambrian Yuertusi Formation shale, so this formula is applicable. Using the API gravity from oil inclusions captured during the process of petroleum charging to analyze the contribution of petroleum accumulation can allow the identification of individual charging episodes and the quantitative calibration of the contribution of individual petroleum charging episodes to the present oil accumulation composition. In addition, oil inclusion API gravity frequency histograms can be used to identify whether the oil reservoir has undergone secondary transformation processes such as water washing, biodegradation, gas invasion, and crude oil re-cracking [43].
The logarithmic relationship between API gravity and QF-535 (Figure 10b) is established using the microscopic fluorescence spectrum results from Ordovician crude oil in Shunbei and Tahe (Table S2). Mathematically the relationship has the form:
API° = −19.52ln(QF − 535) + 34.231
The API gravity of oil inclusions from each charging episode is obtained using Formula (4), and its statistical distribution model is established (Figure 11). Then, the fractional contribution of each episode of petroleum charging into the reservoir can be calculated according to Formula (3).
Figure 10. (a) The histogram of API gravity, fractional contribution of charged petroleum to present petroleum accumulation, and post-trapping alteration processes for two episodes of petroleum charge [43]; (b) the proper fitting function between API gravity and QF-535.
Energies 16 00579 g010

5.2.2. Calculation of the Contribution of Each Episode of Petroleum Charging

The relationship between reservoir oil API° and inclusion oil API° calculated according to Formula (4) (Figure 11) shows that the API° distribution range of inclusion oils from the No. 1 and No. 5 fault zone reservoirs is similar, ranging between 20 and 54. By contrast, the No. 7 fault zone reservoir lacks inclusions with oil API° greater than 33. The reservoir oil API° values from the SHB2, SHB5-8, and SHB52A wells lie between the second episode and the third episode inclusion oil API° values (Figure 11), so Formula (3) can be used to quantitatively evaluate the contribution of the second episode of petroleum charging and the third episode of petroleum charging to the reservoir oil composition, while the reservoir oil API° values from the SHB7 well lie between the first charging episode and the second charging episode inclusion oil API° values. This allows the quantitative evaluation of the contribution of the first stage of petroleum charging and the second stage of petroleum charging to the reservoir oil composition. The calculation results are shown in Table 3.
The calculation results show that the oil composition in the No. 1 strike-slip fault zone reservoir is dominated by the third episode of petroleum charging. The No. 5 strike-slip fault zone reservoir is dominated by the second and third episodes of petroleum charging, and the two episodes’ contributions are roughly equal. The No. 7 strike-slip fault zone reservoir is dominated by oils from the first episode of petroleum charging. Overall, the eastern Shunbei area is dominated by the later episodes of petroleum charging, while the western Shunbei area is dominated by the early episode of petroleum charging (Table 3).

5.3. Factors Controlling the Difference in the Contribution of Each Oil Charging Episode

5.3.1. The Paleotectonic Fault Pattern

The Ordovician Yijianfang Formation in the Shunbei area is the main hydrocarbon reservoir unit. The evolution history of the Yijianfang paleo-structural pattern at different geological periods influences the differences in petroleum charge into the reservoir. In the late Caledonian, under a compressional tectonic regime, the Katake Uplift and Shaya Uplift on the northern and southern margins of the Shuntuoguole were formed during this period, and the Shuntuoguole tilted to the north and south [44]. The upper surface of the Yijianfang Formation is structurally high in the west and low in the east. During this period of regional tectonic compression, the Lower Cambrian source rocks in the Manjiaer Depression started to generate hydrocarbons [45]. The hydrocarbon migrated to structurally high positions along the unconformity surface during the early Caledonian into the Cambrian subsalt dolomite reservoir and then vertically along high-angle strike-slip faults to accumulate beneath Cambrian or Ordovician traps. The Shunbei No. 7, No. 5, and No. 1 fault zones were all favorably located for oil and gas migration into overlying reservoirs [19]. In the late Hercynian, further uplift of the Shaya Uplift meant that the paleogeomorphology of the top surface of the Ordovician Yijianfang Formation in the Shunbei area became structurally higher in the northeast and lower in the southwest, this geometry being maintained until the Indosinian period [19]. The Cambrian source rocks in the Tazhong area reached peak oil generation during this period, and the Shunbei No. 7, No. 5, and No. 1 fault zones were all in favorable positions for vertical oil and gas migration. Since the late Hercynian period, the regional structure has been stable, undergoing long-term slow, deep burial with good conditions for seal generation. When the source rocks reached great burial depths and high pressures (>60 MPa), the hydrocarbon generation and evolution process slowed, delaying the generation of liquid hydrocarbons [13]. During the Himalayan period, the structural highs continued to migrate to the northeast. The Shunbei No. 1 fault zone reservoir was a favorable area for late oil and gas charging. Over time, the structural highs in the Shunbei area gradually migrated from the west to the east. With the migration of structural highs, the favorable charging area changed from the No. 7, No. 5, and No. 1 fault zone reservoirs in the late Caledonian to the No. 1 fault zone reservoir in the Himalayan.

5.3.2. Strike-Slip Fault Activity Controlling Charging Episodes

Faults are generally considered migration channels for oil, gas, and diagenetic fluids [46,47]. The Ordovician reservoir type in the Shunbei area is a fault-karst trap, and the oil and gas reservoirs are distributed along the fault zone. Therefore, the control on reservoir charging by fracturing arising from strike-slip fault activities is considerable. The difference in fracturing is one of the important factors controlling the charging histories of oil and gas in different fault zone reservoirs. Different fault systems have different fault activity periods, leading to different fracturing patterns being generated at different times. The No. 7 fault zone is a NNW-trending strike-slip fault system, the No. 1 fault zone is a NE-trending strike-slip fault system, and the No. 5 fault zone is the boundary between NNW-trending and NE-trending strike-slip fault systems. In the late Caledonian, the No. 5 fault zone offset was right-lateral and left-step in a compressional-uplift tectonic environment. The degree of fracturing along these faults at this time was relatively low and not conducive to hydrocarbon charging. During the late activity, the No. 5 fault zone experienced a reversal of slip direction and was in a pull-apart extensional tectonic environment in the late Hercynian and Himalayan, with a high degree of fracturing, thus conducive to hydrocarbon charging [18]. As a branch of the No. 5 fault zone, the No. 1 fault zone was formed later than the No. 5 fault zone. In the late Caledonian, the No. 1 fault zone began a left-lateral movement and developed right-stepping en-echelon faults in a regional diagonal tensional stress regime. In the late Hercynian, the No. 1 fault zone was re-activated once again in a left-lateral strike-slip sense forming en-echelon normal faults in the overlying strata. This strike-slip movement and extensional fault generation continued during the Himalayan period [24]. The No. 1 fault zone was generated in a pull-apart tectonic environment, with strong fault activity and the generation of a large number of fractures. This means that the fractures in the Ordovician reservoir in the No. 1 fault zone have control of hydrocarbon charging, and oil inclusions are detected in the multi-stage calcite cement. The hydrocarbon charging history of the No. 1 fault zone is similar to that of the No. 5 fault zone. Hydrocarbon charging commenced in the late Caledonian and re-started in the late Hercynian and the Himalayan. It appears, however, that the strong tectonic uplift in the Early Hercynian period led to the destruction of the early charged crude oil and residual bitumen. This means that the main contribution to petroleum charging took place in the late Hercynian and Himalayan periods. In addition, no obvious en-echelon normal faults were formed in the Shunbei No. 5 fault zone during the Himalayan period; linked to this is the fact that in the No. 5 fault zone, the degree of hydrocarbon charging and enrichment was lower in the Himalayan period when compared to the No. 1 fault zone. The No. 7 fault zone moved in a right-lateral sense in the middle Caledonian and was re-activated in the same sense in the late Caledonian. In the seismic, no evidence can be seen of fault activity continuing after the late Caledonian [48]. The movement along the No. 7 fault zone is small and appears less affected by the tectonic movement that took place during the Himalayan [18]. High-maturity, late-stage oil inclusions were not detected in this study’s No. 7 fault zone samples. Overall, the NE strike-slip fault in the eastern Shunbei area shows evidence of episodic reactivation over a long period of time; this fits well with the observed late hydrocarbon charging episode into this fault zone and is very beneficial to late hydrocarbon accumulation. The NW trending strike-slip faults were mainly active early in the basin history and lack evidence for late hydrocarbon migration, so reservoirs in these fault zones are dominated by early hydrocarbon charging (Figure 9).

5.4. Petroleum Accumulation Model

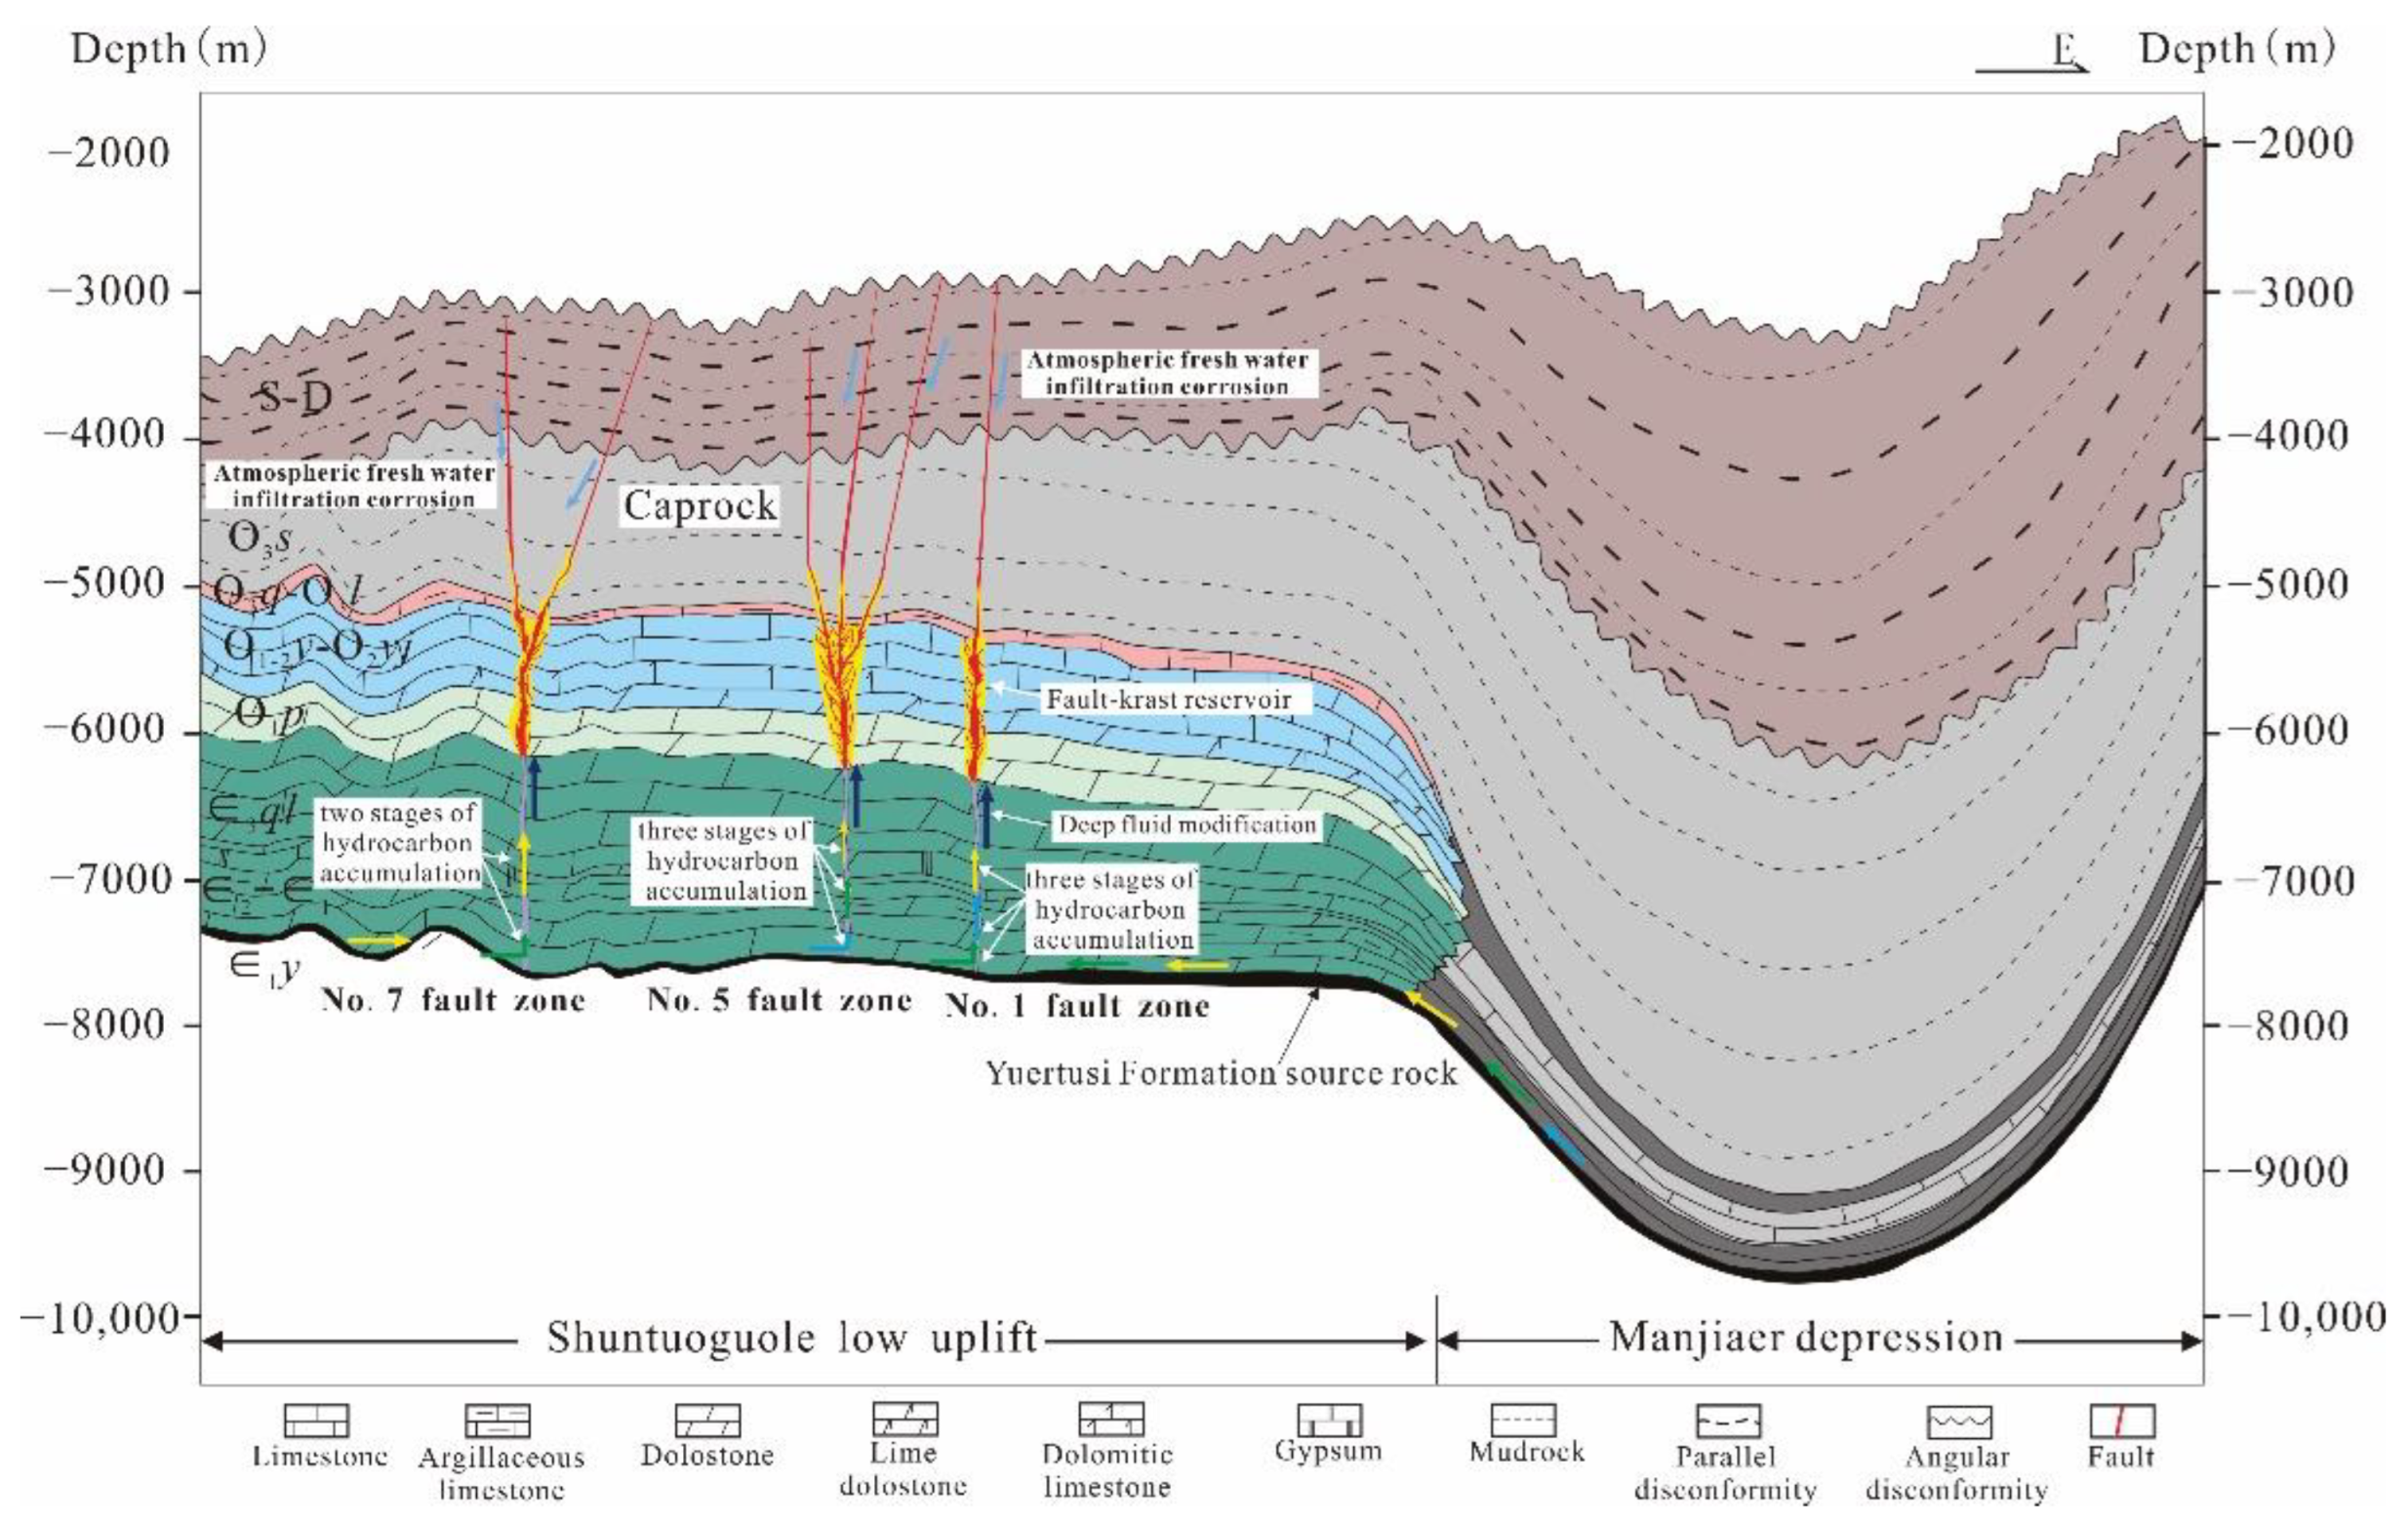
The oil and gas in the Shunbei area mainly came from in-situ gentle slope facies of Lower Cambrian source rocks. Hydrocarbon generated by the Lower Cambrian slope facies source rocks in the Manjiaer Depression migrated laterally into the Shunbei oil and gas reservoir, providing a supplementary oil source. The Lower Cambrian source rocks are still in the large-scale hydrocarbon generation window of highly mature liquid oil–condensate oil during the Yanshanian–Himalayan being affected by rapid burial in the late stage, high pressure, and a low geothermal gradient. These are optimal conditions for hydrocarbon resource generation and a good resource foundation for late hydrocarbon accumulation. The strike-slip fault zones have an obvious controlling function on the Shunbei fault-karst reservoir cutting down through the base Cambrian, connecting the source rocks of the Yuertusi Formation with the overlying Ordovician fault-karst reservoir rocks. These faults act as the main transportation pathway, with deep episodic fluid generation followed by hydrocarbon migration and accumulation during active faulting periods. The relationship between source rock hydrocarbon generation episodes and the episodes of activity along large, deep faults is an important factor controlling the timing of reservoir formation. In the Shunbei area, there were multi-episodes of petroleum charging, with the first petroleum charging episode during the late Caledonian. During this period, the source rocks of the Yuertusi Formation began to mature and generate oil (0.7% < Ro < 1.0%) [16]. This migrated to structurally higher units along the faults to form reservoirs. These reservoirs were subsequently damaged and reformed to varying degrees during later tectonic and volcanic activity. During the late Hercynian, the source rocks in the Shunbei area were still in the hydrocarbon generation and expulsion stage. Large-scale oil and gas accumulations resulted, leading to the second episode of hydrocarbon charging. Following the late Hercynian period, the Shunbei oil and gas reservoirs were effectively preserved due to continuous slow burial. During the Himalayan, the Shuntuoguole Low Uplift underwent a period of rapid subsidence, and the strata were buried continuously. The source rocks of the Yuertusi Formation were buried deeply and were in a highly-mature–over-mature stage. However, the geothermal gradient was low, and short-lasting high temperatures and pressures delayed the thermal evolution of the source rocks. During the Himalayan period, the source rocks of the Yuertusi Formation were buried more than 10,000 m and were still in the stage of generating condensate oil and gas [27]. The oil and gas generated during this period mainly migrated vertically along strike-slip faults to accumulate in the overlying carbonate fault-karsts reservoirs. During this period, the Shunbei No. 7 fault zone reservoirs show a lack of hydrocarbon charging (Figure 12). The types and properties of the oil and gas along the strike-slip fault zones in the Shunbei area show regular changes. From northwest to southeast, the crude oil gradually becomes lighter, and the gas–oil ratio gradually increases. The oil and gas distribution relationship can be characterized by the observation, “oil in the west, gas in the east, oil in the north and gas in the south”.

6. Conclusions

The structural evolution history of Ordovician ultra-deep reservoirs in the Shunbei area is complex, and there is a good coupling relationship between fault activities and petroleum charging. The petroleum charging history in the Shunbei area was reconstructed by fluid inclusion analysis.
The Shunbei Oilfield experienced three major petroleum charging episodes. The first episode of petroleum charging occurred in the late Caledonian, with a charging interval of 437.2–405.8 Ma, and the second episode of petroleum charging occurred in the late Hercynian, with a charging interval of 291.6–236.8 Ma. The third episode of petroleum charging occurred in the Himalayan, with a charging interval of 23.6–0.3 Ma. The Shunbei No. 7 fault zone reservoir does not appear to have been charged during this final charging episode. The current reservoir oils comprise a mixture of oils. Therefore, the formation of Ordovician oil reservoirs in the Shunbei area is controlled by active faults, and sweethearts for oil and gas exploration are distributed along the faults.
There are significant differences in the contribution of different petroleum charging episodes in different fault zones. As a whole, the No. 1 strike-slip fault zone reservoir was mainly filled by oils from the third petroleum charging episode. The No. 5 strike-slip fault zone reservoir is dominated by oils from the second and third episodes of petroleum accumulation, while oils from the first petroleum charging episode dominate the No. 7 fault zone reservoir. The evolution of paleostructure faulting patterns and differences in strike-slip fault activity are the main reasons for the observed differences in petroleum charging episode contributions.

Supplementary Materials

The following supporting information can be downloaded at: https://www.mdpi.com/article/10.3390/en16020579/s1; Table S1: complete fluid inclusion microthermometric data from this study; Table S2: microfluorescence spectrum data from the Ordovician crude oils of the Shunbei and Tahe area.

Author Contributions

Methodology, writing-original draft, W.W.; data curation, investigation, H.C. and A.S.; data curation, resources, Z.Z. and Y.W.; revised and edited the manuscript, J.H. and N.Z. All authors have read and agreed to the published version of the manuscript.

Funding

This study was jointly supported by the project of the Exploration and Development Research Institute of Sinopec Northwest Oilfield Company (Grant Nos. KY2019-S-036 and 34400008-19-ZC0607-0010).

Data Availability Statement

The data can be found in the Supplementary Information files, which will be uploaded with the manuscript.

Acknowledgments

We want to thank the Sinopec Northwest China Petroleum Bureau for permission to release the data.

Conflicts of Interest

The authors declare no conflict of interest.

References

  1. He, Z.L.; Ma, Y.S.; Zhu, D.Y.; Duan, T.Z.; Geng, J.H.; Zhang, J.T.; Ding, Q.; Qian, Y.X.; Wo, Y.J.; Gao, Z.Q. Theoretical and technological progress and research direction of deep and ultra-deep carbonate reservoirs. Oil Gas Geol. 2021, 42, 533–546, (In Chinese with English abstract). [Google Scholar]
  2. Dyman, T.S.; Crovelli, R.A.; Bartberger, C.E.; Takahashi, K.I. Worldwide estimates of deep natural gas resources based on the U.S. Geological Survey World Petroleum Assessment 2000. Nat. Resour. Res. 2002, 11, 207–218. [Google Scholar] [CrossRef]
  3. Bai, G.P.; Cao, B.F. Characteristics and distribution patterns of deep petroleum accumulations in the world. Oil Gas Geol. 2014, 35, 19–25, (In Chinese with English abstract). [Google Scholar]
  4. Heydari, E. The role of burial diagenesis in hydrocarbon destruction and H2S accumulation, upper Jurassic Smackover Formation, Black Creek Field, Mississippi. AAPG Bull. 1997, 81, 26–45. [Google Scholar]
  5. Ehrenberg, S.N.; Nadeau, P.H.; Steen, Ø. Petroleum reservoir porosity versus depth: Influence of geological age. AAPG Bull. 2009, 93, 1281–1296. [Google Scholar] [CrossRef]
  6. Jia, L.Q.; Cai, C.F.; Jiang, L.; Zhang, K.; Li, H.X.; Zhang, W. Petrological and geochemical constraints on diagenesis and deep burial dissolution of the Ordovician carbonate reservoirs in the Tazhong area, Tarim Basin, NW China. Mar. Pet. Geol. 2016, 78, 271–290. [Google Scholar] [CrossRef]
  7. Lv, H.T.; Han, J.; Zhang, J.B.; Liu, Y.L.; Li, Y.T. Development characteristics and formation mechanism of ultra-deepcarbonate fault-dissolution body in Shunbei area, Tarim Basin. Pet. Geol. Exp. 2021, 43, 15–22, (In Chinese with English abstract). [Google Scholar]
  8. Li, H.; Tang, H.M.; Qin, Q.R.; Zhou, J.L.; Qin, Z.J.; Fan, C.H.; Su, P.D.; Wang, Q.; Zhong, C. Characteristics, formation periods and genetic mechanisms of tectonic fractures in the tight gas sandstones reservoir: A case study of Xujiahe Formation in YB area, Sichuan Basin, China. J. Pet. Sci. Eng. 2019, 178, 723–735. [Google Scholar] [CrossRef]
  9. Li, J.; Li, H.; Yang, C.; Wu, Y.J.; Gao, Z.; Jiang, S.L. Geological characteristics and controlling factors of deep shale gas enrichment of the Wufeng-Longmaxi Formation in the southern Sichuan Basin, China. Lithosphere 2022, 12, 4737801. [Google Scholar] [CrossRef]
  10. Sun, L.D.; Zou, C.N.; Zhu, R.K.; Zhang, Y.H.; Zhang, S.C.; Zhang, B.M.; Zhu, G.Y.; Gao, Z.Y. Formation, distribution and potential of deep hydrocarbon resources in China. Pet. Explor. Dev. 2013, 40, 641–649, (In Chinese with English abstract). [Google Scholar] [CrossRef]
  11. Jia, C.Z.; Pang, X.Q. Research processes and main development directions of deep hydrocarbon geological theories. Acta Pet. Sin. 2015, 36, 1457–1469, (In Chinese with English abstract). [Google Scholar]
  12. Qi, L.X. Oil and gas breakthrough in ultra-deep Ordovician carbonate formations in Shuntuoguole uplift, Tarim Basin. China Pet. Explor. 2016, 21, 1672–7703, (In Chinese with English abstract). [Google Scholar]
  13. Gu, Y.; Wan, Y.L.; Huang, J.W.; Zhuang, X.B.; Wang, B.; Li, M. Prospects for ultra-deep oil and gas in the “deep burial and high pressure” Tarim Basin. Pet. Geol. Exp. 2019, 41, 157–164, (In Chinese with English abstract). [Google Scholar]
  14. Yun, L. Controlling effect of NE strike-slip fault system on reservoir development and hydrocarbon accumulation in the eastern Shunbei area and its geological significance, Tarim Basin. China Pet. Explor. 2021, 26, 41–52, (In Chinese with English abstract). [Google Scholar]
  15. Jiao, F.Z. Significance and prospect of ultra-deep carbonate fault-karst reservoirs in Shunbei area, Tarim Basin. Oil Gas Geol. 2018, 39, 207–216, (In Chinese with English abstract). [Google Scholar]
  16. Wang, B.; Zhao, Y.Q.; He, S.; Guo, X.W.; Cao, Z.C.; Deng, S.; Wu, X.; Yang, Y. Hydrocarbon accumulation stages and their controlling factors in the northern Ordovician Shunbei 5 fault zone, Tarim Basin. Oil Gas Geol. 2020, 41, 965–974, (In Chinese with English abstract). [Google Scholar]
  17. Lu, Z.Y.; Li, Y.T.; Ye, N.; Zhang, S.N.; Lu, C.J.; Li, W.; Cheng, Z.; Ding, X.Q.; Zhu, B.; Huang, B.W. Fluid Inclusions Record Hydrocarbon Charge History in the Shunbei Area, Tarim Basin, NW China. Geofluids 2020, 2020, 8847247. [Google Scholar] [CrossRef]
  18. Wang, Y.W.; Chen, H.H.; Guo, H.F.; Zhu, Z.H.; Wang, Q.R.; Yu, P.; Qi, L.X.; Yun, L. Hydrocarbon charging history of the ultra-deep reservoir in Shun 1 strike-slip fault zone, Tarim Basin. Oil Gas Geol. 2019, 40, 972–989, (In Chinese with English abstract). [Google Scholar]
  19. Han, Q.; Yun, L.; Jiang, H.S.; Shao, X.M.; Jin, X.M. Marine Oil and Gas Filling and Accumulation Process in the North of Shuntuoguole Area in Northern Tarim Basin. J. Jilin Univ. Earth Sci. Ed. 2021, 51, 645–658, (In Chinese with English abstract). [Google Scholar]
  20. Chen, Q.L.; Xi, B.B.; Han, J.; Xu, J.; Wu, X.; Zhu, X.X.; Ma, Z.L. Preservation and influence factors of ultra-deep oil reservoirs in Shuntuoguole area, Tarim Basin: Evidence from fluid inclusions. China Pet. Explor. 2020, 25, 121–133, (In Chinese with English abstract). [Google Scholar]
  21. He, Z.L.; Jin, X.H.; Wo, Y.J.; Li, H.L.; Bai, Z.R.; Jiao, C.L.; Zhang, Z.P. Hydrocarbon accumulation characteristics and exploration domains of ultra-deep marine carbonates in China. China Pet. Explor. 2016, 21, 3–14, (In Chinese with English abstract). [Google Scholar]
  22. Ni, Z.Y.; Wang, T.G.; Li, M.J.; Chen, Z.H.; Ou, G.X.; Cao, Z.C. Natural gas characteristics, fluid evolution, and gas charging time of the Ordovician reservoirs in the Shuntuoguole region, Tarim Basin, NW China. Geol. J. 2016, 53, 947–959. [Google Scholar] [CrossRef]
  23. He, D.F.; Zhou, X.Y.; Yang, H.J.; Guan, S.W.; Zhang, C.J. Formation mechanismand tectonic types of intracratonic paleo-uplifts in the Tarim basin. Earth Sci. Front. 2008, 15, 207–221, (In Chinese with English abstract). [Google Scholar]
  24. Deng, S.; Li, H.L.; Zhang, Z.P.; Wu, X.; Zhang, J.B. Characteristics of differential activities in major strike-slip fault zones andtheir control on hydrocarbon enrichment in Shunbei areaand its surroundings, Tarim Basin. Oil Gas Geol. 2018, 39, 878–888, (In Chinese with English abstract). [Google Scholar]
  25. Lv, H.T.; Zhang, S.N.; Ma, Q.Y. Classification and formation mechanismof fault systems in the central and northern Tarim Basin. Pet. Geol. Exp. 2017, 39, 444–452, (In Chinese with English abstract). [Google Scholar]
  26. Deng, S.; Li, H.L.; Han, J.; Cui, D.Y.; Zou, R. Characteristics of the central segment of Shunbei 5 strike-slip fault zone in Tarim Basin and its geological significance. Oil Gas Geol. 2019, 40, 990–998, (In Chinese with English abstract). [Google Scholar]
  27. Jiao, F.Z. Significance of oil and gas exploration in NE strike-slip fault belts in Shuntuoguole area of Tarim Basin. Oil Gas Geol. 2017, 38, 832–839, (In Chinese with English abstract). [Google Scholar]
  28. Bodnar, R.J. Revised equation and table for determining the freezing-point depression of H2O-NaCl solutions. Geochim. Cosmochim. Acta 1993, 57, 683–684. [Google Scholar] [CrossRef]
  29. Wang, Y.W. Multiple Originanl Mechanisms of the Ordovician Reservoir and Their Control on Hydrocarbon Charging in Shuntuoguole Area, Tarim Basin. Ph.D. Thesis, China University of Geosciences (Wuhan), Wuhan, China, 2019. [Google Scholar]
  30. Munz, I.A. Petroleum inclusions in sedimentary basins: Systematics, analytical methods and applications. Lithos 2001, 55, 195–212. [Google Scholar] [CrossRef]
  31. Yang, P.; Liu, K.Y.; Liu, J.L.; Yu, S.; Yu, B.; Hou, M.G.; Wu, L.Y. Petroleum charge history of deeply buried carbonate reservoirs in the Shuntuoguole Low Uplift, Tarim Basin, west China. Mar. Pet. Geol. 2021, 128, 105063. [Google Scholar] [CrossRef]
  32. McLimans, R.K.; Videtich, P.E. Diagenesis and burial history of great oolite limestone, Southern England. AAPG Am. Assoc. Pet. Geol. Bull. 1989, 73, 1195–1205. [Google Scholar]
  33. Guilhaumou, N.; Szydlowskii, N.; Pradier, B. Characterization of hydrocarbon fluid inclusions by infrared and fluorescence microspectrometry. Mineral. Mag. 1990, 54, 311–324. [Google Scholar] [CrossRef] [Green Version]
  34. Liu, X.; Chen, H.; Xiao, X.; Zhang, H.; Wang, Y.; Xu, T.; Shang, P.; Kong, L. Overpressure evolution recorded in fluid inclusions in the Dongpu Depression, Bohai Bay Basin, North China. J. Earth Sci. 2022, 33, 916–932. [Google Scholar] [CrossRef]
  35. McLimans, R.K. The application of fluid inclusions to migration of oil and diagenesis in petroleum reservoirs. Appl. Geochem. 1987, 2, 585–603. [Google Scholar] [CrossRef]
  36. Chen, H.H. Microspetrofluorimetric characterization and thermal maturity assessment of individual oil inclusion. Acta Pet. Sincia 2014, 35, 584–590, (In Chinese with English abstract). [Google Scholar]
  37. Blanchet, A.; Pagel, M.; Walgenwitz, F.; Lopez, A. Microspectrofluorimetric and microthermometric evidence for variability in hydrocarbon fluid inclusions in quartz overgrowths: Implications for inclusion trapping in the Alwyn North field, North Sea. Org. Geochem. 2003, 34, 1477–1490. [Google Scholar] [CrossRef]
  38. Ping, H.W.; Chen, H.H.; Jia, G.H. Petroleum accumulation in the deeply buried reservoirs in the northern Dongying Depression, Bohai Bay Basin, China: New insights from fluid inclusions, natural gas geochemistry, and 1-D basin modeling. Mar. Pet. Geol. 2017, 80, 70–93. [Google Scholar] [CrossRef]
  39. Karlsen, D.A.; Nedkvitne, T.; Larter, S.R.; Bjørlykke, K. Hydrocarbon composition of authigenic inclusions: Application to elucidation of petroleum reservoir filling history. Geochem. Cosmochim. Acta 1993, 57, 3641–3659. [Google Scholar] [CrossRef]
  40. Xiong, W.L.; Chen, H.H.; Yun, L.; Li, H.L.; Feng, Y.; Wu, Y.; Su, A. Hydrocarbon charging history for Silurian reservoirs of Shuntuoguole block in the north slope of Tazhong uplift, Tarim Basin: Constraints from fluid inclusion of Well Shun 9. Acta Pet. Sin. 2013, 34, 239–246, (In Chinese with English abstract). [Google Scholar]
  41. Bodnar, R. Petroleum migration in the Miocene Monterey Formation, California, USA: Constraints from fluid-inclusion studies. Mineral. Mag. 1990, 54, 295–304. [Google Scholar] [CrossRef] [Green Version]
  42. Hallmann, C.O.E.; Arouri, K.R.; McKirdy, D.M.; Schwark, L. Temporal resolution of an oil charging history e a case study of residual oil benzocarbazoles from the Gidgealpa Field. Org. Geochem. 2007, 38, 1516–1536. [Google Scholar] [CrossRef]
  43. Ping, H.W.; Chen, H.H.; Song, G.Q.; Liu, H.M. Contributions Degree of Petroleum Charging to Oil and Gas Accumulation and Its Significance. Earth Sci. J. China Univ. Geosci. 2012, 37, 163–170, (In Chinese with English abstract). [Google Scholar]
  44. Xie, D.Q.; Zheng, M.L.; Jiang, H.S.; Guo, X. Formation and Evolution of the Shaya Uplift and Constraints on Oil and Gas Distribution in the Tarim Basin. Geotecton. Metallog. 2013, 37, 398–409, (In Chinese with English abstract). [Google Scholar]
  45. Jin, Z.J.; Liu, Q.Y.; Yun, J.B. Potential Petroleum Sources and Exploration Directions around the Manjar Sag in the Tarim Basin. Sci. China Earth Sci. 2017, 60, 235–245. [Google Scholar] [CrossRef]
  46. Eichhubl, P.; Davatzes, N.C.; Becker, S.P. Structural and diagenetic control of fluid migration and cementation along the Moab fault, Utah. AAPG Bull. 2009, 93, 653–681. [Google Scholar] [CrossRef] [Green Version]
  47. Ilg, B.R.; Hemmings-Sykes, S.; Nicol, A.; Baur, J.; Fohrmann, M.; Funnell, R.; Milner, M. Normal faults and gas migration in an active plate boundary, southern Taranaki Basin, offshore New Zealand. AAPG Bull. 2012, 96, 1733–1756. [Google Scholar] [CrossRef]
  48. Yun, L. Hydrocarbon Accumulation of Ultra-Deep Ordovician Fault-Karst Reservoirs in Shunbei Area. Xinjiang Pet. Geol. 2021, 42, 136–142, (In Chinese with English abstract). [Google Scholar]
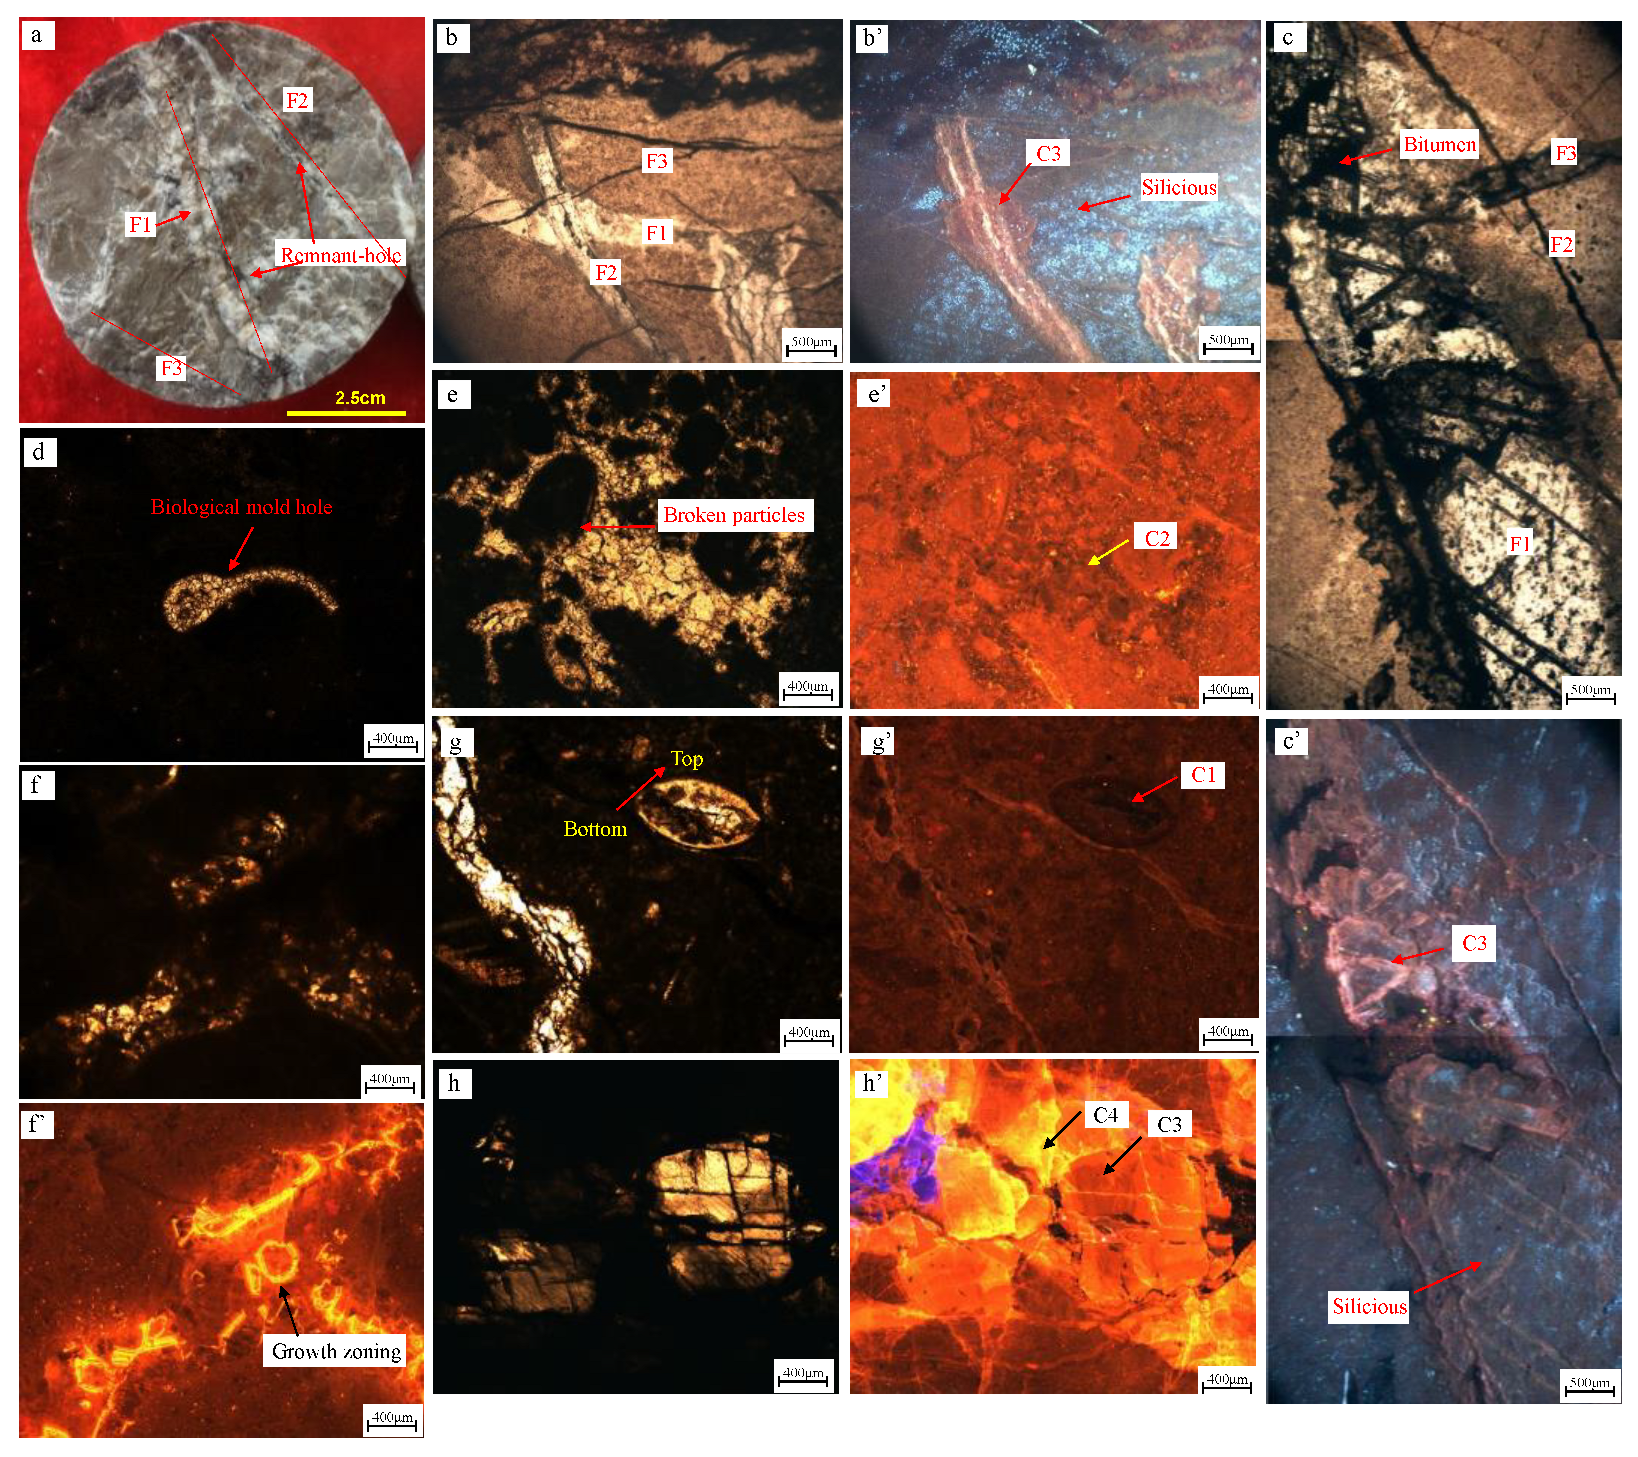
Figure 2. The characteristics of calcite cements from the Ordovician reservoir in the Shunbei area (F1 = the first fracture set; F2 = the second fracture set; F3 = the third fracture set; C1 = the first stage of calcite cement; C2 = the second stage of calcite cement; C3 = the third stage of calcite cement; C4 = the fourth stage of calcite cement. The photomicrographs b, c, d, e, f, g, and h were taken under transmitted light, and the photomicrographs b’, c’, e’, f’, g’, and h’ were taken under cathodoluminescence. (a) SHB5-8 well, O2yj, 7680.10 m, micritic limestone, fractures filled with calcite cement and bitumen, and bitumen appears in fracture walls and calcite cement veins. Residual pores are well developed; (b,b’) SHB7 well, O1–2y, 7428.90 m, silicified micritic limestone, F1 emplaced prior to, and F2 and F3 occur following silicatization; (c,c’) SHB7 well, O1–2y, 7728.80 m, silicified micritic limestone, three episodes of fractures developed, F1 filled with bitumen, siliceous and calcite cement, F2 and F3 filled with bitumen; (d) SHBL1 well, O1–2y, 7436.95 m, micritic limestone, biological moldic pore is filled with calcite cement; (e,e’) SHBL1 well, O2yj, 7263.97 m, bioclastic grainstone, grain is broken; (f,f’) SHB52A well, O2yj, 7671.86 m, micritic limestone, growth zoning. (g,g’) SHB52A well, O2yj, 7674.75 m, dolomitic micritic limestone, geopetal structure; (h,h’) SHB5-8 well, O2yj, 7679.10 m, micritic limestone, late stage of calcite cement showing orange CL and bright-yellow CL colors.
Energies 16 00579 g002
Figure 3. Diagenetic characteristics of the Ordovician reservoirs in the Shunbei area. The photomicrographs a, b, c, d, e, f, and g were taken under transmitted light, the photomicrographs c’, d’, e’, and f’ were taken under cathodoluminescence, and the photomicrograph g’ was taken under reflected light. (a) SHBL1 well, O1–2y, 7633.3 m, bioclastic limestone, bioclastic spathization; (b) SHBL1 well, O1–2y, 7436.95 m, micritic limestone, pressolved stylolite filled with bitumen; (c,c’) SHB52A well, O2yj, 7674.75 m, dolomitic micritic limestone, fibrous calcite cement develops along the moldic pore walls; (d,d’) SHBL1 well, O1–2y, 7430.6 m, dolomitic micritic limestone, dolomitization occurs in calcite cement filled fractures; (e,e’) SHB52A well, O1–2y, 7782.05 m, micritic limestone, dolomites distributed along a stylolite; (f,f’) SHBL1 well, O1–2y, 7633.3 m, dolomitic micritic limestone, dolomitization occurs in calcite cement infilled dissolution pore; (g,g’) SHBL1 well, O1–2y, 7430.6 m, dolomitic micritic limestone, pyrite precipitated in dolomites.
Energies 16 00579 g003
Figure 4. Diagenetic evolution of the carbonates of the Shunbei area.
Energies 16 00579 g004
Figure 5. Types of fluid inclusions in the Lower–Middle Ordovician of the Shunbei area. The photomicrographs a, b, c, d, e, e’, and f were taken under transmitted light, and the photomicrographs a’, and c’ were taken under ultraviolet excitation light. (a) SHB52A well, O1–2y, 8121.61 m, dolomitic micritic limestone, fluid inclusions distributed along the growth zone show primary fluid inclusions; (b) SHB51X well, O2yj, 7564.66 m, bioclastic limestone, cluster-distributed fluid inclusions within the calcite cement crystal infilled dissolution cave, which shows primary fluid inclusions; (c) SHB7 well, O1–2y, 7728.80 m, micritic limestone, isolated oil inclusion with blue-green fluorescent within the calcite cement infilled fracture, which shows primary fluid inclusions; (d,d’) SHB52A well, O1–2y, 7782.05 m, micritic limestone, fluid inclusions within calcite cement crystals show random population; (e,e’) SHB5-8 well, O2yj, 7678.84 m, micritic limestone, bright-blue fluorescent oil inclusions within the calcite cement crack infilled dissolution pores, which contain secondary fluid inclusions; (f,f’) SHB5-8 well, O2yj, 7678.84 m, micritic limestone, bright-blue fluorescent oil inclusions within long calcite cement infilled fracture, containing secondary fluid inclusions.
Energies 16 00579 g005
Figure 6. Microscopic fluorescence spectra from Ordovician oil inclusions in the Shunbei area.
Energies 16 00579 g006
Figure 7. Cross plots of QF-535 versus max from Ordovician oil inclusions in the Shunbei area.
Energies 16 00579 g007
Figure 8. Burial history diagrams showing the hydrocarbon charging history in the Shunbei area.
Energies 16 00579 g008
Figure 9. Composite results showing hydrocarbon charge timing in the Yijianfang and Yingshan reservoir Formations in the Shunbei area.
Energies 16 00579 g009
Figure 11. Histogram of the API° frequency distribution for oil inclusions from the Shunbei area. (a) SHB2 well, (b) SHB52A well, (c) SHB5-8 well, (d) SHB7 well.
Energies 16 00579 g011
Figure 12. The hydrocarbon accumulation model for the Shunbei area (modified after Sinopec Northwest China Petroleum Bureau).
Energies 16 00579 g012
Table 1. Fluorescence spectral data of oil inclusions and reservoir oils.
FaultWellFormationλmax (nm)QF535StageMean λmax (nm)Mean QF535Density (D) ① (g/cm3)API° ②
No. 1 faultSHB2O2yj + O1–2y455.6–548.10.47–1.631st stage546.51.580.902125.35
2nd stage482.00.800.830638.63
3rd stage469.90.530.794546.58
494.00.80Reservoir oil494.00.800.7960 46.26
No. 5 faultSHB52AO2yj + O1–2y452.0–576.90.37–2.021st stage563.71.730.91223.49
2nd stage484.80.760.825839.66
3rd stage453.20.440.778750.11
492.00.63Reservoir oil492.00.630.798045.82
SHB5-8O2yj458.0–540.40.47–1.631st stage542.61.480.895026.58
2nd stage497.00.940.847135.39
3rd stage469.30.51 0.790847.37
492.00.63Reservoir oil492.0.63 0.830538.88
No. 7 faultSHB7O1–2y505.6–550.81.06–1.851st stage539.91.570.912825.43
2nd stage518.01.370.883728.09
502.01.65Reservoir oil502.01.650.907324.46
Note: ① D = 141.5/(API° + 131.5); ② API° = −19.52ln(QF535) + 34.231.
Table 2. Partly fluid inclusion microthermometric data (complete data are shown in Table S1).
Fault ZoneWellDepth (m)The Host MineralInclusion Type(Th) of Bright–Blue Fluorescence Oil Inclusions (°C)(Th) of Blue–Green Fluorescence Oil Inclusions (°C)(Th) of Yellow–Green Fluorescence Oil Inclusions (°C)Aqueous Iclusions Homogenization Temperatures (°C)
Salinity (NaCl)/%
Th1Th2Th3Th4Th5
No. 1 faultSHB27362.85early-generation calcite in caveprimary42.9–43.5/////131.5/
/////
secondary39.3–48.2/////137.4–153.1/
///5.3–14.1/
late-generation calcite in caveprimary37.3–44.143.7–57.197.292.1–102.3/118.9–134.0141.9–150.2/
6.0–13.2/3.5–14.87.7–14.3/
7422.70calcite in caveprimary39.8–41.7///100.3–117.5/138.9164.1
/8.4–16.1/13.37.6
calcite in fractureprimary55.7–58.4////121.7–136.9140.2–144.2/
//17.8–19.415.0–17.0/
7522.50calcite in caveprimary///89.4104.9128.6/151.9
6.99.49.3/11.7
calcite veinprimary////104.4///
No. 5
fault
SHB5-87678.84calcite in fracturesecondary/59.0–136.8Liquid phase86.1////
/////
calcite in caveprimary////89.1–100.9108.5–112.5//
/////
7680.10calcite in fracturesecondary/47.9–49.6//98.9–105.8///
/////
calcite in caveprimary///87.8–92.3/108.8–114.9//
//8.7//
7681.50calcite in caveprimary///84.3–99.8////
6.6–6.9////
secondary/53.5–60.785.7–98.984.6–93.0/107.9–120.6//
/////
SHB52A7671.86calcite in fractureprimary/66.8–68.3//93.5–106.7114.4–123.3//
/4.65.7–7.2//
secondary60.5–62.4////121149.4/
/////
7674.75calcite in fractureprimary/////108.5–127.2//
//1.4–9.5//
secondary52.4–84.0////112.5–124.3//
/////
calcite in caveprimary/65.3–68.9//90.3–99.8106.5–113.5//
/4.6–9.3///
secondary//////141.5/
/////
7901.64calcite in fractureprimary/55.8//87.5–104.3///
/10.6–10.9///
secondary/////110.7–116.3//
/////
No. 7
fault
SHB77728.80calcite in fractureprimary////103.6121.1–124.7153.5–158.6/
/17.99.9//
secondary/59.8–82.4//102127.3//
/13.9///
7728.90calcite in caveprimary////96.7–116.5122.8–126.6//
//4.2–5.1//
secondary/77.8–86.3//108.3–119.7///
/////
Note: “5.3” represents the salinity (wt.% NaCl) corresponding to the ice final melting temperature (Tm) conversion of saline inclusion.
Table 3. Comparison of hydrocarbon accumulation contribution of Ordovician strike-slip fault zones in the Shunbei area.
FaultNo. 7 faultNo. 5 faultNo. 1 fault
WellSHB7SHB5-8SHB52ASHB2
Stage1st stage2nd stage2nd stage3rd stage2nd stage3rd stage2nd stage3rd stage
Contribution (%)81.7118.2971.9228.0842.4857.524.3995.61
Disclaimer/Publisher’s Note: The statements, opinions and data contained in all publications are solely those of the individual author(s) and contributor(s) and not of MDPI and/or the editor(s). MDPI and/or the editor(s) disclaim responsibility for any injury to people or property resulting from any ideas, methods, instructions or products referred to in the content.