1. Introduction
The establishment of interruption limits and quality supply goals drives the pursuit of improved reliability in distribution systems. This pursuit significantly contributes to the quality of supplied energy and consumer satisfaction. Furthermore, it acts as a catalyst, spurring investments and enhancements in the network, thereby increasing system efficiency and even reducing costs. The performance of distribution systems in terms of service quality is measured through continuity indicators. The System Average Interruption Duration Index (SAIDI) and the System Average Interruption Frequency Index (SAIFI) are two widely used indicators in quality service regulation strategies [
1].
The setting of SAIDI and SAIFI limits generally relies on historical data from the consumer unit sets of distribution companies, selecting a threshold parameter based on the historical performance of the Distribution System Operator (DSO). The specifics for setting limits and grouping consumer sets subject to the same indicator limit vary according to the peculiarities of each country.
For instance, in Portugal, SAIDI and SAIFI are the indicators considered for establishing quality standards at all voltage levels (high, medium, and low voltage). The limit establishment for these indices is carried out based on geographical zones and voltage levels. This segmentation divides the territory into three zones, with consumer density being the criterion for zone division. Consequently, within each of the three voltage levels, the limits for SAIDI and SAIFI indicators are determined for each of the three zones. These limits are static and are updated with each new quality service regulation [
2].
In the United Kingdom, limits are not specifically established for SAIDI and SAIFI indices, but they are set for the quantity of Customer Interruptions (CIs) and Customer Minutes Lost (CMLs). The targets are derived from the historical performance of each DSO, with an annual correction applied based on improvement factors grounded on industry-wide historical improvements [
3,
4].
In Australia, each distribution company segments the network into four categories based on urban feeder consumption and rural feeder length. Within each feeder category for each distribution company, the performance target is obtained by averaging SAIDI and SAIFI performance over the past five years [
5].
In Chile, distribution system networks are classified according to an index considering the density of served consumers, the total length of the electrical network for each municipal association and company, or by provinces [
6]. The SAIDI and SAIFI limits are defined for each consumer density class, differentiating between low and medium voltage. These limits are presented annually in technical standards.
In Brazil, the regulation of limits for indicators of DSO consumer unit sets is carried out by the National Electric Energy Agency (ANEEL), the sole regulator of the entire national electric sector. Its latest revision occurred in 2014, under the framework of Public Announcement No. 29/2014, and the final methodology was published through Technical Note No. 0102/2014-SRD/ANEEL [
7]. Similar to SAIDI and SAIFI indicators, the Collective Interruption Duration (DEC) and Collective Interruption Frequency (FEC) indicators are calculated according to Equations (1) and (2), respectively [
8]:
where
is the individual interruption duration expressed in hours for each consumer unit
;
is the individual interruption frequency for each consumer unit
and
is the total number of consumer units in the analyzed set.
However, Brazil is a country with vast dimensions and significant geographical, environmental, and social diversity. As a result, the regulator, ANEEL, has adopted a distinct approach compared to the other mentioned countries for defining limits on the collective indicators DEC and FEC for different sets of consumer units (SCUs) throughout the country. Each SCU is a subdivision of a DSO and is also determined by the regulator. The aim is to create specific groupings among similar SCUs, even from different DSOs, in terms of environmental variables and technical characteristics. This enables a comparison of indicators between SCUs facing similar challenges in providing adequate service quality. This is dynamically defined, generating specific clusters of similar sets for each SCU in Brazil. Finally, for each of these clusters, the DEC and FEC limits are determined by using the 20th percentile of the actual historical performance of the sets forming them [
7].
The process used by ANEEL to form these clusters of similar SCUs to define efficient quality targets for each consumer set is called the dynamic method. To determine the similarity of SCUs, the sum of Euclidean distances of values of pre-selected attributes [
7] between sets is calculated. These attributes may pertain to different domains, such as electrical, meteorological, urban, and socioeconomic characteristics, and they are used to group SCUs based on their relative similarity.
The currently active dataset used for calculating limits through the dynamic method contains 146 attributes. However, ANEEL selects only a subset of attributes to simplify the model, reduce calculation time, minimize the possibilities of overfitting, and streamline data collection and updating. Thus, the attribute selection method is a crucial factor in ensuring the similarity of set characteristics when grouping them for the determination of DEC and FEC limits [
7].
Currently, ANEEL employs the stepwise method for attribute selection [
7]. Despite having produced satisfactory results in the past, some authors have reservations about this method. For instance, [
9,
10] assert that this method has disadvantages in variable selection for regression models. One of the drawbacks is sensitivity to variable inclusion and exclusion. Moreover, this method can lead to overfitted models, especially when the number of variables is substantial compared to the sample size, increasing the risk of overfitting. According to [
11], another drawback of this method is that it does not consider all possible combinations of variables. Instead, it conducts a sequential search, which might exclude important variables that could enhance the predictive capacity of the model.
Given these drawbacks, it is important to consider more robust alternative approaches for variable selection. According to [
12,
13], machine-learning models can capture complex and nonlinear relationships in data, allowing them to handle problems where the relationships between input and output variables are not straightforward. Furthermore, these algorithms are flexible and can be applied to various types of data, expanding their applicability across domains and problems.
Among the works that consider the specifics and complexity of DEC and FEC limits in the Brazilian context, [
14] stands out. This work estimated the impact of maintenance actions on quality indicators using historical system data. It employed machine learning for the clustering of distribution lines based on their geographic and technical characteristics, using data regression to estimate the impact of maintenance actions on quality indicators of the lines. Although [
9] proposed an analytical study without regulatory application, the use of clustering and regression models for network analysis is noteworthy.
Even though applied to a regulation predating the new methodology proposed in 2014, the work in [
15] presented a methodology for grouping consumer units to achieve DEC and FEC targets. Based on machine learning, the methodology proposed in [
15] sought to readjust the consumer sets to find the most advantageous geo-electric combination for meeting DEC and FEC limits.
The work by [
16] proposes an optimized fuzzy clustering approach, considering all sets of consumer units in Brazil and a new metric for calculating the boundaries of each set. Particle Swarm Optimization (PSO) is used to mitigate potential local minima in clustering. This methodology utilizes the degree of membership of the sets to weigh the similarities between them. The data used in this study were obtained from ANEEL and pertain to sets of consumer units in Brazil in 2018. Fuzzy C-Means (FCM) was chosen as the clustering method, and PSO was applied to optimize the number of clusters and the resulting centroids of the clustering. The generalized silhouette coefficient was used to determine the optimal number of clusters. The proposed methodology was applied to the Equatorial Pará utility company during the process of defining continuity indicator thresholds for the next four years. The results were compared with those obtained by ANEEL, allowing for an evaluation of the methodology’s effectiveness. This approach aims to improve the definition of collective thresholds for continuity indicators, considering the reality of utility companies and encouraging service quality improvement. Considering the works already developed in the complex Brazilian context and the current methodology, it is apparent that there are no works focused on ordering and selecting attributes that best represent DEC and FEC indicators. Thus, the contribution of this work is clearly outlined in the context of attribute selection for clustering and setting DEC and FEC limits using machine-learning techniques.
Therefore, the objective of this work is to develop an AI-assisted methodology, named MAIA, capable of ordering and selecting the most relevant attributes for representing similar consumer sets. The ordering of attributes that best represent DEC and FEC indicators is achieved through a regression model. The selection of attributes that will represent the reduced dataset is accomplished through an iterative process of optimal clustering and evaluation of clustering performance for different numbers of attributes. This methodology employs replicable tools and methods with well-defined criteria, allowing for its application even when the set of attributes changes. Moreover, results are measured through qualitative analysis, which compares the categories of attributes selected by each method, as well as quantitative analysis, which compares the coefficient of determination and the heterogeneity score of clustering for each selection of attributes.
The rest of this work is structured as follows:
Section 2 introduces MAIA;
Section 3 provides a superficial overview of the attributes considered in the Brazilian case;
Section 4 presents results, discussions, and comparisons of the proposed methodology with the current one; and
Section 5 concludes and presents possible future paths for this work.
2. MAIA
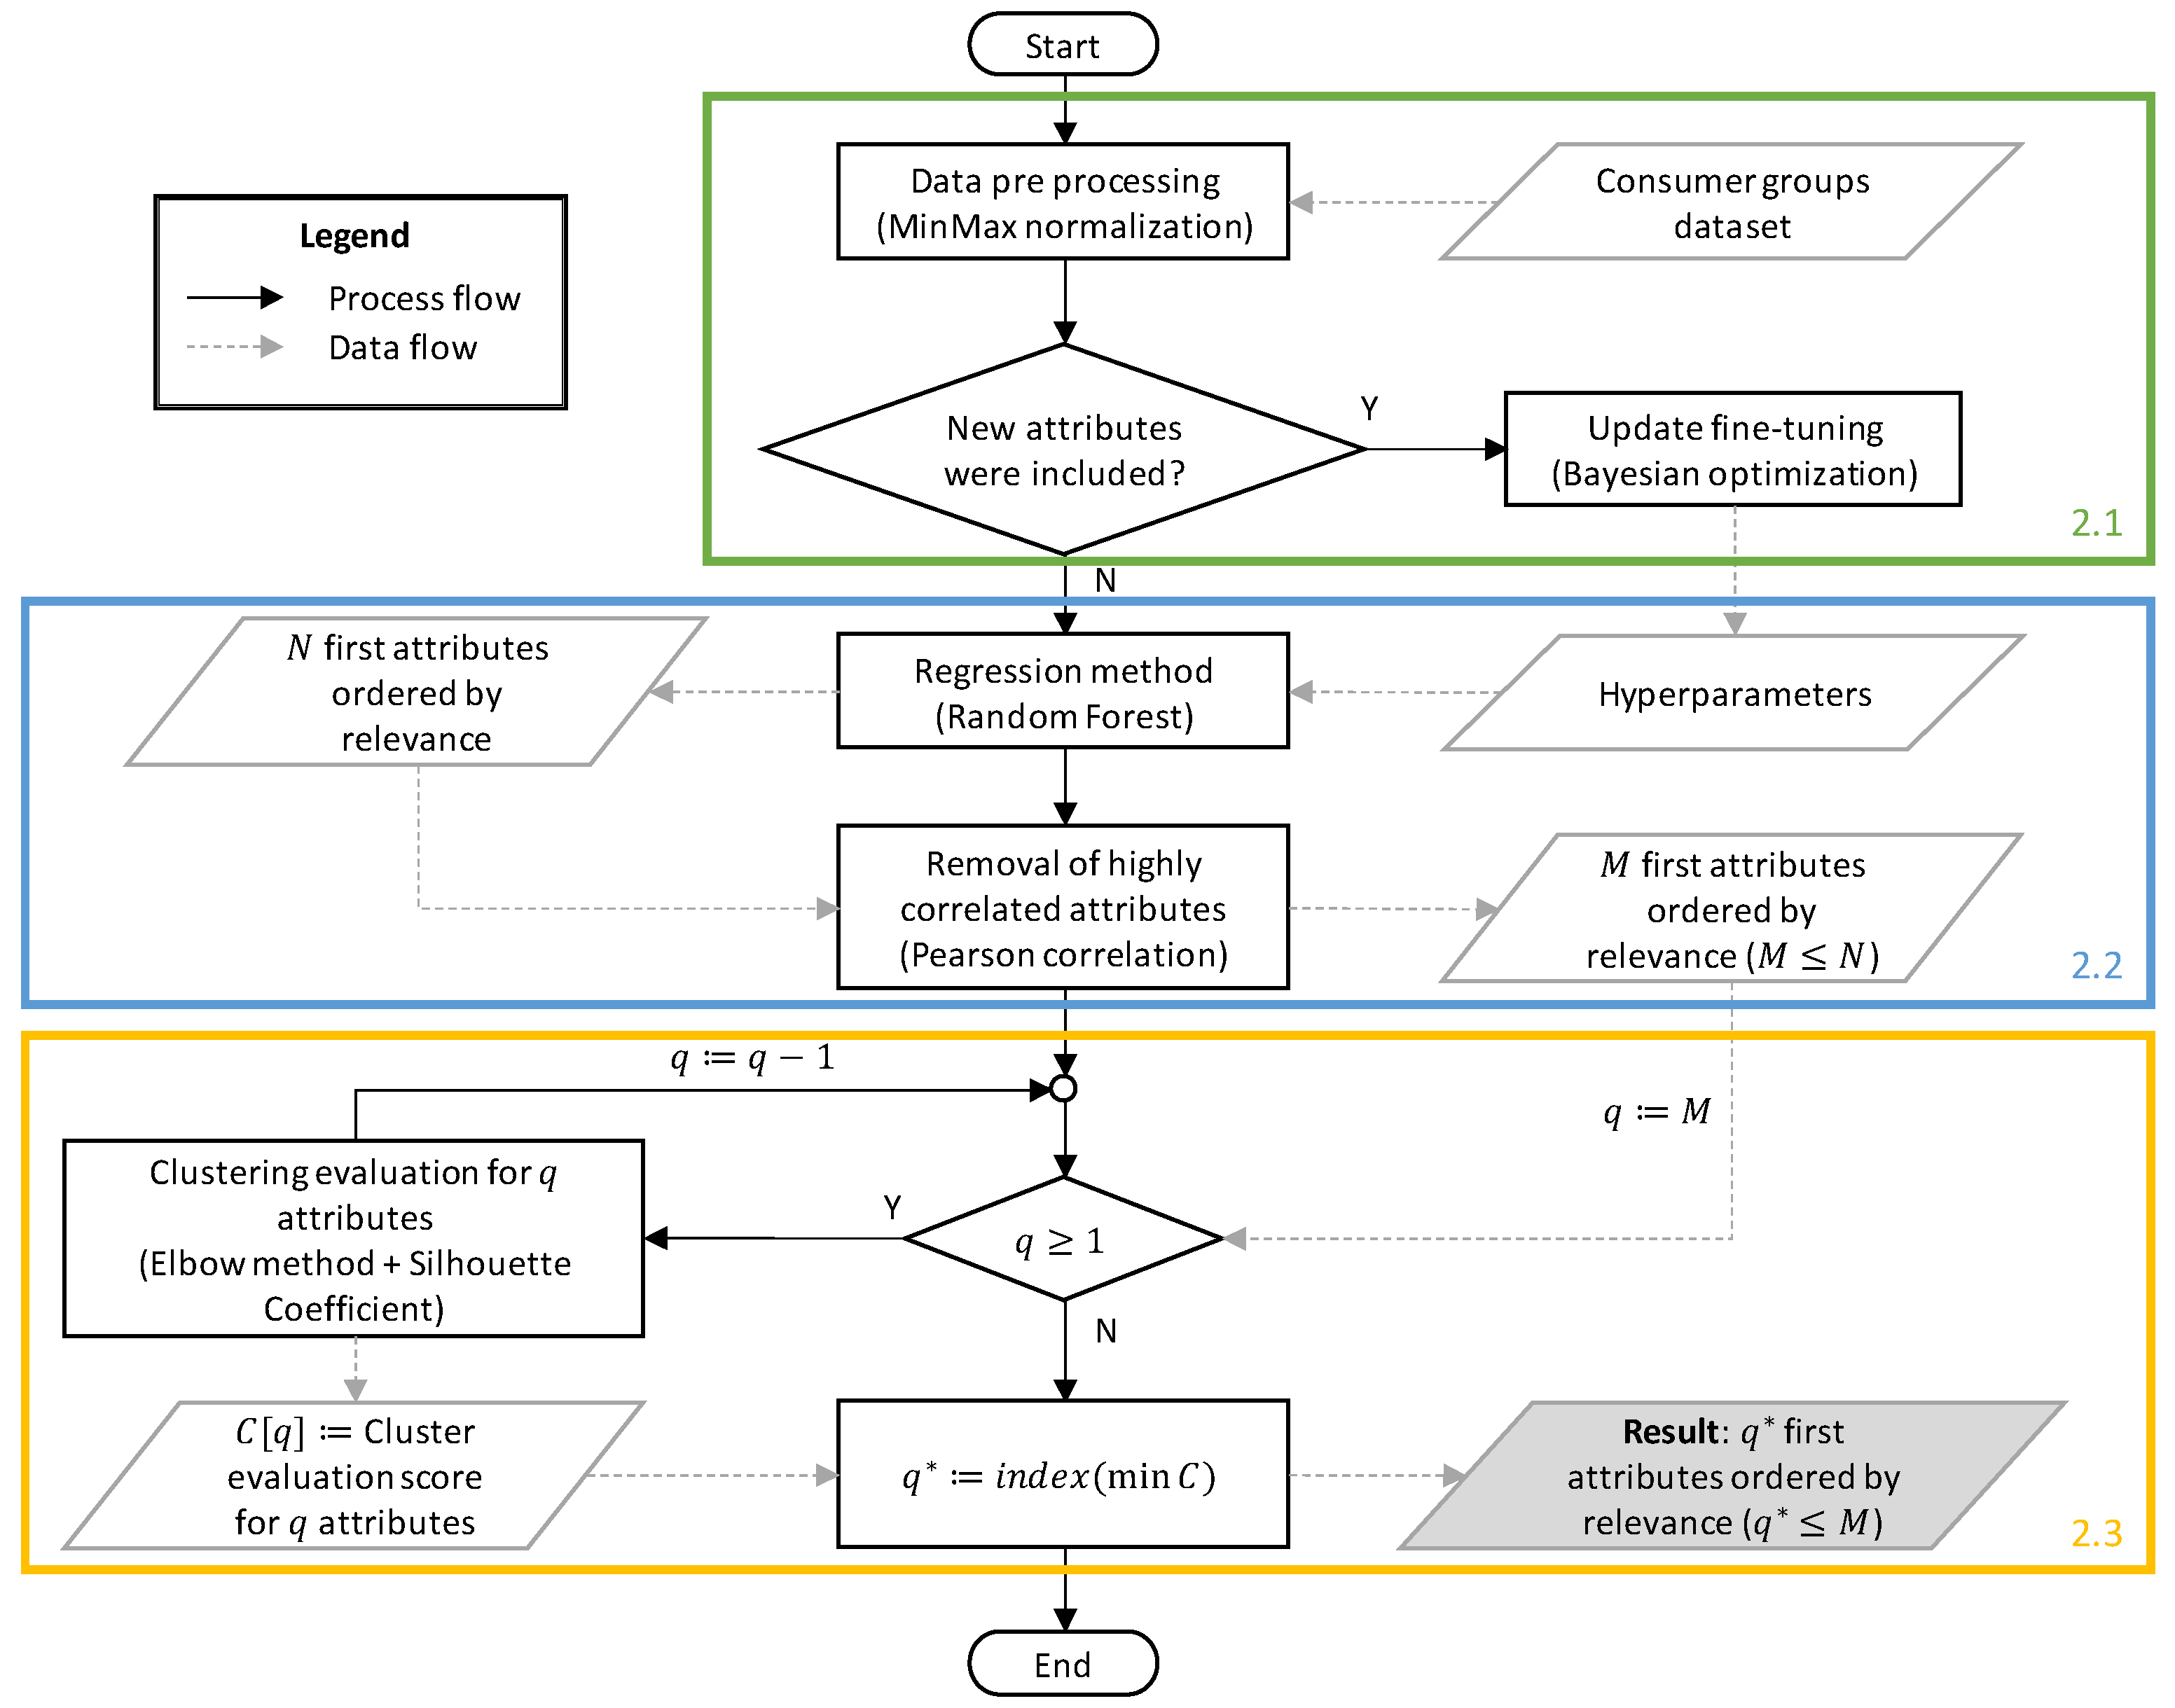
The proposed methodology is illustrated in the flowchart in
Figure 1. Through a regression model and an exploration of possible attribute quantities that could be used, a configuration of attribute quantity is determined that leads consumer sets to a more homogeneous clustering configuration.
Each step of the methodology presented in the flowchart will be described sequentially. Black blocks and lines represent the process flow, while light gray blocks and lines represent the data flow.
2.1. Preprocessing and Fine-Tuning
Initially, a preprocessing step is performed on the consumer set database. The preprocessing includes removing rows with missing data and applying MinMax normalization individually to each attribute in the dataset, according to the green part of
Figure 1. The normalization rule used is presented in Equation (3):
where
—Transformed variable;
—Original variable;
—The smallest value of the variable;
—The largest value of the variable.
In addition to data preprocessing, it is also important to highlight the fine-tuning step, which involves adjustments and refinements that should be applied when the database structure changes. According to [
17], in machine learning, there are two types of parameters, those learned from the training data and those separately optimized, known as hyperparameters or tuning parameters.
The Random Forest algorithm requires the prior definition of hyperparameters, which need to be carefully optimized to achieve the best performance. Among the various methods for hyperparameter tuning, Bayesian optimization was chosen. According to [
18], Bayesian optimization is a method that employs probabilistic models to find the best configuration of hyperparameters for a machine-learning model. A probabilistic model is built to map hyperparameter configurations to corresponding performance outcomes. Based on this model, informed choices can be made about which configurations to explore in search of the best solution. Bayesian optimization is effective in seeking hyperparameter configurations that maximize machine-learning model performance, particularly when the search space is large and testing all configurations is not feasible.
2.2. Regression Model
With the preprocessed and normalized dataset and the tuned hyperparameters, the next step involves identifying the most relevant attributes to represent the DEC and FEC targets. As mentioned earlier, the regression method used is Random Forest, according to the blue part of
Figure 1.
Random Forest, introduced by [
19] and extended by [
20], is a machine-learning method that combines multiple decision trees to perform classification and regression tasks. Each decision tree is trained on a random sample of training data and uses a random subset of input variables. The final prediction is obtained by aggregating the individual predictions from each tree, either through voting (for classification) or averaging (for regression).
According to [
21], Random Forest is widely adopted for solving regression problems, and this choice is based on its performance, even when dealing with data that exhibit complex relationships, making it a robust and reliable tool. In addition to its resistance to overfitting, this is achieved through the construction of multiple independent decision trees that, when combined, reduce variance error. Its tolerance to outliers makes it a solid choice in scenarios where atypical data may arise, which makes Random Forest a great fit for the problem that is being tackled in this paper: to define efficient quality targets per consumer set.
Initially, the data are partitioned into training and testing sets for the model. The model is executed twice: once with DEC as the target and once with FEC as the target. This way, the order of the most relevant attributes to represent each indicator is obtained. Each listed attribute presents a score and an associated error from the model.
After determining the order of the most relevant attributes, highly correlated attributes are identified, eliminating attributes considered redundant from the dataset. At this stage, it is possible to consider all attributes in the dataset. However, since the aim of this methodology is to reduce the number of attributes, only the top 30 relevant attributes are considered for the analysis of highly correlated attributes. Pearson correlation was used for this analysis. An attribute was considered highly correlated if its correlation value was equal to or greater than 0.9. When identifying highly correlated attributes, the decision is made to remove the less important attribute from the model.
2.3. Exploration and Optimization of the Number of Attributes
From this point onwards, the process of scanning to identify the optimal number of attributes for the most efficient clustering begins. For this purpose, the loop presented in the flowchart is executed, performing the following processes in each iteration, according to the yellow part of
Figure 1.
Based on the number of attributes under analysis, it is necessary to determine the optimal number of clusters. The elbow method was used for this determination, which involves identifying the inflection point on the graph. The curve is formed by different clustering configurations obtained through the K-means method, using all attributes from the analysis as parameters for distance calculation. The K-means method is a popular machine-learning clustering approach used to divide data into groups (clusters) based on similarity. K-means is a centroid-based clustering technique, meaning that groups are formed around central points known as centroids, as stated in [
22].
At this stage, the DEC and FEC targets are not considered, and clustering is achieved solely based on the Euclidean distance associated with the chosen attributes.
To compare the different reduced datasets associated with different numbers of considered attributes, a clustering evaluation score needs to be established. The silhouette is calculated for each object in the dataset, ranging from −1 to 1. Values close to 1 indicate that the object is well-assigned to its cluster, while values close to −1 suggest misassignment. Values close to zero indicate objects near the boundary between clusters. For this methodology, the Silhouette coefficient is considered. This coefficient enables the analysis of how well-defined each formed cluster is and how distant each formed cluster is from the nearest cluster. Once again, the Euclidean distance is considered for all attributes in the reduced dataset.
Finally, the number of attributes defining the reduced dataset is updated until only one attribute is considered. For result analysis, this criterion is maintained as the minimum number of attributes to be considered. However, it is important to note that there is no real-world application for a reduced dataset represented by only one attribute. Moreover, cases where only two or three attributes were considered resulted in highly heterogeneous and disparate clustering in terms of the number of samples per cluster and the heterogeneity of each observed cluster.
Thus, the optimal number of attributes is identified throughout this iterative process. It is worth highlighting that for each considered number of attributes, the local optimum for clustering is found. Therefore, in the final step, these different local optima are compared, identifying the reduced dataset that best represents the DEC and FEC indicators.
3. Presentation of the Brazilian Case
As previously mentioned, the vastness of the Brazilian territory and its significant social, environmental, climatic, and urban diversity necessitate an analysis that adequately encompasses all electrical sets. Beyond the diversity between regions of the country, it is important to note the variation within companies and micro-regions, where neighboring electrical sets might possess highly disparate characteristics. It should be emphasized that division by concession areas, companies, cities, or even regions is not suitable. Therefore, a clustering of similar electrical sets based on relevant attributes becomes necessary.
In its Technical Note [
7], ANEEL outlines 146 attributes that represent different aspects of each SCU. To facilitate the comprehension and presentation of results, these 146 attributes were categorized by the authors into five types of information: electrical; urban infrastructure; meteorological; vegetative; and socioeconomic. Each of these categories will be briefly presented below. It is important to stress that these attributes are defined by the regulator and not the DSOs. Furthermore, MAIA does not propose to modify the 146 outlined attributes but to select the most relevant attributes among the 146. The existing attribute selection methodology proposes the same thing but through a different process.
3.1. Electrical Attributes
The dataset comprises 89 electrical attributes. These attributes are provided directly by the Distribution System Operators (DSOs), constituting a unified database. One initial category that defines some of these attributes pertains to the basic geo-electric information of each distribution set, such as the area and service area encompassing the feeders’ neighborhoods within each set.
Attributes related to the number of served consumers, total energy consumption, and population density within each set are also identified. By defining urban and non-urban regions, it becomes possible to characterize various elements of the grid. This definition involves a one-square-kilometer grid, where each grid cell is categorized as urban or non-urban based on consumer density. Additionally, attributes related to the overall consumer density per set area and feeder service area are considered.
Another category of electrical attributes relates to consumer energy consumption and the power demand of distribution transformers. There is also information regarding the classification of consumers served by the set: residential; commercial; industrial; or belonging to other classes.
Lastly, a category of electrical attributes is capable of quantifying the electrical infrastructure of the set, including the proportion of three-phase and two-phase feeders, feeder length, the proportion of three-phase and two-phase transformers, transformer overload measured through the ratio of nominal power per consumer and energy consumed by the transformer’s nominal power.
All electrical data are georeferenced and can be spatially overlaid with other georeferenced data in the dataset.
3.2. Urban Infrastructure Attributes
The dataset also comprises 21 attributes related to urban infrastructure. These attributes provide information about the road network, road density, intersections between the road network and the feeder service area, and the proportion of paved and unpaved roads. Apart from measuring urban mobility in the region, these attributes also offer insights into regional development.
Urban infrastructure data are also georeferenced, allowing for the correlation of these attributes with the set areas and feeder service areas.
3.3. Meteorological Attributes
The dataset also includes three meteorological attributes. These refer to the average annual rainfall over the set area, the average annual rainfall over the feeder service area, and the density of atmospheric discharges (lightning) in the set area.
Rainfall data can be extracted in a georeferenced manner. Atmospheric discharge data are obtained by the municipality. Therefore, a referential treatment is performed to enable the extraction of this information for each consumer set.
3.4. Remnant Vegetation Attributes
The dataset also contains 20 attributes related to remnant Brazilian vegetation. This data layer represents the occurrence of natural vegetation in three height bands: from 0 to 20 m; from 20 to 30 m; and from 30 to 50 m. These attributes are associated with higher operational costs and complexities, which can impact both DEC and FEC indicators.
Vegetation data are also georeferenced and can be related to the consumer set area or the feeder service area.
3.5. Socioeconomic Attributes
Finally, the socioeconomic attributes represent 13 out of the 146 attributes in the dataset. These attributes can depict the socioeconomic aspects of the region’s inhabitants. For instance, they may include factors like income inequality, the proportion of extremely poor residents in a specific area, average municipal per capita income, and the proportion of people living in dwellings with inadequate walls.
Socioeconomic attributes also reflect socioeconomic and developmental aspects of the region, such as the Human Development Index, the proportion of people living in subnormal clusters (informal settlements), the proportion of households with garbage collection services in the region, and the proportion of households with inadequate water supply and sanitation facilities.
4. Results and Discussion
The methodology presented was developed using Python, with the assistance of libraries such as pandas, numpy, sklearn, and yellow brick. Data manipulation and georeferenced result plotting were performed using the Geopandas library and QGIS.
For the scenario analyzed in this section, the data described in the previous section were collected for the year 2020. Some data related to roads were deemed inadequate for this year and were removed from the dataset. As a comparison scenario, the attributes selected by the existing methodology [
7] for the same dataset were used. Due to the low replicability of the existing methodology, the results points were obtained from the report [
7]. Therefore, the comparison is limited to the availability of results, but as the points not presented are those associated with larger quantities of attributes, this lack does not affect the comparison.
The preprocessing process consists of two steps. In the first step, only records with missing values in the predictor and target variables are removed. This resulted in no rows being removed from the process. In the second step, the data need to be transformed to approximate a normal distribution before applying the regression analysis. The normalization technique described in
Section 3 was applied to achieve normality and linearity in the data.
First, the training and testing data were separated using an 80% training and 20% testing split. The Bayesian optimization had access only to the training data to find the optimal model, and 50 models were created in this process. At the end of this process, the 20% test data, which the model was not aware of, was used to assess how the model was converging.
Table 1 provides information about the parameters and intervals considered in the optimization for the random forest algorithm.
Through the application of Bayesian optimization, the optimal values of the hyperparameters for the DEC and FEC models were obtained, as illustrated in
Table 2.
Additionally, the test results of the best models were evaluated based on the average training data score and the score of the test data removed from the optimization phase. The coefficient R
2 was used as the evaluation metric. The obtained scores are presented in
Table 3.
4.1. Qualitative Analysis
Based on the reduction in datasets according to MAIA and the current methodology of ANEEL, the attributes were divided according to the categorization in
Section 3. In addition to the five categories presented in each subsection, the first category referring to electrical attributes was divided into two categories: the first related to energy density; and the second related to network infrastructure, as already presented in
Section 3.1.
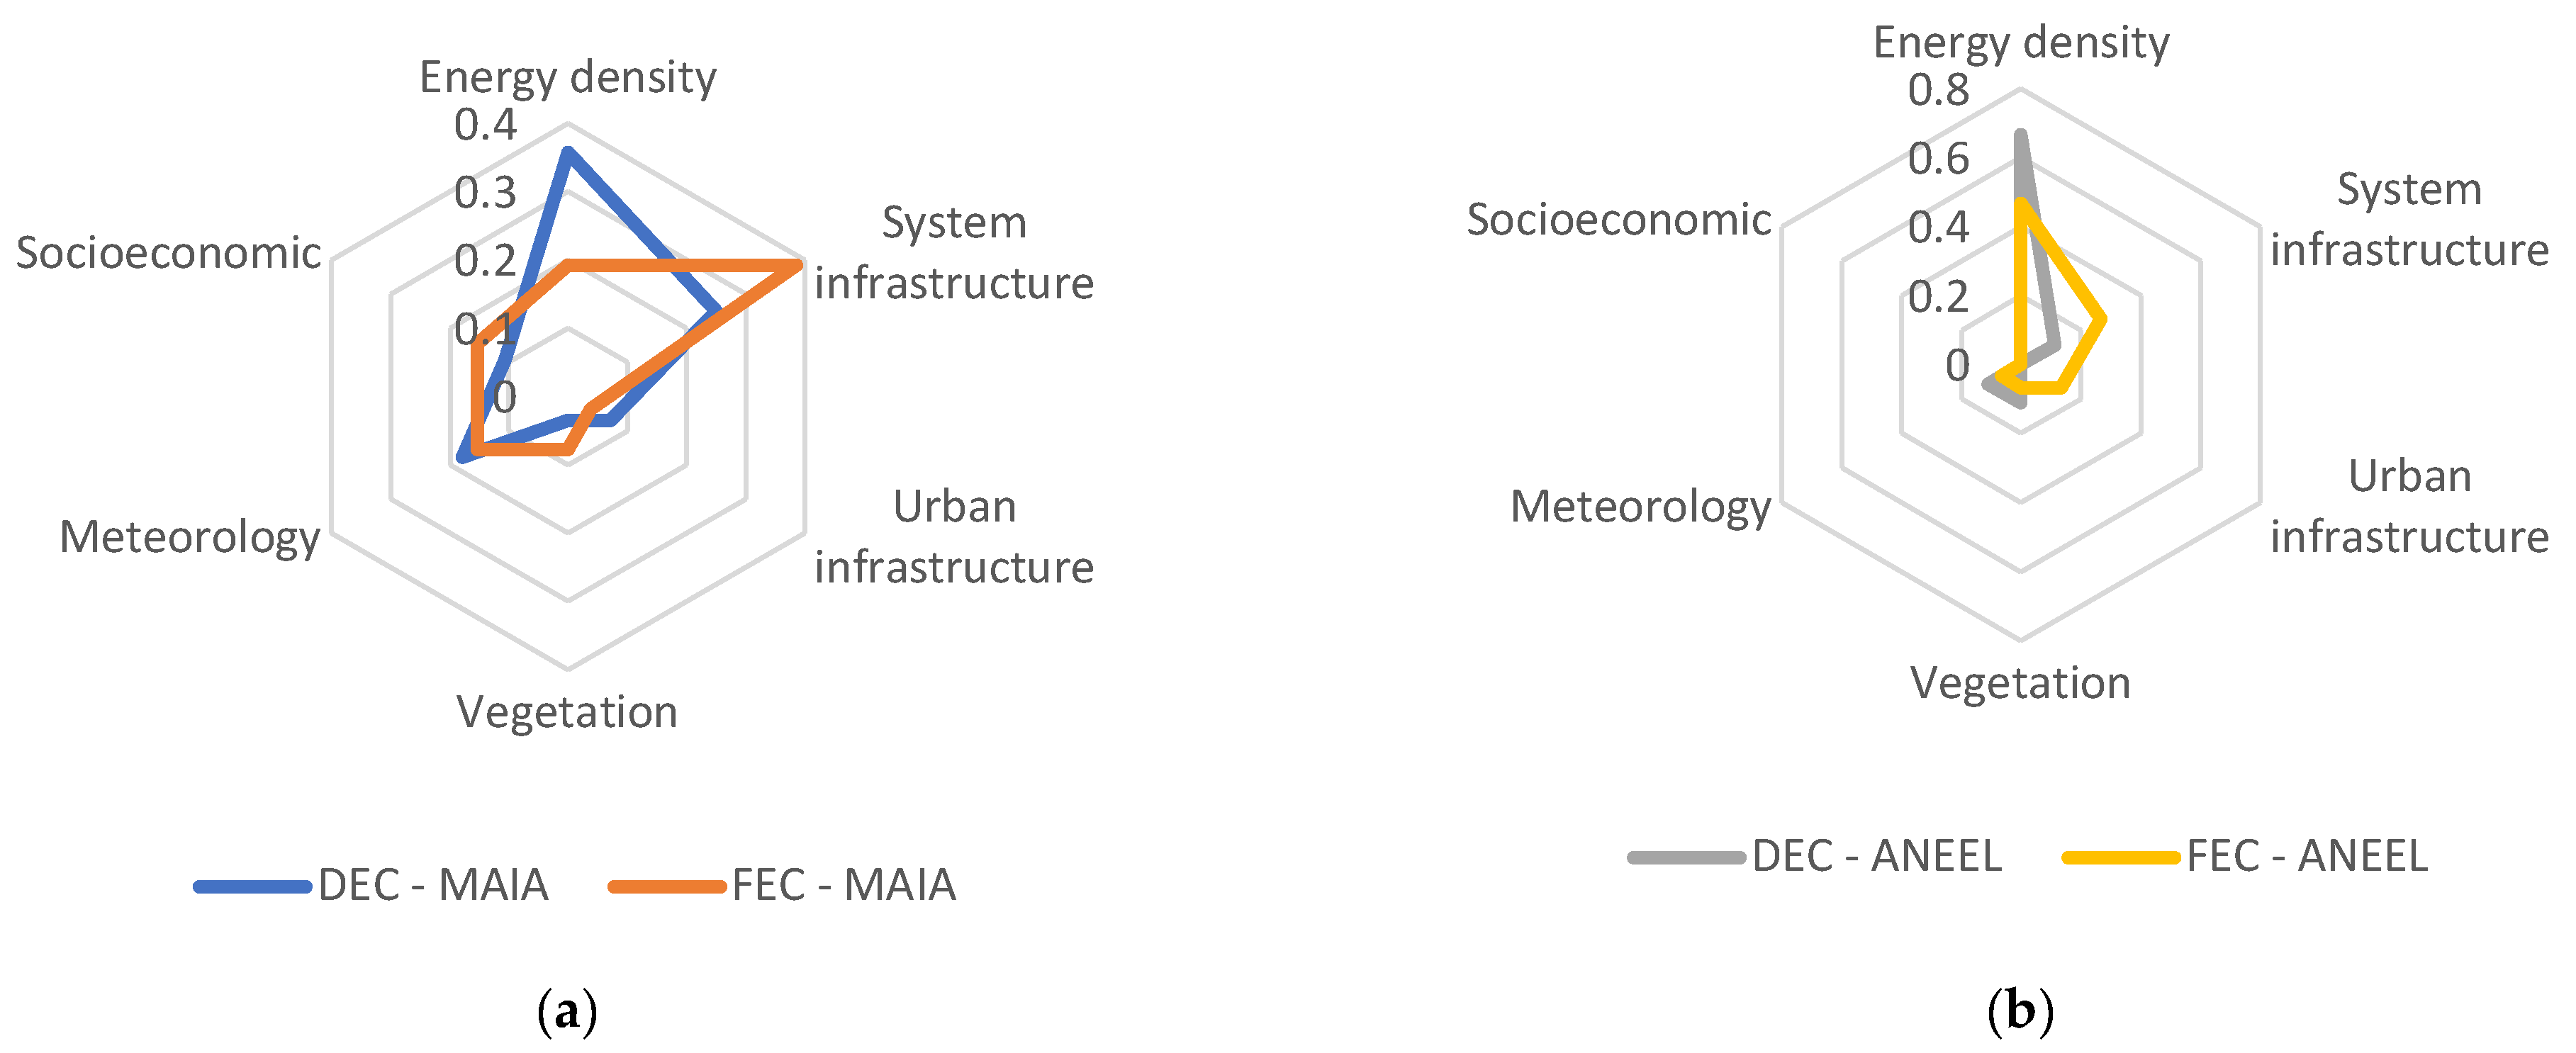
Figure 2 presents the incidence of each attribute in each considered category for attribute selection through MAIA (a) and through the current ANEEL methodology (b).
The points plotted on the graphs in
Figure 2 represent the proportion of incidence for each category so that the sum of indicators in each category results in one. It can be observed that the proposed methodology approach yields a more balanced outcome when compared to the result of the current ANEEL methodology, which favors attributes related to energy density in both DEC and FEC analyses.
In the case of MAIA, the most significant difference between DEC and FEC indicators is seen in a higher incidence of network infrastructure attributes and energy density attributes, respectively. Considering interruption frequency, the relation with network infrastructure is indeed important. Similarly, for interruption duration, attributes representing energy density exert a stronger influence on characterizing the DEC indicator.
Continuing the analysis of
Figure 2a concerning FEC indicators, it is evident that this methodology results in a higher inclusion of vegetation-related attributes and socioeconomic indicators compared to the same analysis for DEC indicators. Looking at DEC indicators, a slight increase in the incidence of meteorological and urban infrastructure attributes is noticeable, as expected, due to extreme temperature phenomena, heavy rainfall, and even urban infrastructure-related crew movements.
Analyzing
Figure 2b, it is notable that the current methodology completely omits socioeconomic attributes from its analysis, citing model simplification and the difficulty in obtaining these attributes. However, it is important to recall the relevance of these attributes once they are capable of identifying regions more susceptible to poorer infrastructure, violence, energy theft, access difficulties, landslides, and environmental catastrophes.
Urban infrastructure attributes are not removed from this methodology but are not included in the attribute prioritization process for DEC. There is a minor influence of the urban infrastructure attribute category on the FEC indicator, which is unexpected since this attribute is more directly related to interruption durations rather than their frequencies. Nevertheless, indirect relationships between urban infrastructure and interruption frequency might exist.
Once again, the high prioritization of energy density attributes is emphasized, with a slight deviation toward network infrastructure, particularly for FEC indicators. Still, nearly 70% of attributes selected for the DEC indicator are related to the energy density category.
In the following subsections, quantitative analyses of MAIA’s performance compared to the current ANEEL methodology will be presented to complement the qualitative analysis provided in this section.
4.2. Quantitative Analysis
Applying the hyperparameters determined in
Section 4, the attribute selection is carried out using the Random Forest algorithm, as described in
Section 2. Based on the selected attributes, quantitative analyses are presented to validate the proposed methodology. Initially, a comparison of the explanatory power of attributes identified by the new methodology with the ANEEL’s attributes is presented.
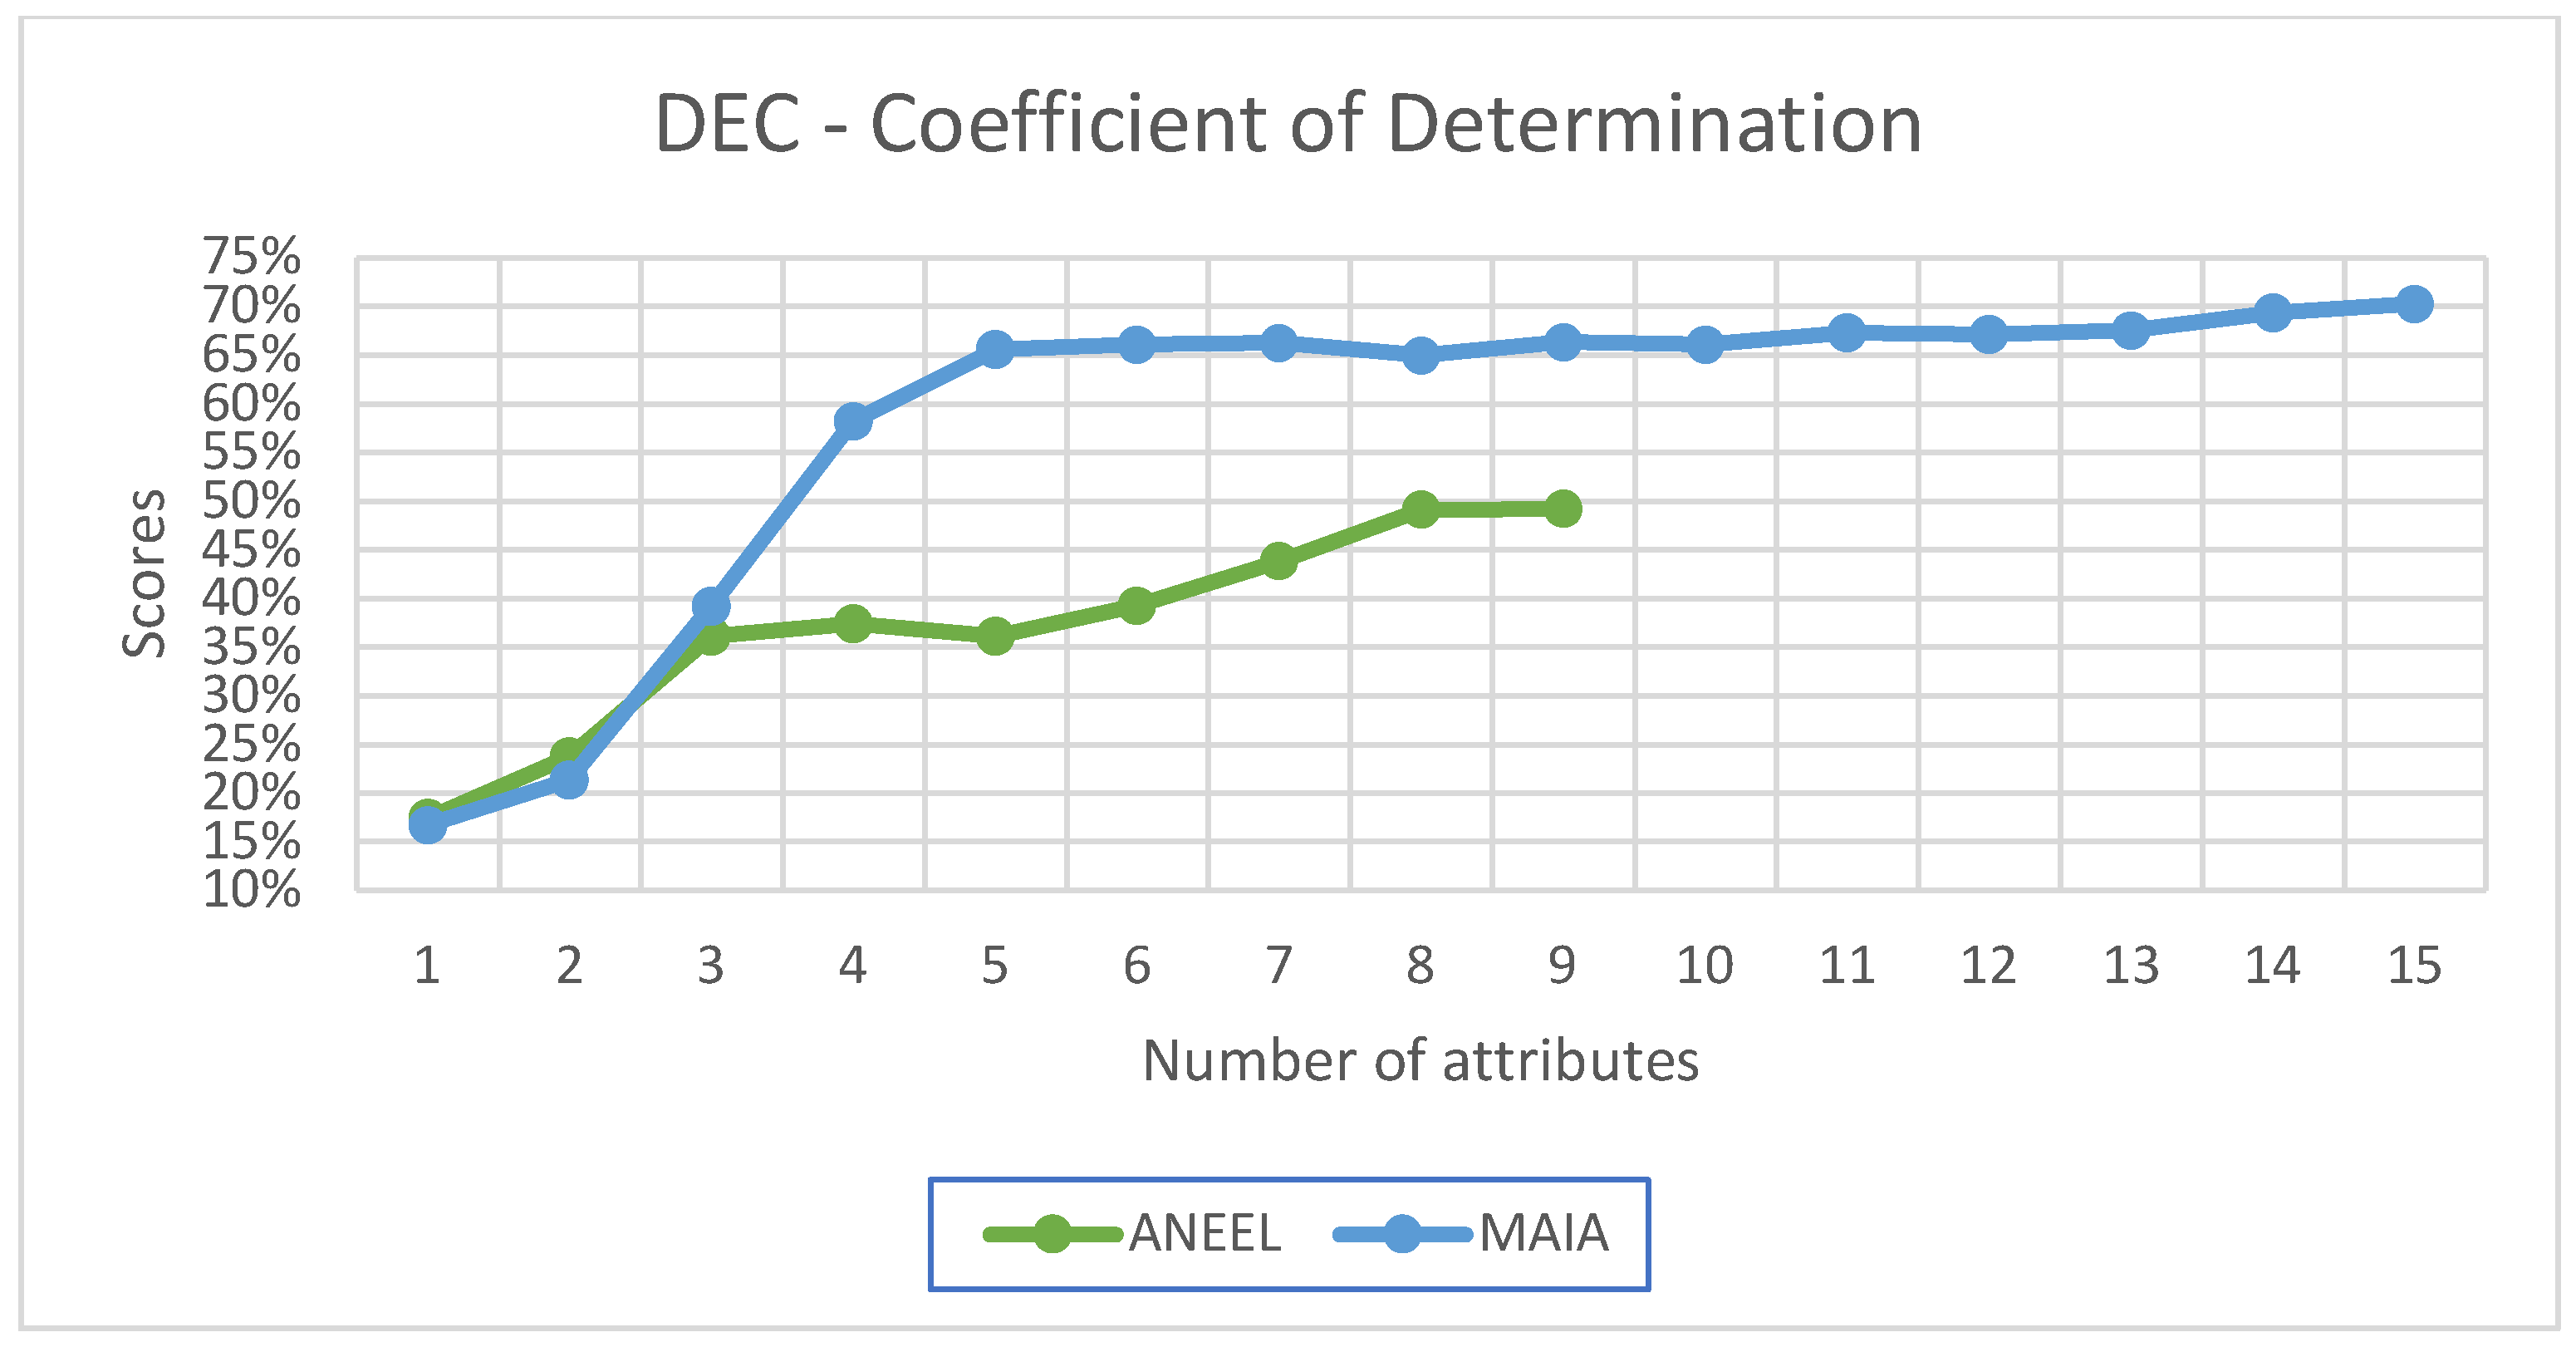
Figure 3 displays the R
2 Coefficient score for the DEC indicator, revealing the superior performance of the selected attributes compared to the attributes chosen by the current methodology. It is important to note that the ANEEL methodology opted to use only six attributes.
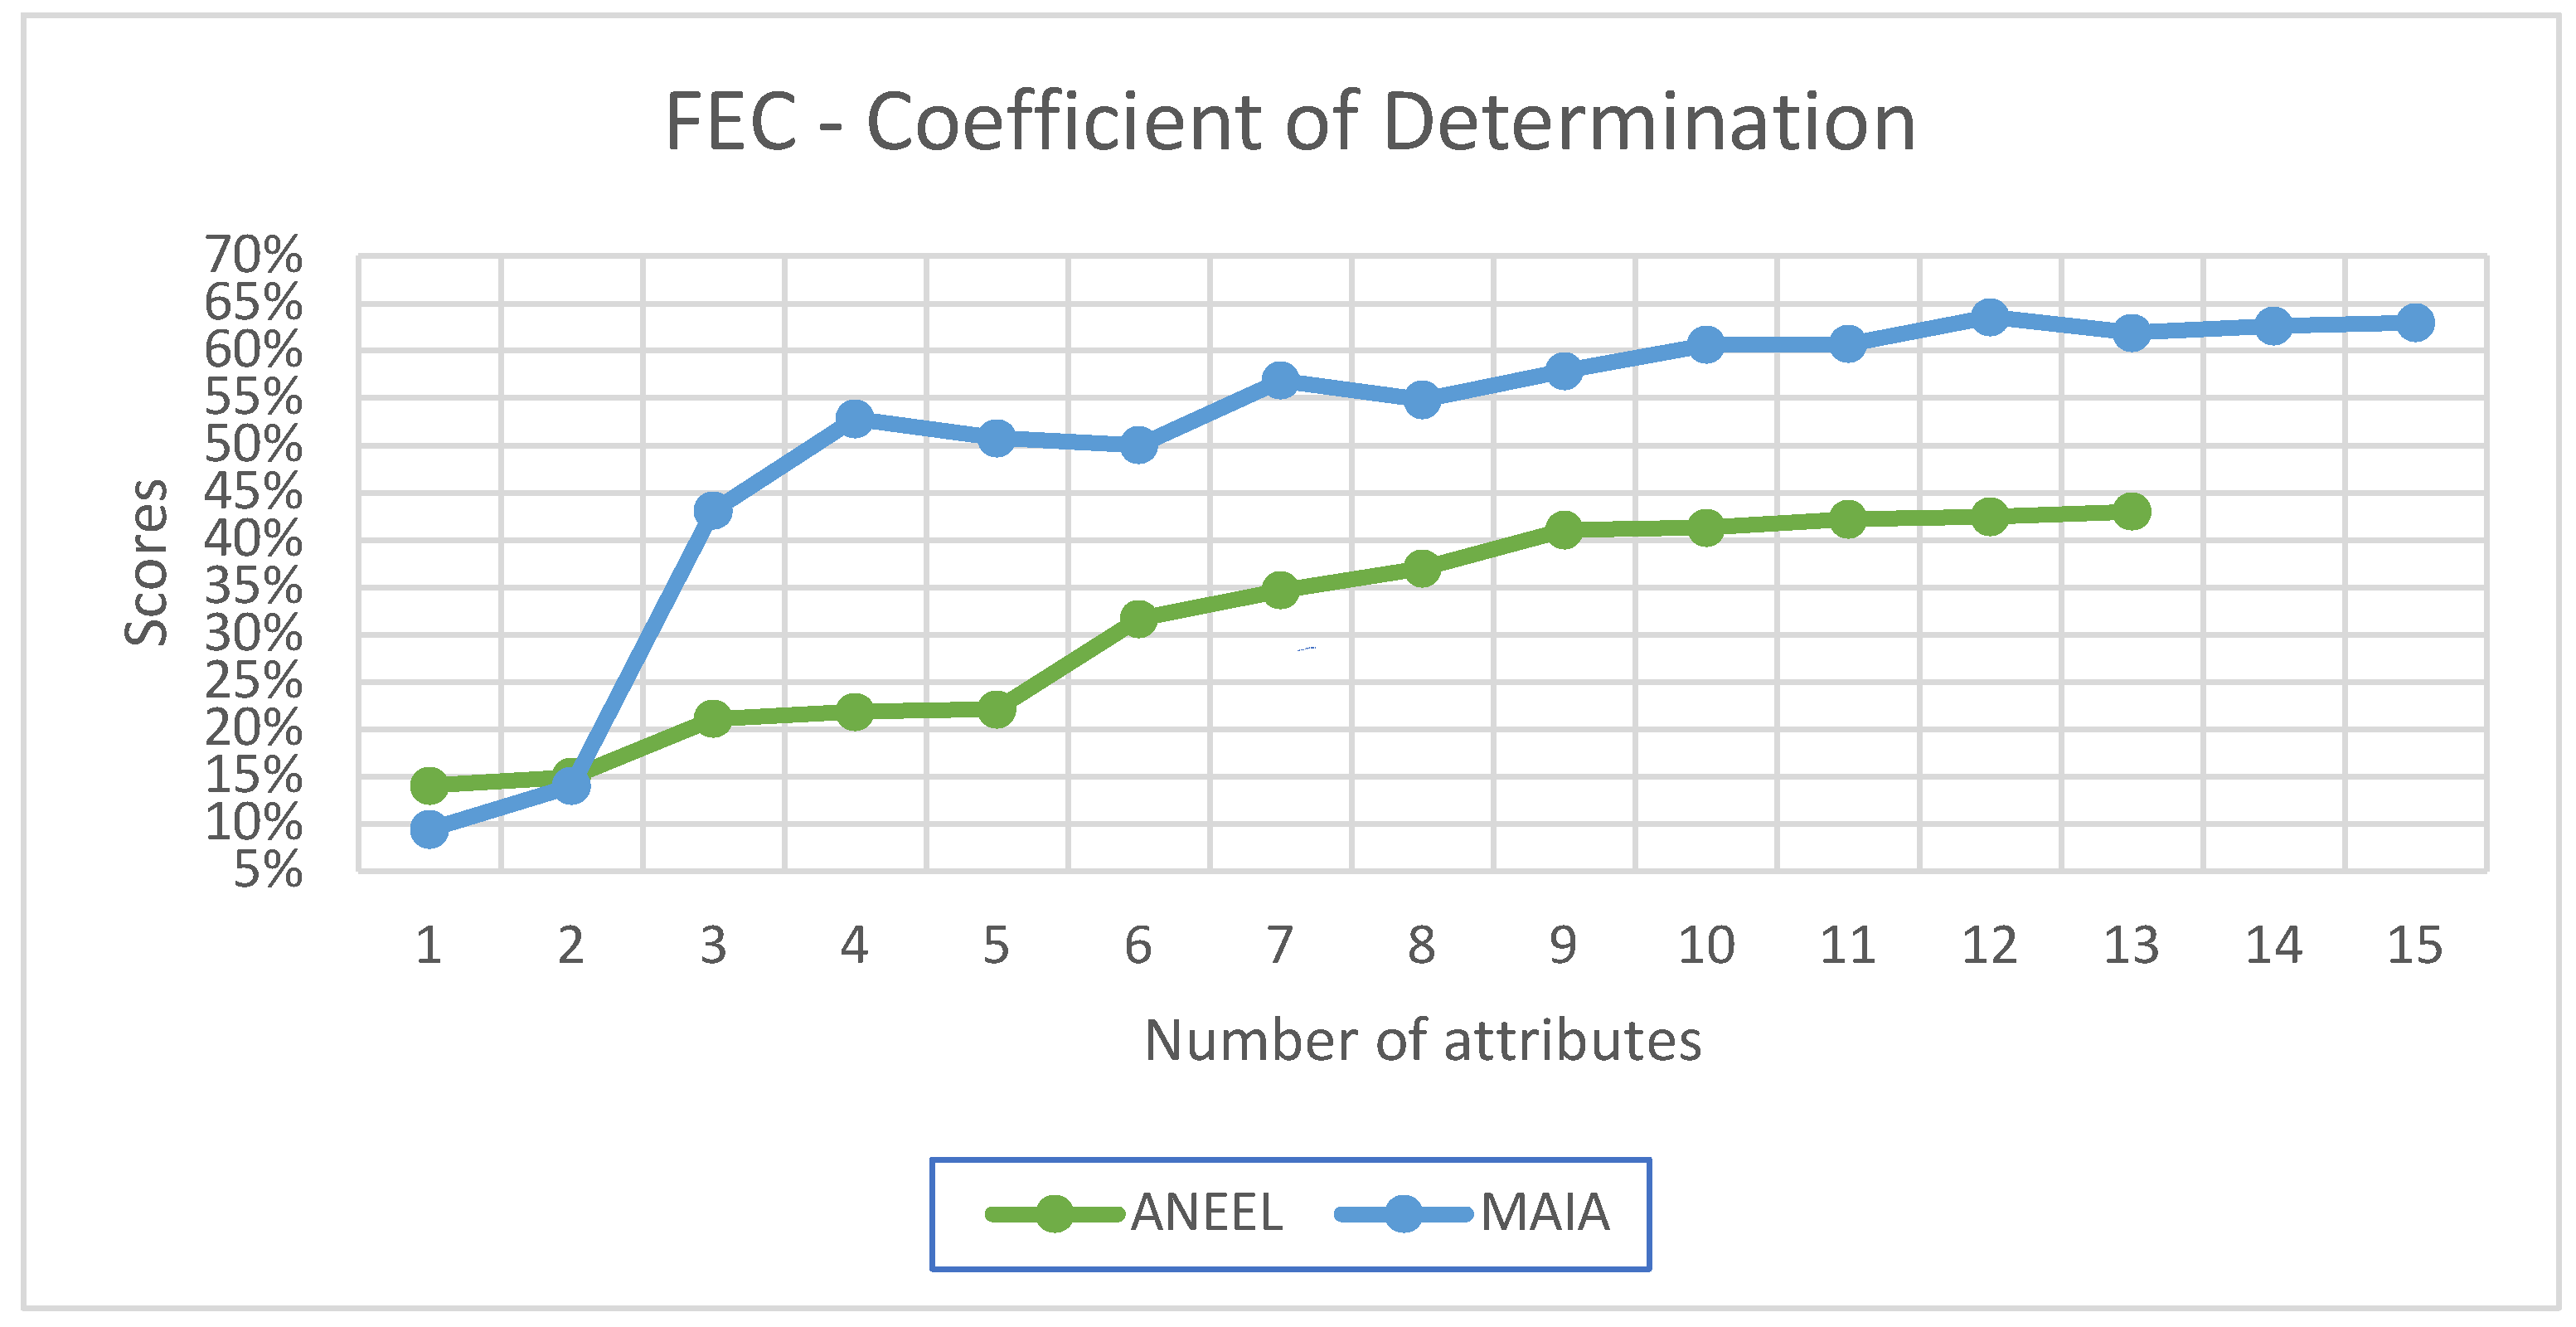
Figure 4 depicts the R
2 Coefficient score for the FEC indicator, revealing the superior performance of the selected attributes compared to the attributes chosen by the ANEEL methodology. It is worth noting that the ANEEL methodology chose to utilize only six attributes.
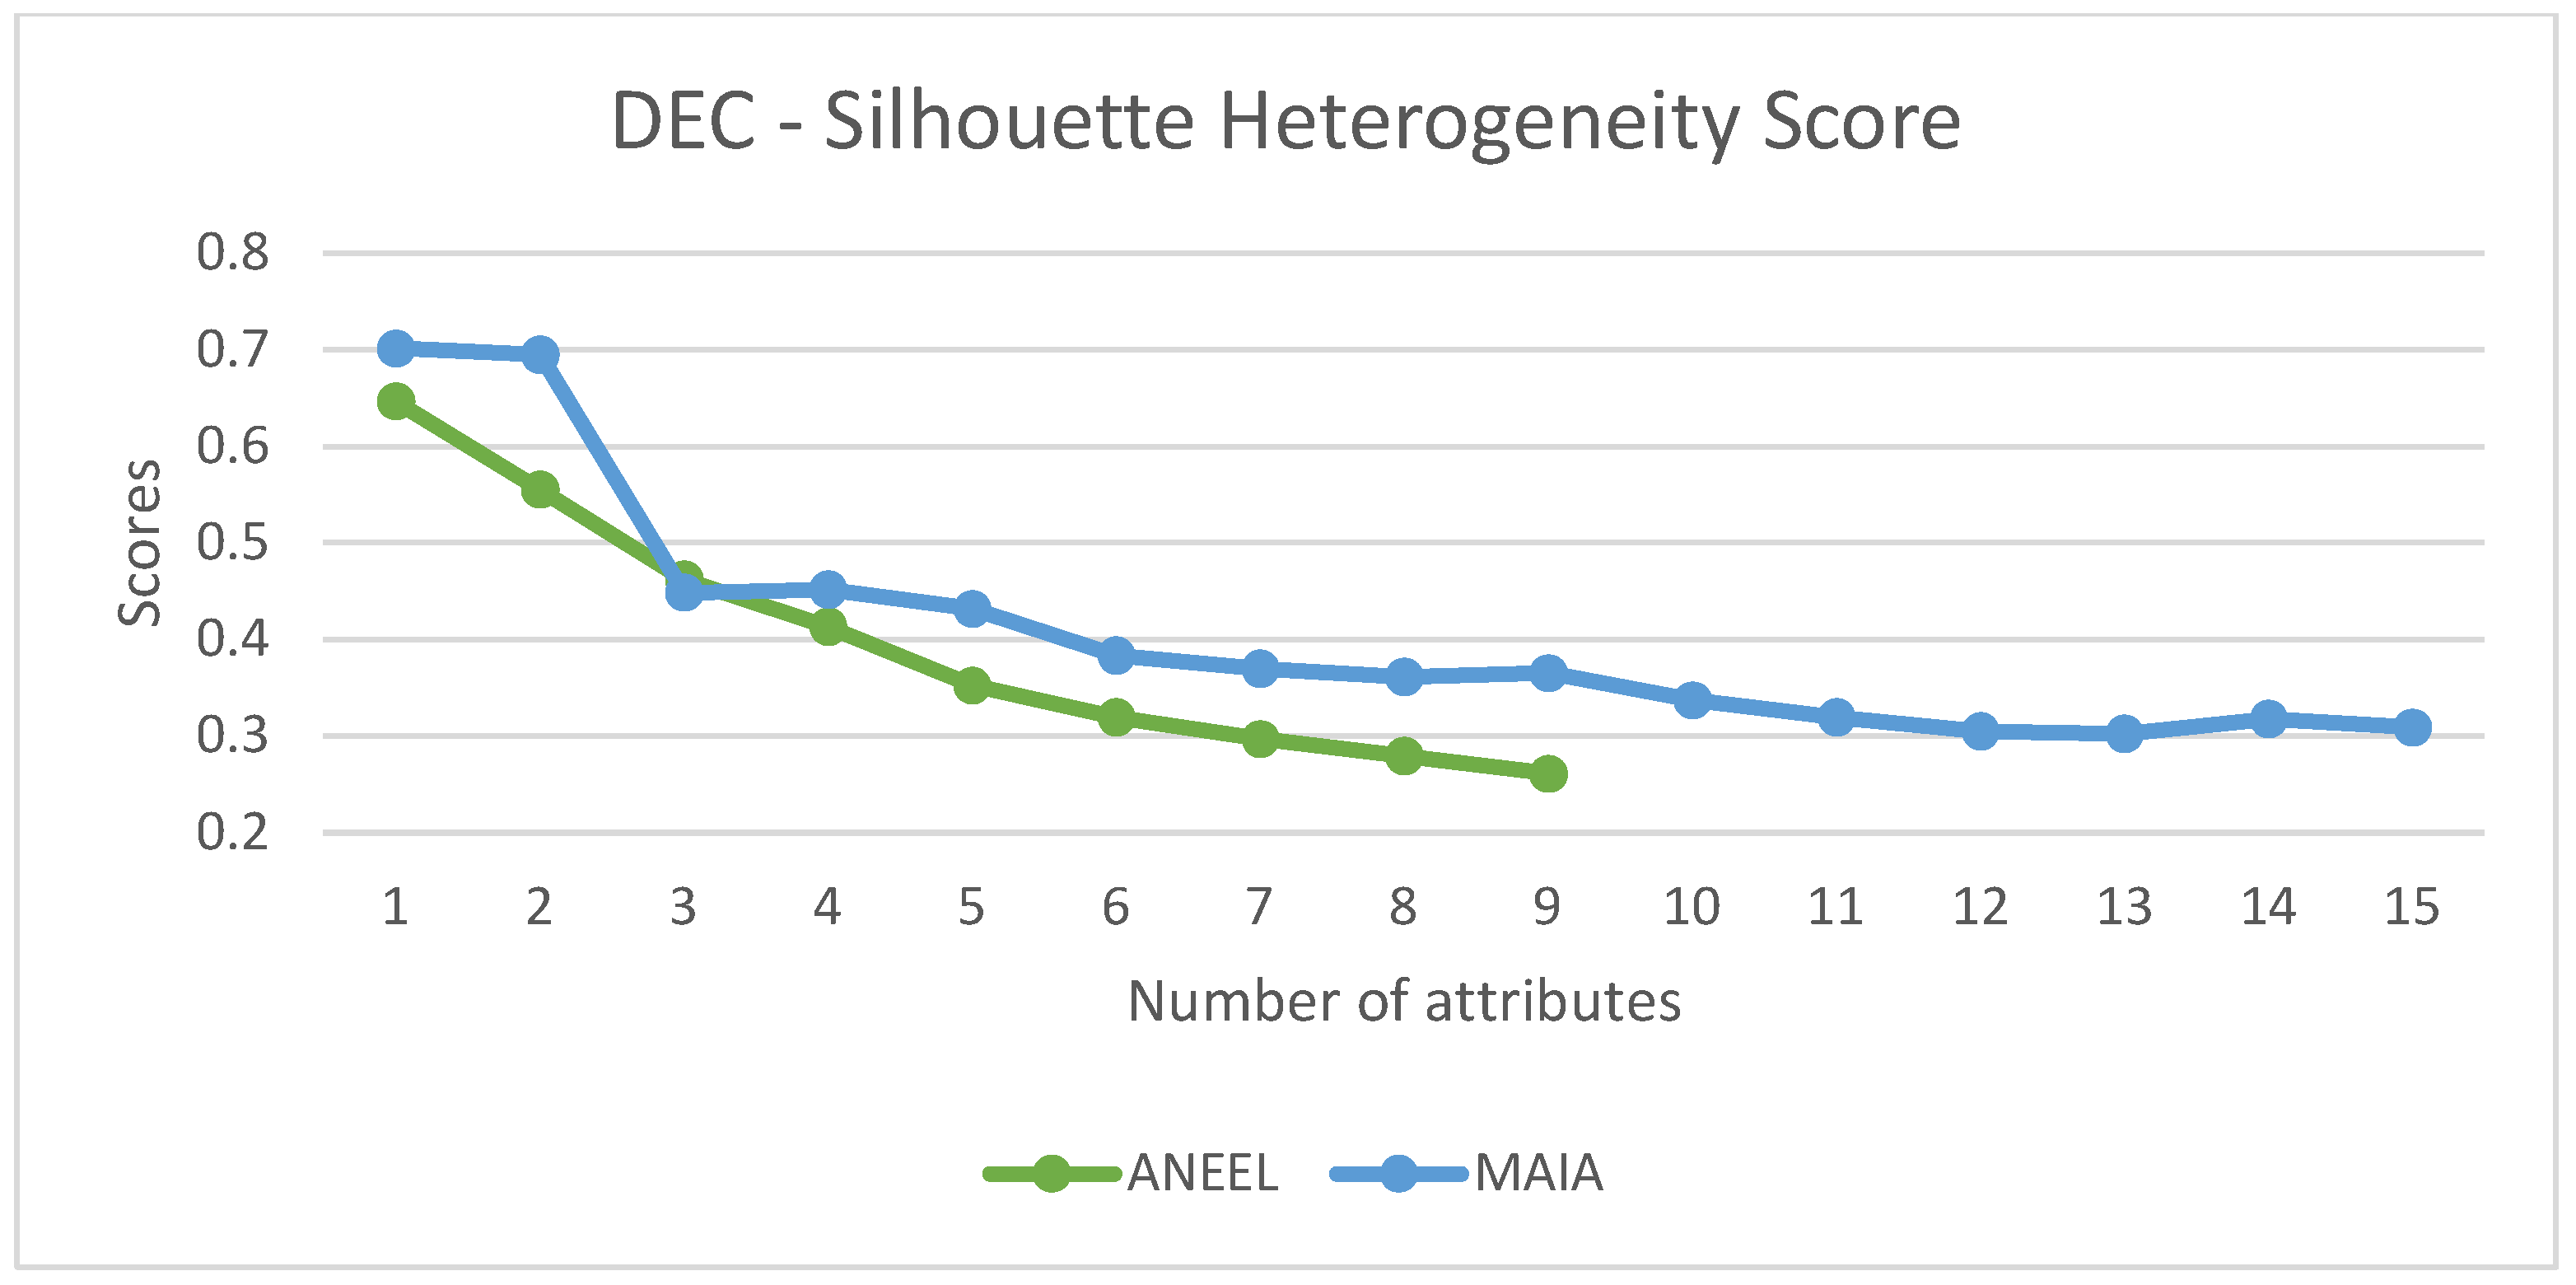
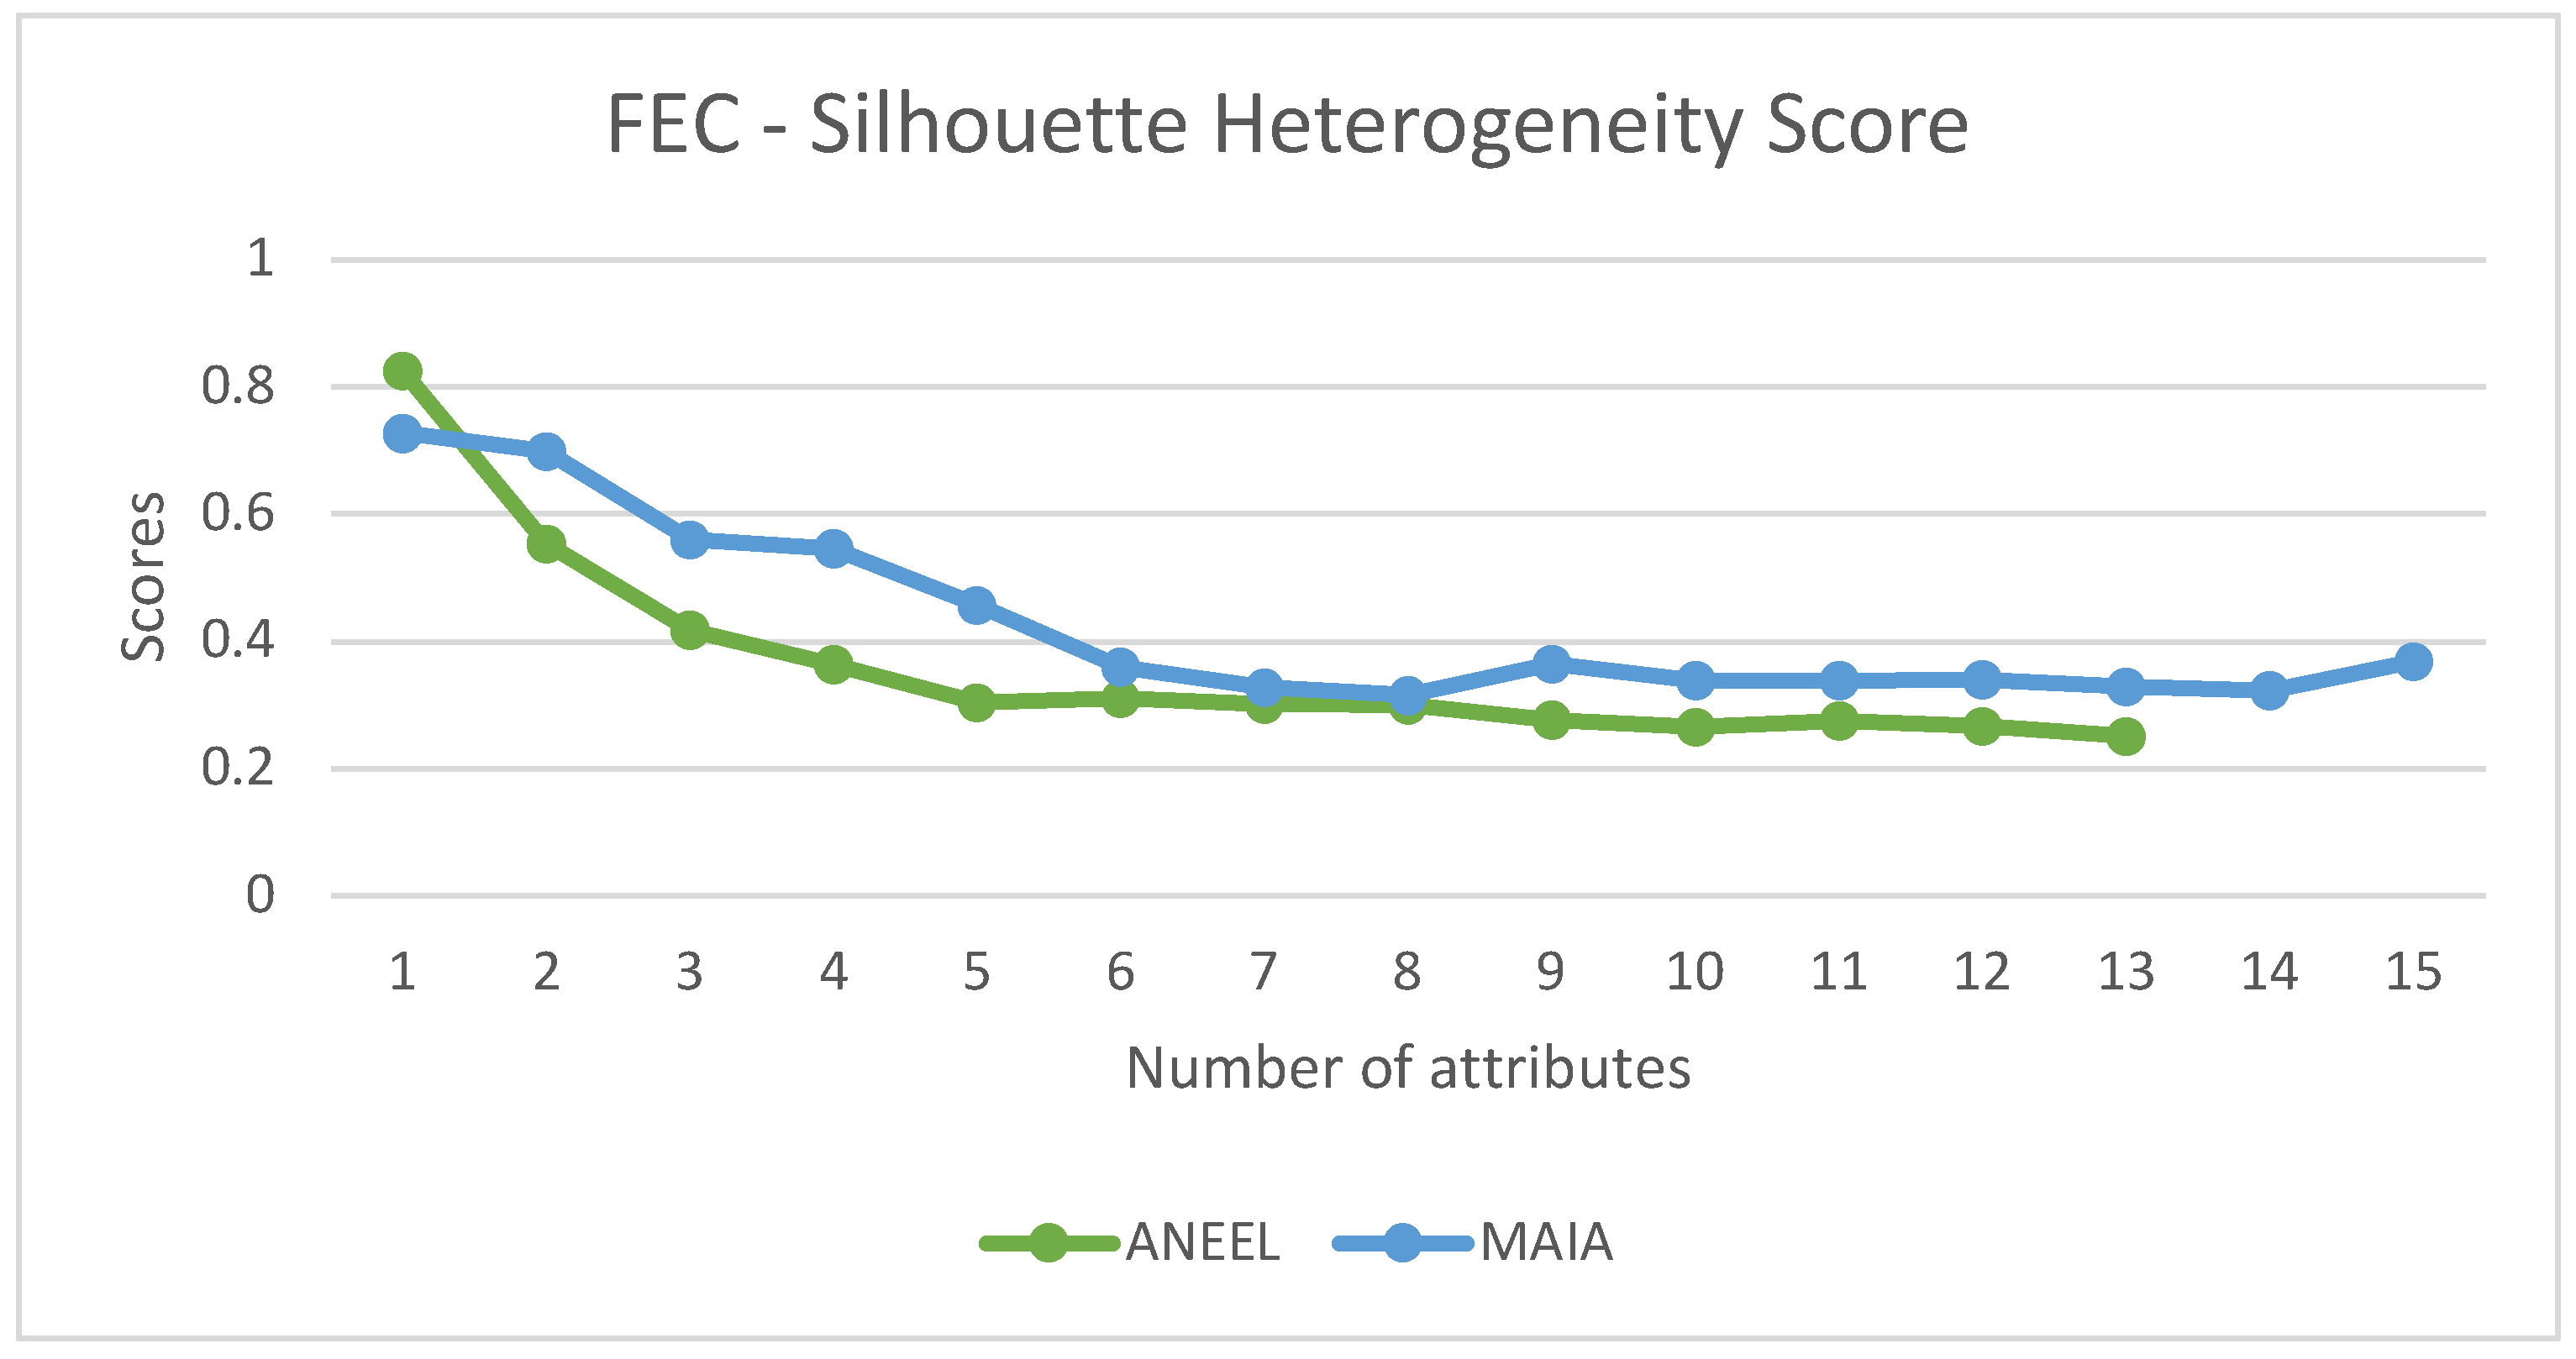
Similarly, the observed heterogeneity indices are compared for each scenario to determine the ideal number of attributes. Therefore, it becomes necessary to calculate the optimal number of clusters for the analysis at hand using the elbow method. The heterogeneity indices used as criteria for attribute selection in the proposed methodology are compared. It is important to note that the same heterogeneity index criterion was calculated for both the attributes found by MAIA and the attributes from the current ANEEL methodology.
It is observed that the heterogeneity indices calculated for ANEEL’s attributes are lower than those calculated for the attributes selected by the new methodology. In
Figure 5, the heterogeneity indices for the DEC indicator are presented, considering ANEEL’s attributes with different numbers of attributes chosen by the new methodology.
Figure 6 presents the heterogeneity scores for the FEC indicator for ANEEL’s attributes with different numbers of attributes chosen by the new methodology. It can be observed that ANEEL’s attributes without socioeconomic data perform better initially; however, from the fifth attribute onward, the proposed methodology demonstrates superior performance.
It is worth noting that the score for selecting the optimal number of attributes indicates choosing the smallest possible number of attributes. However, one should also consider the representativeness of the reduced datasets, as shown in
Figure 3 and
Figure 4. Thus, a suggestion is made to consider an optimal quantity of attributes restricted to the stabilization of the R
2 curve. This restriction would lead to choices of four and five attributes for the DEC and FEC datasets, respectively. It has been emphasized that for both quantities of attributes, the heterogeneity scores for MAIA are superior to the current ANEEL methodology.
5. Conclusions
This work presented an AI-assisted methodology capable of ranking and selecting the most relevant attributes for representing similar sets of consumers. This methodology employs replicable tools and methods with well-defined criteria, allowing for its application even when the set of attributes changes. This replicability is not a characteristic of the current ANEEL methodology, making it less transparent and less user-friendly.
The observed results confirm effective attribute ranking for both the DEC indicator and the FEC datasets, achieving representativeness performance superior to that observed with the ANEEL’s attributes. Furthermore, criteria for selecting the optimal quantity of attributes are presented, along with discussions on the representativeness of the reduced datasets with a small number of attributes and the heterogeneity score itself.
Thus, MAIA presents an appropriate and replicable approach, resulting in more cohesive clusters than the current methodology. In this regard, the developed methodology can be used to enhance the quality of service regulation, particularly in defining limits for DSOs’ continuity indicators, an essential regulatory mechanism.
In the Brazilian context, the limits for DEC and FEC indicators are determined based on the performance of similar sets of consumer units. Therefore, MAIA can be used for ranking and selecting the attributes that will form clusters of similar sets.
Lastly, the results can also be applied to other complex electrical systems, aiming to assess the attributes and characteristics that can influence specific quality indicators.
