Abstract
Ammonia is a promising carbon-free fuel. However, one of the main challenges for ammonia combustion is the high level of emissions. In this study, simulations were conducted for ammonia/air laminar counterflow flames and turbulent non-premixed jet flames in the KAUST high-pressure combustion duct (HPCD) at a pressure of 5 bar, with two ammonia cracking ratios of 14% and 28%. The influence of ammonia cracking ratio on the flame structure and formation mechanism were examined. The laminar counterflow flame results showed that is one of the most critical species related to formation and is mainly generated through the path of . For the turbulent flames, the flamelet/progress variable (FPV) approach was employed in the context of large eddy simulations (LES) for high-fidelity simulations. The simulation results were compared with the measured data with promising agreements, which proves the accuracy of the FPV method for the present flames. It was shown that with increasing cracking ratio, not only the flame reactivity is enhanced, but also the generation of is increased. The correlation between and is weaker when compared to that between and radicals such as , and in the entire flame. Through the distribution of source terms, it was found that the source term has a higher absolute value in the upstream region and the absolute value rapidly decreases with increasing streamwise distance. The total source term is positive in the fuel-lean zone and shows negative values in the fuel-rich zone.
1. Introduction
Ammonia has been widely applied in the global industrial chain. Its production and transportation infrastructures are relatively mature [1,2]. Most importantly, as a carbon-free fuel, ammonia does not produce in its chemical conversion process, greatly reducing greenhouse gas emissions [3]. However, ammonia combustion features a flame speed much lower than traditional hydrocarbon fuels or hydrogen, low calorific value [4] and large amounts of harmful nitrogen monoxide produced during combustion, which presents challenges for its industrial application [5].
Previous studies showed that using blend fuels such as / or / can increase flame speed and improve heat release rate [6,7] compared with pure ammonia, thereby extending the flame stability limits [8,9,10]. Khateeb et al. [11] showed that in a laboratory-scale swirl burner / mixtures could generate a larger stability range than pure methane and also reduce the tendency of flame flashback. Otomo et al. [12] found that adding to can increase flame temperature and improve flame speed. Frigo et al. [13] demonstrated that ammonia could directly burn in internal combustion engines, but required a combustion promoter; the best carbon-free promoter is hydrogen, with a very high combustion speed and a wide combustion range.
Obtaining a mixture of ammonia and hydrogen via on-board (in situ) cracking of ammonia is an ideal choice to avoid the risks and costs of storing and distributing hydrogen [14]. Mei et al. [15] conducted experimental and numerical simulations on partially cracked /air mixtures under high-pressure conditions. They found that as the ammonia cracking ratio increases, chemical and transport effects dominate the flame speed, whereas the thermal effect plays a minor role. The formation of with an increase in the cracking ratio exhibits non-monotonic behavior. Shohdy et al. [16] investigated how the cracking ratio of ammonia affects the overall flame speed, flammable limits and concentration in a swirling premixed combustor. Mercier et al. [17] explored the impact of ammonia cracking levels on the performance and emissions of a single-cylinder spark ignition engine, finding that a very low cracking ratio of ammonia (10%) can significantly expand the engine’s operating range. Kim et al. [18] employed a chemical reactor network to numerically study the emission characteristics of air-staged and fuel-staged combustion of partially cracked /air mixtures, revealing the impact of ammonia cracking ratio, residence time and staging strategy on emissions. It is clear that with partial ammonia cracking, there is a clear trade-off: high ammonia cracking ratios lead to high nitrogen oxide levels, while low ratios result in high unburned ammonia levels.
Recently, Tang et al. [19] at KAUST reported experimental results of ammonia/air non-premixed flames with different ammonia cracking ratios of 14% and 28%. Both laminar counterflow flames and turbulent jet flames were considered. The experiments provided detailed quantitative information about the temperature, mass fraction and mixture fraction of the flames. Later, Wang et al. [20] used the one-dimensional laser-induced fluorescence (-LIF) method combined with one-dimensional Raman spectroscopy to quantitatively obtain the mole fraction for these flames. The experimental configurations are featured by well-defined boundary conditions and the measurements of the species mass fractions, temperature and main pollutant mole fractions are comprehensive. Therefore, they are chosen as the target flames of the present work.
Abdelwahid et al. [21] proposed a PC-transport model based on principal component analysis (PCA) and deep neural networks (DNN) for simulating the above mentioned flames. The authors showed the potential of the proposed model for turbulent ammonia/air non-premixed combustion. On the other hand, the flamelet model represented by the flamelet/progress variable (FPV) method is based on the fast chemistry assumption. It is suggested that the thermochemical state in turbulent flames can be described by a few control variables [22]. The flamelet model has been widely used in large eddy simulations (LES) of turbulent premixed [23,24,25,26] and non-premixed [27,28,29] flames. However, it has been rarely used for the study of non-premixed /air flames with partial ammonia cracking.
In this context, the focus of the present work is on the flame structure and formation mechanism of turbulent ammonia/air non-premixed combustion with various ammonia cracking ratios, which was not covered by the study of Abdelwahid et al. [21]. The objectives are as follows. First, the relative importance of different formation pathways with various ammonia cracking ratios is examined in laminar counterflow flames. Second, the LES results of turbulent non-premixed jet flames using the FPV model are compared with experimental results, validating the accuracy of the numerical methods. The effects of the ammonia cracking ratio on the flame structure are studied. Finally, the mechanisms of formation under different ammonia cracking ratio conditions are explored.
2. Experimental and Numerical Setup
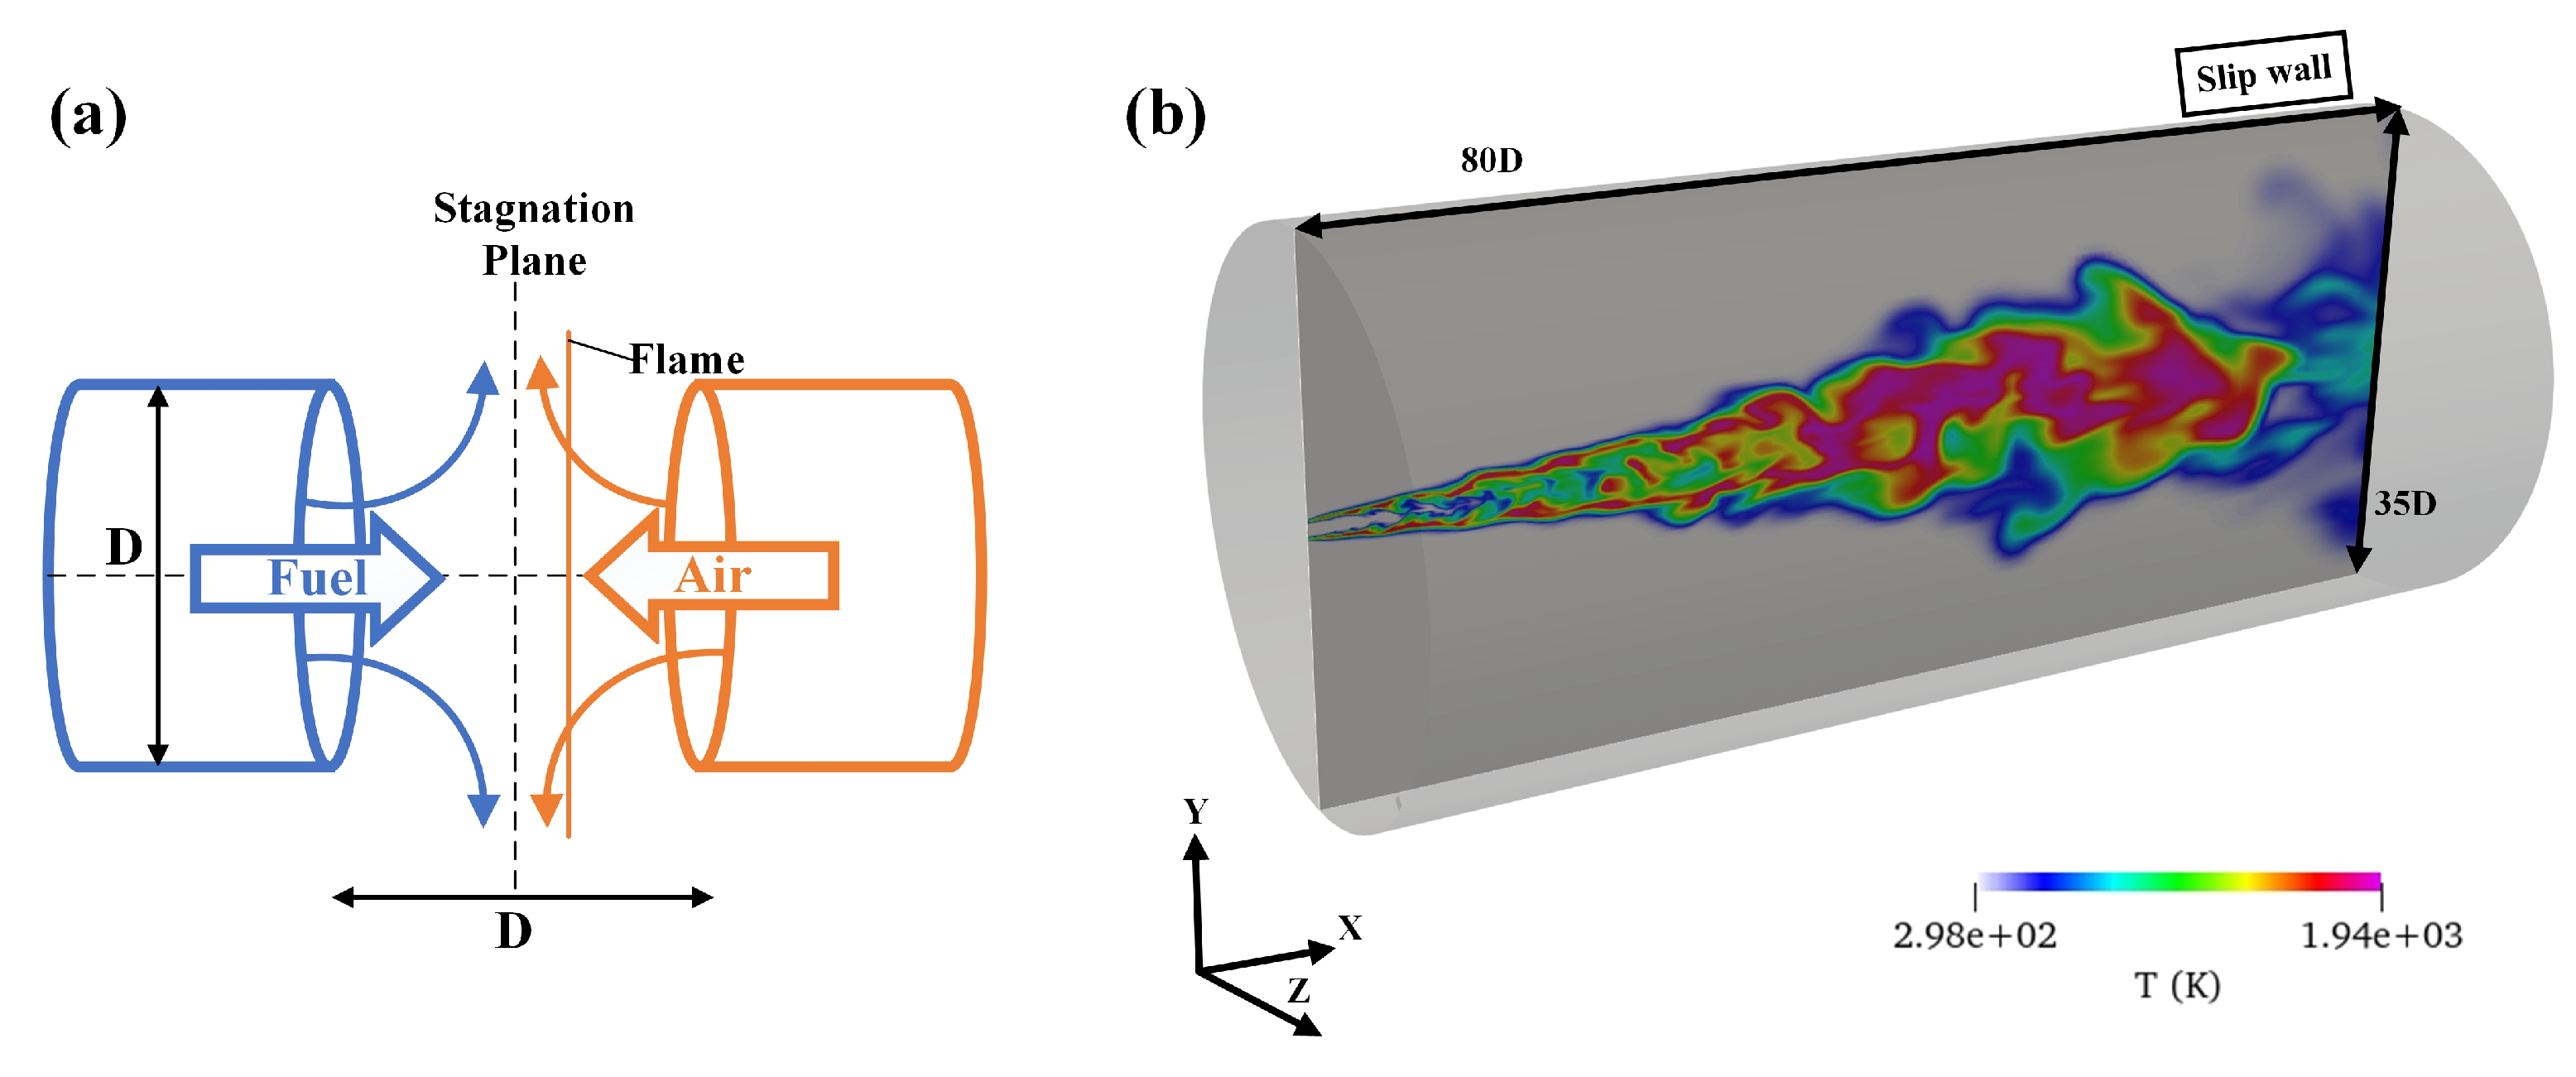
2.1. Experimental Details
In this work, the experimental configurations of laminar counterflow flames and turbulent non-premixed jet flames are considered. The experiments were conducted in the High-Pressure Combustion Duct (HPCD) at the KAUST Clean Combustion Research Center [30], with an operating pressure of 5 bar and inflow temperature of 294 K. The counterflow burner is horizontally installed inside the HPCD, composed of two identical nozzles with a diameter of 5 mm and a distance of 5 mm. Two cases with different ammonia cracking ratios were investigated. Specifically, the ammonia cracking ratio is 14% for CACF14, while it is 28% for CACF28. The fuel composed of an mixture is injected from one nozzle and the air from the other, with a strain rate of 130 1/s [31].
The turbulent jet burner consists of a 0.57-m-long stainless steel tube, supplying the fuel mixture , surrounded by an air co-flow nozzle with a diameter of 0.25 m, as shown in Figure 1. The inner and outer diameters of the central jet tube are 4.58 mm and 6.35 mm, respectively. Again, two cases with different ammonia cracking ratios of 14% and 28% are considered in the experiments, which are denoted as CAJF14 and CAJF28, respectively. The Reynolds numbers of the turbulent flames are Re = 11,200 for both cases based on the jet velocity and nozzle diameter. Detailed experimental parameters for various cases are provided in Table 1.
Figure 1.
Instantaneous temperature cloud map of CAJF28 (left) and schematic diagram of KAUST jet burner in HPCD (right) [19].
Table 1.
Operating condition parameters.
2.2. Computational Setup
Figure 2 shows a schematic of the configurations for the laminar counterflow flames and turbulent jet flames. For the laminar counterflow flames, the length of the computational domain is the same as the distance between the two nozzles. The domain is discretized using 150 grids. The information of the composition and velocity in the two streams is provided in Table 1. The strain rate is 130 1/s, which is consistent with the experiment [19]. As for the turbulent jet flames, the length of the computational domain is 80D, which is sufficient to avoid the influence of the outlet boundary on the region of interest, and the diameter is 35D. The simulation uses a high-quality structured hexahedral grid with 258,000 cells. The grid is refined in the streamwise and radial directions to achieve a high resolution in the reaction zone. To make the turbulence at the inlet more realistic, a fully developed circular tube flow is used to generate the turbulence at the inlet. A fixed reference pressure with a zero-gradient boundary condition is set at the outlet of the burner.
Figure 2.
Computational domain and boundary conditions of (a) counterflow flame and (b) jet flame.
The one-dimensional simulations of laminar counterflow flames are performed using ANSYS Chemkin-PRO [32], in which the OPPDIF model developed by Kee et al. [33] was used. This model is based on a similarity solution for the governing equations, simplifying two-dimensional or three-dimensional flows mathematically to one dimension. Unity Lewis number transport model is used for the one-dimensional calculations. In the laminar flames, a focus is on the distributions of main species mass fractions, temperature and NO mole fractions. Four different mechanisms of Mathieu [7], Otomo [12], Okafor [34] and Jiang [35] are employed for the simulations. The Mathieu mechanism consists of 55 species and 275 elementary reactions, and accurately predicts the ammonia ignition delay time and laminar flame propagating velocity, as validated in refs. [36,37]. The Otomo mechanism includes 32 species and 213 elementary reactions, which was developed based on the mechanism of Song et al. [38], and can also predict the laminar flame propagating velocity and ignition delay times of combustion very well [39]. The Okafor mechanism, featured by 59 species and 356 elementary reactions, is a reduced reaction mechanism developed for the combustion of flames optimized for laminar burning velocities [40]. It has been verified for both the pure /air flame and air flames [41]. The Jiang mechanism was derived from San Diego’s short nitrogen mechanism [42] and consists of 19 species and 60 elementary reactions, which effectively reduces time consumption in reactive flow simulations while still adhering to acceptable accuracy thresholds.
The three-dimensional large-eddy simulations are carried out using a solver called FPVFoam, which is developed based on the open-source code OpenFOAM [43]. The PIMPLE algorithm is adopted to solve the transport equations. The second-order backward scheme is used for the unsteady term and the second-order Gauss linear is used for diffusion and convective terms. The time step is set to 2 × s to keep the maximum Courant–Friedrich–Lewy (CFL) number less than 0.5 under all conditions. Only the Okafor mechanism is selected for the LES, which provides promising predictions for the turbulent flames. For both cases, the simulations ran for at least 20 flow-through times to reach a statistically steady state. The physical time for collecting statistical data exceeds 100 ms, equivalent to three flow-through times.
3. Numerical Methodology
3.1. Conservation Equations for LES
In the framework of large eddy simulation, the filtered equations of mass, momentum, mixture fraction, mixture fraction variance [44] and progress variable [45] are written as follows:
where and represent the density-weighted Favre filtering and spatial filtering for a variable , respectively. denotes the density, the velocity component in the ith direction, p the pressure, and dynamic viscosity. is the subgrid eddy viscosity, which is closed by the dynamic Smagorinsky model [46]. denotes the Kronecker delta function. The mixture fraction Z is calculated based on the Bilger’s method [47] as follows:
where Y and are the elemental mass fraction and atomic mass, respectively. The subscripts f and o represent fuel and oxidizer, respectively. is the turbulent Schmidt number. is the source term of the progress variable, which is extracted from the flamelet library. In the equations, the molecular diffusivity is calculated via the unity Lewis number assumption . represents the scalar dissipation rate. The filtered scalar dissipation rate is modeled according to the method in Ref. [48], which is composed of two parts, i.e., the resolved large-scale component and the unresolved sub-grid scale (SGS) component:
where represents the filter width and is a model constant.
3.2. Flamelet/Progress Variable (FPV) Model
In the FPV approach, a flamelet library is required [45]. In this work, the library is constructed using FlameMaster [49] by solving one-dimensional steady-state counterflow flames. In this approach, all the thermochemical variables (including temperature, species mass fractions, thermodynamic and transport properties) can be parameterized using two control variables, i.e., the mixture fraction Z and the progress variable . The thermochemical scalars can be extracted from the flamelet library as follows:
The progress variable is typically defined as the sum of the main species mass fractions of the products [50]. In this work, the progress variable is defined based on the mass fraction of . The normalized progress variable is calculated as follows:
where and are the local maximum and minimum of the progress variable, respectively, which can be extracted from the flamelet library. With the normalized progress variable C, the flamelet library solutions can be parameterized as follows:
In the FPV model, the interactions of turbulence and combustion are considered by combining the thermochemical quantities with the joint probability density function (PDF) [44]:
Here, the -PDF is employed for the progress variable C, while the -PDF is used for the mixture fraction Z. Therefore, all thermochemical scalars in the flamelet table, including fluid density, flame temperature and chemical species mass fractions, are represented in terms of , and :
In the flamelet table, the coordinates for mixture fraction, mixture fraction variance and progress variable are discretized using 251, 7 and 251 uniformly spaced grid points, respectively. In total, over 350 flamelets were computed to construct the table.
3.3. The NO Prediction Model
The flamelet model is based on the fast chemistry assumption, where chemical reactions occur at a sufficiently fast rate compared to the turbulent Kolmogorov time scale [51]. However, the reaction rate of is relatively slow, and in actual turbulent flames, the concentration of often deviates far from its equilibrium state within a short residence time. Previous studies have shown that directly calculating using lookup tables in the flamelet model can lead to very serious errors [52,53].
In order to overcome the inherent defects of inaccurate prediction of in traditional flamelet models and predict the in the ammonia/air combustion accurately, the approach of Ihme et al. [53] is used, in which an extra transport equation is solved for . Specifically, the forward and backward reaction rates are modeled with the reaction rates taken from the flamelet library, respectively. The backward reaction rates directly related to concentration are corrected by obtained in the flow field.
In the above equations, is the mass fraction of species obtained directly from the flamelet table. and are the filtered source terms of NO generation and consumption, respectively. To calculate the NO source term, all the reactions that involve NO are considered. The reactions involving NO in the Okafor mechanism are listed in Table 2.
Table 2.
The reactions involving in the Okafor mechanism.
4. Results and Discussions
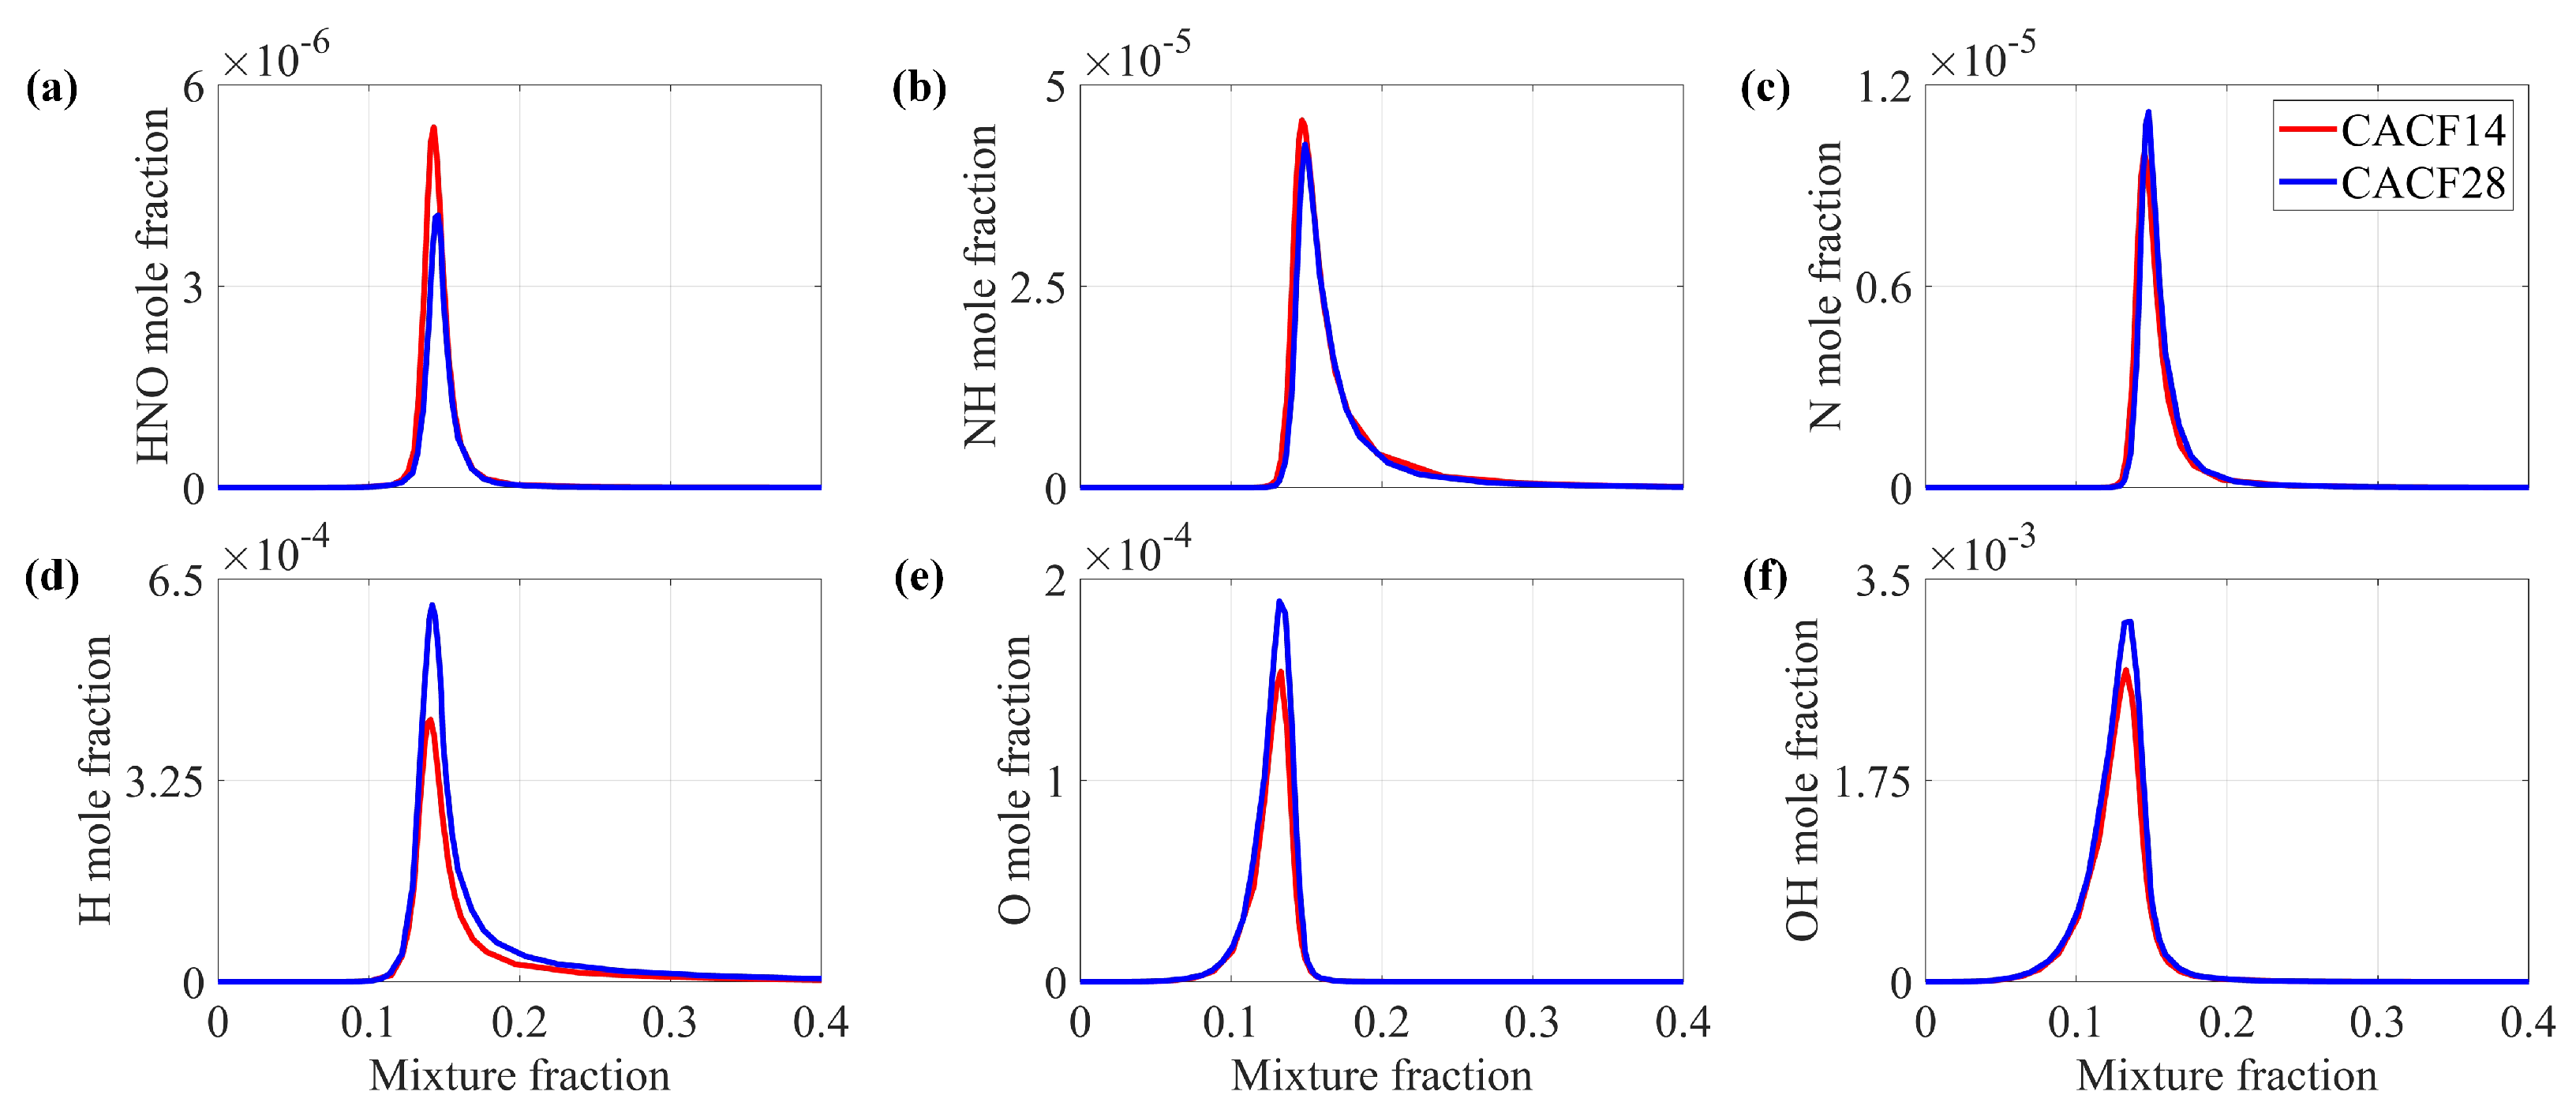
4.1. 1D Laminar Counterflow Flame Simulation
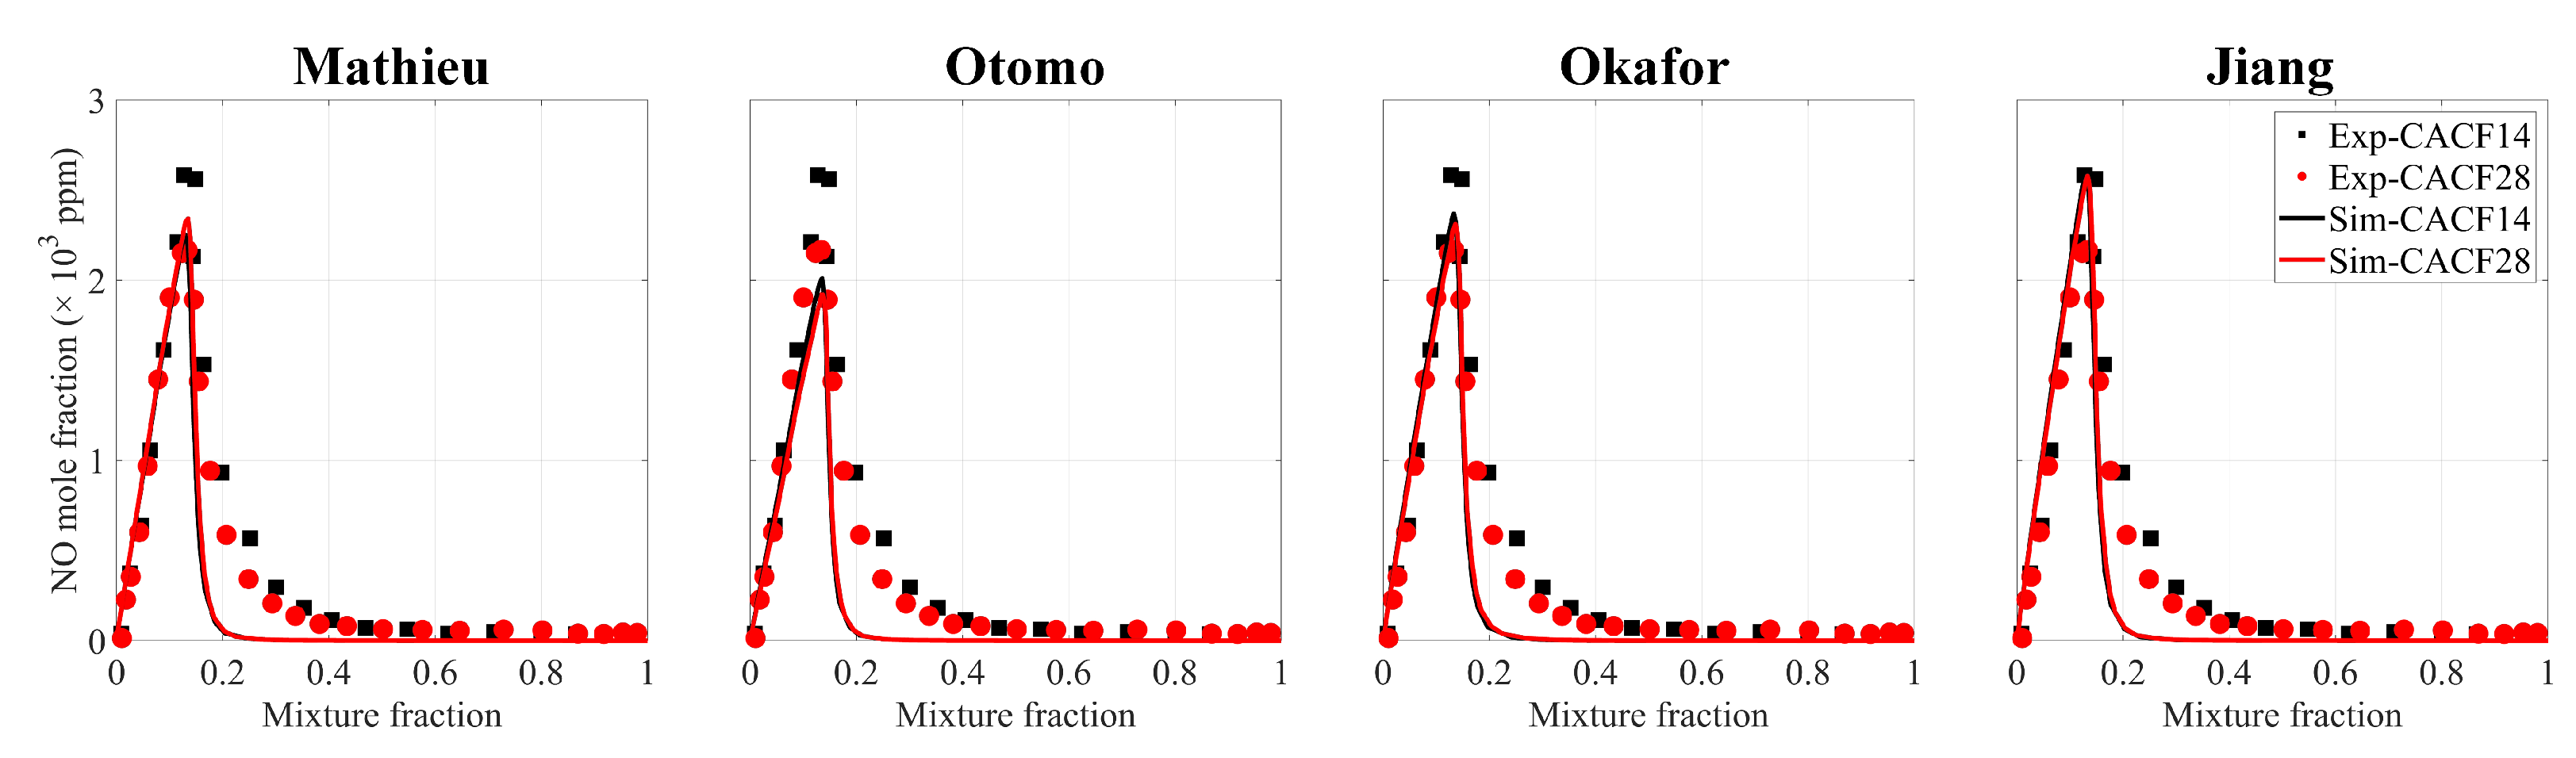
4.1.1. Mechanism Comparison
Figure 3 shows the profiles of major species mass fractions and temperature in the mixture fraction space. It can be seen that the predictions of the four mechanisms almost completely overlap. The simulation results for the species mass fractions and temperature match the experimental results quite well. Some minor discrepancies are observed in the fuel-rich region for the mass fraction. This can be attributed to the high mass fraction of at the positions with large mixture fractions, leading to a pronounced preferential diffusion effect.
Figure 3.
Measured mass fractions of major species and temperature [19] (symbols) as a function of mixture fraction in CACF14 and CACF28. The solid line is the simulation results using different chemical mechanisms.
Figure 4 shows the profiles of mole fractions in the mixture fraction space. The predictions generally agree with the experimental results, especially in the fuel-lean side. In the fuel-rich side, the NO mole fraction is under-predicted for all mechanisms. The experimental results show that the peak mole fraction of CACF14 is larger than that of CACF28, so that the Mathieu and Jiang mechanisms, where the peak mole fraction of CACF14 is less than that of CACF28, are excluded for further study. The Okafor mechanism has a peak mole fraction closer to the experimental measurement value under the current unity Lewis number assumption. Therefore, the Okafor mechanism is chosen for subsequent study.
Figure 4.
Measured mole fractions of [20] (symbols) in mixture fraction space of CACF14/28. The solid line is the simulation results using different chemical mechanisms.
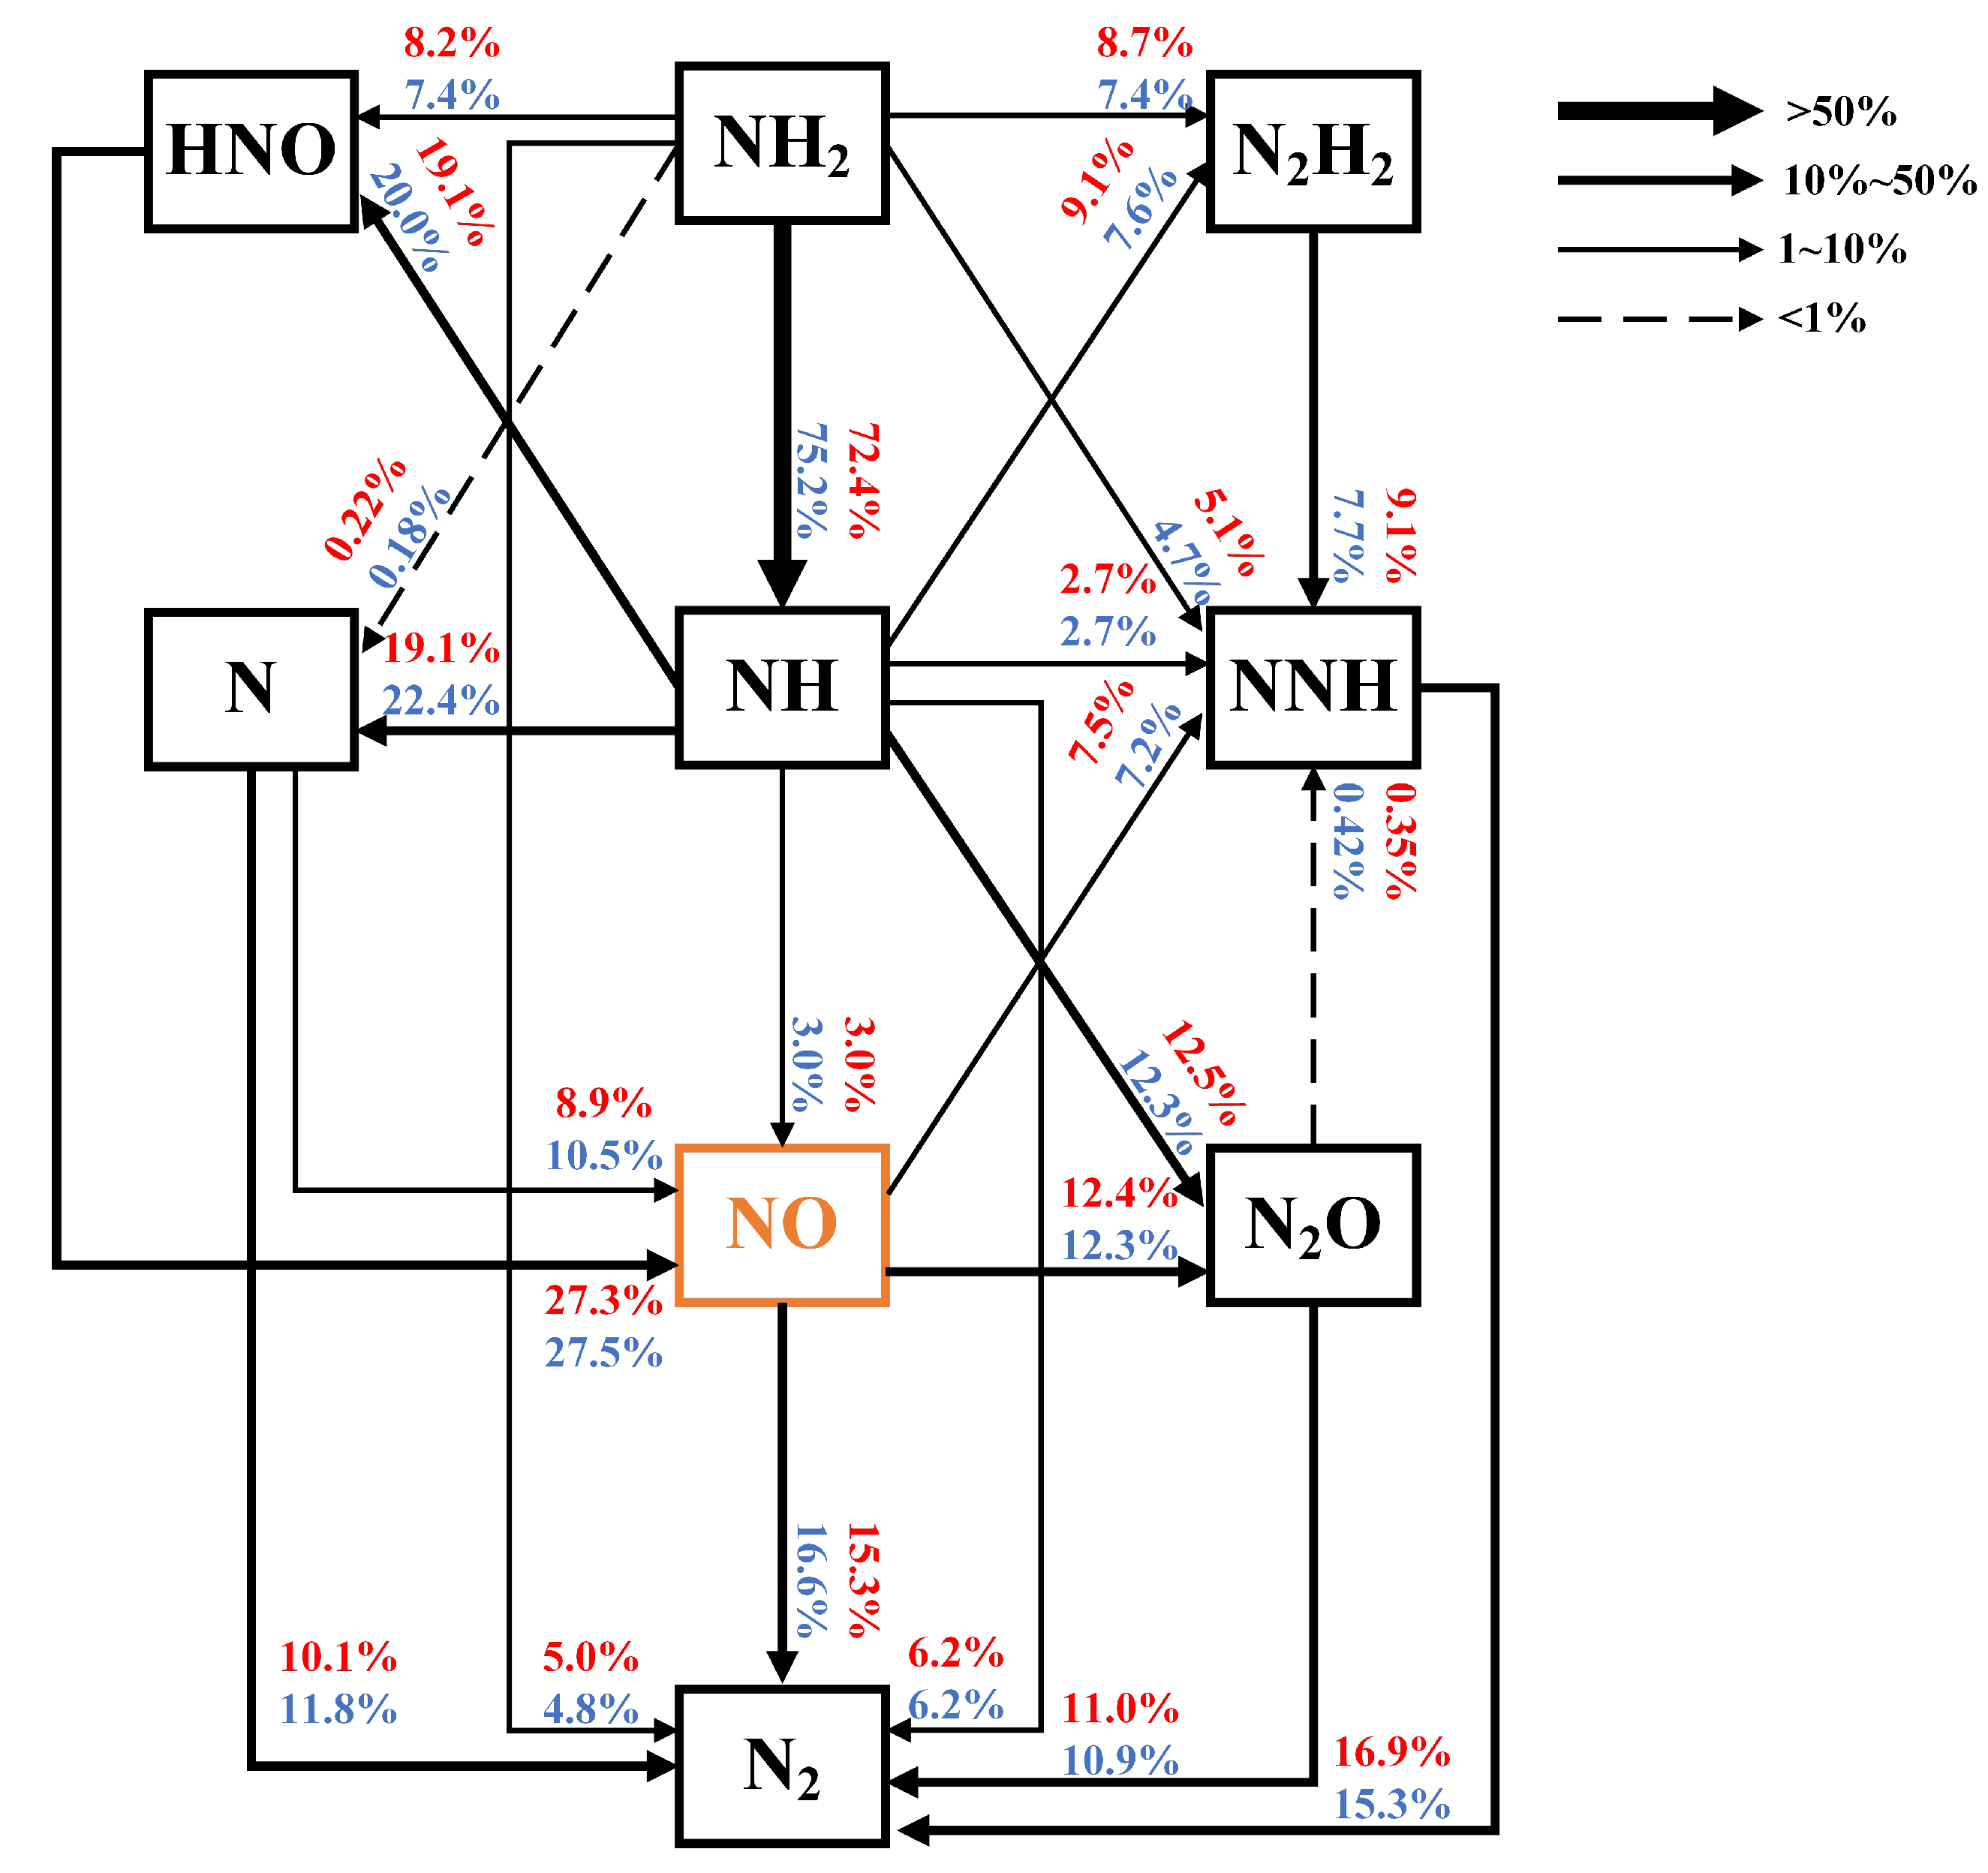
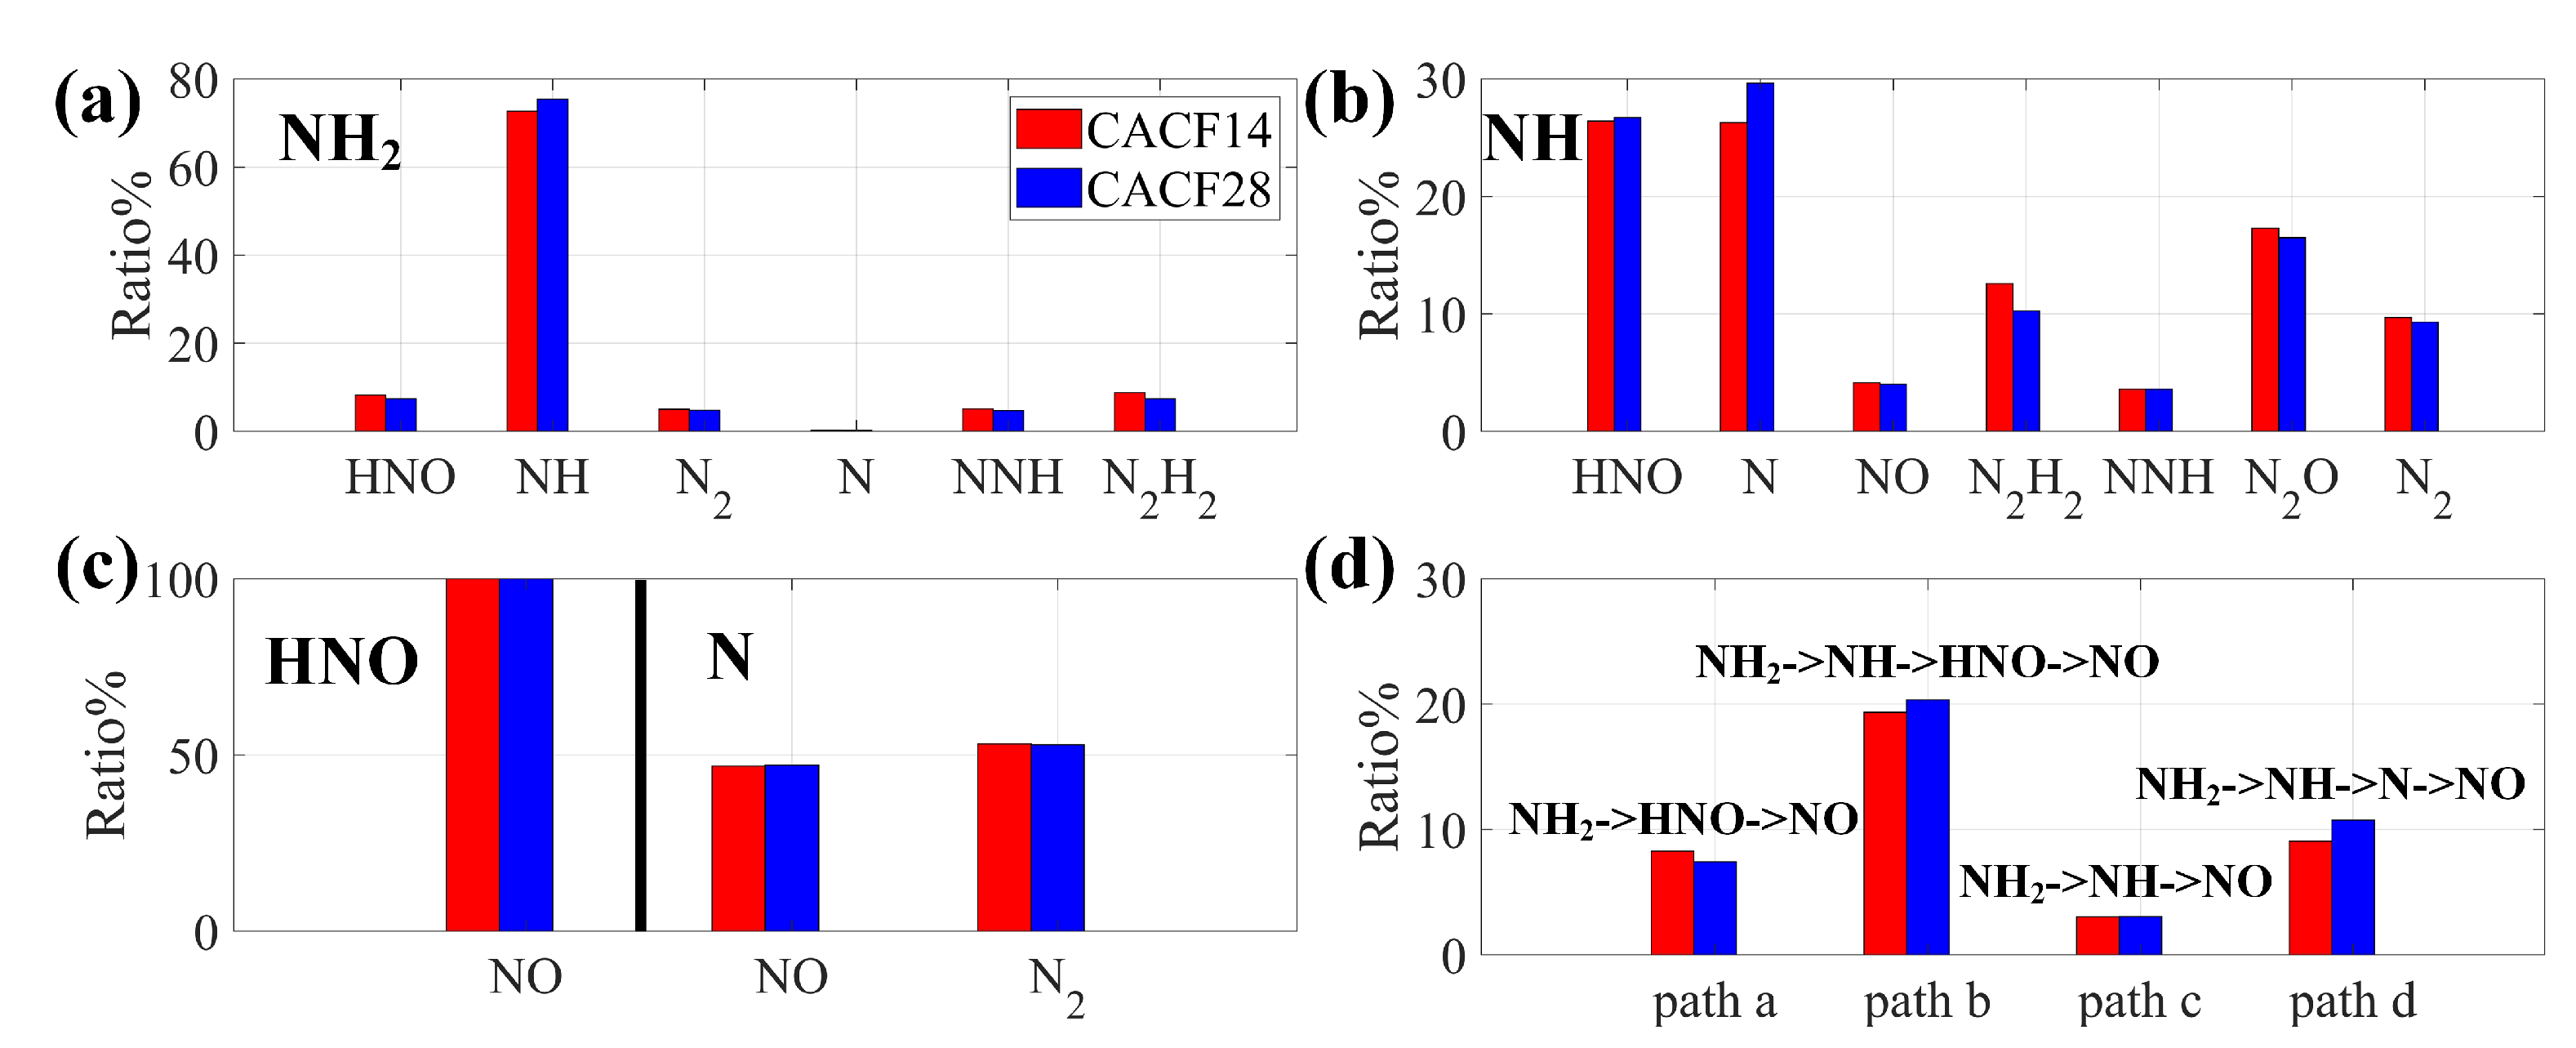
4.1.2. Reaction Path Analysis
In order to explore the impact of ammonia cracking ratio on the formation of nitrogen-containing species, especially formation, this section performs nitrogen flow analysis, which is implemented by integrating the reactions across the entire field to calculate the nitrogen flow fraction between relevant species [54]. The nitrogen flow between species A and B is calculated by summing the average integrated reaction rates of all elementary reactions that contribute to A → B. Under the current conditions, almost 100% of is converted to ; thus, the nitrogen flow is normalized using the sum of the average integrated reaction rates of all elementary reactions that contribute to .
Figure 5 presents the nitrogen flow diagrams of major paths for CACF14 and CACF28. It is worth noting that, for simplicity, the reaction paths in Figure 5 are not complete. As can be seen, the species directly related to formation are , and . Among them, the species that contributes the most to generation is . The second most important species is , while contributes the least to generation. As the cracking ratio increases, the amount of generated through increases, but the amount of generated through species and remains basically unchanged. It can also be seen that is mainly generated through the following four paths: , , and . On the other hand, the products of consumption are , and . As the cracking ratio increases, the amount of directly converted to increases, but the conversion to and remains basically unchanged. is mainly consumed through , , and .
Figure 5.
Nitrogen flow diagrams for CACF14/CACF28. The thickness of the arrows represents the relative size of the flow. The numbers on the arrows indicate the relative conversion rate, with CACF14 in red and CACF28 in blue.
In order to study the influence of the ammonia cracking ratio on the conversion of nitrogen-containing species and the relative magnitudes of the pathways, a quantitative analysis is conducted in terms of the conversion rate, which is defined as the ratio of the net outflow of nitrogen from species A to species B to the total net outflow of nitrogen from species A. Figure 6a–c present the conversion rates of , , and for various flames.
Figure 6.
(a) The ratios of converted to nitrogen-containing species in CACF14 (red) and CACF28 (blue); (b) ratios of converted to nitrogen-containing species; (c) ratios of and converted to nitrogen-containing species; (d) conversion rates of generated from via four pathways: a–d.
Figure 6a shows that most is directly converted to , and the ratio of this conversion increases with the increasing cracking ratio. According to Figure 6b, is mostly converted to and . As the cracking ratio increases, the conversion ratio of to these two species increases, with the conversion to being more significant. Figure 6c shows that is entirely converted to , while is mostly converted to and .
The relative importance of pathways is quantitatively assessed, as shown in Figure 6d. It is obvious that the most important pathway for generation is path b, followed by path d. As the ammonia cracking ratio increases, the generation of through paths b and d increases, while that through path a decreases. For path c, the change in the cracking ratio does not lead to significant change in NO formation.
Figure 7 shows the profiles of mole fractions for various radicals in the mixture fraction space. It is seen that the concentrations of and in CACF28 are lower than those in CACF14, which is due to the higher hydrogen concentration and lower concentration related to the higher cracking ratio in CACF28, which further leads to a lower concentration of [20]. According to Figure 5, is an important radical for generation [55]. Therefore, the mole fraction of in CACF28 is lower than that in CACF14, as shown in Figure 4. In addition, it can be seen that the concentrations of radicals such as , and in CACF28 are higher than those in CACF14, which is attributed to the higher concentration associated with the larger cracking ratio, so the reactivity of CACF28 is stronger than that of CACF14.
Figure 7.
The mole fraction results of radicals (a) , (b) , (c) , (d) , (e) and (f) in the mixture fraction space in CACF14 (red) and CACF28 (blue).
4.2. 3D Turbulent Jet Flame Simulation
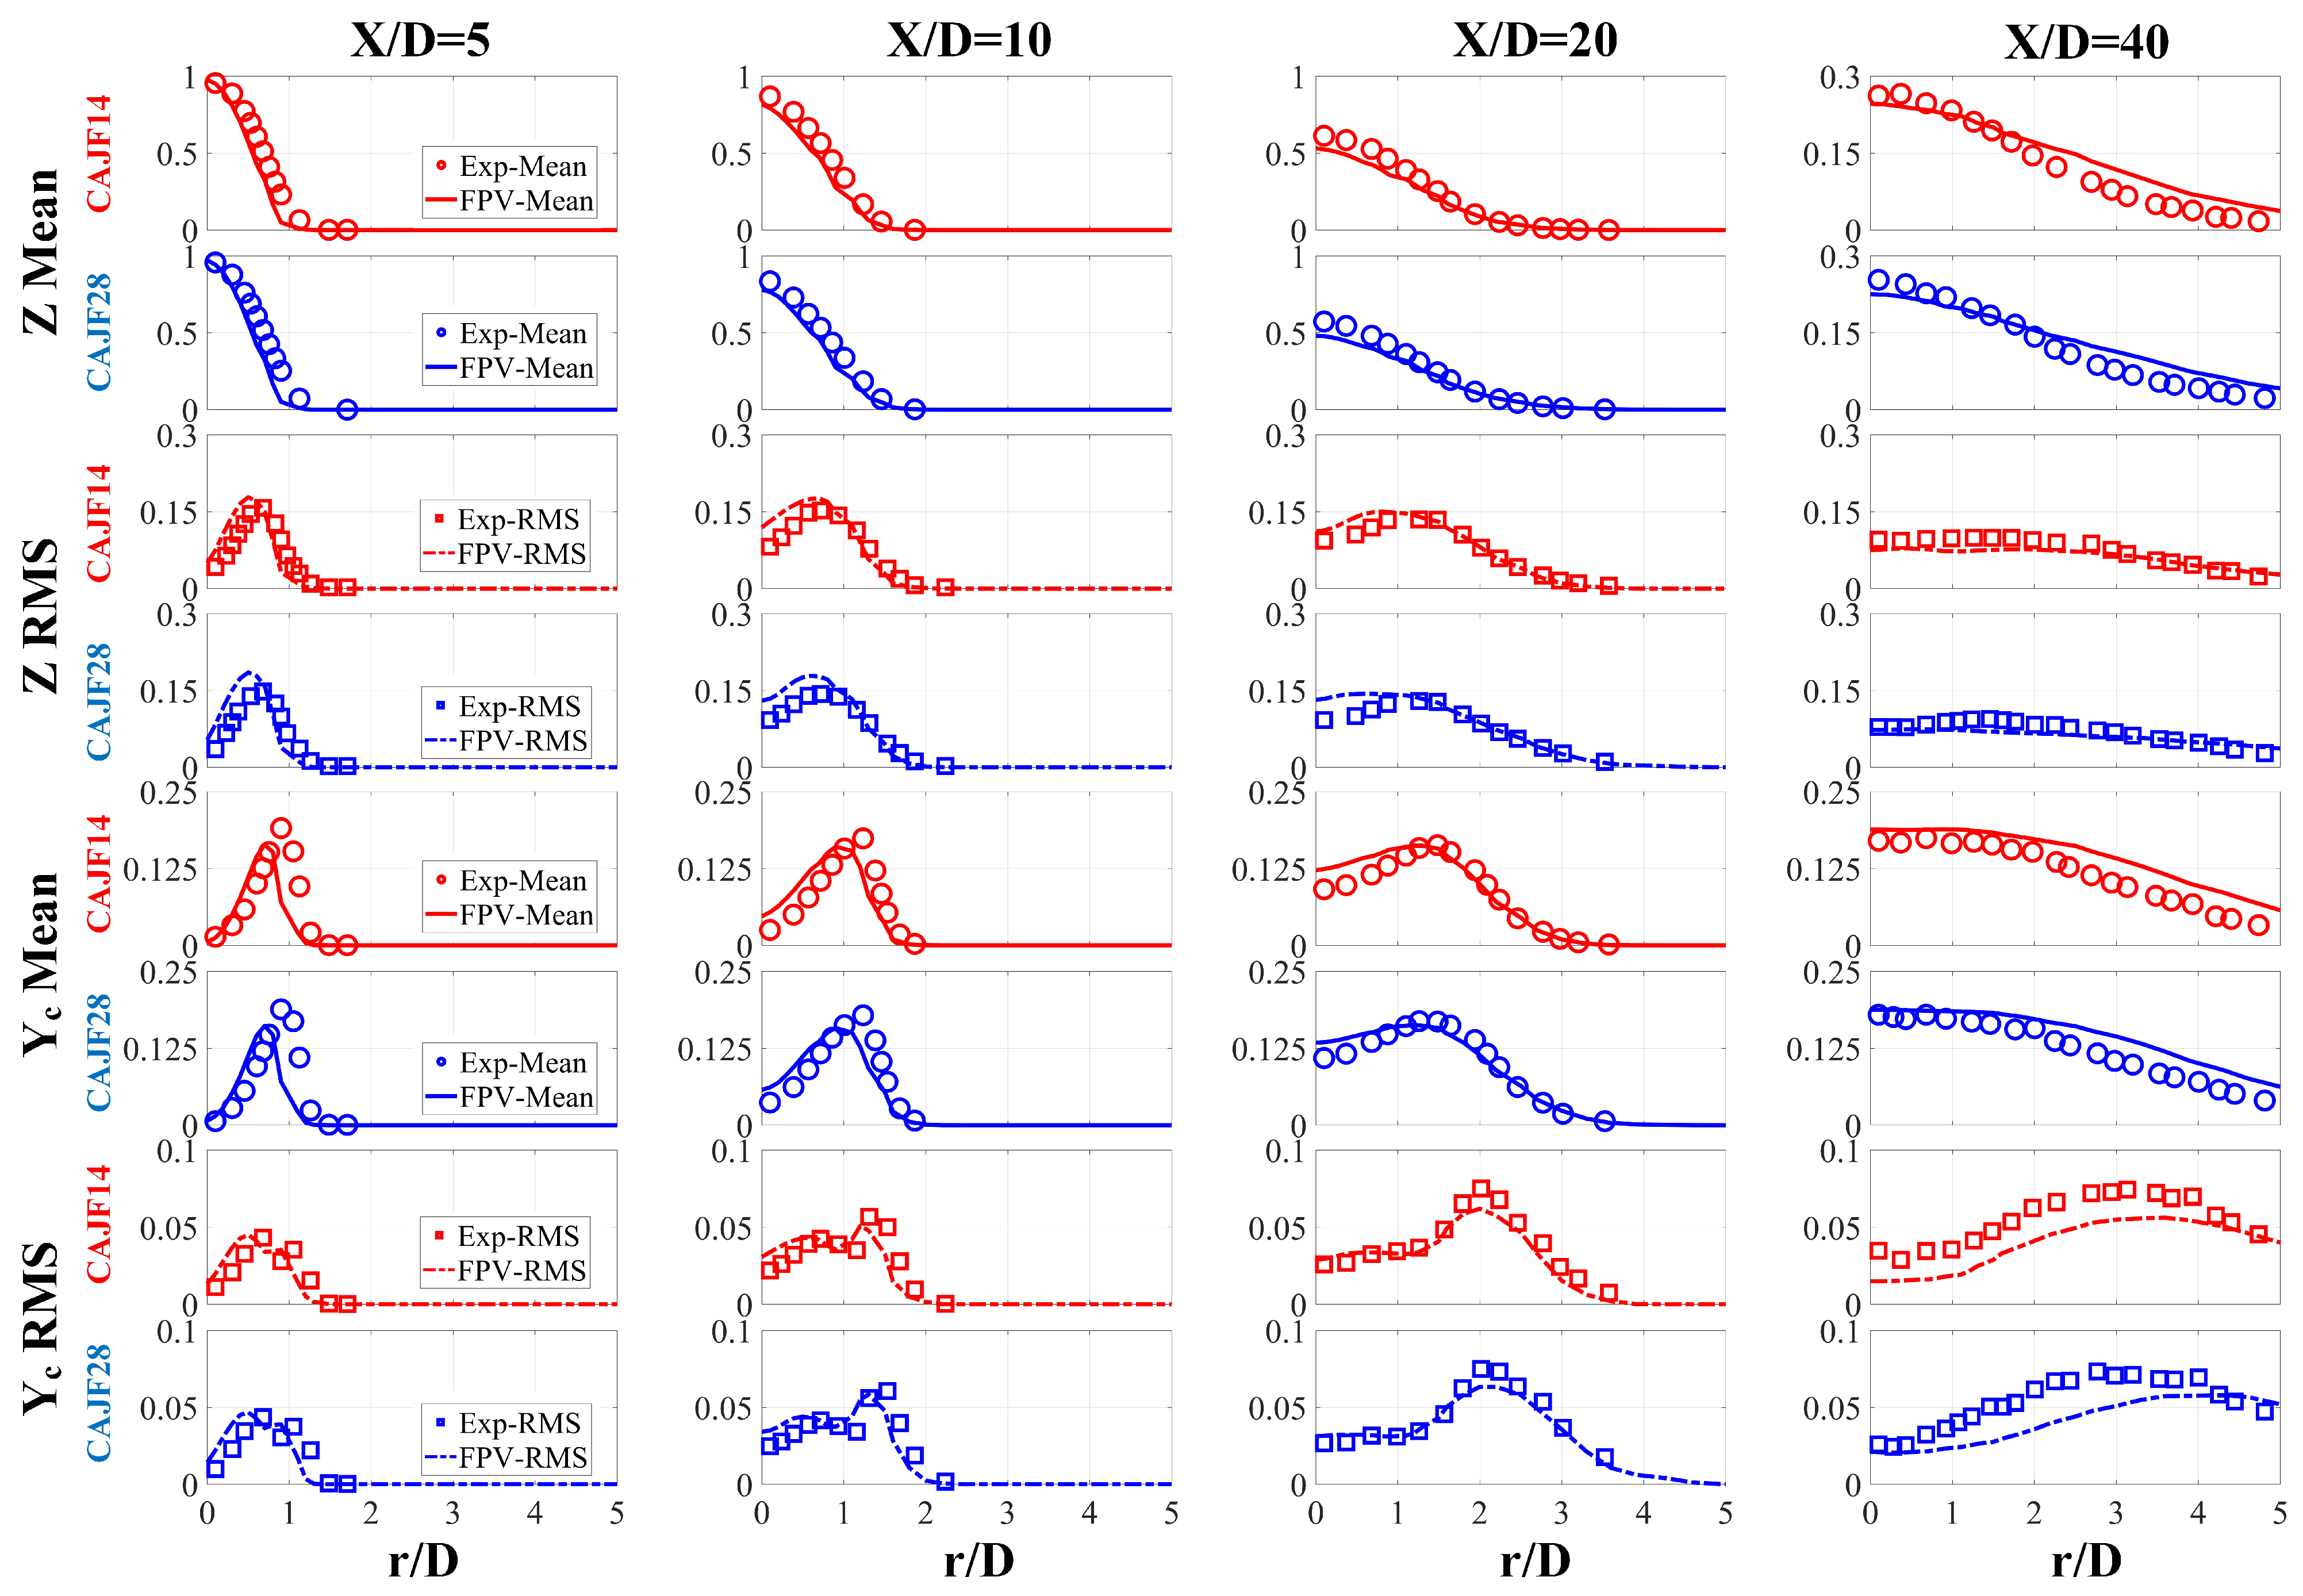
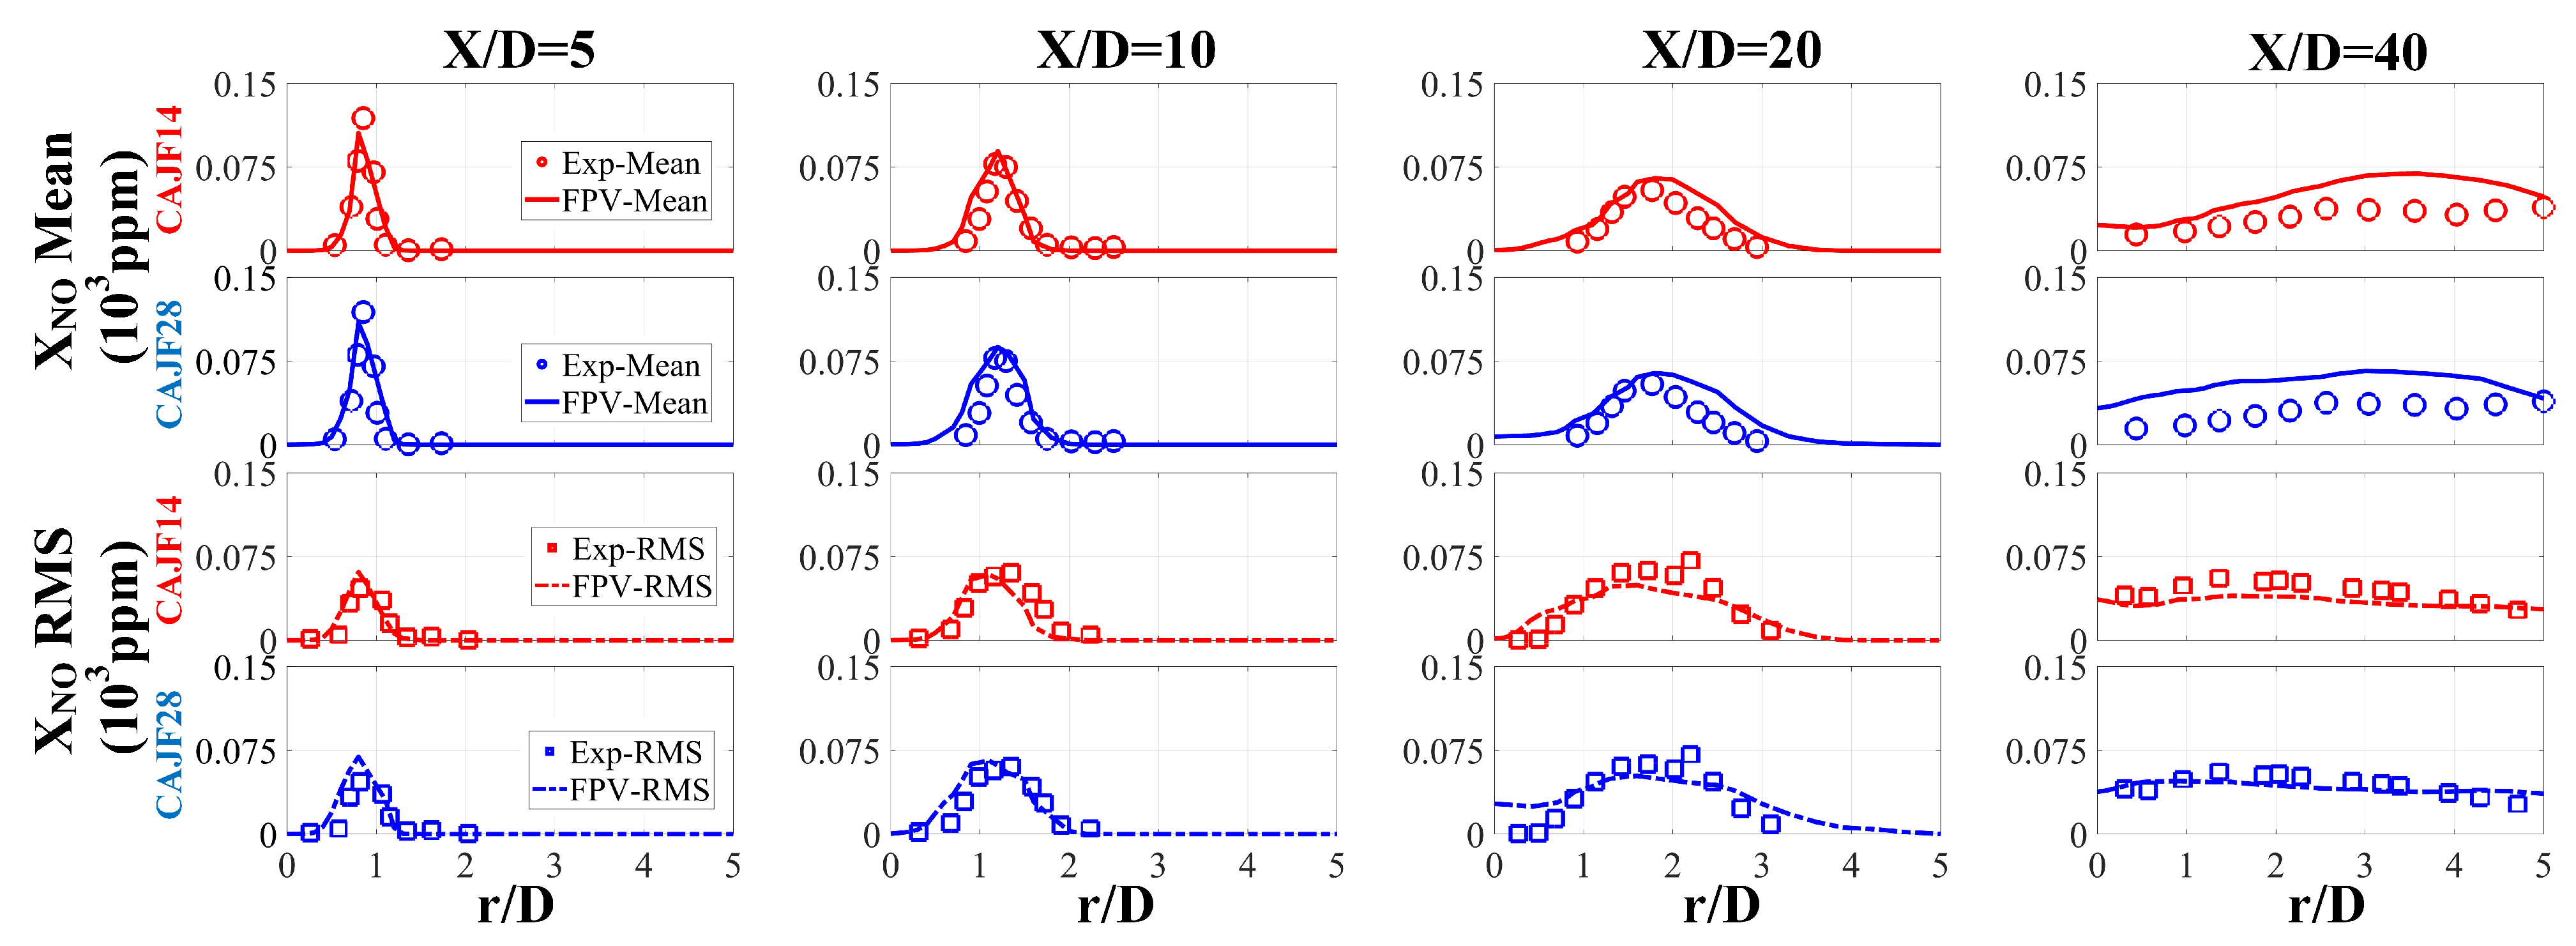
4.2.1. Simulation Verification
In this section, the LES results of the two turbulent flames, i.e., CAJF14 and CAJF28, are compared with the experimental results. Figure 8 shows mean and root-mean-square (RMS) values of the mixture fraction Z and progress variable at various streamwise locations. For the mean values, it can be observed that the simulation results demonstrate a favorable agreement with the measured data across the entire domain. However, the mean of is under-predicted near the peaks in the upstream region , which is more pronounced in the CAJF28 flame with a higher cracking ratio. This is attributed to the more prominent differential diffusion effects near the nozzle region [19,21]. It is evident that at the streamwise locations , turbulent diffusion overtakes molecular diffusion, leading to a good performance of simulations. For the RMS values of the mixture fraction, the peaks initially experience a slight increase along the streamwise direction and subsequently decrease as the flame progresses. It can be observed that for the progress variable, two RMS peaks are observed, corresponding to the lean and rich sides, as shown in the experiments. The RMS peak in the rich side becomes less pronounced with increasing streamwise distance, attributed to the more uniform distribution of jet temperature and composition due to combustion product entrainment. The RMS peak in the lean side gradually increases with the streamwise location.
Figure 8.
Radial distribution of time-averaged (circle points, solid lines) and RMS values (square points, dashed lines) of mixture fraction, progress variable at different streamwise locations ( = 5, 10, 20, 40) for CAJF14 (red) and CAJF28 (blue), as measured in experiments [19] (points) and computed with FPV (lines).
Figure 9 presents the mean and RMS profiles of , and the temperature T. In terms of the mean values, similar to the mixture fraction, the measured and predicted values of and exhibit a good match throughout the entire field. This indicates the satisfactory performance of the unit Lewis number transport model under the current operating conditions. The profile of temperature T resembles that of the progress variable. Both flames exhibit varying degrees of under-prediction for temperature in the upstream region , with this effect being more pronounced for CAJF28. Regarding the RMS values, the profiles of and show a single peak, similar to the mixture fraction Z. The peak value increases first with the streamwise position and then decreases. The temperature T profile exhibits a double-peak distribution in the upstream, similar to that of the progress variable.
Figure 9.
Radial distribution of time-averaged (circle points, solid lines) and RMS values (square points, dashed lines) of , and temperature T at different streamwise locations () for CAJF14 (red) and CAJF28 (blue), as measured in experiments [19] (points) and computed with FPV (lines).
Figure 10 shows the mean and RMS profile of . Notably, for the mole fraction of , the numerical method of the present wrok also produces satisfactory results, affirming the accuracy of the employed model. Nevertheless, in the downstream region at , both cases display varying degrees of over-prediction in the mole fraction. The peak mole fraction of appears at . With increasing streamwise distance due to the expansion of the jet, the radial position of the peak mole fraction gradually increases. Meanwhile, the peak mole fraction of decreases along the streamwise direction. The RMS values of also agree well with the experiment results.
Figure 10.
Radial distribution of time-averaged (circle points, solid lines) and RMS values (square points, dashed lines) of at different streamwise locations () for CAJF14 (red) and CAJF28 (blue), as measured in experiments [20] (points) and computed with FPV (lines).
In summary, both the mean and RMS values of the simulations successfully capture the characteristics of the experimental flame [19]. This confirms the rationality of the numerical methods and boundary conditions, providing a solid foundation for subsequent analyses.
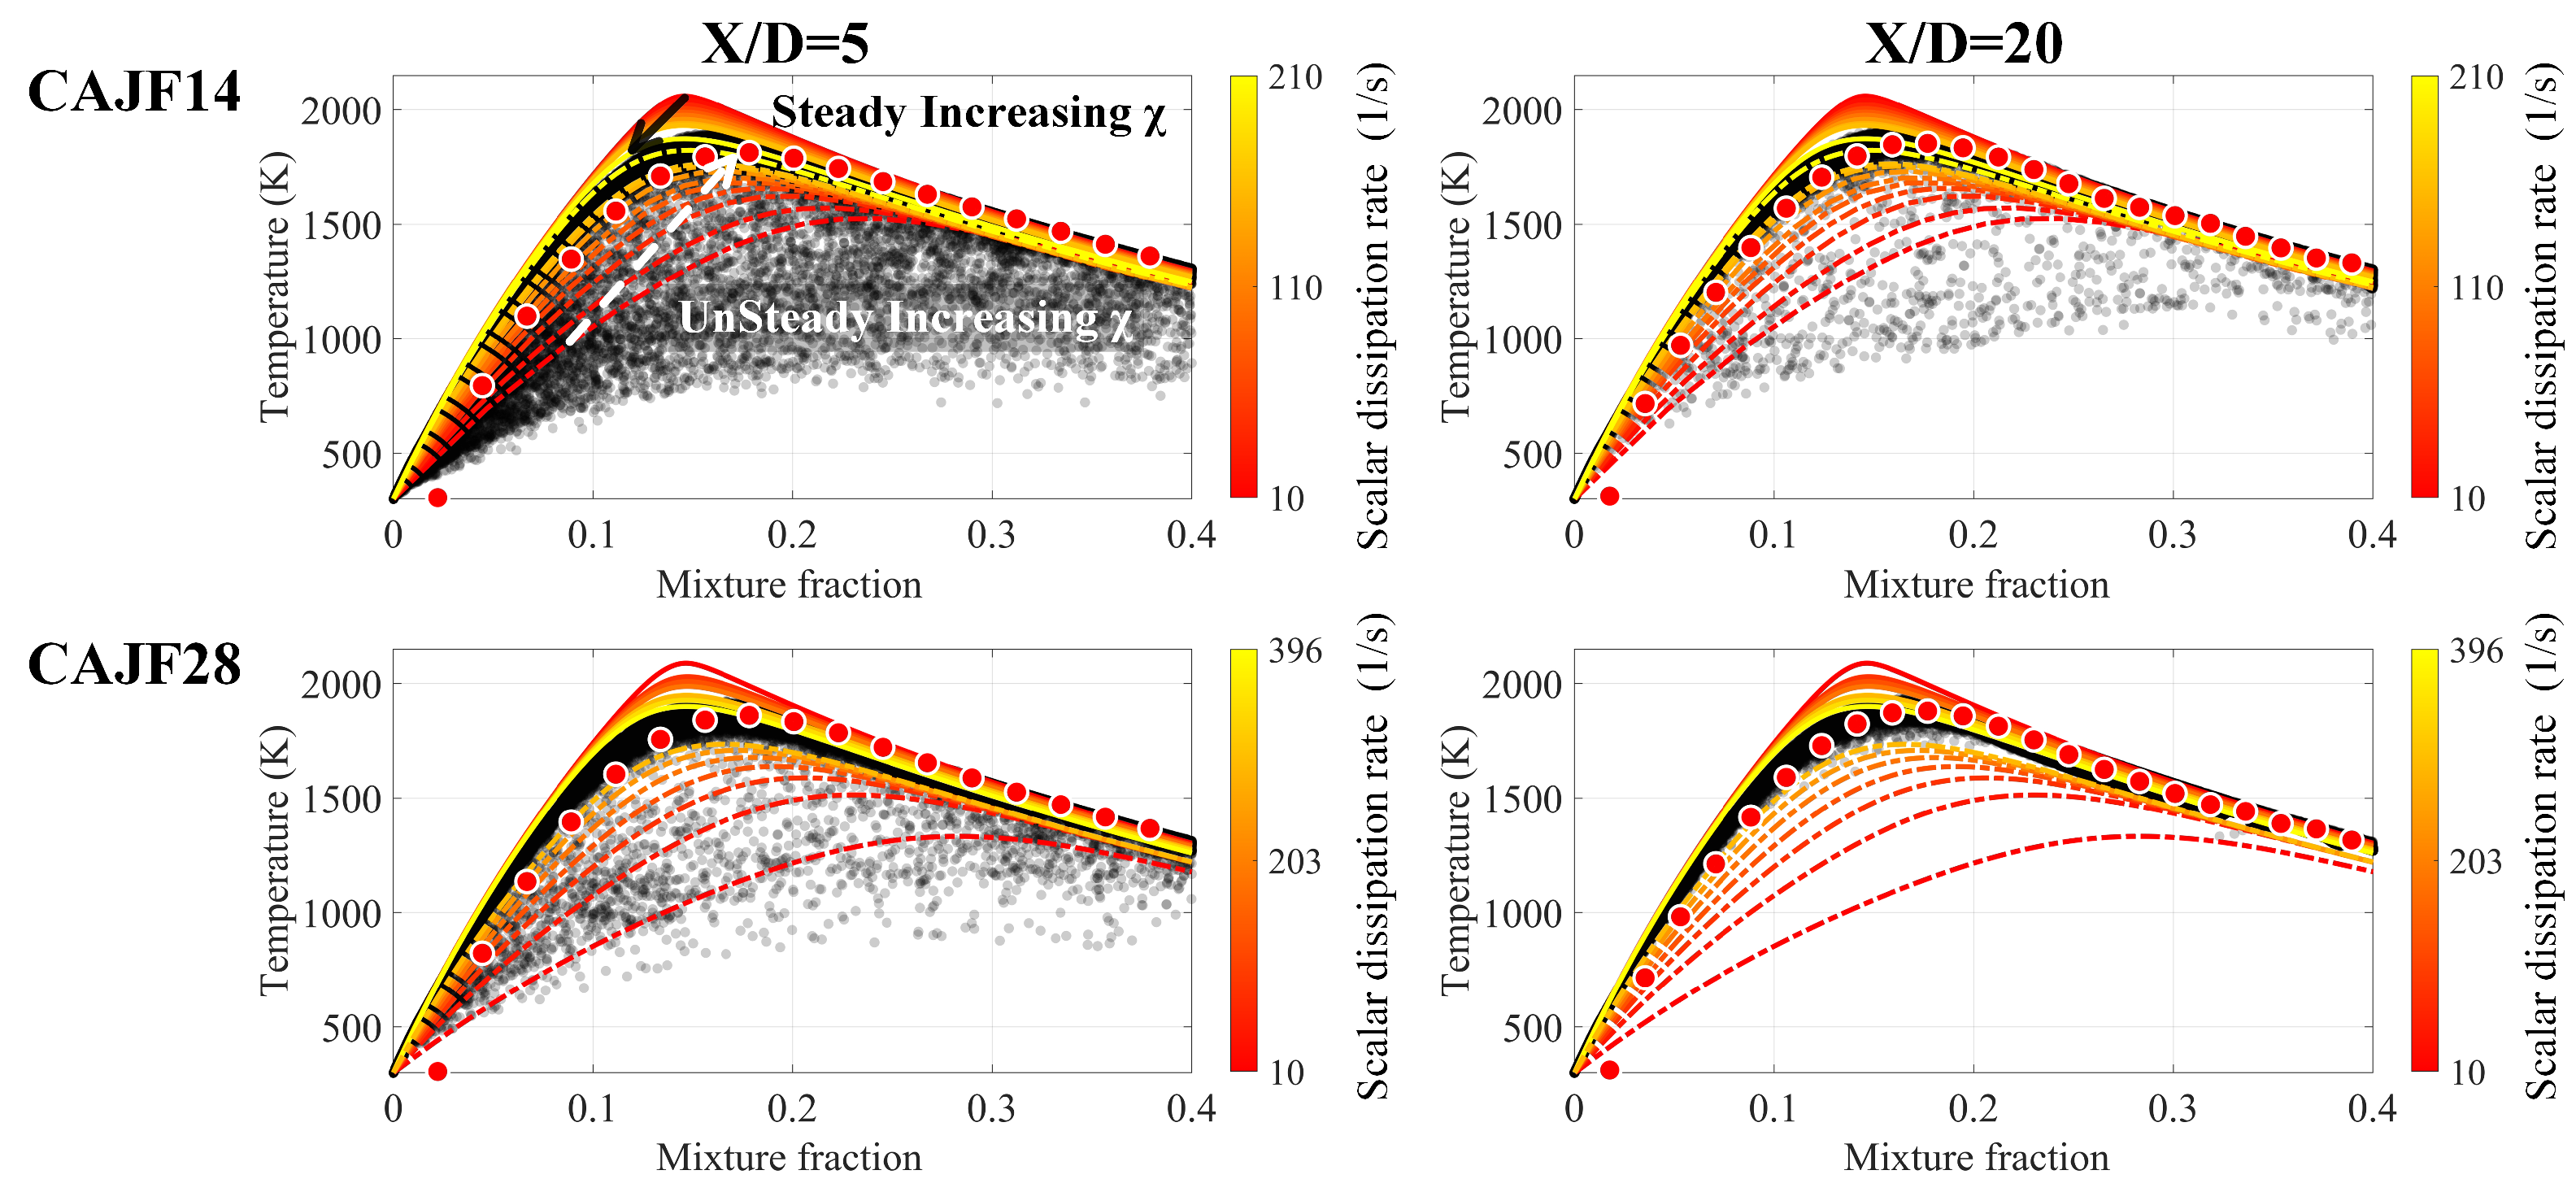
4.2.2. Flame structure analysis
By examining the distributions of various quantities in mixture fraction space, a deeper understanding of the flame structure can be achieved. Figure 11 and Figure 12 show the scatter plots of NO mole fraction and temperature, respectively, in mixture fraction space at two streamwise locations of and . The conditional means and flamelet solutions with different scalar dissipation rates are also presented. It is shown that as the scalar dissipation rate increases, the mole fraction of in the steady flamelet branch increases while the temperature gradually decreases. This indicates that in both flames, the pathway of thermal is not dominant. It is also evident that with an increase in streamwise distance, the conditional mean values of the NO mole fraction approach the flamelet solutions with lower scalar dissipation rates.
Figure 11.
The figure of instantaneous mole fraction (black dots), conditional mean value (green dots) and steady flamelet solutions at different scalar dissipation rates (colored solid lines according to the value of scalar dissipation rate) versus mixture fraction at streamwise locations , for CAJF14 and CAJF28. The arrows point towards the flamelets where the scalar dissipation rate increases.
Figure 12.
The figure of instantaneous temperature (black dots), temperature conditional mean value (red dots), steady flamelet solutions of temperature at different scalar dissipation rates (colored solid lines according to the size of scalar dissipation rate) and unsteady flamelet solutions (colored dashed lines according to the value of scalar dissipation rate) versus mixture fraction at streamwise locations and for CAJF14 and CAJF28. Arrows pointing towards the flamelets where the scalar dissipation rate increases; solid black arrow indicates steady flamelets and dashed white arrow indicates unsteady flamelets.
In Figure 12, dashed lines illustrate the unsteady flamelet solutions for different scalar dissipation rates. It can be seen that at the streamwise location , a considerable number of data points are distributed over the unsteady flamelet solutions. However, as the streamwise distance increases, the level of local extinction decreases. By comparing CAJF14 and CAJF28, it is apparent that CAJF28 shows less local extinction compared to CAJF14. This is attributed to the elevated concentration resulting from a higher cracking ratio, which enhances the reaction activity and thus promotes the completeness of combustion.
4.2.3. Formation Mechanism
Figure 13 displays the time-averaged distributions of mole fraction for CAJF14 and CAJF28. It can be seen that is primarily observed in a narrow region upstream near the stoichiometric mixture fraction where fuel and oxidizer meet, and a broader region downstream as the jet flame develops. In the downstream region, the peak concentration for CAJF28 occurs at a more upstream location and the peak concentration is higher. This means that when the cracking ratio increases, not only is the flame reactivity enhanced but also the generation of is increased for the turbulent flames. In addition, compared with Figure 4, it can be found that the impact of changes in the ammonia cracking ratio on production seems to be more significant in turbulent flames. This is because in the turbulent jet flame, there are complex interactions between turbulence and the formation of , which might result in a more pronounced difference of formation for the two turbulent flames with different ammonia cracking ratios.
Figure 13.
Time-averaged distributions of mole fraction for CAJF14 (top) and CAJF28 (bottom). The isoline is represented by a white dotted line.
In the analysis of laminar flames, it has been shown that intermediates such as , and are directly associated with generation. Figure 14 shows time-averaged distributions of key species in the turbulent jet flames. As can be seen, in the upstream region of the flames, similar to the laminar flames, a higher cracking ratio results in a lower concentration, which in turn leads to a reduced level. As the streamwise distance increases, the magnitude of nitrogen-containing species concentrations decreases rapidly, indicating that the downstream regions approach the equilibrium state more closely than the upstream regions. Radicals such as are highly indicative of reaction zones and are commonly used to characterize turbulent flames [24], which also play a role in generation in ammonia flames [56,57]. Time-averaged distributions of , and concentrations are presented in Figure 14d–f. It can be observed that in the upstream regions of the flames, similar to the laminar flame results, the higher cracking ratio in CAJF28 results in higher radical concentrations compared to CAJF14. The differences in , and concentrations between the two flames remain distinct in the downstream regions. Furthermore, based on the distributions of radicals, it is concluded that the flame length of CAJF28 is shorter than that of CAJF14. This observation is consistent with the long exposure duration pictures obtained from the experimental results [20], indicating that with increasing cracking ratio, more intense combustion is achieved and the fuel is consumed more rapidly.
Figure 14.
Time-averaged distributions of mole fractions for (a) , (b) , (c) , (d) , (e) and (f) in CAJF14 (top) and CAJF28 (bottom).
To gain a deeper understanding of formation in turbulent jet flames, two representative locations are chosen for the following analysis, i.e., and 60. From Figure 13, it is evident that these two locations correspond to the regions where the mole fraction peaks. Figure 15 illustrates the scatter plots between important radical concentrations with the concentration at various locations. It is apparent that the correlation between and is weaker when compared to that between and radicals such as , and , both in the upstream and downstream regions. Figure 15b–d indicate that the radicals , and exhibit a positive correlation with , confirming the a role that these radicals play in generation in ammonia flames.
Figure 15.
Scatter plots showing the distribution of mole fractions of (a), (b), (c) and (d) in the mixture fraction space, where CAJF14 is represented in red and CAJF28 in blue.
The following analysis focuses on the influence of varying ammonia cracking ratios on the distribution of source terms, the information of which is not available from the experiments. The combustion of mixture mainly involves two mechanisms for NO formation. The first is the thermal mechanism, also known as the Zeldovich mechanism, which includes three reactions, i.e., , and . The second mechanism is the fuel mechanism, i.e., , where is an oxygen-containing species [58]. Figure 16 shows the mean distributions of the fuel, thermal and total source terms of both flames. It can be seen that the source term has a higher absolute value in the upstream region, and the absolute value of the source term rapidly decreases with the increase in the streamwise distance. The total source term is positive in the fuel-lean zone and shows negative values in the fuel-rich zone. In addition, it can be observed that the fuel in most regions is negative, while the thermal is positive.
Figure 16.
Time-averaged distributions of fuel, thermal and total source terms for CAJF14 (top) and CAJF28 (bottom).
5. Conclusions
In this study, simulations of laminar counterflow and turbulent non-premixed ammonia/air flames in HPCD were conducted. Two cases with different ammonia cracking ratios of 14% and 28% were investigated. The influence of changes in the ammonia cracking ratio on flame structure and formation mechanism under high-pressure conditions were examined. The main findings are summarized as follows:
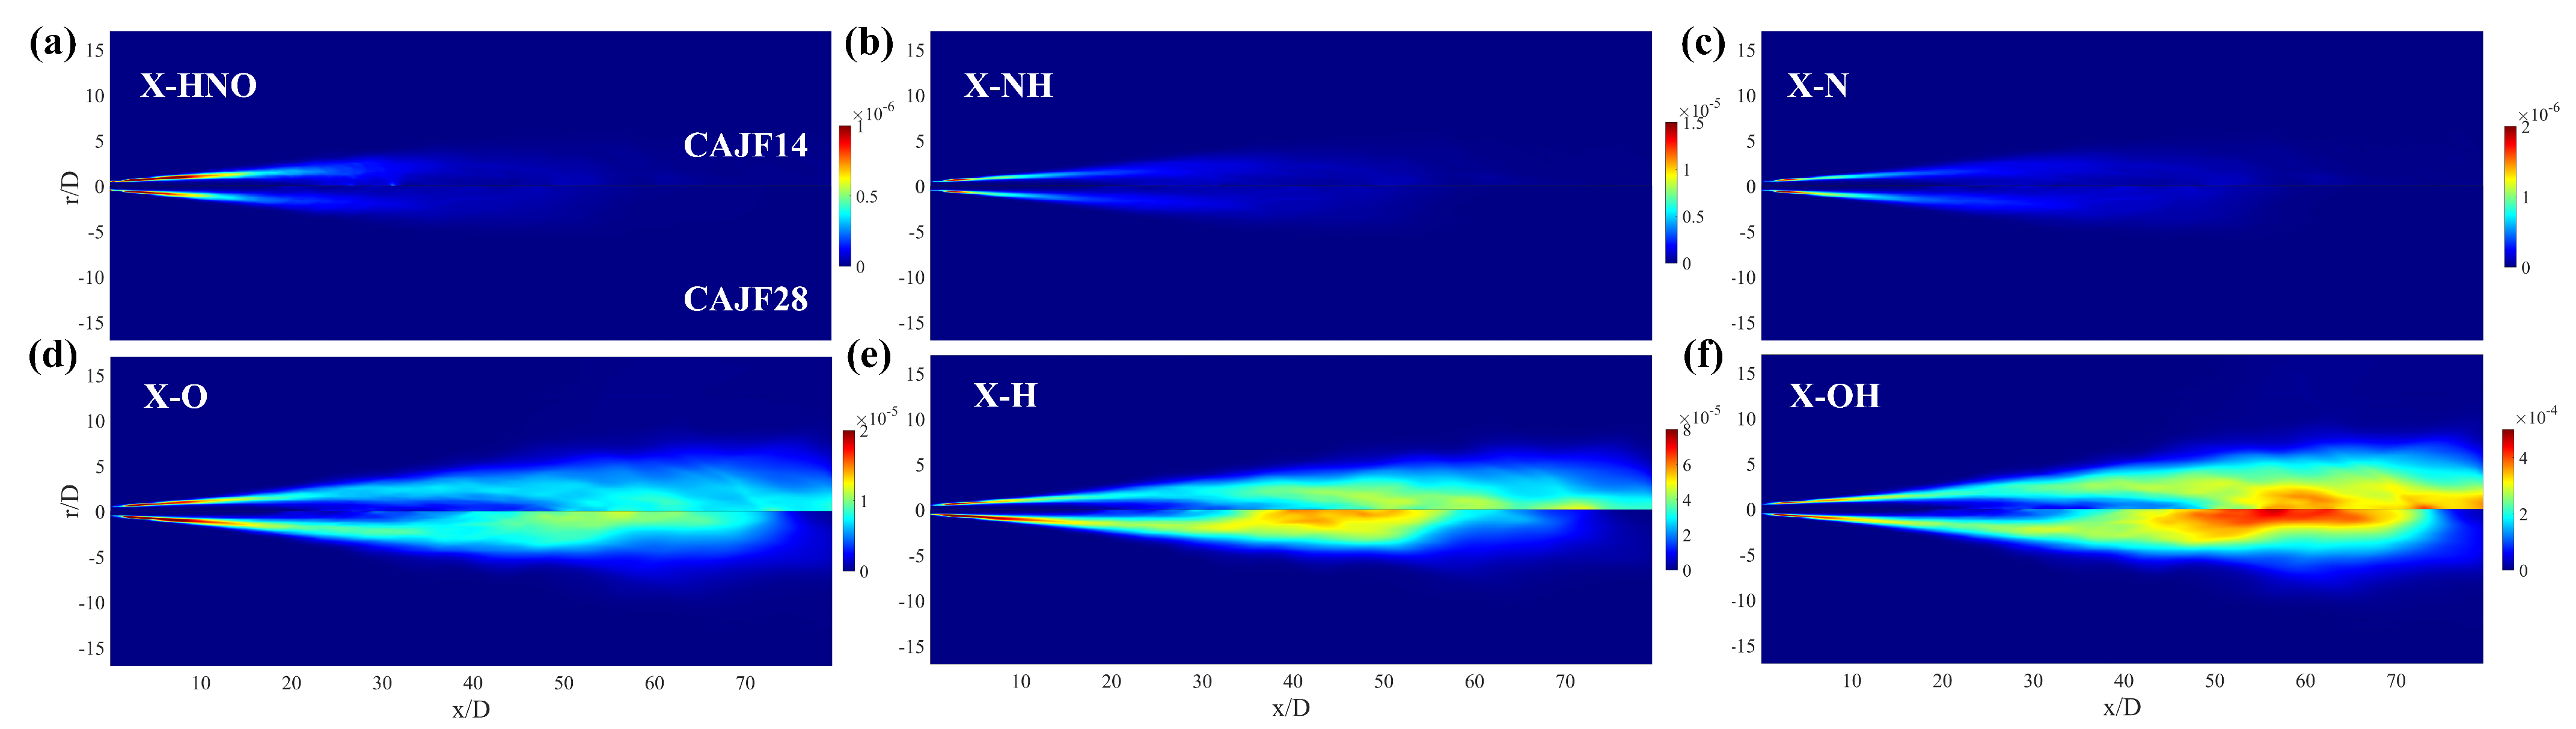
- Through nitrogen flow analyses, the conversion of nitrogen-containing species and the NO pathways were examined. It was found that the species that contributes the most to generation is , and the most important pathway for NO generation is .
- The simulation and experimental results agree quite well, and the simulations provided fairly accurate predictions for , proving the applicability of the FPV method in hydrogen–ammonia flames. The flame structure and formation of turbulent jet flames were examined. It was found that with increasing cracking ratio, not only is the flame reactivity enhanced but the generation of is also increased for the turbulent flames.
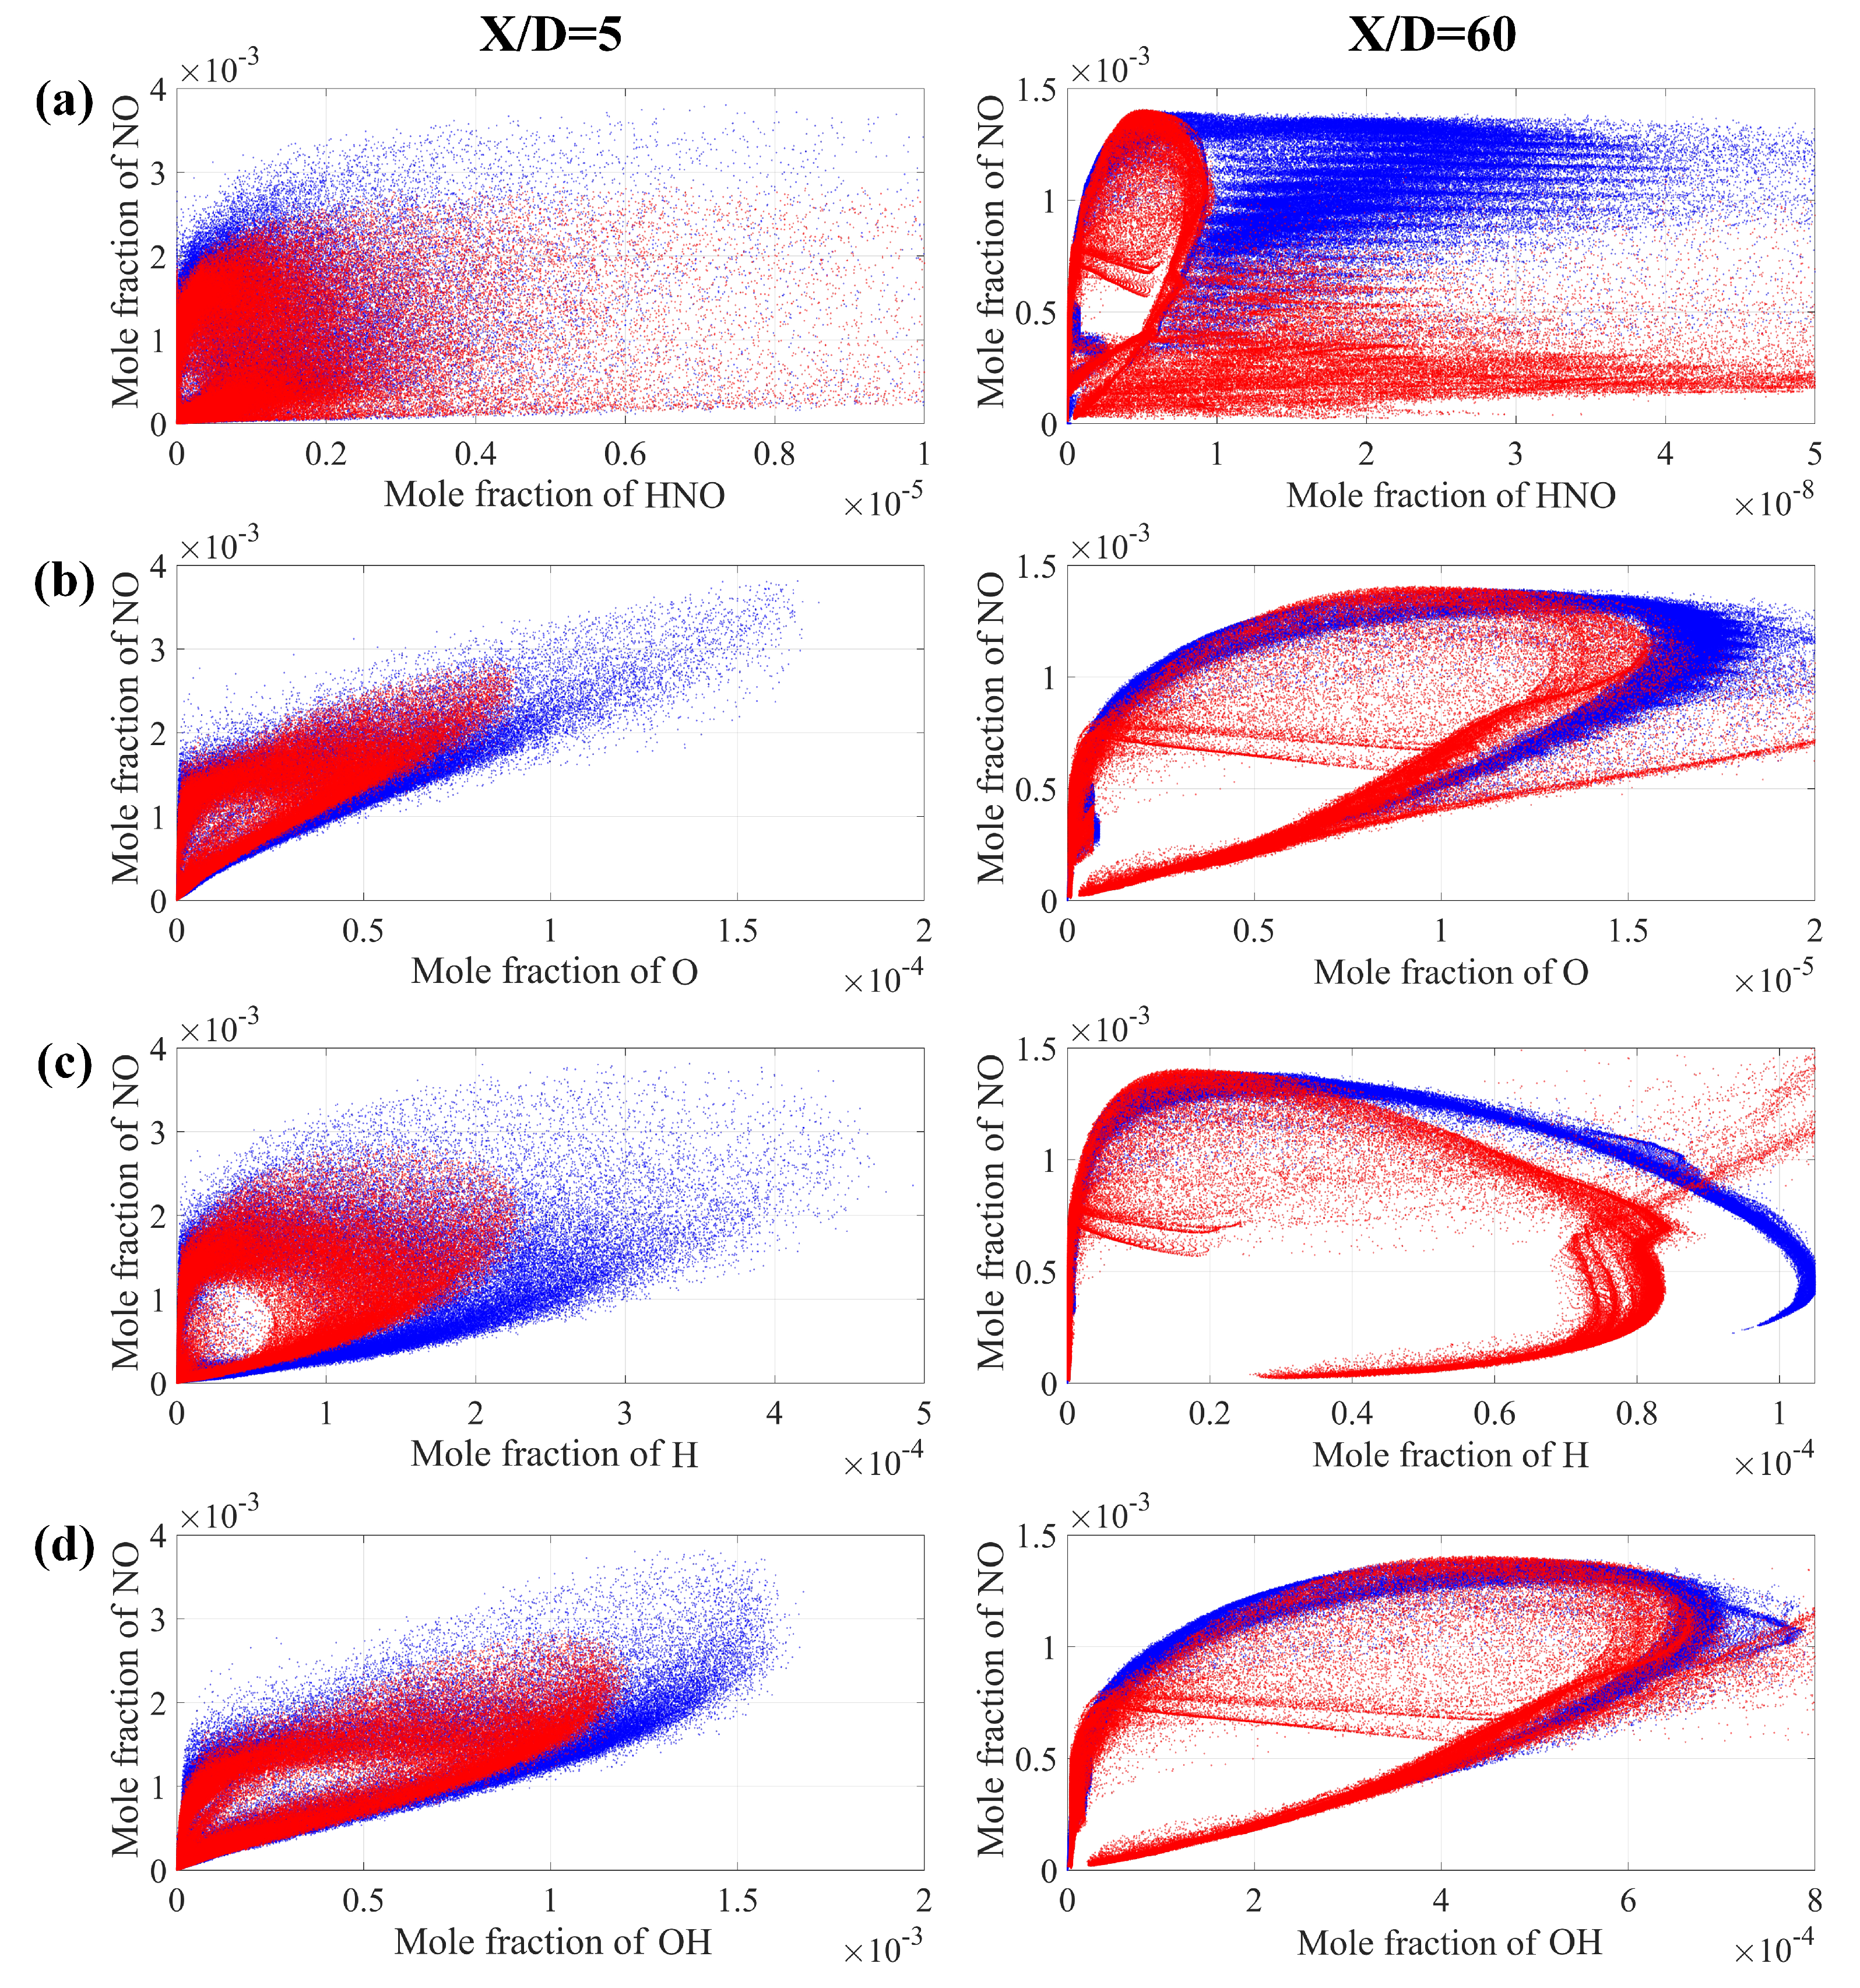
- The correlation between important radical concentrations and concentration was examined. We showed that the correlation between and is weaker when compared to that of and radicals such as , and throughout the entire field. Moreover, the increased cracking ratio also results in a higher level of radical concentrations.
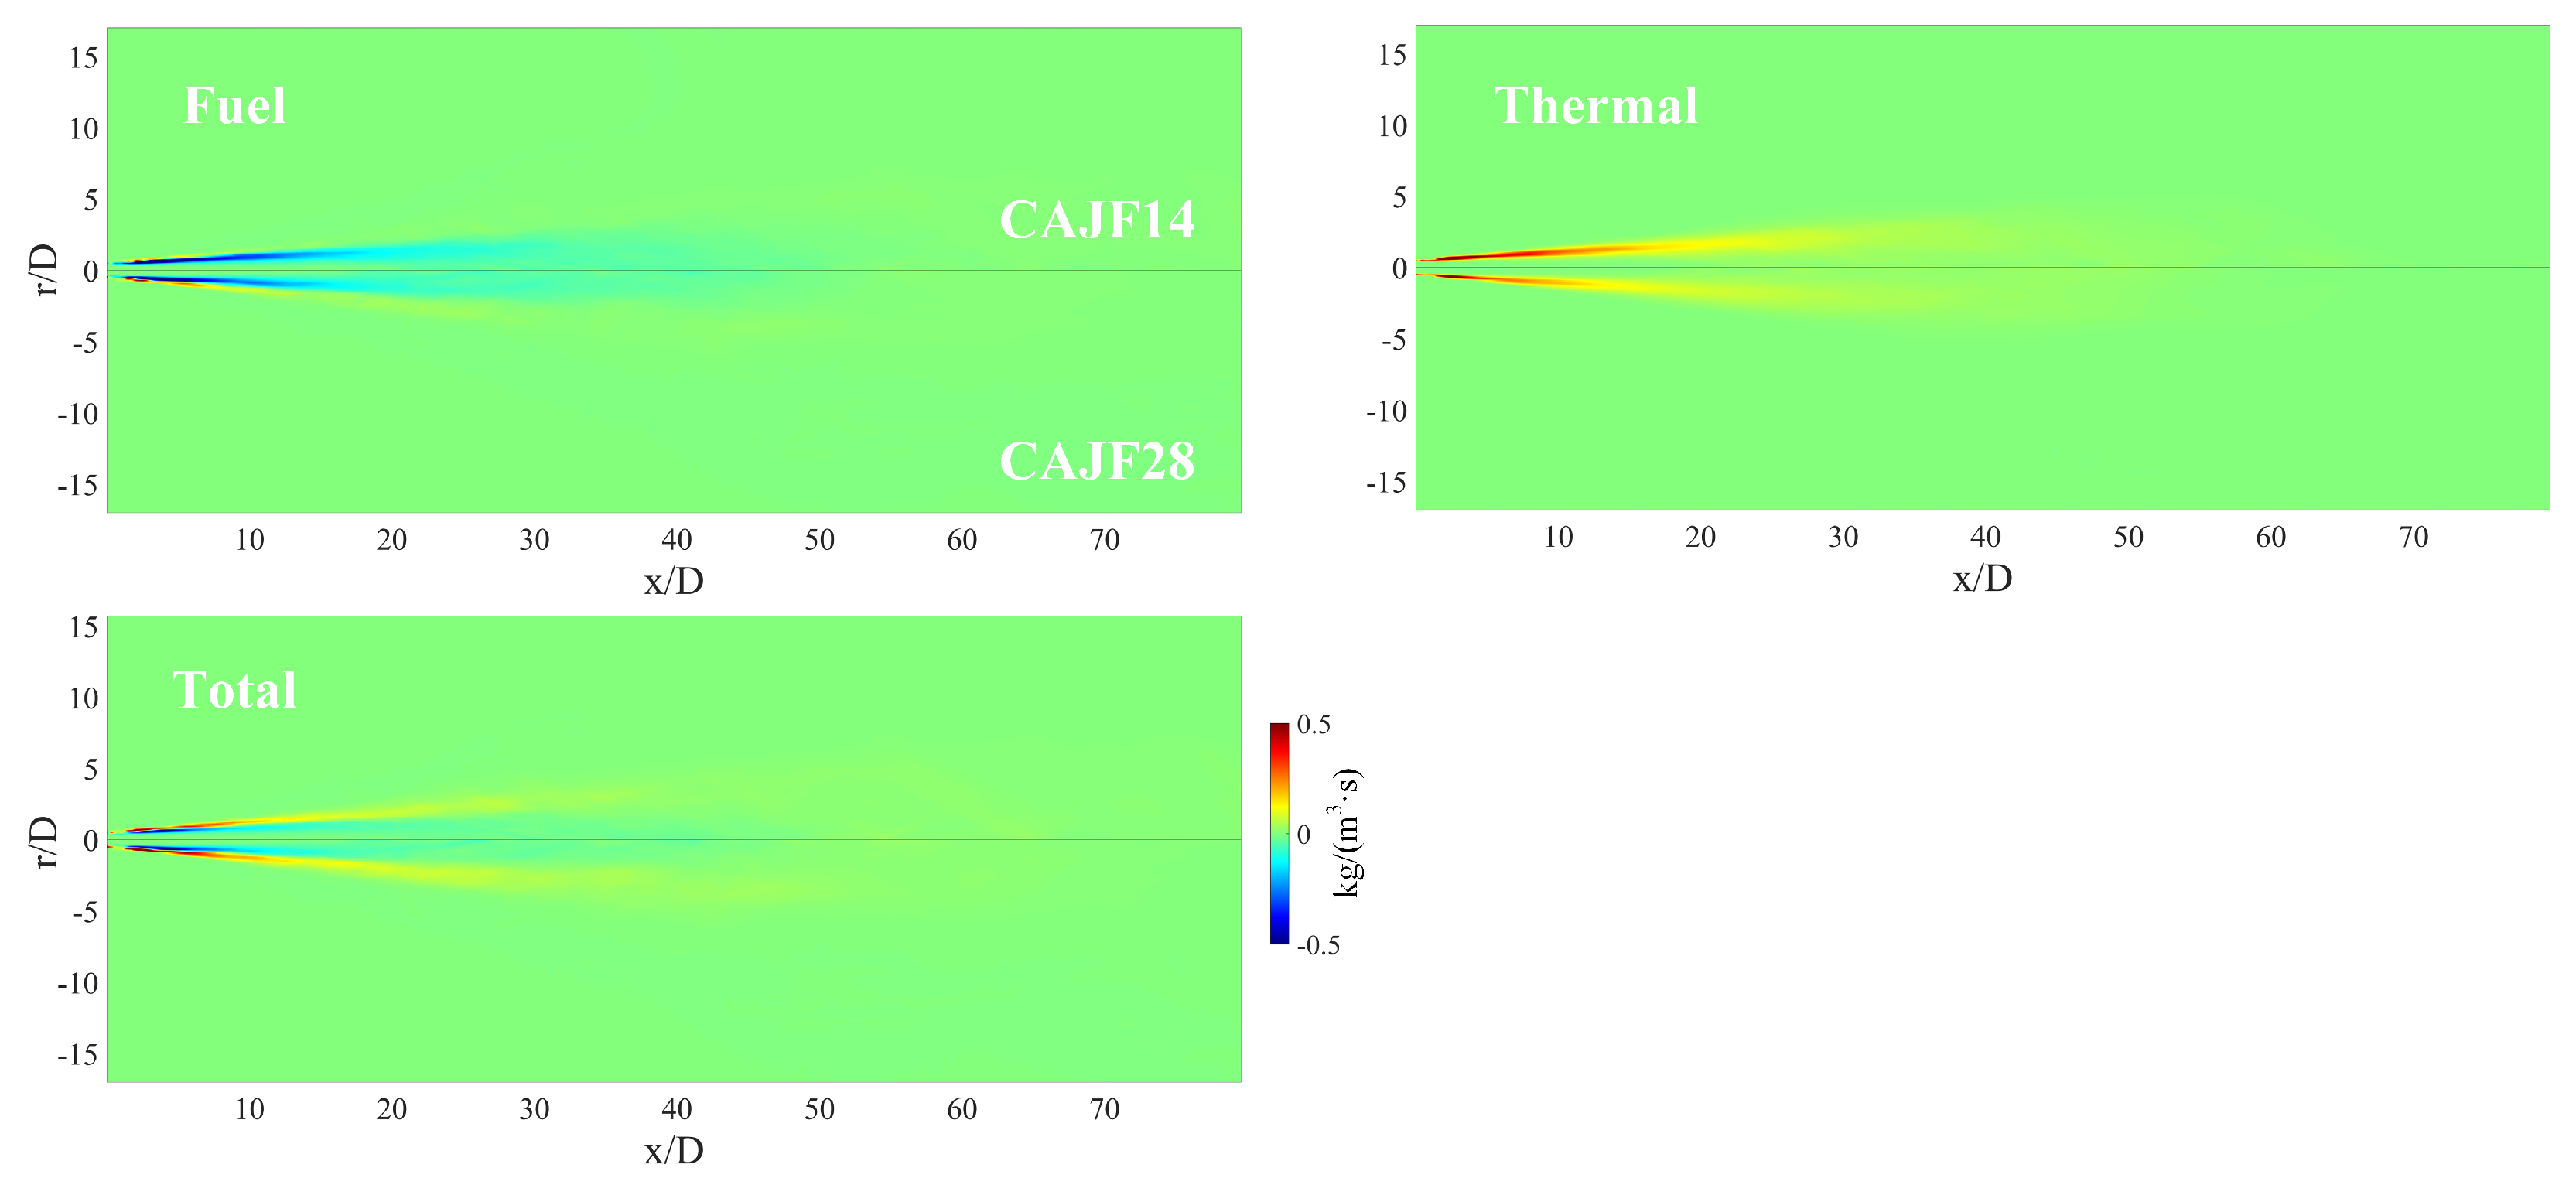
- The distribution of source terms were also explored. It was found that the source term has a higher absolute value upstream, and the absolute value rapidly decreases with the increase in the streamwise distance. The total source term is positive in the fuel-lean zone and shows negative values in the fuel-rich zone. In addition, the fuel in most regions is negative, while the thermal is positive.
Author Contributions
Conceptualization, C.W. and H.W.; methodology, C.W.; software, C.W.; validation, C.W. and H.W.; formal analysis, C.W.; investigation, C.W.; resources, C.W.; data curation, C.W. and H.W.; writing—original draft preparation, C.W. and H.W.; writing—review and editing, C.W., H.W., K.L. and J.F.; visualization, C.W.; supervision, H.W.; project administration, H.W., K.L. and J.F.; funding acquisition, H.W., K.L. and J.F. All authors have read and agreed to the published version of the manuscript.
Funding
This research was funded by the Natural Science Foundation of China (Grant Nos.: 52022091, 51976185, 51925603). The work was also supported by the Fundamental Research Funds for the Central Universities, China (Grant No: 2021FZZX001-10).
Data Availability Statement
The data that support the findings of this study are available from the corresponding author upon reasonable request.
Conflicts of Interest
The authors declare no conflict of interest.
References
- Smith, C.; Hill, A.K.; Torrente-Murciano, L. Current and Future Role of Haber–Bosch Ammonia in a Carbon-Free Energy Landscape. Energy Environ. Sci. 2020, 13, 331–344. [Google Scholar] [CrossRef]
- Yapicioglu, A.; Dincer, I. A Review on Clean Ammonia as a Potential Fuel for Power Generators. Renew. Sustain. Energy Rev. 2019, 103, 96–108. [Google Scholar] [CrossRef]
- Awad, O.I.; Zhou, B.; Harrath, K.; Kadirgama, K. Characteristics of NH3/H2 Blend as Carbon-Free Fuels: A Review. Int. J. Hydrogen Energy 2022. is press. [Google Scholar] [CrossRef]
- Hayakawa, A.; Goto, T.; Mimoto, R.; Arakawa, Y.; Kudo, T.; Kobayashi, H. Laminar Burning Velocity and Markstein Length of Ammonia/Air Premixed Flames at Various Pressures. Fuel 2015, 159, 98–106. [Google Scholar] [CrossRef]
- Kobayashi, H.; Hayakawa, A.; Somarathne, K.D.K.A.; Okafor, E.C. Science and Technology of Ammonia Combustion. Proc. Combust. Inst. 2019, 37, 109–133. [Google Scholar] [CrossRef]
- Li, J.; Huang, H.; Kobayashi, N.; He, Z.; Nagai, Y. Study on Using Hydrogen and Ammonia as Fuels: Combustion Characteristics and NOx Formation: Hydrogen and Ammonia as Fuels. Int. J. Energy Res. 2014, 38, 1214–1223. [Google Scholar] [CrossRef]
- Mathieu, O.; Petersen, E.L. Experimental and Modeling Study on the High-Temperature Oxidation of Ammonia and Related NOx Chemistry. Combust. Flame 2015, 162, 554–570. [Google Scholar] [CrossRef]
- Li, S.; Zhang, S.; Zhou, H.; Ren, Z. Analysis of Air-Staged Combustion of NH3/CH4 Mixture with Low NOx Emission at Gas Turbine Conditions in Model Combustors. Fuel 2019, 237, 50–59. [Google Scholar] [CrossRef]
- Xiao, H.; Lai, S.; Valera-Medina, A.; Li, J.; Liu, J.; Fu, H. Study on Counterflow Premixed Flames Using High Concentration Ammonia Mixed with Methane. Fuel 2020, 275, 117902. [Google Scholar] [CrossRef]
- Kurata, O.; Iki, N.; Matsunuma, T.; Inoue, T.; Tsujimura, T.; Furutani, H.; Kobayashi, H.; Hayakawa, A. Performances and Emission Characteristics of NH3–Air and NH3CH4–Air Combustion Gas-Turbine Power Generations. Proc. Combust. Inst. 2017, 36, 3351–3359. [Google Scholar] [CrossRef]
- Khateeb, A.A.; Guiberti, T.F.; Zhu, X.; Younes, M.; Jamal, A.; Roberts, W.L. Stability Limits and Exhaust NO Performances of Ammonia-Methane-Air Swirl Flames. Exp. Therm. Fluid Sci. 2020, 114, 110058. [Google Scholar] [CrossRef]
- Otomo, J.; Koshi, M.; Mitsumori, T.; Iwasaki, H.; Yamada, K. Chemical Kinetic Modeling of Ammonia Oxidation with Improved Reaction Mechanism for Ammonia/Air and Ammonia/Hydrogen/Air Combustion. Int. J. Hydrogen Energy 2018, 43, 3004–3014. [Google Scholar] [CrossRef]
- Frigo, S.; Gentili, R. Analysis of the Behaviour of a 4-Stroke Si Engine Fuelled with Ammonia and Hydrogen. Int. J. Hydrogen Energy 2013, 38, 1607–1615. [Google Scholar] [CrossRef]
- Comotti, M.; Frigo, S. Hydrogen Generation System for Ammonia–Hydrogen Fuelled Internal Combustion Engines. Int. J. Hydrogen Energy 2015, 40, 10673–10686. [Google Scholar] [CrossRef]
- Mei, B.; Zhang, J.; Shi, X.; Xi, Z.; Li, Y. Enhancement of Ammonia Combustion with Partial Fuel Cracking Strategy: Laminar Flame Propagation and Kinetic Modeling Investigation of NH3/H2/N2/Air Mixtures up to 10 Atm. Combust. Flame 2021, 231, 111472. [Google Scholar] [CrossRef]
- Shohdy, N.N.; Alicherif, M.; Lacoste, D.A. Transfer Functions of Ammonia and Partly Cracked Ammonia Swirl Flames. Energies 2023, 16, 1323. [Google Scholar] [CrossRef]
- Mercier, A.; Mounaïm-Rousselle, C.; Brequigny, P.; Bouriot, J.; Dumand, C. Improvement of SI Engine Combustion with Ammonia as Fuel: Effect of Ammonia Dissociation Prior to Combustion. Fuel Commun. 2022, 11, 100058. [Google Scholar] [CrossRef]
- Kim, N.; Lee, M.; Park, J.; Park, J.; Lee, T. A Comparative Study of NOx Emission Characteristics in a Fuel Staging and Air Staging Combustor Fueled with Partially Cracked Ammonia. Energies 2022, 15, 9617. [Google Scholar] [CrossRef]
- Tang, H.; Yang, C.; Wang, G.; Krishna, Y.; Guiberti, T.F.; Roberts, W.L.; Magnotti, G. Scalar Structure in Turbulent Non-Premixed NH3/H2/N2 Jet Flames at Elevated Pressure Using Raman Spectroscopy. Combust. Flame 2022, 244, 112292. [Google Scholar] [CrossRef]
- Wang, G.; Tang, H.; Yang, C.; Magnotti, G.; Roberts, W.L.; Guiberti, T.F. Quantitative Laser-Induced Fluorescence of NO in Ammonia-Hydrogen-Nitrogen Turbulent Jet Flames at Elevated Pressure. Proc. Combust. Inst. 2023, 39, 1465–1474. [Google Scholar] [CrossRef]
- Abdelwahid, S.; Malik, M.R.; Al Kader Hammoud, H.A.; Hernández-Pérez, F.E.; Ghanem, B.; Im, H.G. Large Eddy Simulations of Ammonia-Hydrogen Jet Flames at Elevated Pressure Using Principal Component Analysis and Deep Neural Networks. Combust. Flame 2023, 253, 112781. [Google Scholar] [CrossRef]
- Tang, J. Study and Application of NOx Prediction Model and Flamelet Tabulation Method for Aeroengine Combustion Chamber. Ph.D. Thesis, Northwestern Polytechnical University, Xi’an, China, 2018. [Google Scholar]
- Tang, Y.; Raman, V. Large Eddy Simulation of Premixed Turbulent Combustion Using a Non-Adiabatic, Strain-Sensitive Flamelet Approach. Combust. Flame 2021, 234, 111655. [Google Scholar] [CrossRef]
- An, Z.; Zhang, M.; Zhang, W.; Mao, R.; Wei, X.; Wang, J.; Huang, Z.; Tan, H. Emission Prediction and Analysis on CH4/NH3/Air Swirl Flames with LES-FGM Method. Fuel 2021, 304, 121370. [Google Scholar] [CrossRef]
- Honzawa, T.; Kai, R.; Okada, A.; Valera-Medina, A.; Bowen, P.J.; Kurose, R. Predictions of NO and CO Emissions in Ammonia/Methane/Air Combustion by LES Using a Non-Adiabatic Flamelet Generated Manifold. Energy 2019, 186, 115771. [Google Scholar] [CrossRef]
- Kai, R.; Tokuoka, T.; Nagao, J.; Pillai, A.L.; Kurose, R. LES Flamelet Modeling of Hydrogen Combustion Considering Preferential Diffusion Effect. Int. J. Hydrogen Energy 2022, 48, 11086–11101. [Google Scholar] [CrossRef]
- Jiang, X.; Guo, J.; Wei, Z.; Quadarella, E.; Im, H.G.; Liu, Z. A Species-Weighted Flamelet/Progress Variable Model with Differential Diffusion Effects for Oxy-Fuel Jet Flames. Combust. Flame 2023, 251, 112674. [Google Scholar]
- Gao, Z.; Wang, H.; Song, C.; Luo, K.; Fan, J. Large-Eddy Simulation of Hydrothermal Flames Using Extended Flamelet/Progress Variable Approach. J. Supercrit. Fluids 2020, 163, 104843. [Google Scholar] [CrossRef]
- Wang, S.; Wang, H.; Luo, K.; Fan, J. The Effects of Differential Diffusion on Turbulent Non-Premixed Flames LO2/CH4 under Transcritical Conditions Using Large-Eddy Simulation. Energies 2023, 16, 1065. [Google Scholar] [CrossRef]
- Boyette, W.R.; Guiberti, T.F.; Magnotti, G.; Roberts, W.L. Structure of Turbulent Nonpremixed Syngas Flames at High Pressure. Proc. Combust. Inst. 2019, 37, 2207–2214. [Google Scholar] [CrossRef]
- Tang, H.; Yang, C.; Wang, G.; Guiberti, T.F.; Magnotti, G. Raman Spectroscopy for Quantitative Measurements of Temperature and Major Species in High-Pressure Non-Premixed NH3/H2/N2 Counterflow Flames. Combust. Flame 2022, 237, 111840. [Google Scholar] [CrossRef]
- Design, R. CHEMKIN-PRO 18.2; ANSYS, Inc.: San Diego, CA, USA, 2017. [Google Scholar]
- Kee, R.J.; Miller, J.A.; Evans, G.H.; Dixon-Lewis, G. A Computational Model of the Structure and Extinction of Strained, Opposed Flow, Premixed Methane-Air Flames. Symp. (Int.) Combust. 1989, 22, 1479–1494. [Google Scholar] [CrossRef]
- Okafor, E.C.; Naito, Y.; Colson, S.; Ichikawa, A.; Kudo, T.; Hayakawa, A.; Kobayashi, H. Experimental and Numerical Study of the Laminar Burning Velocity of CH4–NH3–Air Premixed Flames. Combust. Flame 2018, 187, 185–198. [Google Scholar] [CrossRef]
- Jiang, Y.; Gruber, A.; Seshadri, K.; Williams, F. An Updated Short Chemical-kinetic Nitrogen Mechanism for Carbon-free Combustion Applications. Int. J. Energy Res. 2020, 44, 795–810. [Google Scholar] [CrossRef]
- Cheng, M.; Wang, H.; Xiao, H.; Luo, K.; Fan, J. Emission Characteristics and Heat Release Rate Surrogates for Ammonia Premixed Laminar Flames. Int. J. Hydrogen Energy 2021, 46, 13461–13470. [Google Scholar] [CrossRef]
- Chai, W.S.; Bao, Y.; Jin, P.; Tang, G.; Zhou, L. A Review on Ammonia, Ammonia-Hydrogen and Ammonia-Methane Fuels. Renew. Sustain. Energy Rev. 2021, 147, 111254. [Google Scholar] [CrossRef]
- Song, Y.; Hashemi, H.; Christensen, J.M.; Zou, C.; Marshall, P.; Glarborg, P. Ammonia Oxidation at High Pressure and Intermediate Temperatures. Fuel 2016, 181, 358–365. [Google Scholar] [CrossRef]
- Xu, L.; Chang, Y.; Treacy, M.; Zhou, Y.; Jia, M.; Bai, X.S. A Skeletal Chemical Kinetic Mechanism for Ammonia/n-Heptane Combustion. Fuel 2023, 331, 125830. [Google Scholar] [CrossRef]
- Alnasif, A.; Mashruk, S.; Shi, H.; Alnajideen, M.; Wang, P.; Pugh, D.; Valera-Medina, A. Evolution of Ammonia Reaction Mechanisms and Modeling Parameters: A Review. Appl. Energy Combust. Sci. 2023, 15, 100175. [Google Scholar]
- Han, X.; Wang, Z.; Costa, M.; Sun, Z.; He, Y.; Cen, K. Experimental and Kinetic Modeling Study of Laminar Burning Velocities of NH3/Air, NH3/H2/Air, NH3/CO/Air and NH3/CH4/Air Premixed Flames. Combust. Flame 2019, 206, 214–226. [Google Scholar] [CrossRef]
- Petrova, M.; Williams, F. A Small Detailed Chemical-Kinetic Mechanism for Hydrocarbon Combustion. Combust. Flame 2006, 144, 526–544. [Google Scholar] [CrossRef]
- Weller, H.G.; Tabor, G.; Jasak, H.; Fureby, C. A Tensorial Approach to Computational Continuum Mechanics Using Object-Oriented Techniques. Comput. Phys. 1998, 12, 620. [Google Scholar] [CrossRef]
- Peters, N. Turbulent Combustion. Meas. Sci. Technol. 2001, 12, 2022. [Google Scholar] [CrossRef]
- Pierce, C.D.; Moin, P. Progress-Variable Approach for Large-Eddy Simulation of Non-Premixed Turbulent Combustion. J. Fluid Mech. 2004, 504, 73–97. [Google Scholar] [CrossRef]
- Lilly, D.K. A Proposed Modification of the Germano Subgrid-scale Closure Method. Phys. Fluids A Fluid Dyn. 1992, 4, 633–635. [Google Scholar] [CrossRef]
- Bilger, R.; Stårner, S.; Kee, R. On reduced mechanisms for methane-air combustion in nonpremixed flames. Combust. Flame 1990, 80, 135–149. [Google Scholar] [CrossRef]
- Domingo, P.; Vervisch, L.; Veynante, D. Large-Eddy Simulation of a Lifted Methane Jet Flame in a Vitiated Coflow. Combust. Flame 2008, 152, 415–432. [Google Scholar] [CrossRef]
- Pitsch, H. A C++ Computer Program for 0-D and 1-D Laminar Flame Calculations; RWTH: Aachen, Germany, 1998. [Google Scholar]
- Ihme, M.; Shunn, L.; Zhang, J. Regularization of Reaction Progress Variable for Application to Flamelet-Based Combustion Models. J. Comput. Phys. 2012, 231, 7715–7721. [Google Scholar] [CrossRef]
- Peters, N. Laminar Diffusion Flamelet Models in Non-Premixed Turbulent Combustion. Prog. Energy Combust. Sci. 1984, 10, 319–339. [Google Scholar] [CrossRef]
- Coelho, P.J.; Peters, N. Unsteady Modelling of a Piloted Methane/Air Jet Flame Based on the Eulerian Particle Flamelet Model. Combust. Flame 2001, 124, 444–465. [Google Scholar] [CrossRef]
- Ihme, M.; Pitsch, H. Modeling of Radiation and Nitric Oxide Formation in Turbulent Nonpremixed Flames Using a Flamelet/Progress Variable Formulation. Phys. Fluids 2008, 20, 055110. [Google Scholar] [CrossRef]
- Wang, H.; Hawkes, E.R.; Savard, B.; Chen, J.H. Direct Numerical Simulation of a High Ka CH4/Air Stratified Premixed Jet Flame. Combust. Flame 2018, 193, 229–245. [Google Scholar] [CrossRef]
- Okafor, E.C.; Somarathne, K.D.K.A.; Ratthanan, R.; Hayakawa, A.; Kudo, T.; Kurata, O.; Iki, N.; Tsujimura, T.; Furutani, H.; Kobayashi, H. Control of NOx and Other Emissions in Micro Gas Turbine Combustors Fuelled with Mixtures of Methane and Ammonia. Combust. Flame 2020, 211, 406–416. [Google Scholar] [CrossRef]
- Somarathne, K.D.K.A.; Okafor, E.C.; Sugawara, D.; Hayakawa, A.; Kobayashi, H. Effects of OH Concentration and Temperature on NO Emission Characteristics of Turbulent Non-Premixed CH4/NH3/Air Flames in a Two-Stage Gas Turbine like Combustor at High Pressure. Proc. Combust. Inst. 2021, 38, 5163–5170. [Google Scholar] [CrossRef]
- Somarathne, K.D.K.A.; Okafor, E.C.; Hayakawa, A.; Kudo, T.; Kurata, O.; Iki, N.; Kobayashi, H. Emission Characteristics of Turbulent Non-Premixed Ammonia/Air and Methane/Air Swirl Flames through a Rich-Lean Combustor under Various Wall Thermal Boundary Conditions at High Pressure. Combust. Flame 2019, 210, 247–261. [Google Scholar] [CrossRef]
- Duynslaegher, C.; Jeanmart, H.; Vandooren, J. Flame Structure Studies of Premixed Ammonia/Hydrogen/Oxygen/Argon Flames: Experimental and Numerical Investigation. Proc. Combust. Inst. 2009, 32, 1277–1284. [Google Scholar] [CrossRef]
Disclaimer/Publisher’s Note: The statements, opinions and data contained in all publications are solely those of the individual author(s) and contributor(s) and not of MDPI and/or the editor(s). MDPI and/or the editor(s) disclaim responsibility for any injury to people or property resulting from any ideas, methods, instructions or products referred to in the content. |
© 2023 by the authors. Licensee MDPI, Basel, Switzerland. This article is an open access article distributed under the terms and conditions of the Creative Commons Attribution (CC BY) license (https://creativecommons.org/licenses/by/4.0/).


