Article

Research on Transformation of Connate Water to Movable Water in Water-Bearing Tight Gas Reservoirs

1
Petroleum Engineering Technology Research Institute, SINOPEC North China Oil & Gas Company, Zhengzhou 450000, China
2
National Key Laboratory of Deep Oil and Gas, China University of Petroleum (East China), Qingdao 266580, China
3
Research Center of Multiphase Flow in Porous Media, School of Petroleum Engineering, China University of Petroleum (East China), Qingdao 266580, China
*
Author to whom correspondence should be addressed.
Energies 2023, 16(19), 6961; https://doi.org/10.3390/en16196961
Submission received: 1 September 2023 / Revised: 24 September 2023 / Accepted: 4 October 2023 / Published: 5 October 2023
(This article belongs to the Special Issue Advances in the Development of Unconventional Oil and Gas Resources)

Abstract

:
The Dongsheng gas field is a water-bearing tight gas reservoir characterized by high connate water saturation. During gas production, the transformation of connate water into movable water introduces a unique water production mode, significantly impacting gas reservoir recovery. Current experimental and theoretical methods for assessing formation water mobility are static and do not address the transformation mechanism from connate into movable water. In this study, we considered dynamic changes in formation stress and proposed the mechanism for the transformation of connate water into movable water during depressurization, involving the expansion of connate water films and the reduction of pore volume. We developed a novel methodology to calculate the dynamic changes in movable and connate water saturation in tight reservoirs due to reservoir pressure reduction. Furthermore, we quantitatively evaluated the transformation of connate water into movable water in the Dongsheng gas field through laboratory experiments (including formation water expansion tests, connate water tests, and porosity stress sensitivity tests) and theoretical calculations. Results show that under original stress, the initial connate water saturation in the Dongsheng gas field ranges from 50.09% to 58.5%. As reservoir pressure decreases, the maximum increase in movable water saturation ranges from 6.1% to 8.4% due to the transformation of connate water into movable water. This explains why formation water is produced in large quantities during gas production. Therefore, considering the transition of connate water to movable water is crucial when evaluating water production risk. These findings offer valuable guidance for selecting optimal well locations and development layers to reduce reservoir water production risks.

1. Introduction

Tight gas reservoirs are currently a focal point in unconventional natural gas exploration and development, playing a pivotal role in natural gas production [1,2,3,4]. According to China’s fourth oil and gas resource assessment, onshore tight gas resources in China total 21.85 × 10¹² m3, primarily concentrated in regions such as the Ordos Basin, Sichuan Basin, Songliao Basin, and Tarim Basin [5,6,7,8]. Notably, the Upper Paleozoic strata of the Ordos Basin account for 60% of these resources, totaling 13.32 × 10¹² m3 [9]. After years of extensive technical research and practical application, the Ordos Basin has achieved large-scale development and sustained production of tight gas [10,11]. In 2020, tight gas production in the Ordos Basin reached 430 × 108 m3, representing 90% of the national total, establishing it as China’s largest tight gas production base [9,12]. The accumulation of natural gas in this basin is primarily governed by lithological factors, following a pattern of initial tightness followed by reservoir formation. This often displays characteristics of extensive hydrocarbon generation and pervasive charging. The initial water saturation is high, and the pore structure, along with the distribution of gas and water, is intricate [13,14,15,16,17]. During gas reservoir development, most gas wells initially experience minimal water production. However, as reservoir pressure decreases, some wells transition to water production [13,18,19]. As a result, fluid flow shifts from gas-phase flow to a gas-water two-phase flow within tight reservoirs, increasing flow resistance. This results in a rapid decrease in production rates upon water breakthrough, significantly influencing gas reservoir recovery [20,21,22]. Therefore, understanding formation, water mobility, and transformation mechanisms during gas production is imperative [23,24].
The movable water saturation in tight reservoirs is a vital parameter that signifies water production capacity and is intricately linked to gas well water production characteristics [12,25,26]. In experimental research on formation water mobility, scholars often employ methods such as X-ray diffraction, scanning electron microscopy, and centrifugation combined with nuclear magnetic resonance [27,28,29]. For instance, Liu et al. [17] and Wang et al. [30] conducted nuclear magnetic resonance experiments to investigate the impact of microscopic pore structure on formation water mobility in tight reservoirs. They concluded that variations in throat types and the distribution of pore throat radii are the primary factors influencing the saturation of movable fluids. Su et al. [31] conducted the mobility of formation water and its influencing factors using nuclear magnetic resonance and X-ray whole-rock diffraction analysis. They classified the formation water as connate water, movable-connate water, and movable water. However, the connate water and movable-connate water referred to are solely associated with centrifugal force in their study. This primarily reflects the velocity-sensitive characteristics of formation water rather than representing connate water and movable connate water during reservoir development. Furthermore, Zhang et al. [32] found that movable water saturation is related to reservoir pore throats and clay mineral content. The greater the proportion of large pore throats and the lower the clay mineral content, the higher the movable water saturation. Previous experiments on formation water mobility mainly focused on the impact of pore throat structure and rock composition on connate water, and these methods were static, neglecting the dynamic variations of connate water. In theoretical research on formation water mobility, existing theoretical models for calculating connate water are also static [33]. For example, Cheng et al. [34] developed an irreducible water saturation model for hydrophilic rock by combining the capillary tube model with fractal theory. They found that at a certain temperature, the smaller the critical capillary radius is, the lower the irreducible water saturation is. However, their calculation model did not consider the change in formation water volume or pore volume during gas production, making it unable to predict changes in water saturation during the development process.
In this study, we considered the dynamic change of connate water during tight gas production and proposed a theoretical method for assessing the transformation of connate water into movable water. By combining the results of connate water and porosity stress sensitivity experiments on rock cores from the Dongsheng gas field, we evaluated the transformation ratio of connate water to movable water in different formations. This work provides theoretical guidance for evaluating reservoir water production risks.

2. Overview of Study Area

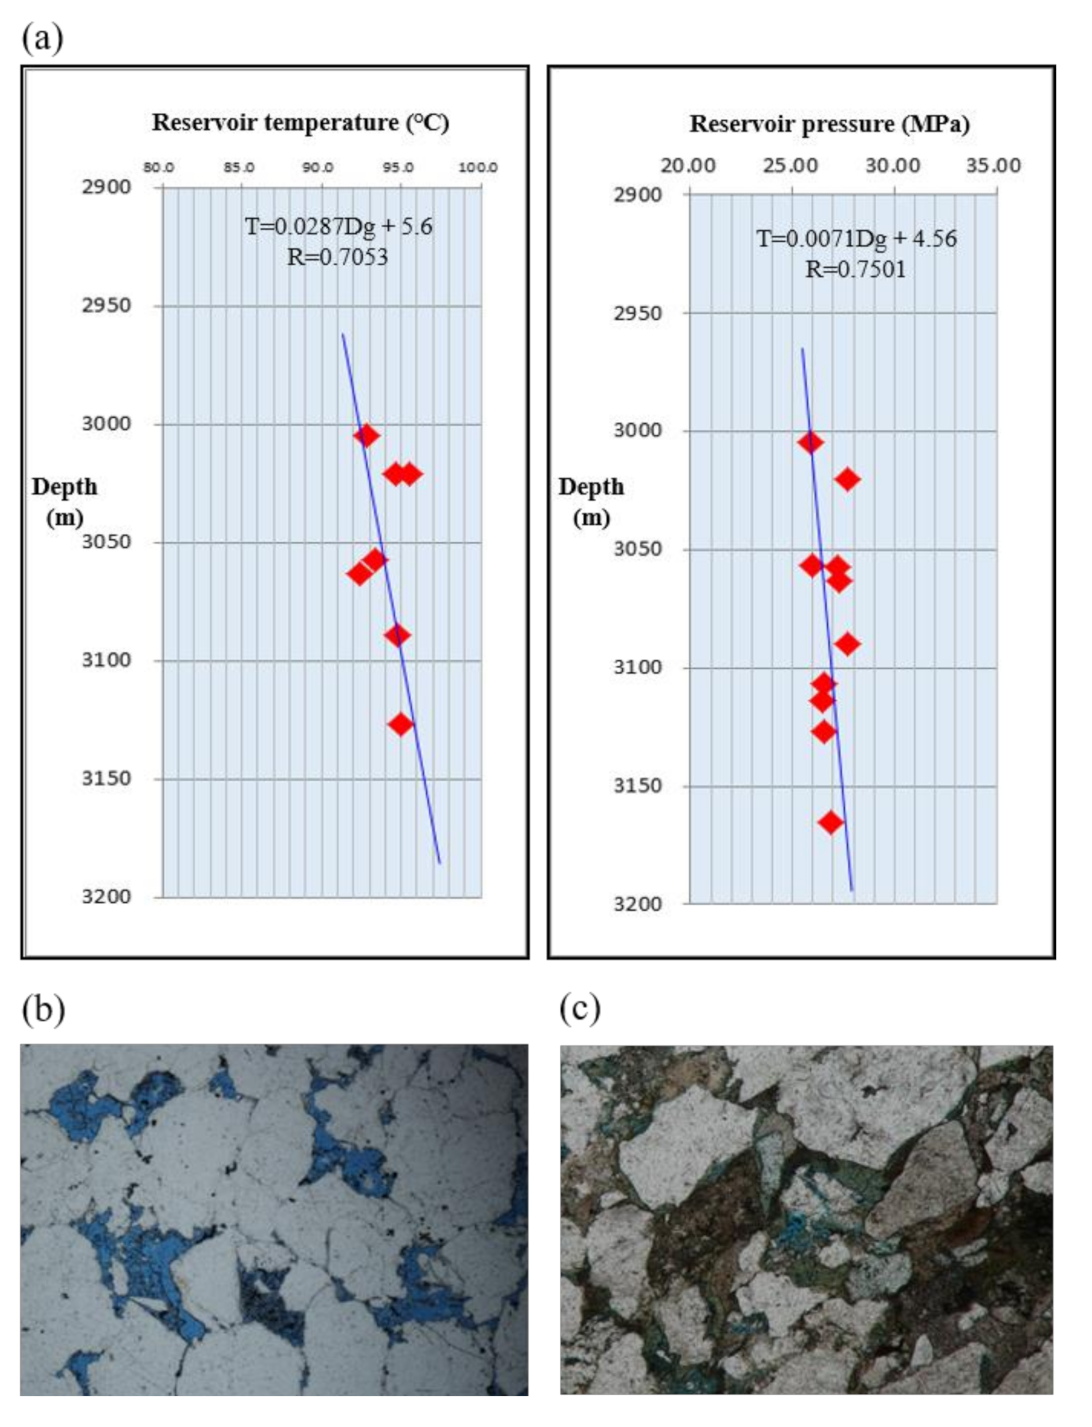
2.1. Geological Characteristics

The Jing 72 well area (key development area) of the Dongsheng gas field is located in the northern part of the Ordos Basin. In terms of regional tectonics, it sits at the junction of the Yishan Slope and the Yimeng Uplift, displaying a north-east high to south-west low topography. The northern part exhibits the development of the Bo’erjianghaizi fault, with a partially developed nose-shaped uplift. The overall tectonics within this area are generally gentle, without significant faulting (Figure 1). The primary target reservoir in this area is the first member of the lower Shihezi formation, with a stratigraphic depth ranging from 2800 to 3300 m and an average depth of 3000 m. This formation is primarily characterized by the development of braided river channels, point bars, and floodplain deposits, indicating a typical complex fluvial depositional environment. The geothermal gradient in this area is 2.87 °C/100 m (Figure 2a), falling within the normal geothermal gradient system. The formation pressure coefficient ranges from 0.82 to 0.89, with an average value of 0.86, placing it within the low-pressure to normal-pressure system (Figure 2b).

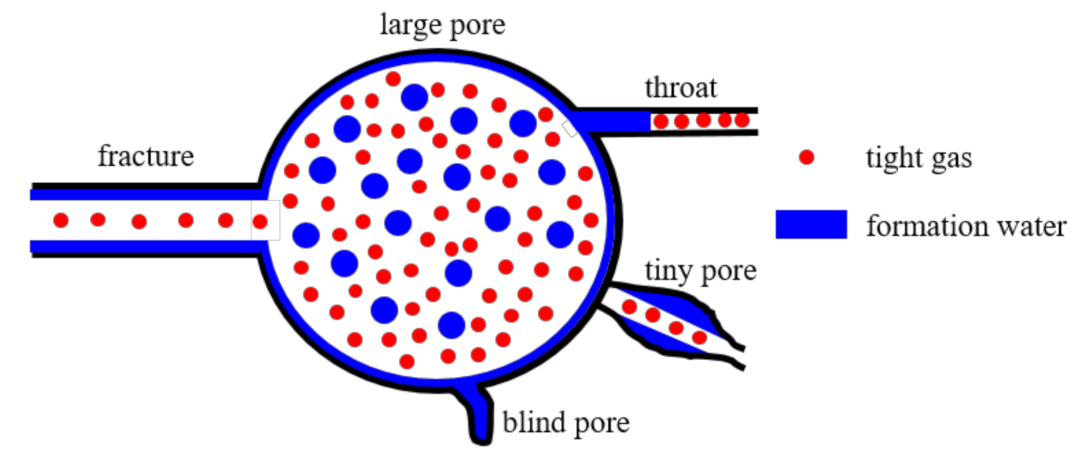
2.2. Pore-Throat Characteristics

Tight gas in the Dongsheng gas field is predominantly distributed in the first member of the lower Shihezi Formation. This sandstone reservoir displays well-developed secondary porosity, comprising two main types: dissolution pores and fractures. Among the dissolution pores, the prevailing types include intergranular pores, intragranular pores, grain boundary dissolution pores, and moldic pores, with intergranular and intragranular dissolution pores being the most predominant (as depicted in Figure 2b,c).
The results of mercury intrusion testing reveal an average drainage pressure of 1.39 MPa for the sandstone in the first member, with a median pressure of 17.6 MPa. The median pore radius measures 0.09 μm, while the sorting coefficient is 0.23 and the skewness coefficient is 2.39. Adhering to pore classification standards, the throats within the first member are primarily small to medium-sized, and the degree of pore tortuosity is notably pronounced. An examination of rock core porosity and permeability data reveals that porosity within the first member ranges from 5.0% to 18.72%, with permeability spanning from 0.15 to 6.47 mD. The average porosity stands at 9.2% and the average permeability at 0.58 mD, classifying these reservoirs as predominantly low to very low porosity with ultra-low permeability characteristics.

2.3. Formation Water Occurrence Characteristics

The primary source of water production in the Dongsheng gas field is pore water. Initially, there is no water production in the early stages of gas well operation, but significant water production occurs during the later stages of development. Formation water within tight reservoirs is classified into movable water and connate water based on their occurrence characteristics, as shown in Figure 3. Movable water is found in large pores, voids, and fractures, enabling it to move freely under specific pressure differentials. It is primarily located in reservoirs characterized by well-developed pore structures, such as the lower sections of the main channel structure, and in the form of lens-like permeable sand bodies. Connate water primarily exists in the corners of rock particle contacts, micropores, or is adsorbed onto the surface of rock framework particles. Due to its unique distribution state, this portion of water usually cannot move freely.

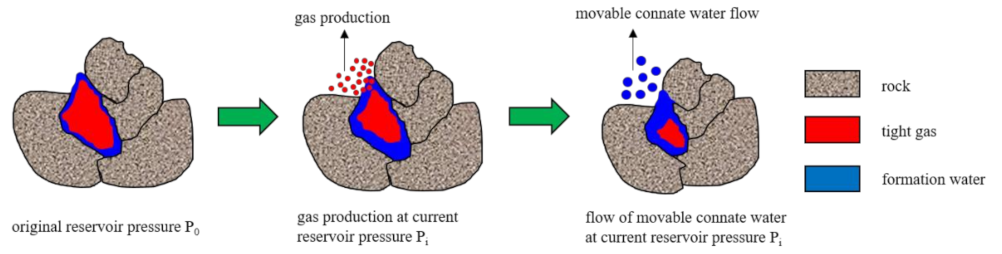
3. Transformation Mechanism of Connate Water to Movable Water

3.1. Transformation Mechanism

Tight sandstone reservoirs are water-wet, where the aqueous phase acts as the wetting phase, primarily occupying micropores and coating particle surfaces. In contrast, the gas phase serves as the non-wetting phase, predominantly distributed on the water-film surface within large and intermediate pores. In this study, we categorize connate water into three distinct types based on its occurrence state and stress conditions: bound water, pore-dead-end water, and water-film water. Bound water extensively adheres to mineral particle surfaces, forming a liquid film distribution pattern due to molecular forces between rock particles (clay minerals) and formation water. The formation of pore-dead-end water is primarily influenced by mechanical trapping in pore-dead-ends, with its primary controlling factor being the pore-throat structure characteristics of tight reservoirs. Both bound water and pore dead-end water cannot be produced during gas production and are collectively referred to as absolute connate water. Water-film water is distributed within the spaces controlled by tiny pores in tight reservoirs, displaying isolated or patchy distribution. Water-film water can be produced during the development process due to changes in fluid properties and reservoir stress, serving as a source of transition from connate water to movable water. Therefore, this type of water is also called movable connate water.
Figure 4 illustrates the transformation mechanism of connate water into movable water. During the development of a gas reservoir, as fluids are produced, reservoir pressure drops. Water-film water, adsorbed on the pore walls, expands and thickens. Driven by the energy of gas expansion and displacement pressure differential, it flows from high-pressure regions to low-pressure regions. Simultaneously, as reservoir pressure decreases, the effective stress in a tight reservoir increases, resulting in the deformation of the rock framework and a decrease in pore volume. This expansion of water-film water on pore surfaces releases a portion of connate water. Therefore, the mechanism by which connate water in tight sandstone reservoirs becomes movable water is primarily related to formation water expansion and rock stress sensitivity.

3.2. Theoretical Analysis

3.2.1. Model Assumptions

During the exploitation of the tight gas reservoir, as pore fluids are extracted, the reservoir pressure decreases, leading to an increase in effective stress within the rock framework, resulting in deformation. Rock deformation includes changes in both rock framework volume and pore volume. However, the volume changes in the rock framework are exceedingly small and negligible. Consequently, the total rock volume is considered constant throughout the development process. The deformation induced by increased effective stress primarily affects the pore volume. Furthermore, during the depressurization extraction process, pore-dead-end water influenced by pore structure and bound water governed by pore surface chemistry cannot be produced. Therefore, the saturation of absolute connate water in a tight reservoir remains unchanged.

3.2.2. Change of Water Saturation during the Depressurization Process

Formation water volume (Vw) under original reservoir pressure (P0) [33]:
V w = V ϕ 0 S w 0
where V is reservoir volume; ϕ 0 is the reservoir porosity at the original reservoir pressure P0; and S w 0 is the initial water saturation at the original reservoir pressure P0.
When the original reservoir pressure P0 decreases to the current reservoir pressure Pi, the volume of formation water expands. The expanded volume of formation water ( V w i ) is [34]:
V w i = V ϕ 0 S w 0 B w i B w 0
where Bw0 is the volume coefficient of formation water at the original reservoir pressure and Bwi is the volume coefficient of formation water at the current reservoir pressure Pi.
The reservoir water saturation (Swi) at the reservoir pressure Pi is [35]:
S w i = V w i V ϕ i = ϕ 0 S w 0 B w i B w 0 ϕ i
where ϕ i is the reservoir porosity at the current reservoir pressure Pi.

3.2.3. Evaluation of the Connate Water Transition to Movable Water

The saturation of movable connate water formed by the transition of connate water to movable water at the current reservoir pressure Pi can be expressed as:
S w m = S w i S w c 0 = ϕ 0 S w o B w i ϕ i B w 0 S w c 0
where ϕ i is the reservoir porosity at the current reservoir pressure Pi.

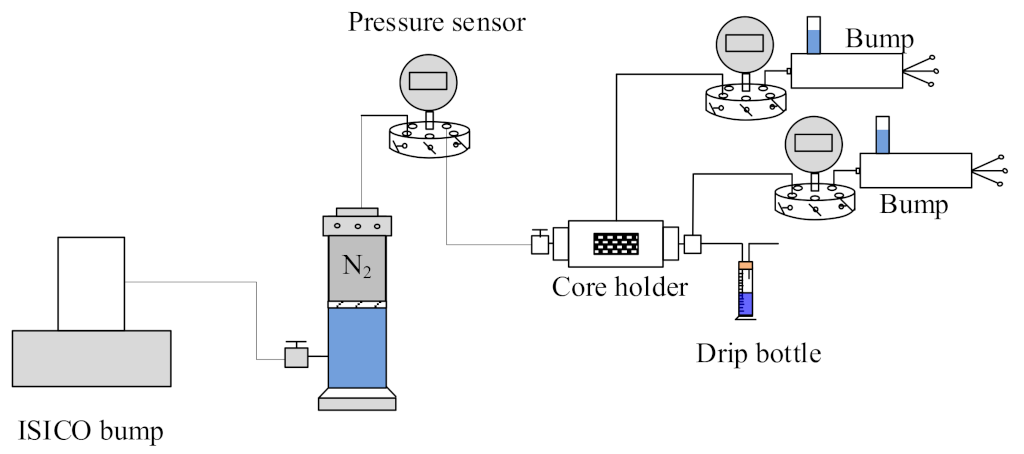
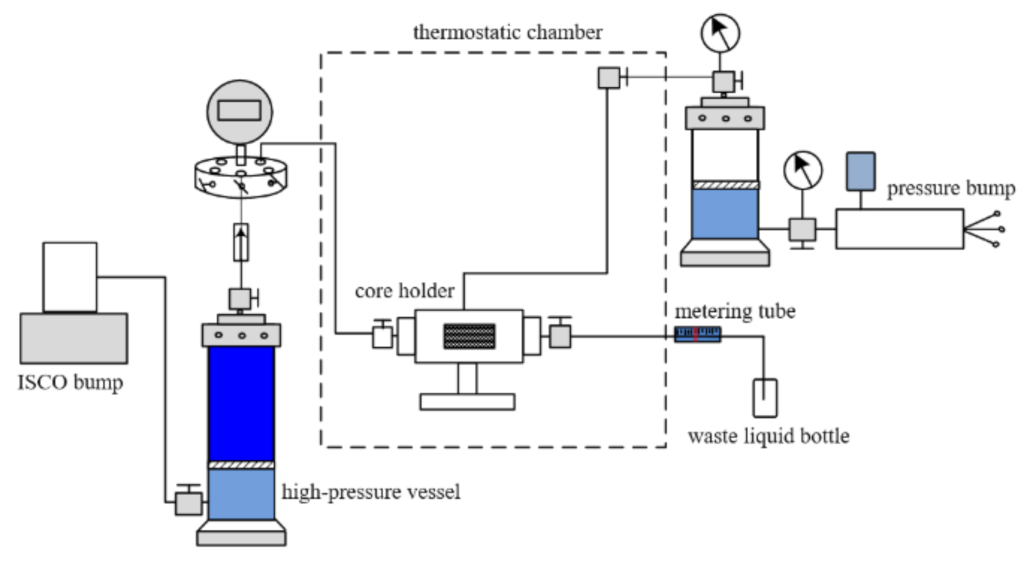
4. Experimental Methodology

To quantitatively evaluate the transformation of connate water into movable water in the Dongsheng gas field, we conducted experiments involving formation water expansion tests, connate water saturation, and porosity stress sensitivity tests at the reservoir conditions. These experimental data are experimental for theoretical calculations.

4.1. Formation Water Expansion Tests

The volume coefficient of formation water is a crucial parameter for evaluating the increase in movable water saturation. To determine the volume coefficient of formation water, we initially prepared 1000 milliliters of simulated formation water according to the formation water composition in this area (Table 1). Subsequently, we transferred 100 milliliters of prepared formation water into the PVT cylinder (Figure 5a). The PVT cylinder was heated to the reservoir temperature of 90 ℃, and the volume coefficients of formation water at different pressures were tested. Figure 5b illustrates the change in volume coefficient of formation water at different pressures and 90 ℃. As the pressure decreases from 32 MPa to 0.1 MPa, the volume coefficient of formation water increases from 1.0359 to 1.0456.

4.2. Connate Water Tests

For connate water tests, representative rock cores were from the first member of the lower Shihezi formation of the Dongsheng gas field, located in the Ordos Basin. These rock cores underwent essential treatments, including washing, salt removal, and drying, to determine their basic properties (as summarized in Table 2). The experiments used formation water prepared according to Table 1, and the gas was methane with a purity of 99.99%. The experimental temperature was set at 90 °C.
Figure 6 shows the experimental setup for determining the volume coefficient of formation water. The experimental procedure mainly consisted of the following steps: (1) Saturation of the dry rock cores with formation water, followed by placement into the core holder. (2) Injection of constant pressure N2 to displace formation water in the rock cores. The water saturation of the rock cores at this pressure was calculated after weighing them when the formation water volume in the drip bottle remained constant. (3) Incremental pressure adjustments with N2 and the repetition of the previous steps.

4.3. Porosity Stress Sensitivity Tests

After connate water saturation tests, the rock cores were redried in preparation for porosity stress sensitivity tests. The experimental setup is shown in Figure 7, and the experimental conditions were the same as those for connate water saturation testing.
The experimental procedure primarily included the following steps: (1) The rock cores, saturated with fully saturated formation water, are placed in the core holder and maintained at a constant temperature of 90 °C for 10 h. (2) Under constant pressure and speed, the pump displaces the formation water, and the rock cores saturated with formation water are positioned in the core holder with the downstream pipeline filled with formation water up to the visible scale of the horizontal transparent pipe, and the scale readings are recorded. (3) Confining pressure is gradually increased (2, 4,… 40 MPa) using a hand pump. Each pressure point is stabilized for 2 h, and pressure stability is achieved when pressure changes are less than 0.005 MPa every 5 min. The scale reading of the formation water in the measuring tube is noted at this time to determine the volume of discharged water at this pressure. (4) The pore volume and porosity of the rock cores at different pressures were then calculated.

5. Results and Discussion

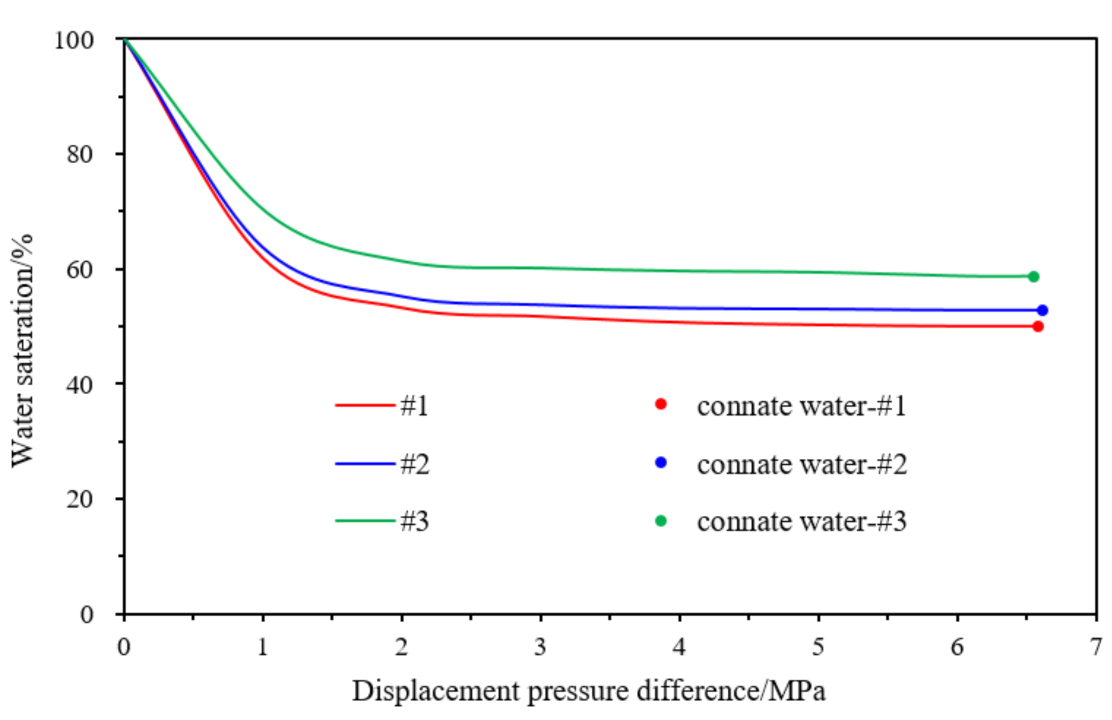
5.1. The Results of the Connate Water Test

The variation of water saturation in different rock cores with displacement pressure differences is shown in Figure 8. The experimental results show that in the low displacement pressure difference stage, as the displacement pressure difference increases, the gas flow rate increases, more water molecules flow out of the pores, and the water saturation decreases. The formation water extracted during this stage is film water, which is also the main source of water production in the initial production stage of the gas field. When the easily flowing film water is completely extracted, continuing to increase the displacement pressure difference (when the displacement pressure difference is greater than 5 MPa), the adsorbed water on the surface of the particles and the water at the corners and blind ends of the pores are difficult to flow, and the water saturation of the rock core remains basically unchanged. This is the connate water saturation under the original in situ stress conditions. Furthermore, it is noteworthy that higher pore permeability correlates with lower connate water saturation under the original in-situ stress conditions, with the connate water saturation within this block typically ranging from 52% to 58%.

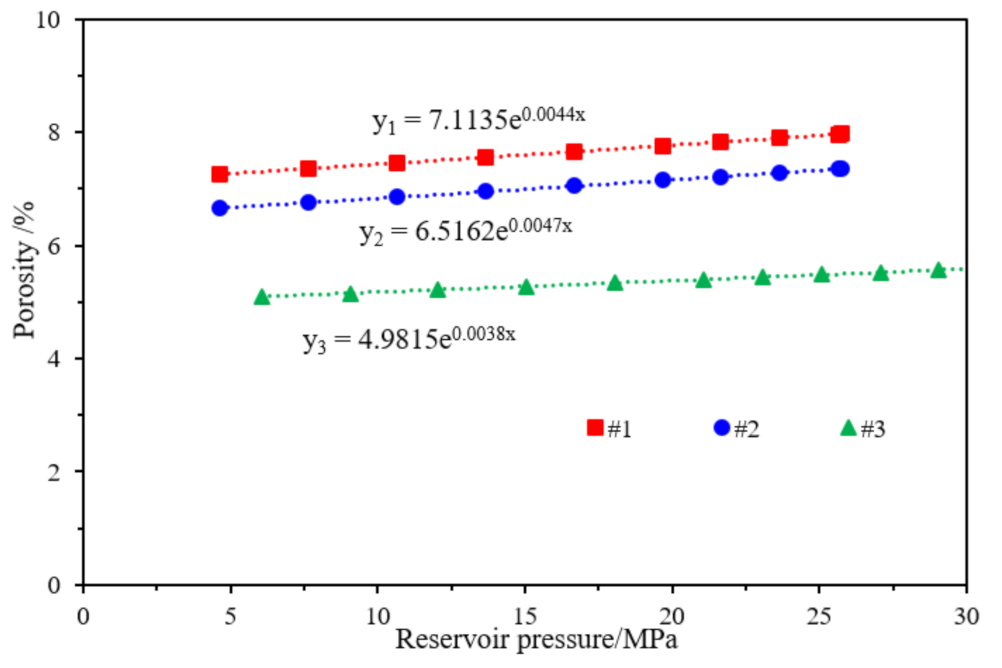
5.2. The Results of Porosity Stress Sensitivity

Figure 9 displays the changes in rock porosities with reservoir pressure variations. The experimental results indicate that porosity decreases with a decrease in reservoir pressure. This phenomenon occurs due to the increase in effective stress within the reservoir during gas production, resulting in the compression of the rock skeleton and a decrease in porosity. We have compared the accuracy of different functions to fit the relationship between porosity and reservoir pressure and find that the exponential correlation has the highest accuracy (R2 = 0.99). Hence, we employ an exponential relationship to fit the curve depicting the relationship between porosity and pressure, as follows:
ϕ i = ϕ 0 e α p p 0 p i
where α p is porosity stress sensitivity coefficient, MPa−1.
Utilizing equation (5), we fitted the porosity-pressure variation curves for various rock cores, achieving a fitting accuracy of R2 = 0.99. Comparing the results of porosity sensitivity tests among different rock cores, we observed that rock cores with larger initial porosity experience a greater reduction in porosity during pressure decrease, leading to higher porosity stress sensitivity coefficients. This phenomenon is related to reservoir compaction. A larger initial porosity corresponds to a looser rock framework, resulting in a more significant compaction effect and a larger porosity compressibility coefficient.

5.3. Analysis of the Connate Water Transition to Movable Water

Based on the experimental results of connate water saturation (Figure 8) and porosity stress sensitivity (Figure 9), in conjunction with Equations (3) and (4), we calculated the dynamic variation of water saturation in different stratigraphic cores during the development process, as depicted in Figure 10a. The graphs clearly demonstrate that connate water saturation increases as reservoir pressure decreases. Taking core 1 as an example, as reservoir pressure decreases from 25 MPa to 10 MPa, connate water saturation increases from 3% to 5%, with an increment of 2%. This increment represents the proportion of connate water transitioning into movable water, referred to as movable connate water saturation. During the pressure reduction, core 1 reaches a maximum movable connate water saturation of 5%. Therefore, the dynamic variation of reservoir connate water saturation during development should not be neglected, as it constitutes a primary reason for the lack of water production in the early stages of gas reservoirs and the subsequent significant water production in the later stages.
Figure 10b further contrasts the variations in movable connate water saturation during pressure reduction among rock cores with different initial porosities. We find that the poorer the reservoir’s pore-permeability characteristics, the more pronounced the variations. Furthermore, this diagram can be used to determine the zones where formation water is in the movable water zone, movable connate water zone, and absolute connate water zone in reservoirs with similar pore-permeability characteristics during the development process. For different reservoirs, employing the theoretical methods and experimental tests proposed by us can also achieve the aforementioned objectives.

6. Conclusions

In this study, we proposed a theoretical method for assessing the transformation of connate water into movable water. By combining the results of connate water tests and porosity stress sensitivity tests conducted on rock cores from the Dongsheng gas field, we calculated the transformation ratio of connate water to movable water in various types of gas-bearing formations. This work provides theoretical guidance for evaluating reservoir water production risks. However, it is worth noting that the experimental work in the proposed method is enormous, and the extremely low permeability of tight cores increases the time for connate water testing (about 2 weeks for every rock core). Finding a way to shorten the experimental cycle is a challenge that must be solved in the future. The key insights of this work are as follows:
(1)
The transformation mechanism of connate water into movable water involves the expansion of connate water films and the compression of pore volume due to the reduction of reservoir pressure. Both processes collectively promote the conversion of connate water to movable water;
(2)
Gas-water displacement experiments under reservoir conditions indicate that the Dongsheng gas field in the Ordos Basin exhibits high connate water saturation characteristics, with a connate water saturation ranging from 50.09% to 58.5%. For reservoir rocks, the sensitivity of porosity stress to pressure follows an exponential relationship during the realistic simulation of pressure reduction in production;
(3)
By combining laboratory experiments and theoretical calculations, an evaluation method for the transformation of connate water into movable water was established. During the development process, the range of increased movable water saturation is between 6.1% and 8.4%. Moreover, the poorer the pore-permeability characteristics, the more pronounced the variations.

Author Contributions

Conceptualization, F.C., Z.W. and A.L.; methodology, F.C., Z.W. and S.F.; software, Z.W. and J.Z.; validation, F.C., Z.W. and A.L.; formal analysis, F.C. and S.F.; investigation, F.C. and Z.W.; resources, A.L. and F.C.; data curation, F.C. and S.F.; writing—original draft preparation, F.C.; writing—review and editing, Z.W. and J.Z.; supervision, A.L. and J.Z.; project administration, F.C. and S.F.; funding acquisition, J.Z. All authors have read and agreed to the published version of the manuscript.

Funding

We gratefully acknowledge the generous support from the National Natural Science Foundation of China (No. 52174051), the Excellent Young Scholars of Shandong Province (No. 2022HWYQ-072), and the Guanghua Scholars of China University of Petroleum (East China) (No. 20210002).

Data Availability Statement

No new data were created or analyzed in this study. Data sharing is not applicable to this article.

Conflicts of Interest

The authors declare that they have no known competing financial interests or personal correlations that could have appeared to influence the work reported in this paper.

References

  1. Akilu, S.; Padmanabhan, E.; Sun, Z. A review of transport mechanisms and models for unconventional tight shale gas reservoir systems. Int. J. Heat Mass Transf. 2021, 175, 121125. [Google Scholar] [CrossRef]
  2. Hu, X.; Wang, J.; Zhang, L.; Xiong, H.; Wang, Z.; Duan, H.; Yao, J.; Sun, H.; Zhang, L.; Song, W.; et al. Direct Visualization of Nanoscale Salt Precipitation and Dissolution Dynamics during CO2 Injection. Energies 2022, 15, 9567. [Google Scholar] [CrossRef]
  3. Ding, J.; Yang, S.; Nie, X.; Wang, Z. Dynamic threshold pressure gradient in tight gas reservoir. J. Nat. Gas Sci. Eng. 2014, 20, 155–160. [Google Scholar] [CrossRef]
  4. Asghar, Z.; Ali, N.; Javid, K.; Waqas, M.; Khan, W.A. Dynamical interaction effects on soft-bodied organisms in a multi-sinusoidal passage. Eur. Phys. J. Plus 2021, 136, 693. [Google Scholar] [CrossRef]
  5. Wang, L.; Wang, S.; Zhang, R.; Wang, C.; Xiong, Y.; Zheng, X.; Li, S.; Jin, K.; Rui, Z. Review of multi-scale and multi-physical simulation technologies for shale and tight gas reservoirs. J. Nat. Gas Sci. Eng. 2017, 37, 560–578. [Google Scholar] [CrossRef]
  6. Wang, Z.; Ding, K.; Liu, T.; Yao, J.; Sun, H.; Yang, Y.; Zhang, L.; Song, W.; Zhang, K.; Zhong, J. Minireview of Microscopic CO2 Interactions with Fluids and Minerals in Shale: Advances and Outlook. Energy Fuels 2023, 37, 9895–9913. [Google Scholar] [CrossRef]
  7. Zou, C.; Yang, Z.; He, D.; Wei, Y.; Li, J.; Jia, A.; Chen, J.; Zhao, Q.; Li, Y.; Yang, S. Theory, technology and prospects of conventional and unconventional natural gas. Pet. Explor. Dev. 2018, 45, 575–587. (In Chinese) [Google Scholar] [CrossRef]
  8. Qin, S.; Li, F.; Li, W.; Zhou, Z.; Zhou, G. Formation mechanism of tight coal-derived-gas reservoirs with medium-low abundance in Xujiahe Formation, central Sichuan Basin, China. Mar. Pet. Geol. 2018, 89, 144–154. [Google Scholar] [CrossRef]
  9. Jia, A.; Wei, Y.; Guo, Z.; Wang, G.; Meng, D.; Huang, S. Development status and prospect of tight sandstone gas in China. Nat. Gas Ind. 2022, 42, 83–92. (In Chinese) [Google Scholar] [CrossRef]
  10. Wang, H.; Cui, Y.; Liu, X.; Qiang, Z.; Wang, S. Multi-layer horizontal wells development for tight sandstone gas reservoir: Case study of tight gas reservoir model zone in Ordos Basin. Nat. Gas Geosci. 2021, 32, 472–480. (In Chinese) [Google Scholar]
  11. Gao, J.; Ma, B.; Lu, Y.; Zhang, W.; Cao, Q. Origin of authigenic kaolinite with implications for Permian tight gas sandstone reservoirs in the northern Ordos Basin, central China. J. Nat. Gas Sci. Eng. 2022, 99, 104429. [Google Scholar] [CrossRef]
  12. Tian, J.; Qin, C.; Kang, Y.; You, L.; Jia, N.; Song, J. Reasons for low flowback behaviors of water-based fluids in tight sandstone gas reservoirs. J. Pet. Sci. Eng. 2023, 220, 111152. [Google Scholar] [CrossRef]
  13. Wang, R.; Liu, K.; Shi, W.; Qin, S.; Zhang, W.; Qi, R.; Xu, L. Reservoir Densification, Pressure Evolution, and Natural Gas Accumulation in the Upper Paleozoic Tight Sandstones in the North Ordos Basin, China. Energies 2022, 15, 1990. [Google Scholar] [CrossRef]
  14. Zhang, Y.; Jiang, S.; He, Z.; Wang, Y.; Guo, M.; Zhu, G.; Cai, D.; Lu, S.; Xiao, D.; Li, Y.; et al. Characteristics of heterogeneous diagenesis and modification to physical properties of Upper Paleozoic tight gas reservoir in eastern Ordos Basin. J. Pet. Sci. Eng. 2022, 208, 109243. [Google Scholar] [CrossRef]
  15. Zheng, D.; Pang, X.; Jiang, F.; Liu, T.; Shao, X.; Huyan, Y. Characteristics and controlling factors of tight sandstone gas reservoirs in the Upper Paleozoic strata of Linxing area in the Ordos Basin, China. J. Nat. Gas Sci. Eng. 2020, 75, 103135. [Google Scholar] [CrossRef]
  16. Yin, X.; Jiang, S.; Chen, S.; Wu, P.; Gao, W.; Gao, J.; Shi, X. Impact of rock type on the pore structures and physical properties within a tight sandstone reservoir in the Ordos Basin, NW China. Pet. Sci. 2020, 17, 896–911. [Google Scholar] [CrossRef]
  17. Liu, G.; Xie, S.; Tian, W.; Wang, J.; Li, S.; Wang, Y.; Yang, D. Effect of pore-throat structure on gas-water seepage behaviour in a tight sandstone gas reservoir. Fuel 2022, 310, 121901. [Google Scholar] [CrossRef]
  18. Zhou, S.; Zhou, Y.; Shi, J.; Zhu, Y.; Xiao, W.; Zhang, R. Micropore structure and water driving characteristics of tight sandstone reservoirs in Ordos Basin. J. Pet. Explor. Prod. Technol. 2022, 12, 601–612. [Google Scholar] [CrossRef]
  19. Xiangdong, Y.; Jiang, S.; YanLu, L.; Wei, G.; Jungang, L.; Peng, W.; Litao, M. Impact of pore structure and clay content on the water-gas relative permeability curve within tight sandstones: A case study from the LS block, eastern Ordos Basin, China. J. Nat. Gas Sci. Eng. 2020, 81, 103418. [Google Scholar] [CrossRef]
  20. Wu, W.; Wei, X.; Zhao, X.; Li, N.; Lu, X.; Chen, J. Controlling Factors of Gas-Bearing Properties in Permian Tight Sandstone Based on Sealing Corings, Sulige Gas Field, Ordos Basin, Northern China. Front. Phys. 2022, 10, 833691. [Google Scholar] [CrossRef]
  21. Cai, J.; Zhao, L.; Zhang, F.; Wei, W. Advances in multiscale rock physics for unconventional reservoirs. Adv. Geo-Energy Res. 2022, 6, 271–275. [Google Scholar] [CrossRef]
  22. Ren, D.; Wang, X.; Kou, Z.; Wang, S.; Wang, H.; Wang, X.; Tang, Y.; Jiao, Z.; Zhou, D.; Zhang, R. Feasibility evaluation of CO2 EOR and storage in tight oil reservoirs: A demonstration project in the Ordos Basin. Fuel 2023, 331, 125652. [Google Scholar] [CrossRef]
  23. Gao, Q.; Han, S.; Cheng, Y.; Shi, X.; Yan, C.; Han, Z. Flow-coupled-geomechanical modelling of CO2 transport in depleted shale from a microscopic perspective. Energy 2022, 257, 124727. [Google Scholar] [CrossRef]
  24. Wu, X.; Pu, H.; Zhu, K.; Lu, S. Formation damage mechanisms and protection technology for Nanpu nearshore tight gas reservoir. J. Pet. Sci. Eng. 2017, 158, 509–515. [Google Scholar] [CrossRef]
  25. Wang, W.; Yue, D.; Eriksson, K.A.; Liu, X.; Liang, X.; Qu, X.; Xie, Q. Qualitative and quantitative characterization of multiple factors that influence movable fluid saturation in lacustrine deep-water gravity-flow tight sandstones from the Yanchang Formation, southern Ordos Basin, China. Mar. Pet. Geol. 2020, 121, 104625. [Google Scholar] [CrossRef]
  26. Meng, M.; Shen, Y.; Ge, H.; Xu, X.; Wu, Y. The Effect of Fracturing Fluid Saturation on Natural Gas Flow Behavior in Tight Reservoirs. Energies 2020, 13, 5278. [Google Scholar] [CrossRef]
  27. Liu, D.; Sun, W.; Ren, D. Experimental Investigation of Pore Structure and Movable Fluid Traits in Tight Sandstone. Processes 2019, 7, 149. [Google Scholar] [CrossRef]
  28. Gao, H.; Li, H.A. Pore structure characterization, permeability evaluation and enhanced gas recovery techniques of tight gas sandstones. J. Nat. Gas Sci. Eng. 2016, 28, 536–547. [Google Scholar] [CrossRef]
  29. Wu, J.; Yang, S.; Gan, B.; Cao, Y.; Zhou, W.; Kou, G.; Wang, Z.; Li, Q.; Dong, W.; Zhao, B. Pore Structure and Movable Fluid Characteristics of Typical Sedimentary Lithofacies in a Tight Conglomerate Reservoir, Mahu Depression, Northwest China. ACS Omega 2021, 6, 23243–23261. [Google Scholar] [CrossRef]
  30. Wang, T.; Zhang, D.; Wang, X.; Wang, Z.; Zhang, W.; Sun, W.; Ma, M.; Liu, D. Characterization of Movable Fluid Distribution in Tight Oil Reservoirs by NMR and Centrifugation. Geofluids 2023, 2023, 1668663. [Google Scholar] [CrossRef]
  31. Su, Y.; Li, D.; Li, L.; Gao, X.; Zhuang, X.; Fu, J. Formation Water Mobility and Influencing Factors in Tight Sandstone Gas Reservoir. Spec. Oil Gas Reserv. 2020, 27, 118–122. (In Chinese) [Google Scholar]
  32. Zhang, J.; Li, X.; Shen, W.; Gao, S.; Liu, H.; Ye, L.; Fang, F. Study of the Effect of Movable Water Saturation on Gas Production in Tight Sandstone Gas Reservoirs. Energies 2020, 13, 4645. [Google Scholar] [CrossRef]
  33. Su, Y.; Fu, J.; Li, L.; Wang, W.; Zafar, A.; Zhang, M.; Ouyang, W. A new model for predicting irreducible water saturation in tight gas reservoirs. Pet. Sci. 2020, 17, 1087–1100. [Google Scholar] [CrossRef]
  34. Cheng, Y.; Zhang, C.; Zhu, L. A fractal irreducible water saturation model for capillary tubes and its application in tight gas reservoir. J. Pet. Sci. Eng. 2017, 159, 731–739. [Google Scholar] [CrossRef]
  35. Fang, J.; Guo, P.; Xiao, X.; Du, J.; Dong, C.; Xiong, Y.; Long, F. Gas-water relative permeability measurement of high temperature and high pressure tight gas reservoirs. Pet. Explor. Dev. 2015, 42, 92–96. [Google Scholar] [CrossRef]
Figure 1. Structural map of the Jin 72 well area of the Dongsheng gas field.
Energies 16 06961 g001
Figure 2. Temperature and pressure characteristics and typical secondary pores of the Xiashihezi formation. (a) The changes in temperature and pressure at different formation depths. (b) Intergranular pores. (c) Intragranular pores.
Energies 16 06961 g002
Figure 3. Schematic of formation water distribution.
Energies 16 06961 g003
Figure 4. Mechanism of connate water becoming movable water.
Energies 16 06961 g004
Figure 5. Formation water volume coefficient tests. (a) Formation fluid PVT instrument. (b) Volume coefficient of formation water at different pressures and 90 °C.
Energies 16 06961 g005
Figure 6. Experimental device of formation water volume coefficient.
Energies 16 06961 g006
Figure 7. Experimental device of porosity stress-sensitive.
Energies 16 06961 g007
Figure 8. Relationship between the water saturation of rock cores and the displacement pressure difference.
Energies 16 06961 g008
Figure 9. Relationship between different rock core porosities and formation pressure.
Energies 16 06961 g009
Figure 10. Connate water in different rock cores changes to movable connate water. (a) #1 core connate water changes to movable connate water. (b) Movable connate water saturation of different rock cores under different reservoir pressures.
Energies 16 06961 g010
Table 1. Formation composition in the first member formation.
Ion Content (mg/L)Salinity (mg/L)Density
(g/cm3)
Water Type
Na+ and K+Ca2+Mg2+ClHCO3SO42−
7615.388301.89277.924,202.52156.92439.6141,714.961.04CaCl2
Table 2. Rock core basic physical properties.
Core NumberLength/cmDiameter/cmPorosity/%Permeability/mDOverlying Rock Pressure/MPaReservoir Pressure/MPa
#15.5132.4597.9670.061359.6525.75
#25.5892.4687.3510.041759.6525.75
#34.9332.4825.5970.007561.0330.71
Disclaimer/Publisher’s Note: The statements, opinions and data contained in all publications are solely those of the individual author(s) and contributor(s) and not of MDPI and/or the editor(s). MDPI and/or the editor(s) disclaim responsibility for any injury to people or property resulting from any ideas, methods, instructions or products referred to in the content.

