Abstract
Faced with environmental issues and depleting oil reserves, engine research is venturing into novel paths, such as the dual-fuel engine. This has motivated the development of numerical models that provide highly accurate predictive tools. In this context, 0D/quasi-D modeling is necessary, with a compromise between control of computation time and acceptable prediction level, which will certainly enable the various studies on the dual fuel mode to be explored at reduced cost. The aim of the present study is to develop a combustion model adapted to the hydrogen-natural gas (HNG)/diesel dual fuel engine to ensure 0D/1D simulations over a wide load range and under different gas mixture compositions. This model is based on the separation of the different types of combustion in this mode, by first treating the combustion of the pilot fuel by jet modeling, then the combustion of the gas mixture (HNG) by a mathematical model based on the Gaussian function. This phase separation is carefully combined with a mathematical treatment of the heat release rate, in order to determine ignition delays for both phases and model each of them separately. The modeling approach unveiled in this work is based on a phenomenological aspect, where the distinction between pilot and primary fuel combustion is ensured with phase separation allowing precise monitoring of the combustion sequence with the detection of the start and end of each phase and the contribution of each to the overall heat release rate. The results confirm the predictive power of the model developed with a maximum error of around 2%. This accurate prediction is particularly evident at high loads with high hydrogen enrichment, where the combustion sequence becomes complicated.
1. Introduction
Global primary energy consumption increased by 5.52% in 2021. Most of the consumption growth came from gasoline (1.8 million barrels/d) and diesel (1.3 million barrels/d), according to the bp Statistical Review of World Energy in June 2022. Based on the same study, oil remains by far the main source of energy consumed in the world (30.9% of global primary energy consumption in 2021), and global emissions related to energy consumption increased by 5.7% in 2021 (compared to an average of 1.1% per year over the last decade) [1]. In front of these statistics, the diesel engine presents itself with a huge contribution in terms of CO2, NOx, and soot which require special treatment [2,3].
The balance between environmental and economic aspects of resource conservation is crucial, according to Karim [4]. This can be achieved by using a variety of natural and processed gaseous fuels. The dual-fuel engine presents an optimal solution for this problem since it is characterized by operation with a small amount of diesel and a greater amount in energy terms of a hydrocarbon fuel (LPG, NG) [5], which further reduces CO2 and NOx emissions [6]. An important reason that attracted the tension of researchers to this alternative [7,8,9,10,11].
To study the behavior of motors operating in different modes, experimental or numerical simulations must be carried out [12,13], a wide range of precision is possible using numerical tools from 0D to 3D. This accuracy is accompanied imperatively by an increase in the calculation cost [14].
In general, 3D models better describe the internal phenomena that take place in the combustion chamber, based on the resolution of the Navier–Stokes equations [15,16], but they are characterized by a very high cost. Jafari et al. [17] used a 3D-CFD simulation tool based on a chemical kinetic mechanism to investigate the influence of the quantity of primary gas introduced into a dual fuel engine. The results confirm the decrease in cylinder pressure as a function of the increase in the proportion of gaseous fuel (methane) due to the delay in the main combustion phase until the expansion stroke. Singh et al. [18], Zhang et al. [19], and Dimitriou et al. [20] conducted studies aimed at elucidating the concept and phenomenology of dual fuel engines. They achieved this by analyzing the performance and fluctuations of thermodynamic parameters within the combustion chamber.
The 0D models are based mainly on the laws of thermodynamics and semi-empirical relationships describing fuel injection and piston cinematics. These models are characterized by remarkable simplicity and minimal computation time, but they did not in any way provide the detail of combustion in the combustion chamber with a questionable degree of predictivity [21].
Xu et al. [22] developed a model based on a triple Wiebe function [23] to characterize and model experimental combustion results specific to dual fuel operation. The auto-ignition delay and injection time are determined by an iterative calculation based on the start of combustion and a predictive correlation for the auto-ignition delay. A four-stage combustion mechanism was discussed in this work for which it is shown that a triple Wiebe function can model combustion in dual fuel mode with all its steps.
Liu and Karim [24] have implemented detailed kinetic schemes describing combustion in dual fuel engines based on a multi-zone thermodynamic model. The interaction between the pilot fuel and the air–gas mixture is provided by a reaction zone that describes the partial oxidation of the diesel-air–gas mixture. Papagiannakis et al. [25,26], and Walther et al. [27] introduced a balance between model predictions and computational efficiency by formulating a quasi-dimensional model for the dual fuel mode. In this approach, the injected pilot fuel is sequentially partitioned along the jet’s growth direction into multiple increments. Within this model, the combustion of the air–gas mixture is addressed using a two-zone methodology, guided by the flame propagation speed that is characteristic of the mixture composition.
Pohekar et al. [28], Krishnan et al. [29], and Millo et al. [30] have drawn analogies between multi-zone diesel jet models [31,32] and models dealing with the HCCI mode [33,34]. Combining several aspects of conventional engine combustion, the model can follow the various stages of combustion in dual-fuel mode, starting with auto-ignition of the pilot fuel, then combustion of this fuel after atomization, and finally combustion of the primary gas by turbulent flame propagation. To achieve this, the combustion chamber is divided into an unburnt zone, a burnt zone, several pilot fuel zones to model evaporation and auto-ignition, and a flame zone for primary gas combustion. This modeling aims to follow the various combustion phases in detail to reproduce the engine’s pressure and HRR signals.
Analysis of the existing literature clearly shows that few models deal with combustion in dual fuel mode, although this mode has been shown to offer a very good compromise between performance and emissions. This makes it an excellent replacement for the conventional diesel engine, which has come under too much threat recently because of its emissions, which are harmful to the environment [35].
Unfortunately, most existing 0D/quasi-D models are unable to describe dual fuel combustion. Furthermore, they cannot draw an analogy with the phenomenology of combustion in dual fuel mode. Recognizing the significance of this aspect is essential for the comprehensive analysis and predictive investigation of this mode. This non-predictability of existing models increases with air–gas mixtures of deferent compositions, for which the HRR curve is unconventional, especially at high loads, where most existing models are unable to model it with reasonable error.
The model presented was developed to distinguish the two main phases of combustion in dual fuel mode. The first phase is treated by a quasi-dimensional model, inspired by the model of Hiroyasu et al. [36,37], controlled by the pilot fuel combustion. Whereas, the second phase, controlled by the gas mixture combustion, is treated by a new mathematical approach based on Gaussian modeling. Each phase is treated separately, taking into account the interaction between the two and carefully determining the auto-ignition delay of the pilot fuel and the ignition delay of the air–gas mixture. Subsequently, the reliability of the developed model is extensively validated for the HNG/diesel dual fuel mode according to engine loads for different primary gas compositions in terms of hydrogen percentage.
The different parts of this paper describe firstly the developed model, inspired by the analogy with the phenomenology of the dual fuel engine, then present the different results of the validation and application on an HNG/diesel dual fuel case. In the end, a discussion is presented, followed by the main conclusions and perspectives.
2. Engine Setup
The experimental results used in this work for modeling are derived from engine tests carried out on a LISTER-PETTER (TS1) single-cylinder diesel engine test bench (Figure 1), air-cooled, designed to operate at speeds between 0–2500 rpm, where a maximum power of 7.4 kW was developed. Table 1 summarizes the various technical features of this engine.
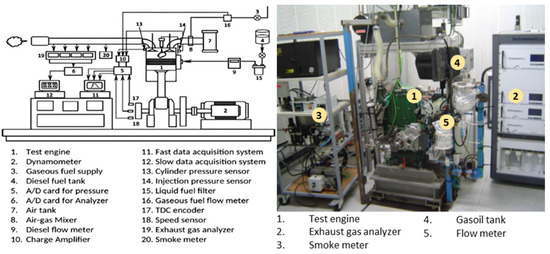
Figure 1.
Detailed representation of the experimental installation.

Table 1.
Engine main features.
To achieve the experiments under dual fuel mode, the engine was modified. To remain within the framework of operation in the dual fuel standard (10% of the rated power is provided by the pilot fuel), the amount of pilot fuel injected at 13° before the TDC was set at 5 g/min covering 0.45 kW.
Combustion performance was evaluated for the various operating cases, which are controlled by load (20, 40, 60, and 80% of full load) and hydrogen concentration in the combustion chamber (35, 40, 45, and 50% by volume). A motor stabilization technique is performed at each measurement as explained in the work of Benbellil et al. [38].
3. Methodology
Figure 2 shows a conventional case of the HRR for a dual fuel mode. The curve shown is a typical illustration of the dual fuel mode in which the HRR is mainly controlled by two phases. The first is controlled by the pilot fuel combustion while the second is controlled by the air–gas mixture combustion.
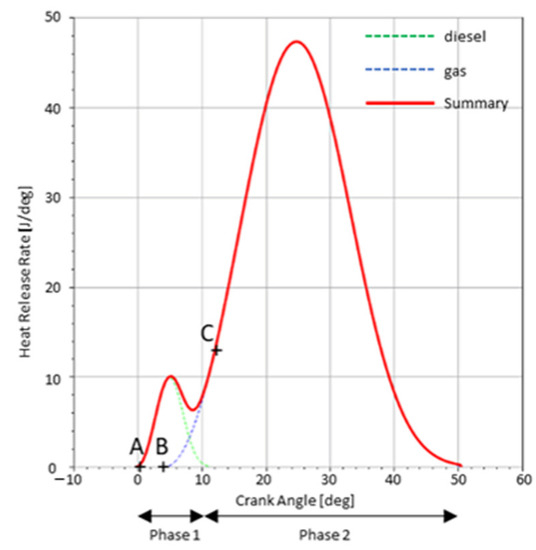
Figure 2.
Illustrative HRR in dual fuel mode.
According to the analogy with the phenomenology of this mode, a hybrid model is proposed based on the modeling of each phase separately, which requires a separation of the phases, (Figure 2); the first phase of diesel combustion and the second phase of gas mixture combustion.
In the proposed approach, the first phase was modeled by a new quasi-dimensional jet model based on the development of the spray in the combustion chamber in the injection direction, taking into consideration its auto-ignition delay. While the second phase was processed by a mathematical 0D modeling.
The contribution of pilot combustion is taken into account in the overall HRR in the first phase, and then it will be considered as a spark for the second phase.
For this reason, the separation of the phases isa crucial step in this proposed model. At the end of this step, the model determines the auto-ignition delay of the injected diesel quantity and the ignition delay of the air–gas mixture (points A and B, respectively (Figure 2)) and the laws that control the HRR in each phase.
4. Model Development
To initiate the approach, the lowest load is chosen for each gas composition (i.e., the percentage of hydrogen), and modeling for this load is executed using the “Gauss” model. Subsequently, the quantity of heat released by the injected diesel and its heat release rate (HRR) curve are determined, based on the model appropriate to the diesel case.
For the same gas composition and before the start of gas combustion, it is assumed that the amount of diesel burned remains consistent for all loads with the same law of heat release. This simplifying hypothesis is permissible because the combustion duration of the injected diesel is very brief. Consequently, for a given gas composition within the combustion chamber, the injected diesel burns under consistent environmental conditions, with no consideration for the influence of the load on this transient phase.
This section aims to determine the amount of pilot fuel burnt during the first phase and the HRR for this amount, which in turn enables the calculation of the ignition delay of the gas mixture (the time between points A and B in Figure 2). for this reason, a model based on Gaussian multi-models was implemented.
The developed model subdivides the overall signal of the HRR into multi-signals, according to a summation of the Gaussian functions, as indicated by Equation (1). Each small signal is characterized by its own pace controlled mainly by the moment of start-up, the phase, and the area under the curve.
This multi-signal subdivision is inspired by the phenomenology of combustion in dual fuel mode, where multiple combustion sites are ignited and extinguished randomly within the combustion chamber. The analogy with this phenomenology is drawn by the optimizer, which adjusts all parameters governing the Gaussian shape and the number of functions used. Ultimately, the set of multi-signals that compose the overall shape with the least error when compared to experimental data is delivered by the optimizer.
This part aims to separate the two phases (phase controlled by diesel combustion, and phase controlled by gas combustion) to model each phase separately, as shown in the flow chart in Figure 3. For this reason, after the determination of the multi signals of HRR, the model makes the separation of the signals that control each phase, keeping a smooth mount for the start of the second phase (between the two points B and C (Figure 2)). This procedure is allowed at low loads since the two phases are clearly distinguished, since the ignition of the second phase (gas combustion) takes time relative to high load cases, which gives the possibility to the quantity of diesel injected to burn according to the conventional ordinary law, so the first phase is clearly developing.
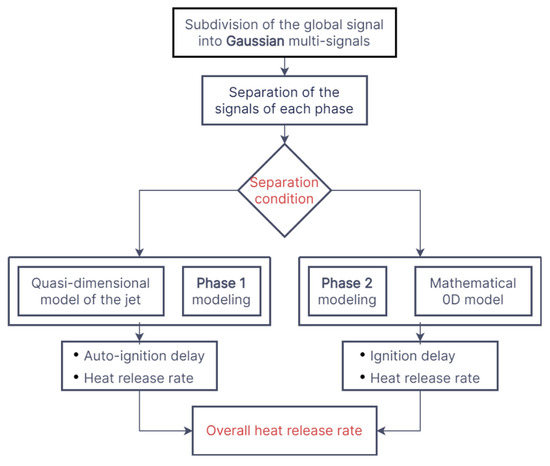
Figure 3.
Methodology of the developed model.
The two phases will be treated separately in the rest of the work as indicated in the flow chart in Figure 3. The first phase will be treated by a quasi-dimensional model of the jet specific to diesel combustion. The second phase will be treated by a 0D model based on Gaussian multifunction modeling, necessarily involving the modeling of auto-ignition delay and ignition delay for pilot fuel and primary gas, respectively.
4.1. First Phase Modeling
The modeling of the first phase mainly concerns two variants, namely the auto-ignition delay and the HRR, as detailed in the rest of the work.
4.1.1. Auto Ignition Delay (ID)
In order to model this auto-ignition by taking the effect of the gas composition (percentage of hydrogen and natural gas) in the combustion chamber, an approach inspired by that of Assanis et al. [39] (Equation (2)), which is based on the Arrhenius law [40], can be used.
The approach defined by Equation (2) is primarily designed for the conventional diesel mode, where the liquid fuel is injected into the combustion chamber containing only air. However, some modifications are necessary to adapt and manipulate the approach according to the dual fuel mode. In this case, the pilot fuel is injected into the combustion chamber, which contains air along with other gases with different compositions (such as natural gas and hydrogen in this case).
Equation (3) is used to take into consideration the effect of the gas composition in the combustion chamber. With these modifications, the new modeled auto-ignition delay becomes sensitive to the percentages of hydrogen and natural gas in the combustion chamber and also to the amount of diesel injected (pilot fuel), and the dominant conditions in the combustion chamber at the injection moment.
, and are the richness of diesel, hydrogen, and natural gas, respectively.
, and are the masses of diesel, hydrogen, and natural gas, respectively.
CN, the cetane index of diesel (pilot fuel). a, b, c, di, e, and fi are parameters of the model.
As the physics of combustion for the dual fuel case influences the activation energy () according to the old model used in Equation (2), the fixing of this parameter causes an over-constraint for the modeling of the auto-ignition delay. For this reason, the activation energy is also included as a parameter controlling the model, via Equation (4), which is combined with Equation (3) and participates in the construction of the response surface of the auto-ignition delay.
4.1.2. Heat Release Rate
In this section, the proposed approach switches to the calculation of the HRR for the pilot burn quantity detected above. This calculation is provided by a developed sub-model that is based on a quasi-dimensional approach to the diesel jet explained below.
This work proposes a quasi-dimensional two-phase combustion model of a diesel jet. The model discretizes the liquid and gas phases of the fuel spray. The first phase is divided into i small zones, according to a time step (Δt) chosen according to the injection velocity. The gas phase zone is divided into j small zones. Each combustion zone contains a certain mass of fuel vapor that will be consumed during combustion.
A limit exists for the length of the liquid phase, where the maximum length is characterized by the saturated vapor state. Achieving this saturated vapor state occurs when the liquid phase’s penetration distance exceeds the maximum liquid phase length. Consequently, a mass transfer occurs between the final cell of liquid and the initial cell of the liquid-vapor mixture. During this process, part of the liquid fuel changes from the liquid phase to the vapor phase and then combines with air in its saturated vapor state. Over time, the combustion zone emerges, as it consumes a specific amount of steam fuel Δmc [41] following Equation (5).
Subsequently, the model initiates computations for air entrainment, auto-ignition delay, and combustion rate within the transition zone. Figure 4 shows the sequential development and evolution of each distinct zone in the two-phase multi-zone quasi-dimensional combustion model.
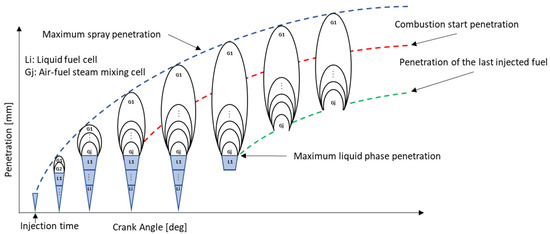
Figure 4.
Illustrative scenario for fuel spray development.
In this work, the law D2 defined by Equation (6) for droplet evaporation is used to measure the evaporation rate [42].
This study considers a hypothetical scenario where a droplet of pure fuel is suddenly immersed in a high-temperature gas. Drawing from Faeth’s research [43], when the fuel is injected at normal temperature, the concentration of fuel vapor on the liquid’s surface remains minimal, leading to a restricted mass transfer from the droplet.Haut du formulaire
To follow this process, several calculation steps are required. Table 2 and Table 3 summarize the main calculation steps with the appropriate equations.

Table 2.
Mass transfer coefficient.

Table 3.
Heat transfer coefficient.
The evaporation rate calculation is based on determining the evaporation rate for each fuel droplet in the combustion chamber as a function of crank angle. However, this approach assumes a constant temperature during the evaporation phase, which contradicts the combustion phenomenology. To account for this interaction between phases, an iterative calculation is necessary. This involves updating and adjusting the temperature inside the combustion chamber based on the crank angle, which directly affects the evaporation rate of each droplet. By considering this dynamic interaction, a more accurate representation of the evaporation process can be achieved. The characteristics of penetration are calculated according to the correlations summarized in Table 4.

Table 4.
Spray penetration and atomization calculation.
4.2. Second Phase Modeling
The modeling of this phase mainly concerns two variants, namely the air–gas mixture ignition delay and the HRR rate, as detailed in the rest of the work.
4.2.1. Gas Mixture Ignition Delay (ID2)
The time between the auto-ignition of the pilot fuel and the air–gas mixture ignition is a result of this approach, which defines the ignition delay (ID2). After the optimizer determines the number, shapes, and positions of the mini-Gauss functions, a separation of its signals is made for the determination of the pilot fuel amount burned during the first phase and the pace of the HRR for this phase. The calculator then subtracts this amount of heat released from the overall pace to determine the HRR for the second phase. The starting point of this curve (point B in Figure 2) represents the moment of the air–gas mixture ignition.
4.2.2. Heat Release Rate
This part of the work deals with the modeling of the HRR in the second phase, resulting from the phase separation mentioned above. For the treatment of the second phase, a methodology based on Gaussian modeling is still used, knowing that the Gaussian function used is controlled by the function of Equation (1).
To give a more predictive aspect to this modeling, the mini-Gauss distribution is fixed along the global phase according to a probability function, where the number of mini-functions n will also be an objective function minimized. For this reason, according to an optimization algorithm, the optimal distribution of these functions is searched, which gives the minimum error for all operating cases (% of H2 loads). This optimal distribution is then imposed for all operating cases by releasing the other parameters of the Gaussian function (ai and ci) for the modeling of the HRR specific to this phase.
Finally, as mentioned above, in this approach the parameters bi in Equation (1) are imposed according to an optimal distribution. This is a relevant procedure that aims to increase the predictivity of the model on the one hand and to reduce the number of parameters to be calibrated by experimental results on the other. This approach requires a calibration of parameters ai and ci according to the load and composition of the gas (percentage of H2 contained in the gas) with the experimental results, to imitate the HRR in the second phase.
To improve the predictivity of the model, the modeling of parameters ai and ci is supported. Based on the abstracted results and using smoothing with the “Thin Plate Spline” tool [46] to construct response surfaces for these parameters as a function of load and gas composition. In the end, n response surfaces are delivered for each parameter controlling their variations between 20% and 80% load on one side and between 35%H2 and 50%H2 on the other side.
5. Results and Discussion
5.1. Phase Separation
Figure 5 represents the four cases studied for the composition of gases with low loads, where the different signals constituting the overall HRR are presented.
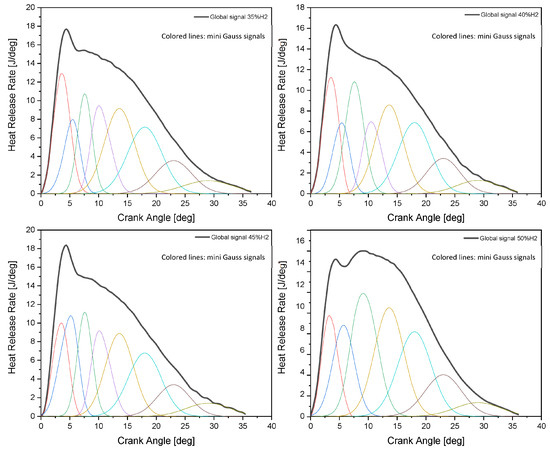
Figure 5.
Phases separation for experimental results.
According to the results of the model presented in Figure 5, densification of mini signals in the middle of the overall combustion phase is observed, to adhere to the pattern of the experimental results, where the HRR is maximum. Signals with a low amplitude and a relatively large phase are favored in the last combustion phase to model late combustion, where the HRR is low with a slow variation. In contrast, during the first combustion phase, characterized by rapid variation caused by the start of diesel combustion after auto-ignition, the model uses signals with high amplitude and small phase.
After this multi-signal modeling, based on Gaussian functions, the model decomposes the two combustion phases according to the conditions mentioned above. Figure 6 shows the variations in the HRR that characterize the combustion of the diesel quantity as a function of crank angle and the cumulative heat released for the different compositions of surrounding gas in the combustion chamber. Figure 6b confirms that the effective diesel burning in the first phase will decrease with the increasing percentage of hydrogen in the air–gas mixture. This is due to the timing of the triggering of the second phase, which will be detailed in the following section. So, the second phase starts earlier when the air–gas mixture is richer in hydrogen, which decreases the contribution of the first phase in the overall HRR, and thus decreases the effective amount of diesel that contributes to the first phase of combustion. For all cases of gas composition, the difference between the quantity of diesel injected and that burnt, according to the model, is taken into account in the second phase without any particular treatment about the composition of the gas.
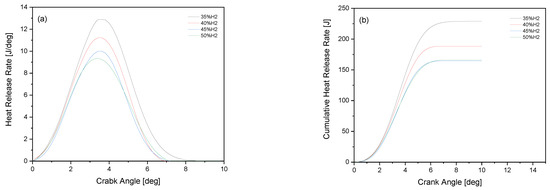
Figure 6.
(a) Heat release rate; (b) cumulative heat release for the first phase.
5.2. Diesel Auto Ignition Delay (ID)
Based on the experimental findings, Figure 7a illustrates the changes in auto-ignition delay concerning the injected diesel quantity relative to the load. This variation is analyzed across various compositions of the surrounding gas within the combustion chamber.
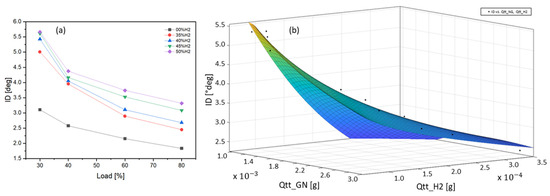
Figure 7.
(a) pilot auto ignition delay and (b) response surface of the pilot auto ignition delay.
Figure 7b represents the response surface expressed by the approach of Equation (3), for which this auto-ignition delay is represented as a function of the quantities of hydrogen and natural gas existing in the combustion chamber. Knowing that the amount of diesel injected as a pilot fuel is fixed (5 g/min) for all operating cases.
According to the modeling results, the auto-ignition delay exhibits a reduction with heightened loads and an increased proportion of H2 contributing to the gas mixture within the combustion chamber. This shift is driven by conditions becoming more conducive to the auto-ignition of the pilot fuel.
Pilot fuel auto-ignition delay is a critical parameter to ensure model accuracy. For this reason, it can be considered an indicator of the accuracy and reliability of the model for the different operating cases.
Figure 8 shows a comparison between the auto-ignition delay results derived from the model defined by Equation (3) and the experiment. Calculation of the experimental auto-ignition delay depends directly on the time between injection and the start of combustion. This study uses the cylinder pressure signal analysis method to calculate the combustion start time. The signal interpreted is measured directly by the cylinder pressure sensor. After calculating the derivative of this pressure signal as a function of crank angle, the start of combustion will be located at the last local minimum before the combustion peak in the pressure-derived signal.
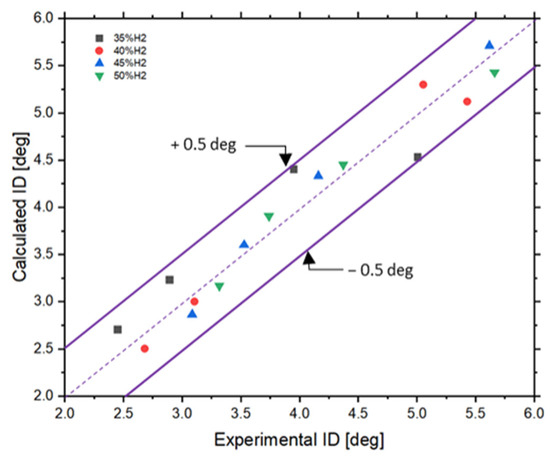
Figure 8.
Comparison of calculated and experimental ID.
According to these results, all the points are distributed along the first bisector. All these points are grouped between two limits representing a maximum relative error of ±0.5 [deg], which explains the precision of this new model specific to the auto ignition delay for wide operating ranges concerning the load and the composition of the surrounding gas mixture in the combustion chamber.
5.3. Air–Gas Ignition Delay (ID2)
Figure 9 represents the variation of the ignition delay (ID2) of the gas mixture in the combustion chamber as a function of the load and gas compositions according to the percentage of hydrogen (H2). Note that the ID2 represents the time between the diesel ignition and the moment of the gas mixture ignition. According to the results, for the same gas composition (same percentage of H2) the ID2 will decrease with the increasing load. For the same load, the ID2 will decrease with the increasing percentage of H2.
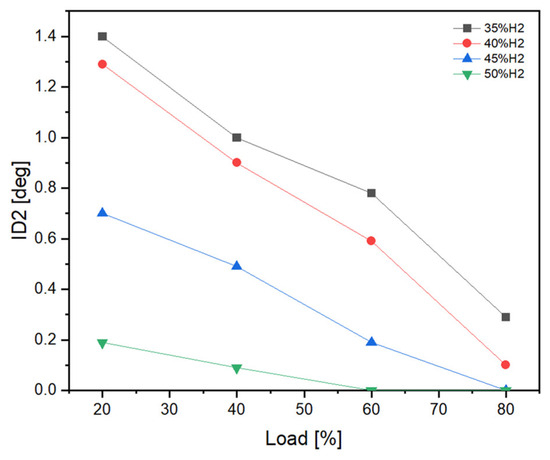
Figure 9.
Gas mixture ignition delay.
For the same percentage of hydrogen, the decrease in ID2 is caused by the surrounding conditions in the combustion chamber that become more favorable to combustion with the load increasing. For the same load, the ID2 will decrease with the increasing percentage of H2, since hydrogen requires less energy to ignite compared to natural gas. This implies less energy for ignition of the overall air–gas mixture with high hydrogen percentages and reduces the ignition delay (ID2).
5.4. Heat Release Rate
The quasi-dimensional model of the diesel jet explained above is a model characterized by a high degree of predictivity since it requires parameters that are directly related to the physics of combustion, such as inputs namely the richness controlled by the amount of fuel resulting from the separation phase (Figure 6), injection pressure, rotation speed and the fuel type.
This amount of effective fuel that participates in the HRR during the first phase is assumed to be constant for the same gas composition as already assumed above. Once this quantity has been determined, the jet model is charged for modeling the HRR (Figure 6a).
As already indicated, the first objective of the model during the processing of the second phase is the search for the optimal distribution for the mini gauss signals which is valid for all the cases taken for the training of the model. As will be shown later, the distribution of these signals must present an analogy with the phenomenology of gas combustion in dual fuel mode, which is characterized by intense combustion around the middle of the overall phase with a slow start and end of combustion.
Figure 10 (for four gas compositions for the same 40% load) represents the distributions and variations of the mini signals with their sum, which models the overall HRR specific to the second phase. The four cases presented in Figure 10 are illustrative cases, showing that the 16 learning cases involve the same method.
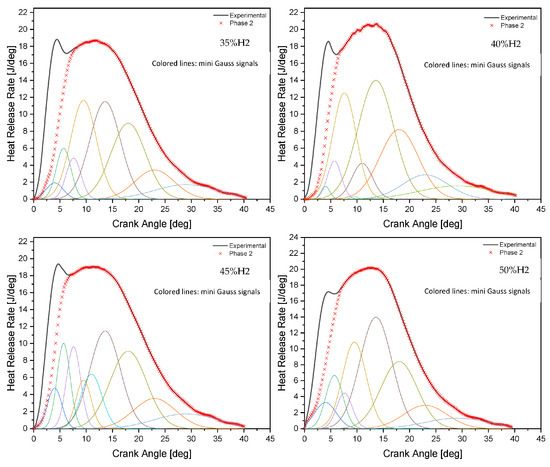
Figure 10.
Gaussian modeling of the second phase for the case of 40% load with different gas composition.
Figure 11 presents the final results of the model which summarizes the two signals modeled for the two combustion phases with their sum that defines the overall HRR. A maximum relative error of 2.14% is captured for all cases, confirming the model’s fidelity and accuracy.
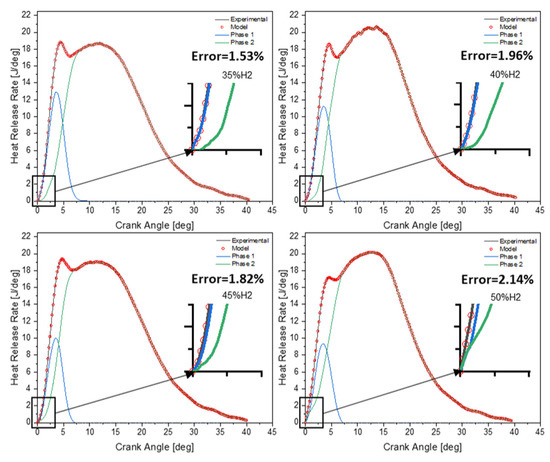
Figure 11.
Global modeling of the two phases for the case of 40% load with different gas compositions.
In Figure 11, a close-up view is presented to illustrate the modulation of HRR initiation, influenced by various parameters. These parameters encompass the auto-ignition delay of the pilot fuel, ignition delay of the air–gas mixture, load variations, and the mixture composition within the combustion chamber. This zoom confirms the results of Figure 9, for which the ignition timing of the air–gas mixture diminishes as the proportion of H2 within the gas composition rises. This observation is explicable by the fact that hydrogen requires less energy for ignition. Consequently, the mixture’s susceptibility to ignition is mitigated. This phenomenon is reaffirmed by the pace of HRR specific to the second phase, which is triggered more intensely as the percentage of H2 in the air–gas blend increases.
The accuracy of the model is confirmed by comparing the pressure signals shown in Figure 12 for different gas compositions, calculated using an analysis model based on the first law of thermodynamics.
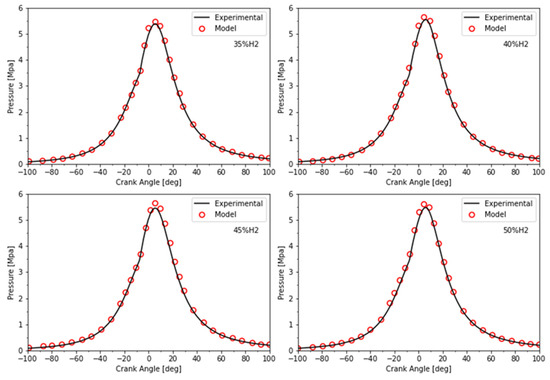
Figure 12.
Pressure modeling results for 40% load.
According to the results, this modeling approach presents more accurate results compared to those given by Wiebe’s modeling [47], as shown in Figure 13, where the error exceeds 8% and 6% for modeling with double and triple Wiebe functions, respectively.
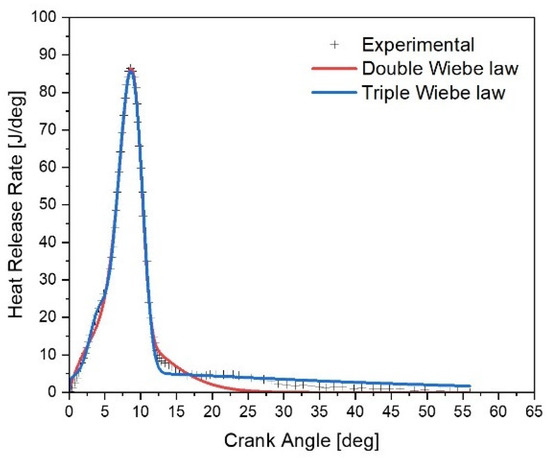
Figure 13.
Wiebe modeling for the operating case (80% load, 50%H2).
This fact is caused by the complexity of the HRR in dual fuel mode with hydrogen enrichment, for which the determination of the number of Wiebe functions that can control the overall signal of HRR during the second phase becomes really complex, especially at high load, where the pace of the HRR is out of the conventional. For this reason, the Gaussian multifunction-based approach has proven to be a reliable model for capturing the number, position, phase, and shape of mini-signals to accurately model the overall HRR signal, as illustrated in Figure 14. The approach exhibits a maximum error of approximately 2%.
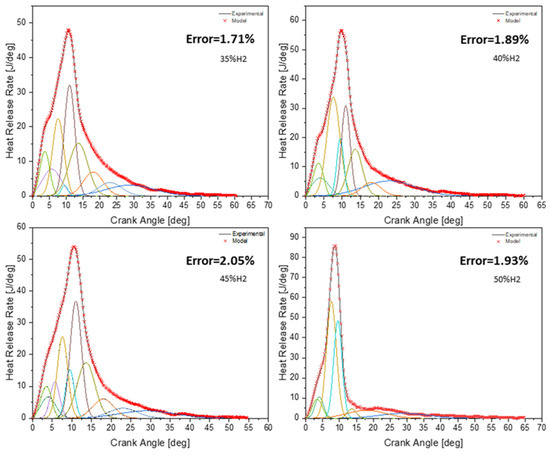
Figure 14.
Global Gaussian modeling for the case of 80% load with different gas compositions.
6. Conclusions
The model presented in this work is aimed at modeling combustion in dual fuel mode for automotive engines. It was developed to compensate for the lack of predictive models for this type of combustion.
With unprecedented description and high predictivity, the proposed model deals with a wide range of engine operations, either for the load ranging from 20% to 80%, or for the composition of the air–gas mixture in the combustion chamber, dealing with the case of the HNG mixture with a volumetric concentration of H2 between 35% and 50% of the total volume.
The model separates the phases of the HRR, namely the pilot fuel combustion phase and the air–gas mixture combustion phase. Then, it models each one with an appropriate model. Treating the first phase with a model of the jet, developed within the framework of this work since it is controlled by the characteristics of the jet which develops in the combustion chamber after injection. While the second phase is treated by an equally original mathematical model which is based on the Gaussian function.
Initially, the presented model meticulously focuses on the auto-ignition delay of the pilot fuel within a diverse gaseous mixture. The results of the auto-ignition delay modeling consistently align with experimental data, showing a remarkable level of agreement. Across all operational scenarios, the maximum error remains consistently below 5%.
The global combustion model has been validated for several operating cases concerning the load and the composition of the air–gas mixture, it showed very good reliability and strong predictivity. This new approach has provided extremely better qualities compared to the conventional Wiebe model which loses its accuracy for the dual fuel mode at high load, especially with an air–gas mixture rich in H2, where the new model retains perfect accuracy, with a maximum error of around 2%.
Based on this predictive model for the heat release rate, the various model parameters, i.e., thermal efficiency and fuel consumption, can be calculated using analysis models based on the first principle of thermodynamics.
Reliability, precision, and predictability are characteristics that define this model, making it a valuable tool for emission prediction, preliminary design, and the adaptation of a diesel combustion chamber for dual-fuel operation.
Author Contributions
Conceptualization, Y.S.; methodology, Y.S. and K.L.; software, Y.S.; validation, Y.S., L.T. and M.C.; formal analysis, Y.S. and K.L.; investigation, Y.S.; resources, K.L. and M.C.; data curation, C.L.; writing—original draft preparation, Y.S.; writing—review and editing, Y.S. and L.T.; visualization, K.L.; supervision, K.L., L.T. and M.C. All authors have read and agreed to the published version of the manuscript.
Funding
This research received no external funding.
Data Availability Statement
Not applicable.
Conflicts of Interest
The authors declare no conflict of interest.
Nomenclature
| Ea | activation energy, [KJ mol−1] |
| ID2 | air–gas ignition delay, [deg] |
| ma | air mass entrained, [kg] |
| μa | air viscosity, [N s m−2] |
| ID | auto ignition delay, [deg] |
| BDC | bottom dead center |
| BMEP | brake mean effective pressure, [MPa] |
| tbreak | break up time, [ms] |
| CO2 | carbon dioxide |
| Cd | coefficient of discharge |
| P | cylinder pressure, [bar] |
| T | cylinder temperature, [K] |
| V | cylinder volume, [m3] |
| dn | diameter of the orifice, [m] |
| μf | diesel fuel viscosity, [N s m−2] |
| D | droplet diameter, [m] |
| Φ | equivalence fuel-air ratio |
| evaporation constant | |
| Ra | gas constant |
| Q | heat release, [J] |
| HRR | heat release rate, [J deg−1] |
| H2 | hydrogen |
| HNG | hydrogen natural gas |
| ignition delay, [ms] | |
| ρa | in-cylinder gas density, [kg m−3] |
| D0 | initial droplet diameter, [m] |
| ρfl | liquid fuel density, [kg m−3] |
| mfg | mass of fuel vapor in a packet, [kg] |
| NOx | oxides of nitrogen |
| S | penetration |
| Re | reynolds number |
| D32 | sauter mean diameter, [m] |
| Cp | specific heat at constant pressure, [L kg−1 K−1] |
| AFRstoich | stoichiometric air fuel ratio |
| TDC | top dead center |
| t | time, [s] |
| Ra | universal gas constant, [J K−1 mol−1] |
| µ | viscosity |
| We | weber number |
References
- Haegel, N.M.; Kurtz, S.R. Global Progress Toward Renewable Electricity: Tracking the Role of Solar (Version 2). IEEE J. Photovolt. 2022, 12, 1265–1272. [Google Scholar] [CrossRef]
- Burtscher, H. Physical Characterization of Particulate Emissions from Diesel Engines: A Review. J. Aerosol Sci. 2005, 36, 896–932. [Google Scholar] [CrossRef]
- Marbán, G.; Valdés-Solis, T. Towards the Hydrogen Economy? Int. J. Hydrogen Energy 2007, 32, 1625–1637. [Google Scholar] [CrossRef]
- Karim, G. Dual-Fuel Diesel Engines; CRC Press: Boca Raton, FL, USA, 2015. [Google Scholar]
- Maji, S.; Pal, A.; Arora, B.B. Use of CNG and Diesel in CI Engines in Dual Fuel Mode; SAE International: Warrendale, PA, USA, 2008. [Google Scholar]
- Sun, X.; Li, M.; Li, J.; Duan, X.; Wang, C.; Luo, W.; Liu, H.; Liu, J. Nitrogen Oxides and Ammonia Removal Analysis Based on Three-Dimensional Ammonia-Diesel Dual Fuel Engine Coupled with One-Dimensional SCR Model. Energies 2023, 16, 908. [Google Scholar] [CrossRef]
- Molina, S.; Novella, R.; Gomez-Soriano, J.; Olcina-Girona, M. New Combustion Modelling Approach for Methane-Hydrogen Fueled Engines Using Machine Learning and Engine Virtualization. Energies 2021, 14, 6732. [Google Scholar] [CrossRef]
- Laughlin, M.; Burnham, A. Case Study: Natural Gas Regional Transport Trucks; US Department of Energy: Washington, DC, USA, 2016. [Google Scholar]
- Shah, A.; Thipse, S.S.; Tyagi, A.; Rairikar, S.D.; Kavthekar, K.P.; Marathe, N.V.; Mandloi, P. Literature Review and Simulation of Dual Fuel Diesel-CNG Engines; SAE International: Warrendale, PA, USA, 2011. [Google Scholar]
- Lipskis, I.; Pukalskas, S.; Droździel Pawełand Barta, D.; Žuraulis, V.; Pečeliunas, R. Modelling and Simulation of the Performance and Combustion Characteristics of a Locomotive Diesel Engine Operating on a Diesel–LNG Mixture. Energies 2021, 14, 5318. [Google Scholar] [CrossRef]
- Ashok, B.; Ashok, S.D.; Kumar, C.R. LPG Diesel Dual Fuel Engine—A Critical Review. Alex. Eng. J. 2015, 54, 105–126. [Google Scholar] [CrossRef]
- Abbe, C.V.N. Contribution à La Modélisation 0D de La Combustion Diesel: Application au Biodiesel. Ph.D. Thesis, Universite de Yaounde I, Yaoundé, Camerun, 2016. [Google Scholar]
- Aklouche, F.Z. Etude Caractéristique et Développement de La Combustion Des Moteurs Diesel En Mode Dual-Fuel: Optimisation de l’injection Du Combustible Pilote. Ph.D. Thesis, Ecole Nationale Supérieure Mines-Télécom Atlantique, Nantes, France, 2018. [Google Scholar]
- Cameretti, M.C.; De Robbio, R.; Palomba, M. Numerical Analysis of Dual Fuel Combustion in a Medium Speed Marine Engine Supplied with Methane/Hydrogen Blends. Energies 2023, 16, 6651. [Google Scholar] [CrossRef]
- Cameretti, M.C.; De Robbio, R.; Mancaruso, E.; Palomba, M. Cfd Study of Dual Fuel Combustion in a Research Diesel Engine Fueled by Hydrogen. Energies 2022, 15, 5521. [Google Scholar] [CrossRef]
- De Robbio, R.; Cameretti, M.C.; Mancaruso, E.; Tuccillo, R.; Vaglieco, B.M. CFD Study and Experimental Validation of a Dual Fuel Engine: Effect of Engine Speed. Energies 2021, 14, 4307. [Google Scholar] [CrossRef]
- Jafari, B.; Khatamnejad, H.; Shahavi, M.H.; Domeyri Ganji, D. Simulation of Dual Fuel Combustion of Direct Injection Engine with Variable Natural Gas Premixed Ratio. Int. J. Eng. 2019, 32, 1327–1336. [Google Scholar]
- Singh, S.; Kong, S.-C.; Reitz, R.D.; Krishnan, S.R.; Midkiff, K.C. Modeling and Experiments of Dual-Fuel Engine Combustion and Emissions. SAE Trans. 2004, 113, 124–133. [Google Scholar]
- Zhang, Y.; Kong, S.-C.; Reitz, R.D. Modeling and Simulation of a Dual Fuel (Diesel/Natural Gas) Engine with Multidimensional CFD. SAE Trans. 2003, 112, 336–347. [Google Scholar]
- Dimitriou, P.; Tsujimura, T.; Kojima, H.; Aoyagi, K.; Kurimoto, N.; Nishijima, Y. Experimental and Simulation Analysis of Natural Gas-Diesel Combustion in Dual-Fuel Engines. Front. Mech. Eng. 2020, 6, 543808. [Google Scholar] [CrossRef]
- Payri, F.; Olmeda, P.; Martín, J.; García, A. A Complete 0D Thermodynamic Predictive Model for Direct Injection Diesel Engines. Appl. Energy 2011, 88, 4632–4641. [Google Scholar] [CrossRef]
- Xu, S.; Anderson, D.; Singh, A.; Hoffman, M.; Prucka, R.; Filipi, Z. Development of a Phenomenological Dual-Fuel Natural Gas Diesel Engine Simulation and Its Use for Analysis of Transient Operations. SAE Int. J. Engines 2014, 7, 1665–1673. [Google Scholar] [CrossRef]
- Wiebe, I. Halbempirische Formel Fur Die Verbrennungsgeschwindigkeit; Verlag der Akad. der Wissenschaften der VdSSR: Moscow, Russia, 1956. [Google Scholar]
- Liu, Z.; Karim, G.A. Simulation of Combustion Processes in Gas-Fuelled Diesel Engines. Proc. Inst. Mech. Eng. Part A J. Power Energy 1997, 211, 159–169. [Google Scholar] [CrossRef]
- Papagiannakis, R.G.; Hountalas, D.T.; Rakopoulos, C.D. Theoretical Study of the Effects of Pilot Fuel Quantity and Its Injection Timing on the Performance and Emissions of a Dual Fuel Diesel Engine. Energy Convers. Manag. 2007, 48, 2951–2961. [Google Scholar] [CrossRef]
- Papagiannakis, R.G.; Hountalas, D.T.; Kotsiopoulos, P.N. Experimental and Theoretical Analysis of the Combustion and Pollutants Formation Mechanisms in Dual Fuel DI Diesel Engines; SAE International: Warrendale, PA, USA, 2005. [Google Scholar]
- Walther, H.-P.; Schlatter, S.; Wachtmeister, G.; Boulouchos, K. Combustion Models for Lean-Burn Gas Engines with Pilot Injection. MTZ Worldw. 2012, 73, 56–63. [Google Scholar] [CrossRef]
- Pohekar, R.S.; Tamma, B.; Mehta, P.S.; Gubba, S.R. Multizone Phenomenological Modeling of Dual-Fuel Combustion in Diesel Engines; SAE International: Warrendale, PA, USA, 2020. [Google Scholar]
- Krishnan, S.R.; Srinivasan, K.K. Multi-Zone Modelling of Partially Premixed Low-Temperature Combustion in Pilot-Ignited Natural-Gas Engines. Proc. Inst. Mech. Eng. Part D J. Automob. Eng. 2010, 224, 1597–1622. [Google Scholar] [CrossRef]
- Millo, F.; Accurso, F.; Piano, A.; Fogla, N.; Caputo, G.; Cafari, A.; Hyvönen, J. Development and Validation of a Multi-Zone Predictive Combustion Model for Large-Bore Dual-Fuel Engines. SAE Int. J. Engines 2021, 15, 703–718. [Google Scholar] [CrossRef]
- Jung, D.; Assanis, D.N. Multi-Zone DI Diesel Spray Combustion Model for Cycle Simulation Studies of Engine Performance and Emissions. SAE Trans. 2001, 110, 1510–1532. [Google Scholar]
- Rajkumar, S.; Bakshi, S.; Mehta, P.S. Multizone Phenomenological Modeling of Combustion and Emissions for Multiple-Injection Common Rail Direct Injection Diesel Engines. J. Eng. Gas Turbines Power 2016, 138, 122805. [Google Scholar] [CrossRef]
- Aceves, S.M.; Flowers, D.L.; Westbrook, C.K.; Smith, J.R.; Pitz, W.; Dibble, R.; Christensen, M.; Johansson, B. A Multi-Zone Model for Prediction of HCCI Combustion and Emissions. SAE Trans. 2000, 109, 431–441. [Google Scholar]
- Bissoli, M.; Frassoldati, A.; Cuoci, A.; Ranzi, E.; Mehl, M.; Faravelli, T. A New Predictive Multi-Zone Model for HCCI Engine Combustion. Appl. Energy 2016, 178, 826–843. [Google Scholar] [CrossRef]
- Palani, Y.; Devarajan, C.; Manickam, D.; Thanikodi, S. Performance and Emission Characteristics of Biodiesel-Blend in Diesel Engine: A Review. Environ. Eng. Res. 2022, 27, 200338. [Google Scholar] [CrossRef]
- Hiroyasu, H. Fuel Spray Penetration and Spray Angle in Diesel Engines. JSAE 1980, 21, 5–11. [Google Scholar]
- Hiroyasu, H. Diesel Engine Combustion and Its Modeling. COMODIA 1985, 85, 53–75. [Google Scholar]
- Benbellil, M.A.; Lounici, M.S.; Loubar, K.; Tazerout, M. Investigation of Natural Gas Enrichment with High Hydrogen Participation in Dual Fuel Diesel Engine. Energy 2022, 243, 122746. [Google Scholar] [CrossRef]
- Assanis, D.N.; Filipi, Z.S.; Fiveland, S.B.; Syrimis, M. A Predictive Ignition Delay Correlation under Steady-State and Transient Operation of a Direct Injection Diesel Engine. J. Eng. Gas Turbines Power 2003, 125, 450–457. [Google Scholar] [CrossRef]
- Watson, N.; Pilley, A.D.; Marzouk, M. A Combustion Correlation for Diesel Engine Simulation; SAE International: Warrendale, PA, USA, 1980. [Google Scholar]
- Xu, S.; Yamakawa, H.; Nishida, K.; Filipi, Z. Quasi-Dimensional Diesel Engine Combustion Modeling with Improved Diesel Spray Tip Penetration, Ignition Delay, and Heat Release Submodels. J. Eng. Gas Turbines Power 2017, 139, 112802. [Google Scholar] [CrossRef]
- Dalla Barba, F.; Wang, J.; Picano, F. Revisiting D2-Law for the Evaporation of Dilute Droplets. Phys. Fluids 2021, 33, 051701. [Google Scholar] [CrossRef]
- Faeth, G.M. Evaporation and Combustion of Sprays. Prog. Energy Combust. Sci. 1983, 9, 1–76. [Google Scholar] [CrossRef]
- Hiroyasu, H.; Kadota, T.; Arai, M. Development and Use of a Spray Combustion Modeling to Predict Diesel Engine Efficiency and Pollutant Emissions: Part 1 Combustion Modeling. Bull. JSME 1983, 26, 569–575. [Google Scholar] [CrossRef]
- Hiroyasu, H.; Arai, M.; Tabata, M. Empirical Equations for the Sauter Mean Diameter of a Diesel Spray. SAE Trans. 1989, 98, 868–877. [Google Scholar]
- Wood, S.N. Thin Plate Regression Splines. J. R. Stat. Soc. Ser. B Stat. Methodol. 2003, 65, 95–114. [Google Scholar] [CrossRef]
- Awad, S.; Varuvel, E.G.; Loubar, K.; Tazerout, M. Single Zone Combustion Modeling of Biodiesel from Wastes in Diesel Engine. Fuel 2013, 106, 558–568. [Google Scholar] [CrossRef]
Disclaimer/Publisher’s Note: The statements, opinions and data contained in all publications are solely those of the individual author(s) and contributor(s) and not of MDPI and/or the editor(s). MDPI and/or the editor(s) disclaim responsibility for any injury to people or property resulting from any ideas, methods, instructions or products referred to in the content. |
© 2023 by the authors. Licensee MDPI, Basel, Switzerland. This article is an open access article distributed under the terms and conditions of the Creative Commons Attribution (CC BY) license (https://creativecommons.org/licenses/by/4.0/).