Abstract
Solar energy is a sustainable source that can be effectively utilized to address winter heating challenges in buildings. To ensure the efficient application of solar energy for heating purposes and to maintain reliable performance of the heating system, the integration of phase-change materials (PCMs) in thermal energy storage (TES) systems has emerged as a crucial auxiliary approach. This study focuses on the design and simulation of four TES structures: smooth, finned, metallic foam, and metallic foam-finned tubes. It explores their thermal characteristics, such as complete melting time and heat flux, under various flow conditions. Additionally, a residential building in Xi’an is selected as the object, where the proposed solar energy phase-change TES system is employed to meet the heating demand. Economic indicators, including initial investment and investment payback period, are estimated using a static evaluation method. The results highlight that the complete melting time of the TES unit with a metallic foam-finned tube is 4800 s, which is 88.3% less than the smooth tube. Finally, based on the actual project, it is determined that the metallic foam-finned heating system, with an HTF flow rate of 0.25 m/s, requires the fewest TES devices (914) and has a payback period of 13 months.
1. Introduction
High levels of economic development are often accompanied by a significant energy input [1,2,3,4]. Among the three major energy consumption sectors—industry, transportation, and construction—the construction sector is particularly notable. According to the research report “Re-shaping Energy: China”, the construction sector exhibits the highest potential for emission reduction, reaching 74%, surpassing the other two sectors. Consequently, the construction sector is a critical area for China’s efforts in climate change response, energy conservation, and emission reduction [5,6,7].
In terms of building energy consumption, heating energy accounts for approximately a quarter of the total in China’s northern cities. Given the close relationship between heating and people’s production and daily lives, the demand for clean heating has increased significantly, aiming to enhance indoor thermal environment quality and address climate-related challenges [8,9,10]. Consequently, heating methods have become cleaner and more diversified, with the gradual adoption of approaches such as solar heating, geothermal heating, and electric heating. Among these, solar energy stands out due to its abundant reserves, environmental friendliness, and economic viability [11]. However, the intermittence and instability of solar energy necessitates the integration of a heat storage device to ensure the reliability of the heating system. Currently, there are three main methods for thermal energy storage (TES): sensible heat storage [12,13], latent heat storage [14,15], and chemical heat storage [16,17]. Latent heat storage exhibits promising applications due to its relatively small temperature variation for heat transmission and high adaptability to heating temperatures. Faraj et al. [18] explored the combination of PCMs with building heating, incorporating both active and passive systems to improve energy efficiency and economic feasibility. Larwa et al. [19] investigated the impact of PCM on radiant floor heat transfer and found that latent TES reduces energy consumption in heating systems.
Overall, phase-change materials (PCMs) have low heat-conducting properties, which hampers efficient heat transmission. To address this issue, scholars have proposed various enhancements of phase-change heat storage structures. These improvements include the addition of fins [20,21,22], metallic foams [23,24,25], heat pipes [26,27,28], and nanofluids [29,30,31] to PCMs to accelerate the charging–discharging course. Li et al. [32] carried out a numerical study on the heat storage effect of PCM at different metallic foam filling rates, revealing that the shortest complete melting time was reached at a filling rate of 95%. Bazri et al. [33] utilized finned heat pipes to optimize the thermal capability of PCMs, offering insights into the application of latent heat storage in heating systems. Liu et al. [34] investigated copper fin-enhanced PCM heat storage and realized a 41% decrease in complete discharge time by optimizing the gradient fin position.
It is indisputable that energy efficiency and economic feasibility are crucial considerations in the application of latent TES systems in practical engineering [35]. Liu et al. [36] designed a mobile TES system with PCM and evaluated its charging–discharging characteristics and economic viability. The results demonstrated a 9.7% decrease in complete phase-transition time and a 10.63% rise in thermal effect with the positive gradient heat storage system. Pelella et al. [37] developed a heating model for a multi-component heat pump composite heat storage system, aiming to optimize system energy efficiency and minimize costs through multi-objective optimization. Saravanan et al. [38] optimized a solar water heating system using PCM, achieving a win-win scenario for energy efficiency and investment recovery. Gao et al. [39] evaluated the thermal feasibility of a gradient phase-change TES heating system and found that the melting process was 87.6% faster when the TES system was filled with 90% metallic foam. Furthermore, the investment payback period for the project was only 10 months.
In summary, there are a limited number of studies on the comprehensive evaluation of the thermophysical properties and economic parameters of phase-change systems applied in heating systems. Additional research is needed to optimize the thermophysical properties of structures. Based on this understanding, this study designs four types of phase-change TES units, considering various flow rate conditions. The study not only conducts numerical simulations of the thermal behavior of phase-transition phenomena but also evaluates the economic parameters of metallic foam-finned composite structures. These findings provide guidance for phase-change TES heating systems for engineering projects.
2. Methodology
2.1. Physical Model
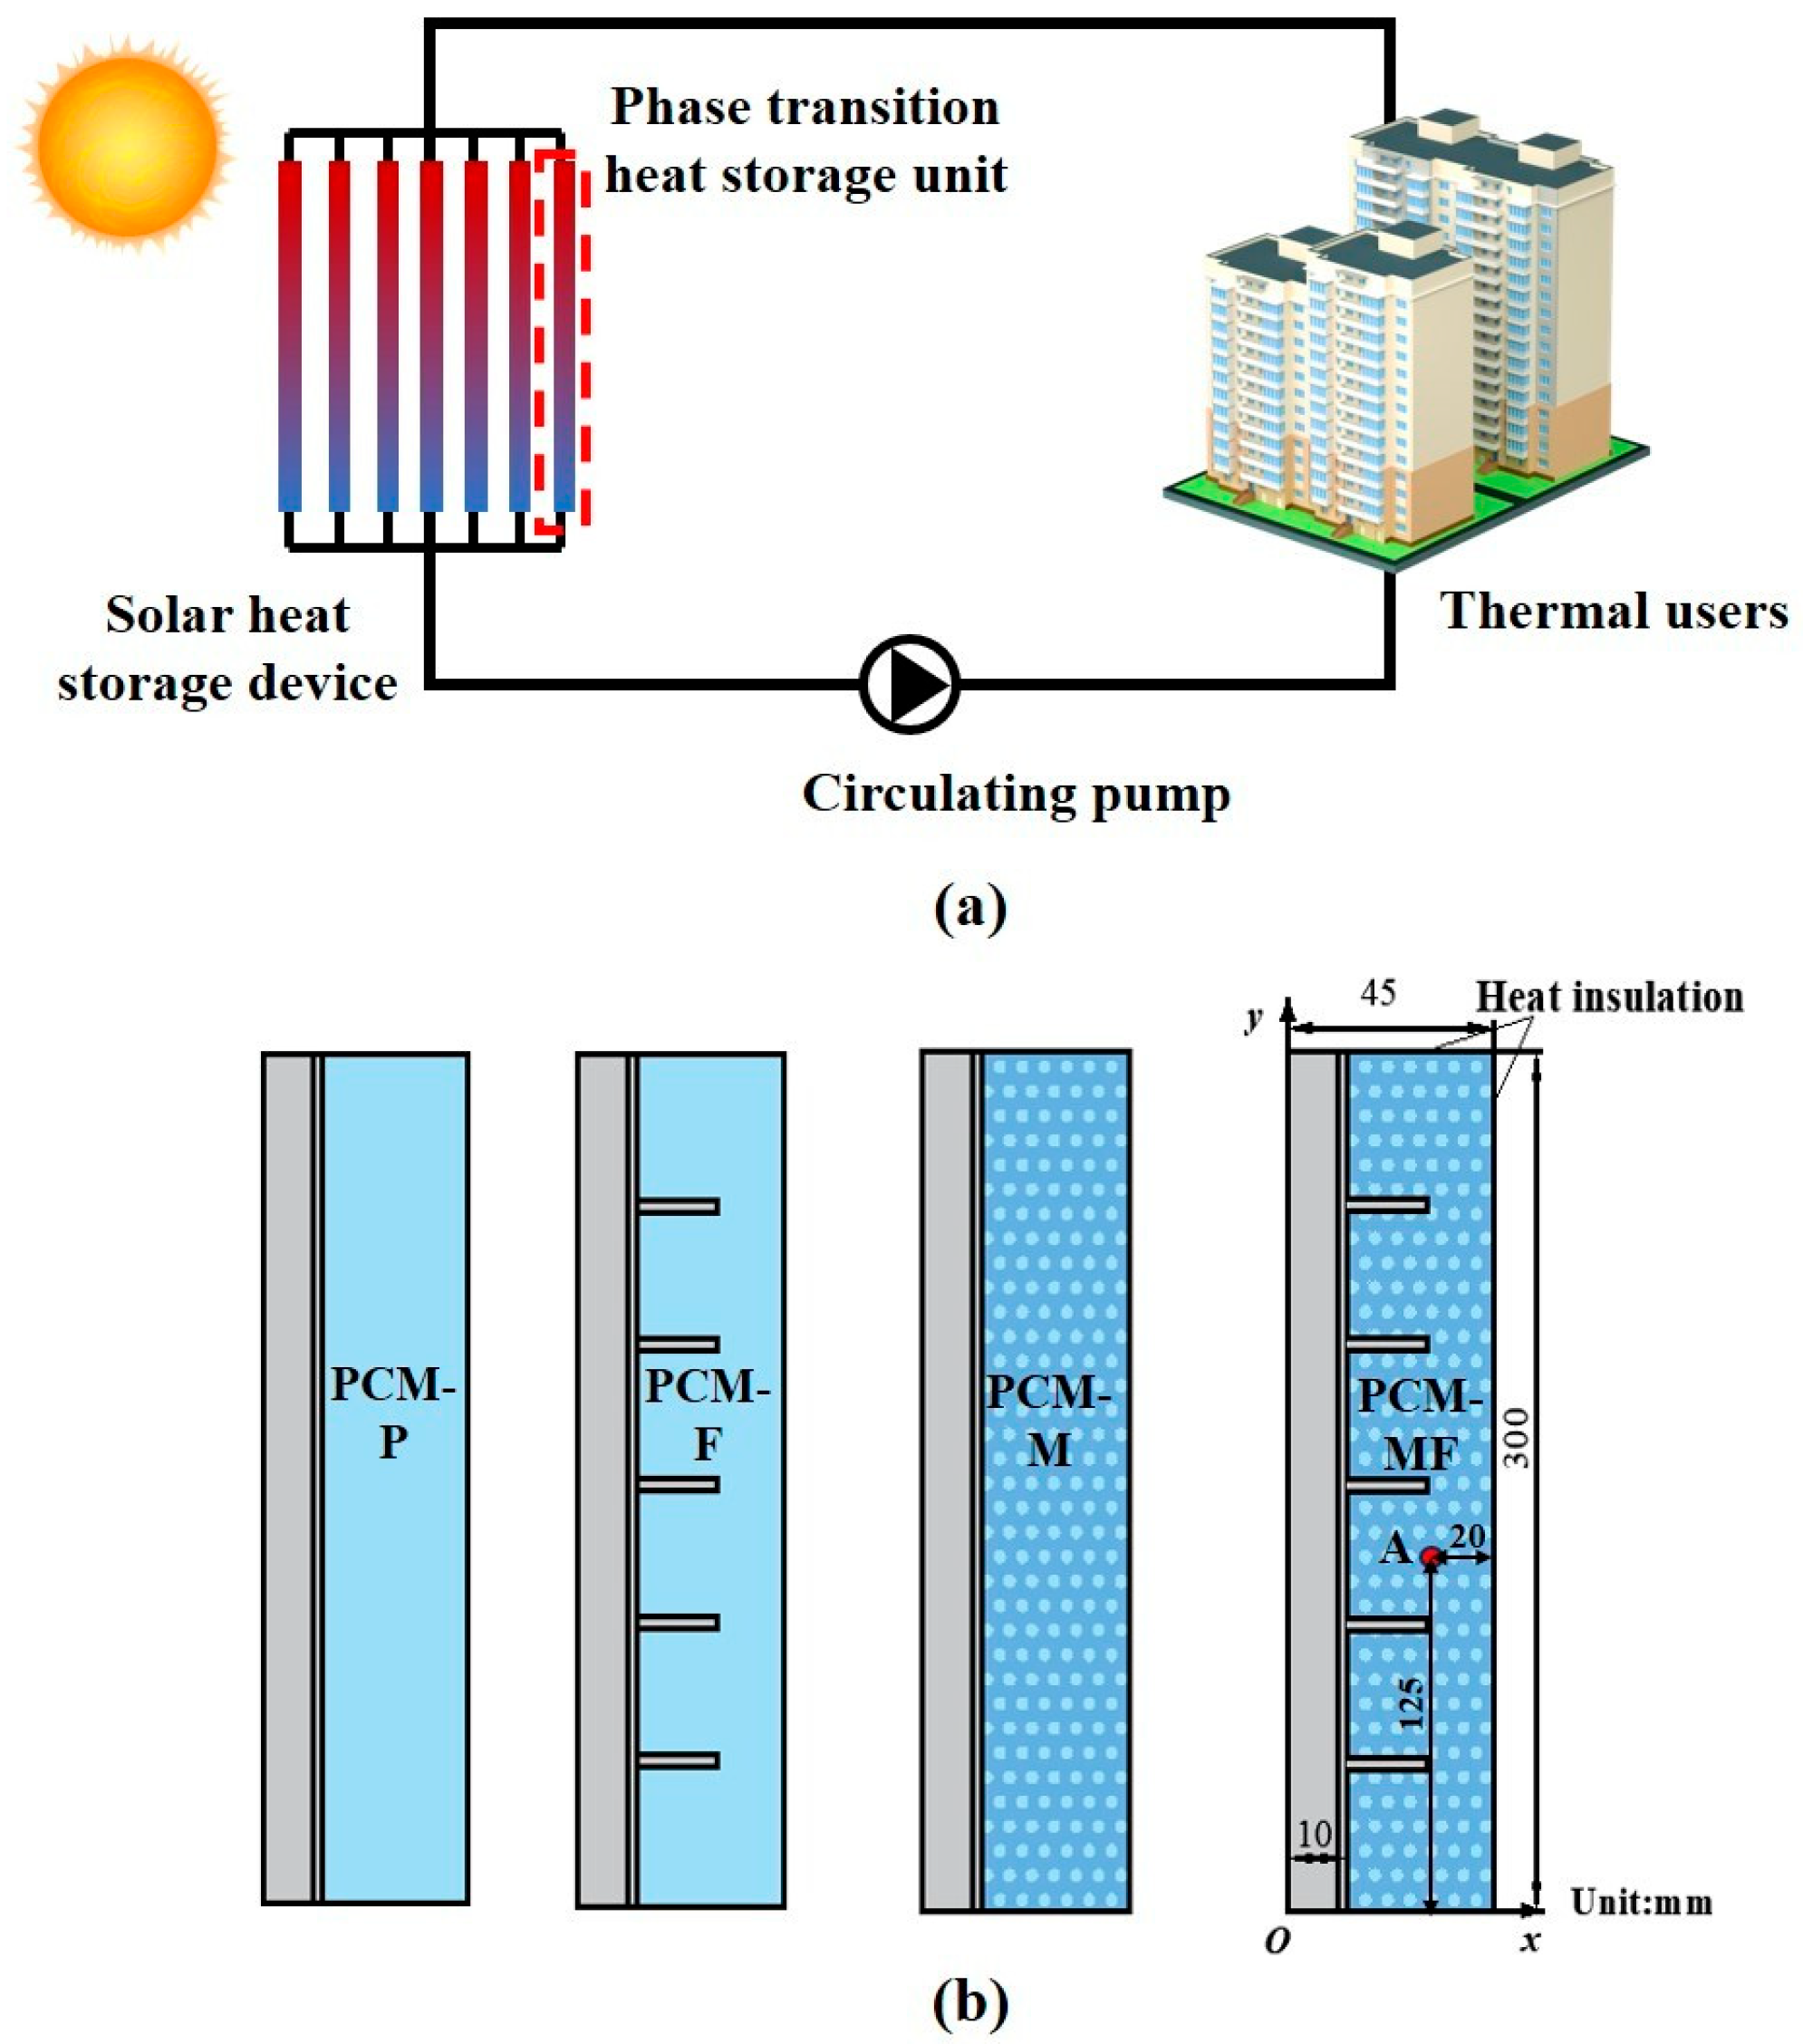
Figure 1a illustrates the principle of a solar phase-change TES system. In the heat storage phase, solar energy collected by the system is stored in the TES device using the heat transfer fluid (HTF). During heat release, the PCM solidifies and releases heat, while the HTF ensures stable heating and hot water supply for users.
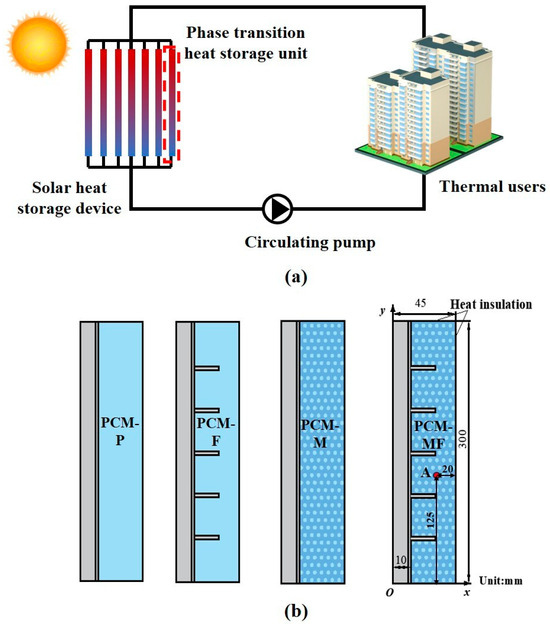
Figure 1.
Solar heating system structure and physical model: (a) Solar heating system structure and (b) Phase transition heat storage unit structure.
The TES device consists of multiple TES units connected in parallel, with each individual TES unit generally demonstrating the same thermal performance as the entire system. For this study, four types of shell-and-tube TES units with different structures were designed: smooth tube (PCM-P), finned tube (PCM-F), metallic foam tube (PCM-M), and metallic foam-finned tube (PCM-MF), as shown in Figure 1b. The TES unit has a height, inner diameter, and outer diameter of 300 mm, 20 mm, and 90 mm, respectively. Paraffin RT54 is used as the PCM, and the selected metallic foam has a porosity of 0.97 and a pore density of 10 pores per inch (PPI). The thermophysical properties are summarized in Table 1. Additionally, five annular fins are arranged at an upper distance between the finned and the metallic foam-finned tubes, with an interval of 50 mm. The study considers five different HTF flow rates, as presented in Table 2.

Table 1.
Thermophysical properties.

Table 2.
Simulation cases.
2.2. Governing Equations
For HTF:
Continuity equation:
Momentum equation:
x-direction:
y-direction:
Energy equation:
Continuity equation:
Momentum Equation:
x-direction:
y-direction:
Energy equation:
For paraffin:
For metallic foam:
where ⟨ ⟩ donates the volume average; σ accounts for the liquid fraction in porous medium, (); , , γ, , , and L present density, dynamic viscosity, thermal expansion coefficient, specific heat, thermal dispersion coefficient, thermal conductivity and latent heat for PCM, respectively; and the Forchheimer–Darcy term is utilized to reflect flow resistance in the metallic foam. represents the phase transition.
The melting fraction :
The heat transfer coefficient [40]:
Effective thermal conductivity [41]:
Thermal dispersion conductivity is determined by [42]:
Permeability K:
Inertial coefficient CE [42]:
where donates the resistance coefficient ( [43]), is defined as the tortuosity, and G indicates the shape factor [44]:
2.3. Numerical Model
To simplify the calculation process, a two-dimensional axisymmetric model is employed instead of a three-dimensional model, as shown in Figure 1a. Moreover, the following assumptions are made.
- (1)
- The porous medium is considered isotropic.
- (2)
- The melting paraffin is assumed to be incompressible, abiding by Boussinesq hypothesis.
- (3)
- Volumetric change during the phase-transition course is neglected.
- (4)
- The unit wall and external environment are considered adiabatic, and the heat contact resistance between model constituents is not taken into account.
The governing equations are calculated utilizing the finite volume method. The PRESTO! format is utilized for pressure correction of the fluid, and other physical quantities are discretized using the second-order upwind method. The momentum, pressure correction, energy, and liquid fraction relaxation factors are set to 0.6, 0.3, 0.8, and 0.7, respectively, for continuity, momentum, and energy equations. To ensure consistency in initial and boundary conditions, the initial temperature of the TES unit is set to 20 °C. The following boundary conditions are applied.
- (1)
- The “velocity-inlet” boundary condition is set, with the water flowing into the inlet at a temperature of 70 °C.
- (2)
- The HTF outlet is set as a pressure outlet at one atmosphere.
- (3)
- The walls in proximity to the paraffin and water are considered coupled thermal exchange zones.
- (4)
- The outer tube walls are regarded without heat exchange with the external environment.
2.4. Simulation Verification
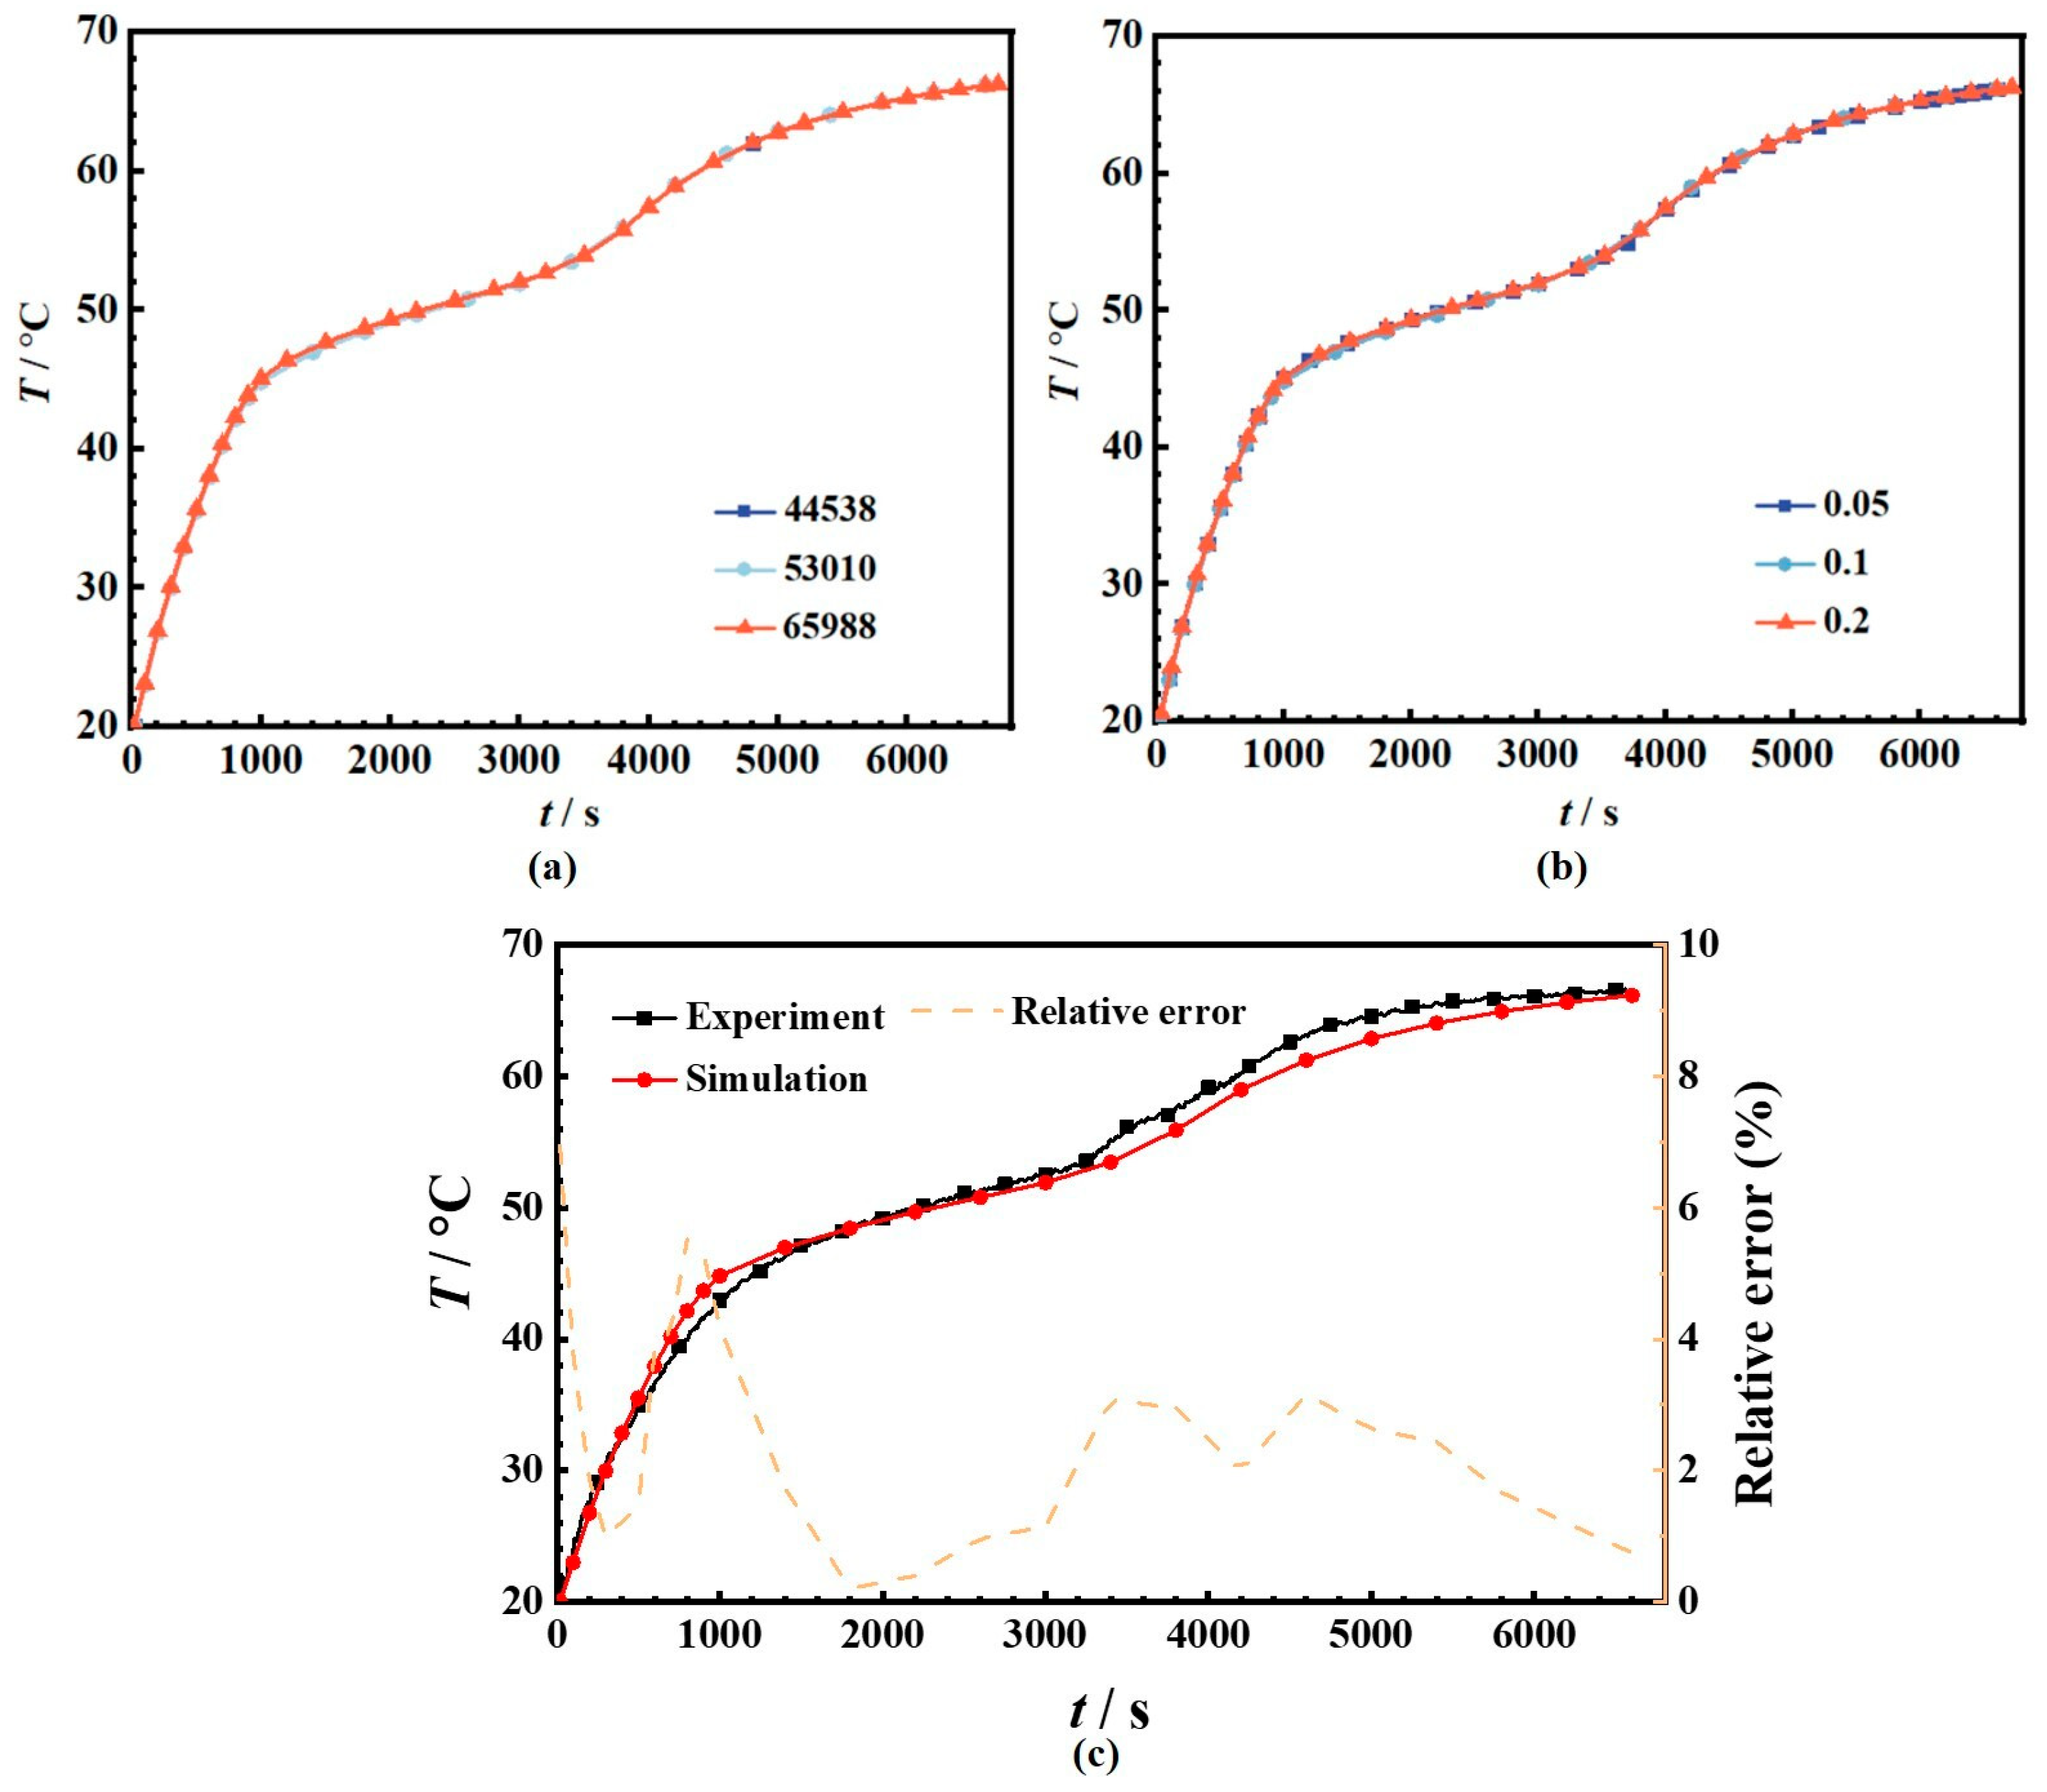
In numerical simulations, the number of grids and time step are crucial factors influencing accuracy and calculation costs. To address this, the results of three grid numbers (44,538, 53,010, and 65,988) and time steps (0.05 s, 0.1 s, and 0.2 s) are compared, as depicted in Figure 2a,b. The temperature variation curves of monitoring point A (125 mm away the bottom and 20 mm from the outer wall), as shown in Figure 1b, align well across the three grid numbers, indicating that the grid resolution meets the accuracy requirements. Evaluating the phase-interface counters, it is observed that mesh 53,010 exhibits a clear phase interface, while mesh 44,538 does not show a distinct phase distribution. Considering overall computational speed and accuracy, mesh 53,010 is selected. Similarly, in terms of speed and accuracy, a time step of 0.1 s is determined. To ensure the feasibility of the numerical model, the simulation results of case 19 are compared with experimental results. Monitoring point A is used to evaluate the accuracy of simulation, as depicted in Figure 2c. The results show that the relative error between the numerical and experimental is less than 7%, which falls within the acceptable range for this research.
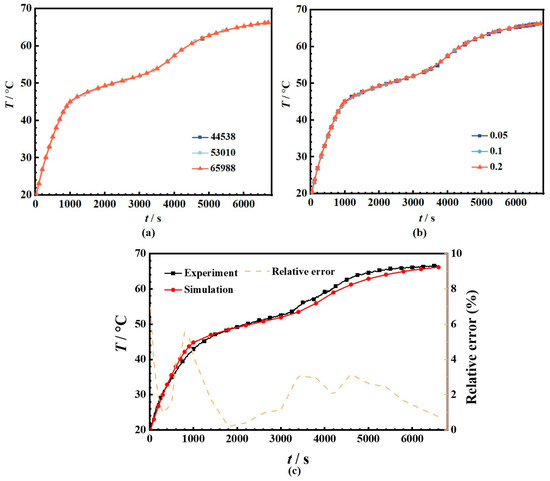
Figure 2.
Simulation verification: (a) Mesh, (b) Time step and (c) Numerical verification.
3. Building Energy Consumption Simulation
3.1. Research Object
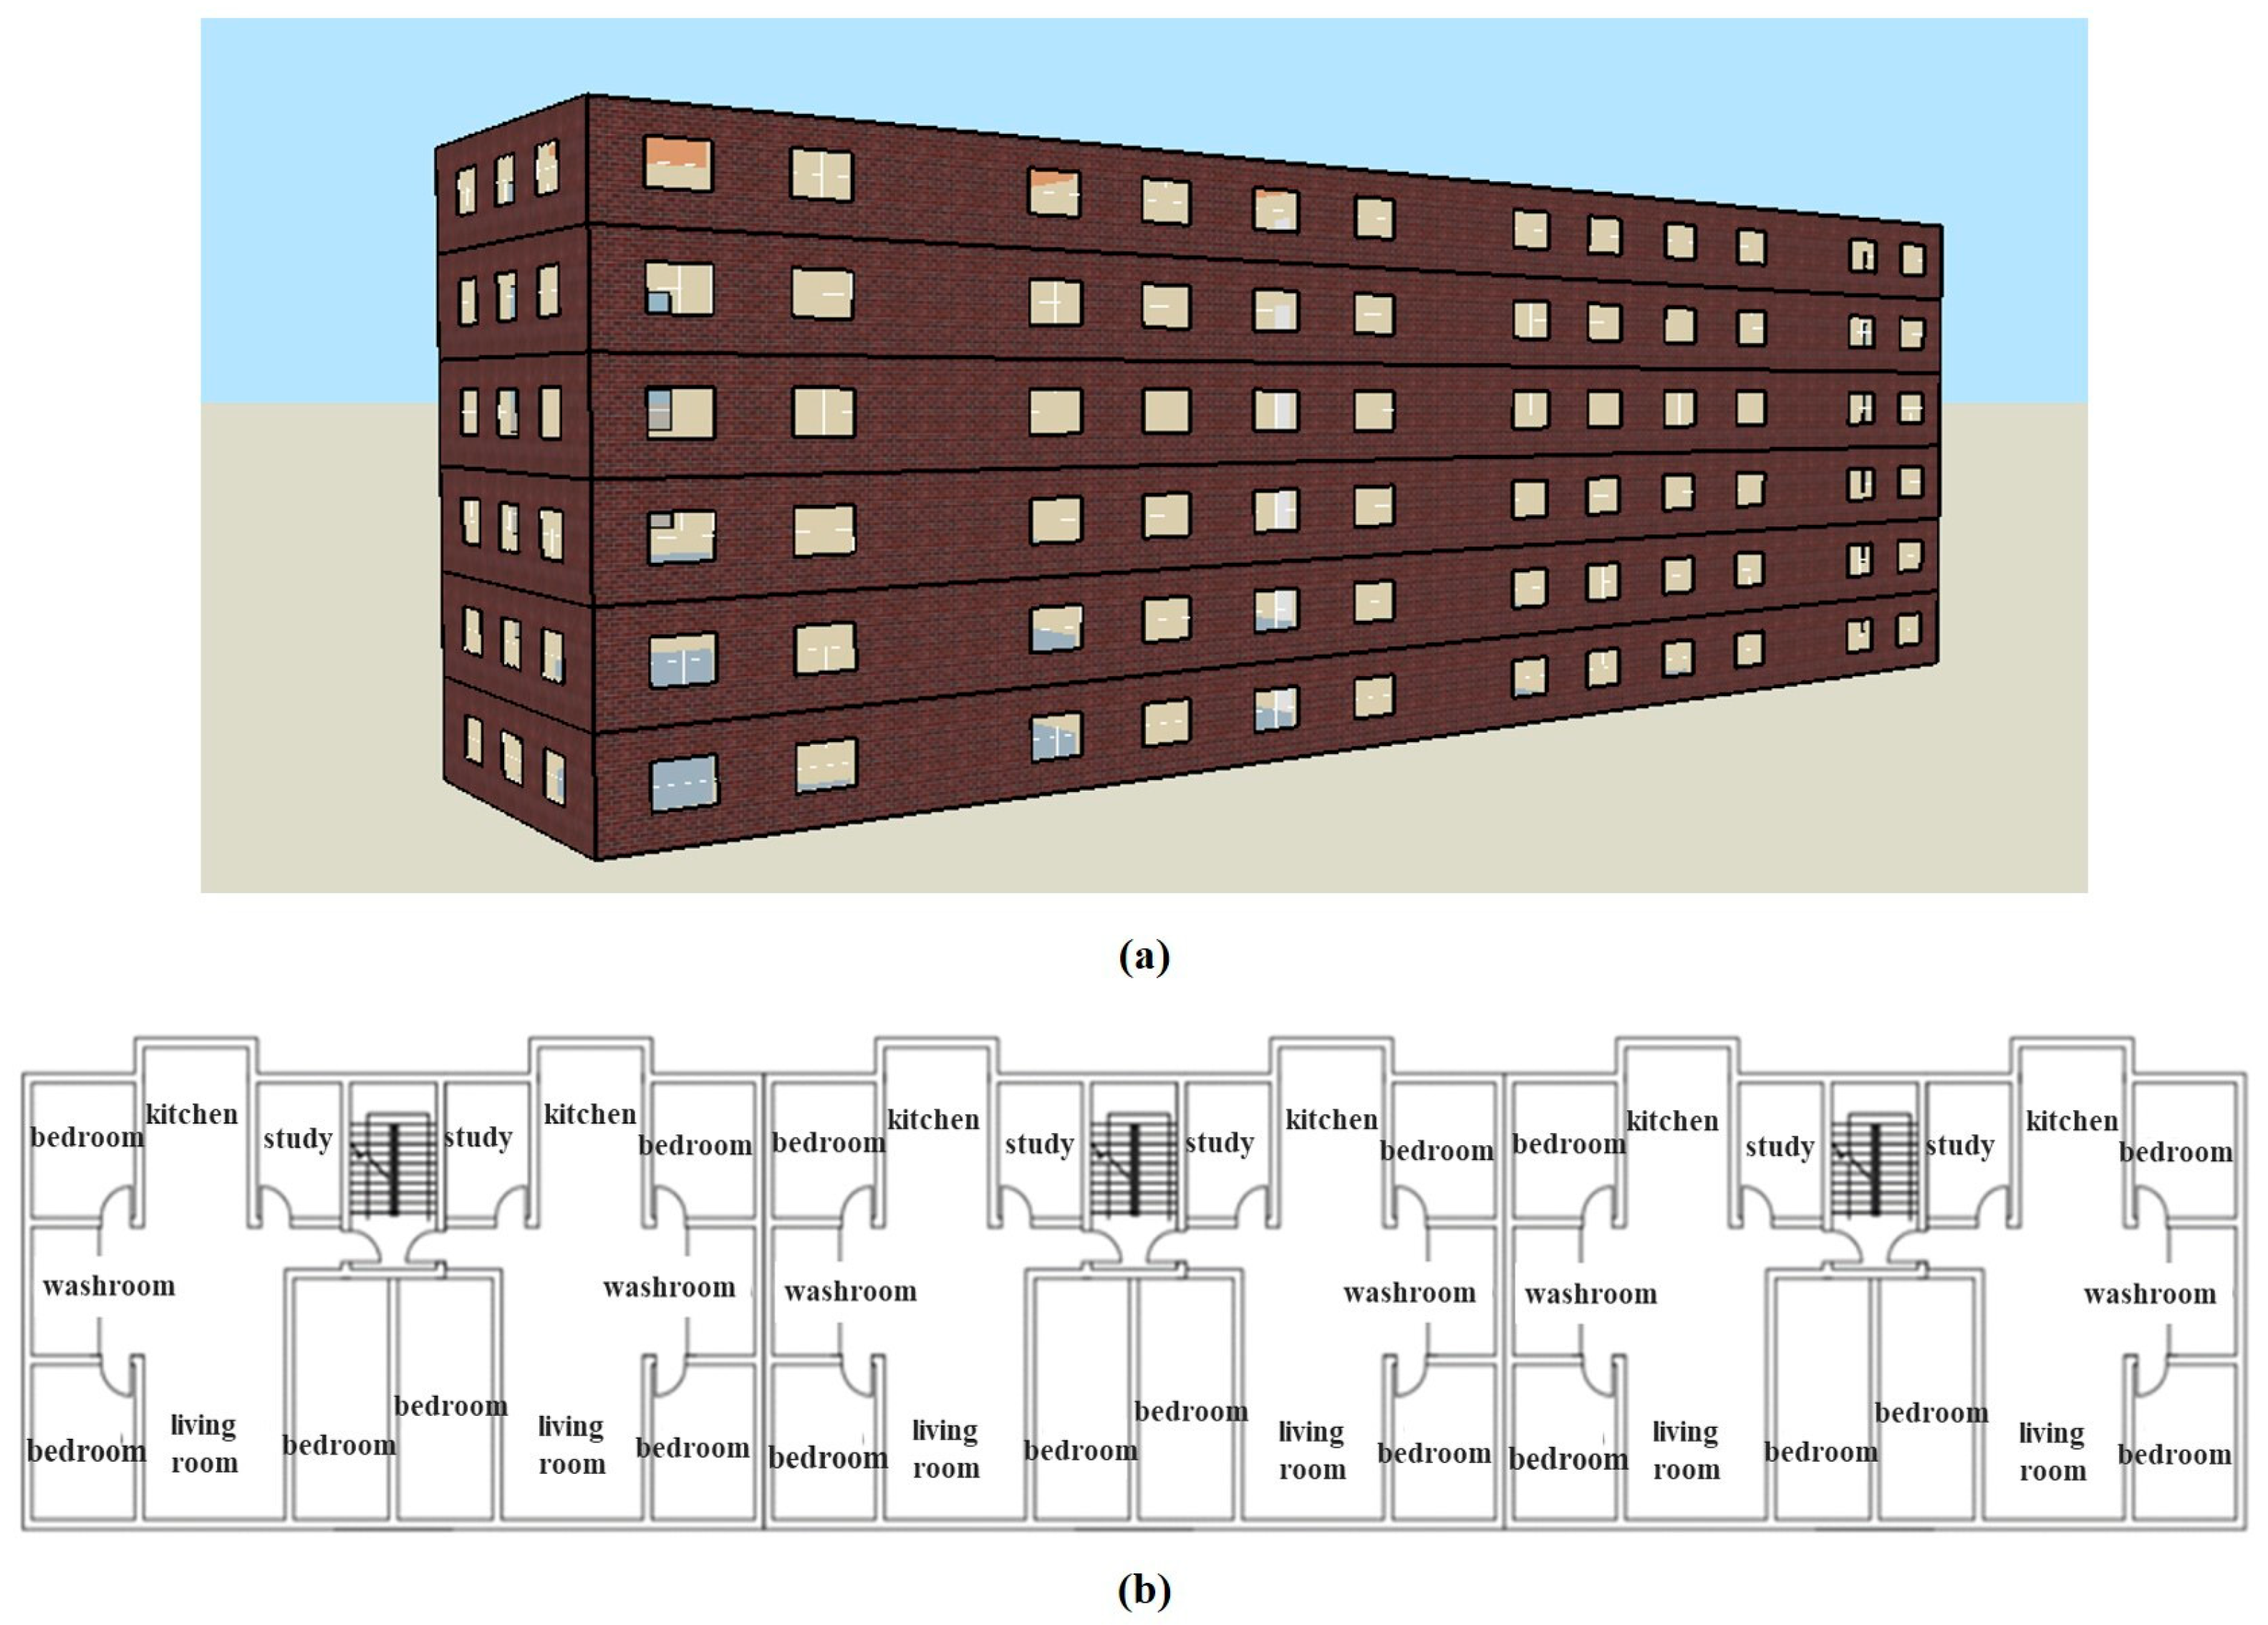
This study focuses on a residential building located in Xi’an. A simulation model of a phase-change TES heating system is established for this research. The residential building selected is a typical structure comprising three units with six floors in total. The floor height is 3.0 m, and each floor covers an area of 485 m2. Figure 3 displays the building model. Furthermore, EnergyPlus 9.3.0 is utilized to simulate the hourly heat consumption during the 2022–2023 heating season.
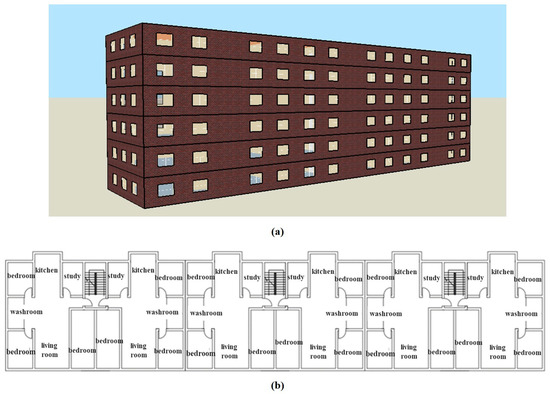
Figure 3.
Building model: (a) Building structure and (b) Architectural plan.
3.2. Engineering Data
The design parameters for interior and exterior conditions, as well as maintenance structure parameters, are implemented in accordance with the JGJ26-2018 Design Standard for Energy Efficiency of Residential Buildings in Cold and Cold Areas. These parameters are summarized in Table 3. The exterior temperature for Xi’an during winter is −3.4 °C, while the interior heating temperature for the building is set at 20 °C. Additionally, internal disturbances such as personnel activities, equipment power, and lighting are defined following the standard guidelines. The ventilation frequency is calculated to be 0.5 air changes per hour (ac/h).

Table 3.
Building envelope parameters.
4. Results and Discussion
4.1. Thermal Assessments
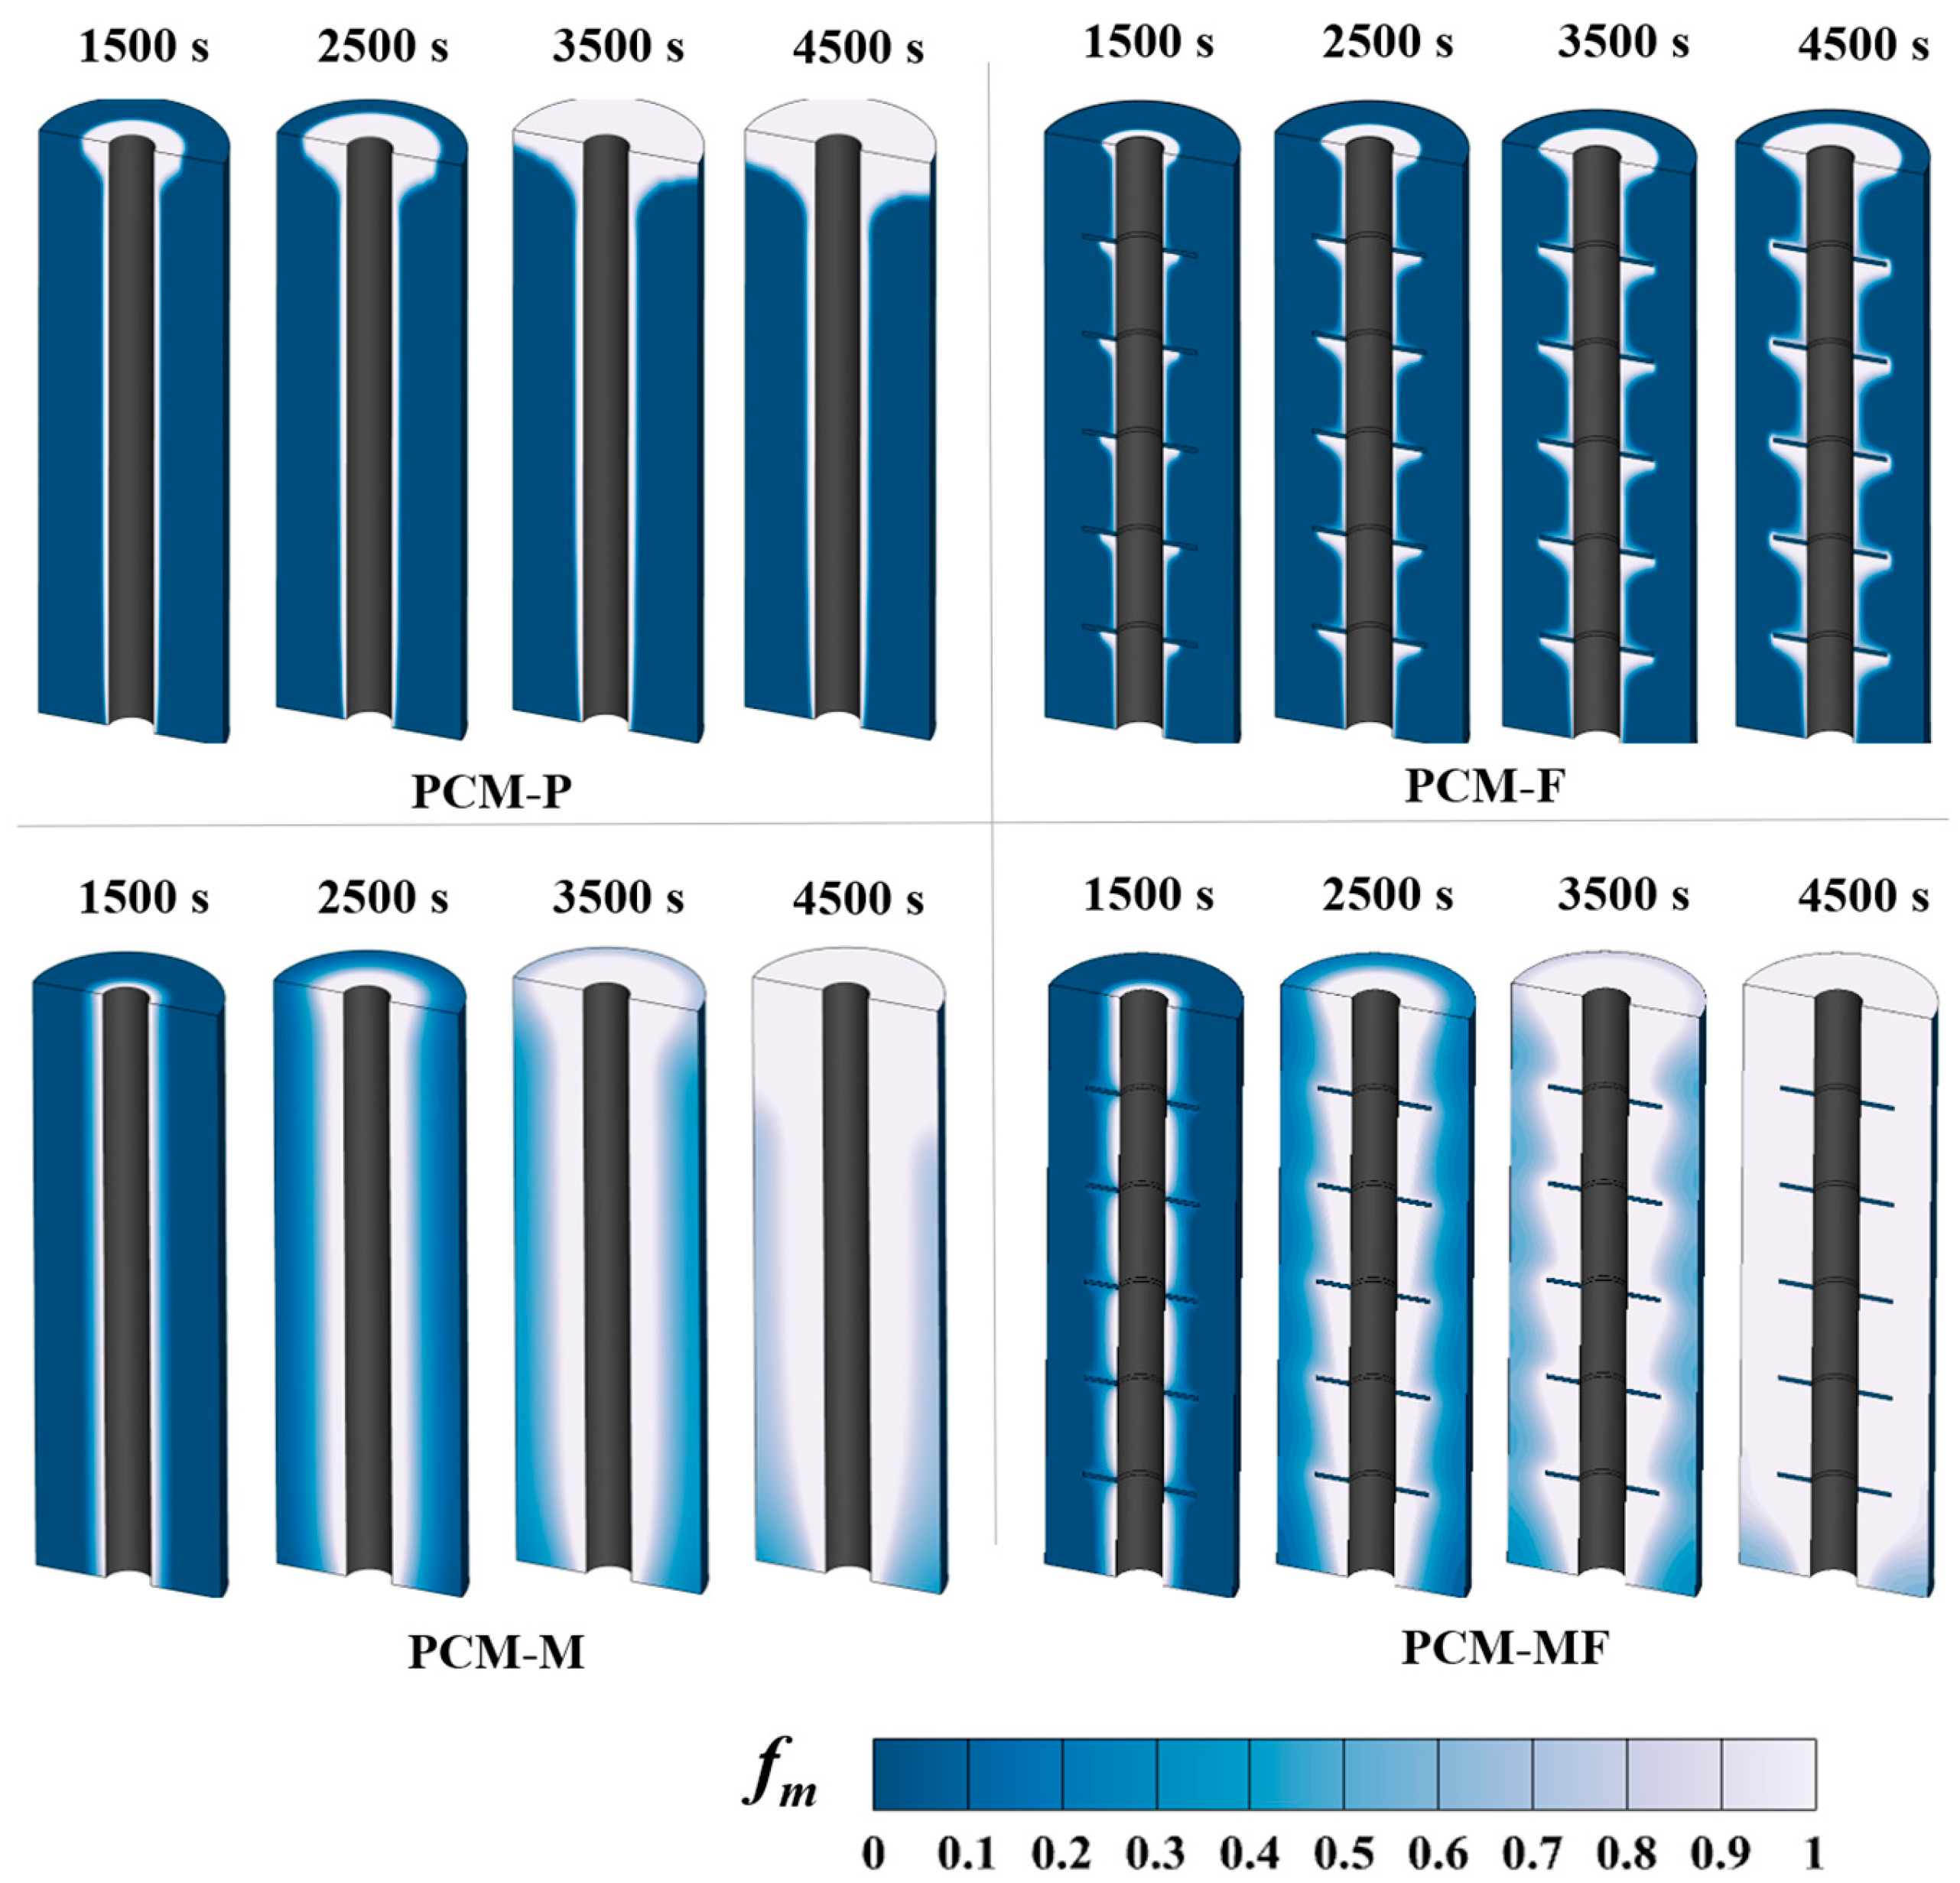
For demonstrating a clear understanding of the impact of TES unit structure on phase interface migration, Figure 4 presents a comparison of phase interface distributions at 1500 s, 2500 s, 3500 s, and 4500 s for a velocity of 0.2 m/s. The findings demonstrate that the inclusion of metallic foam and fins enhances the charging speed. Additionally, the thermal transfer effect of the metallic foam-finned tube surpasses that of the other three structures. Regarding the phase interface profile, the smooth tube exhibits a certain degree of inclination, which gradually increases during the transition process because of natural convection. In contrast, the inclination of the phase interface in the metallic foam tube is less noticeable, since the porous medium facilitates better heat transfer to the paraffin. This improves the uniformity of the temperature distribution in the paraffin, thus inhibiting natural convection. The finned tube and metallic foam-finned tube exhibit zigzag phase interfaces at 2500 s on account of the presence of fins, with the PCM near the fins charging first. As the phase-transition heat transfer progresses, the charging rate of the finned tube phase interface slows down, and the phase interface remains jagged. Conversely, the composite metallic foam-finned structure allows heat flow in the metallic foam-finned tube to transfer to the interior of the PCM, resulting in a gradual and vertical phase interface. At t = 4500 s, the smooth tube barely shows any paraffin melting, the finned tube has approximately half of the paraffin melted, the metallic foam tube has around two-thirds melted, and the metallic foam-finned tube has almost completely melted. These results indicate that the introduction of metallic foam between fins obviously enhances thermal performance in both directions, allowing even for thermal transfer from the HTF tube wall to the interior of the paraffin.
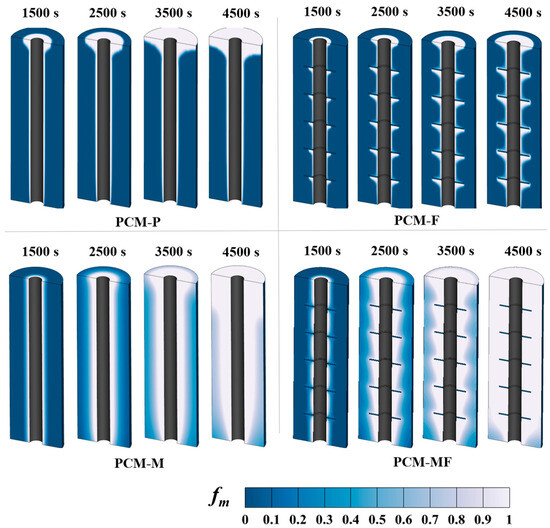
Figure 4.
The phase-interface contours of four structures.
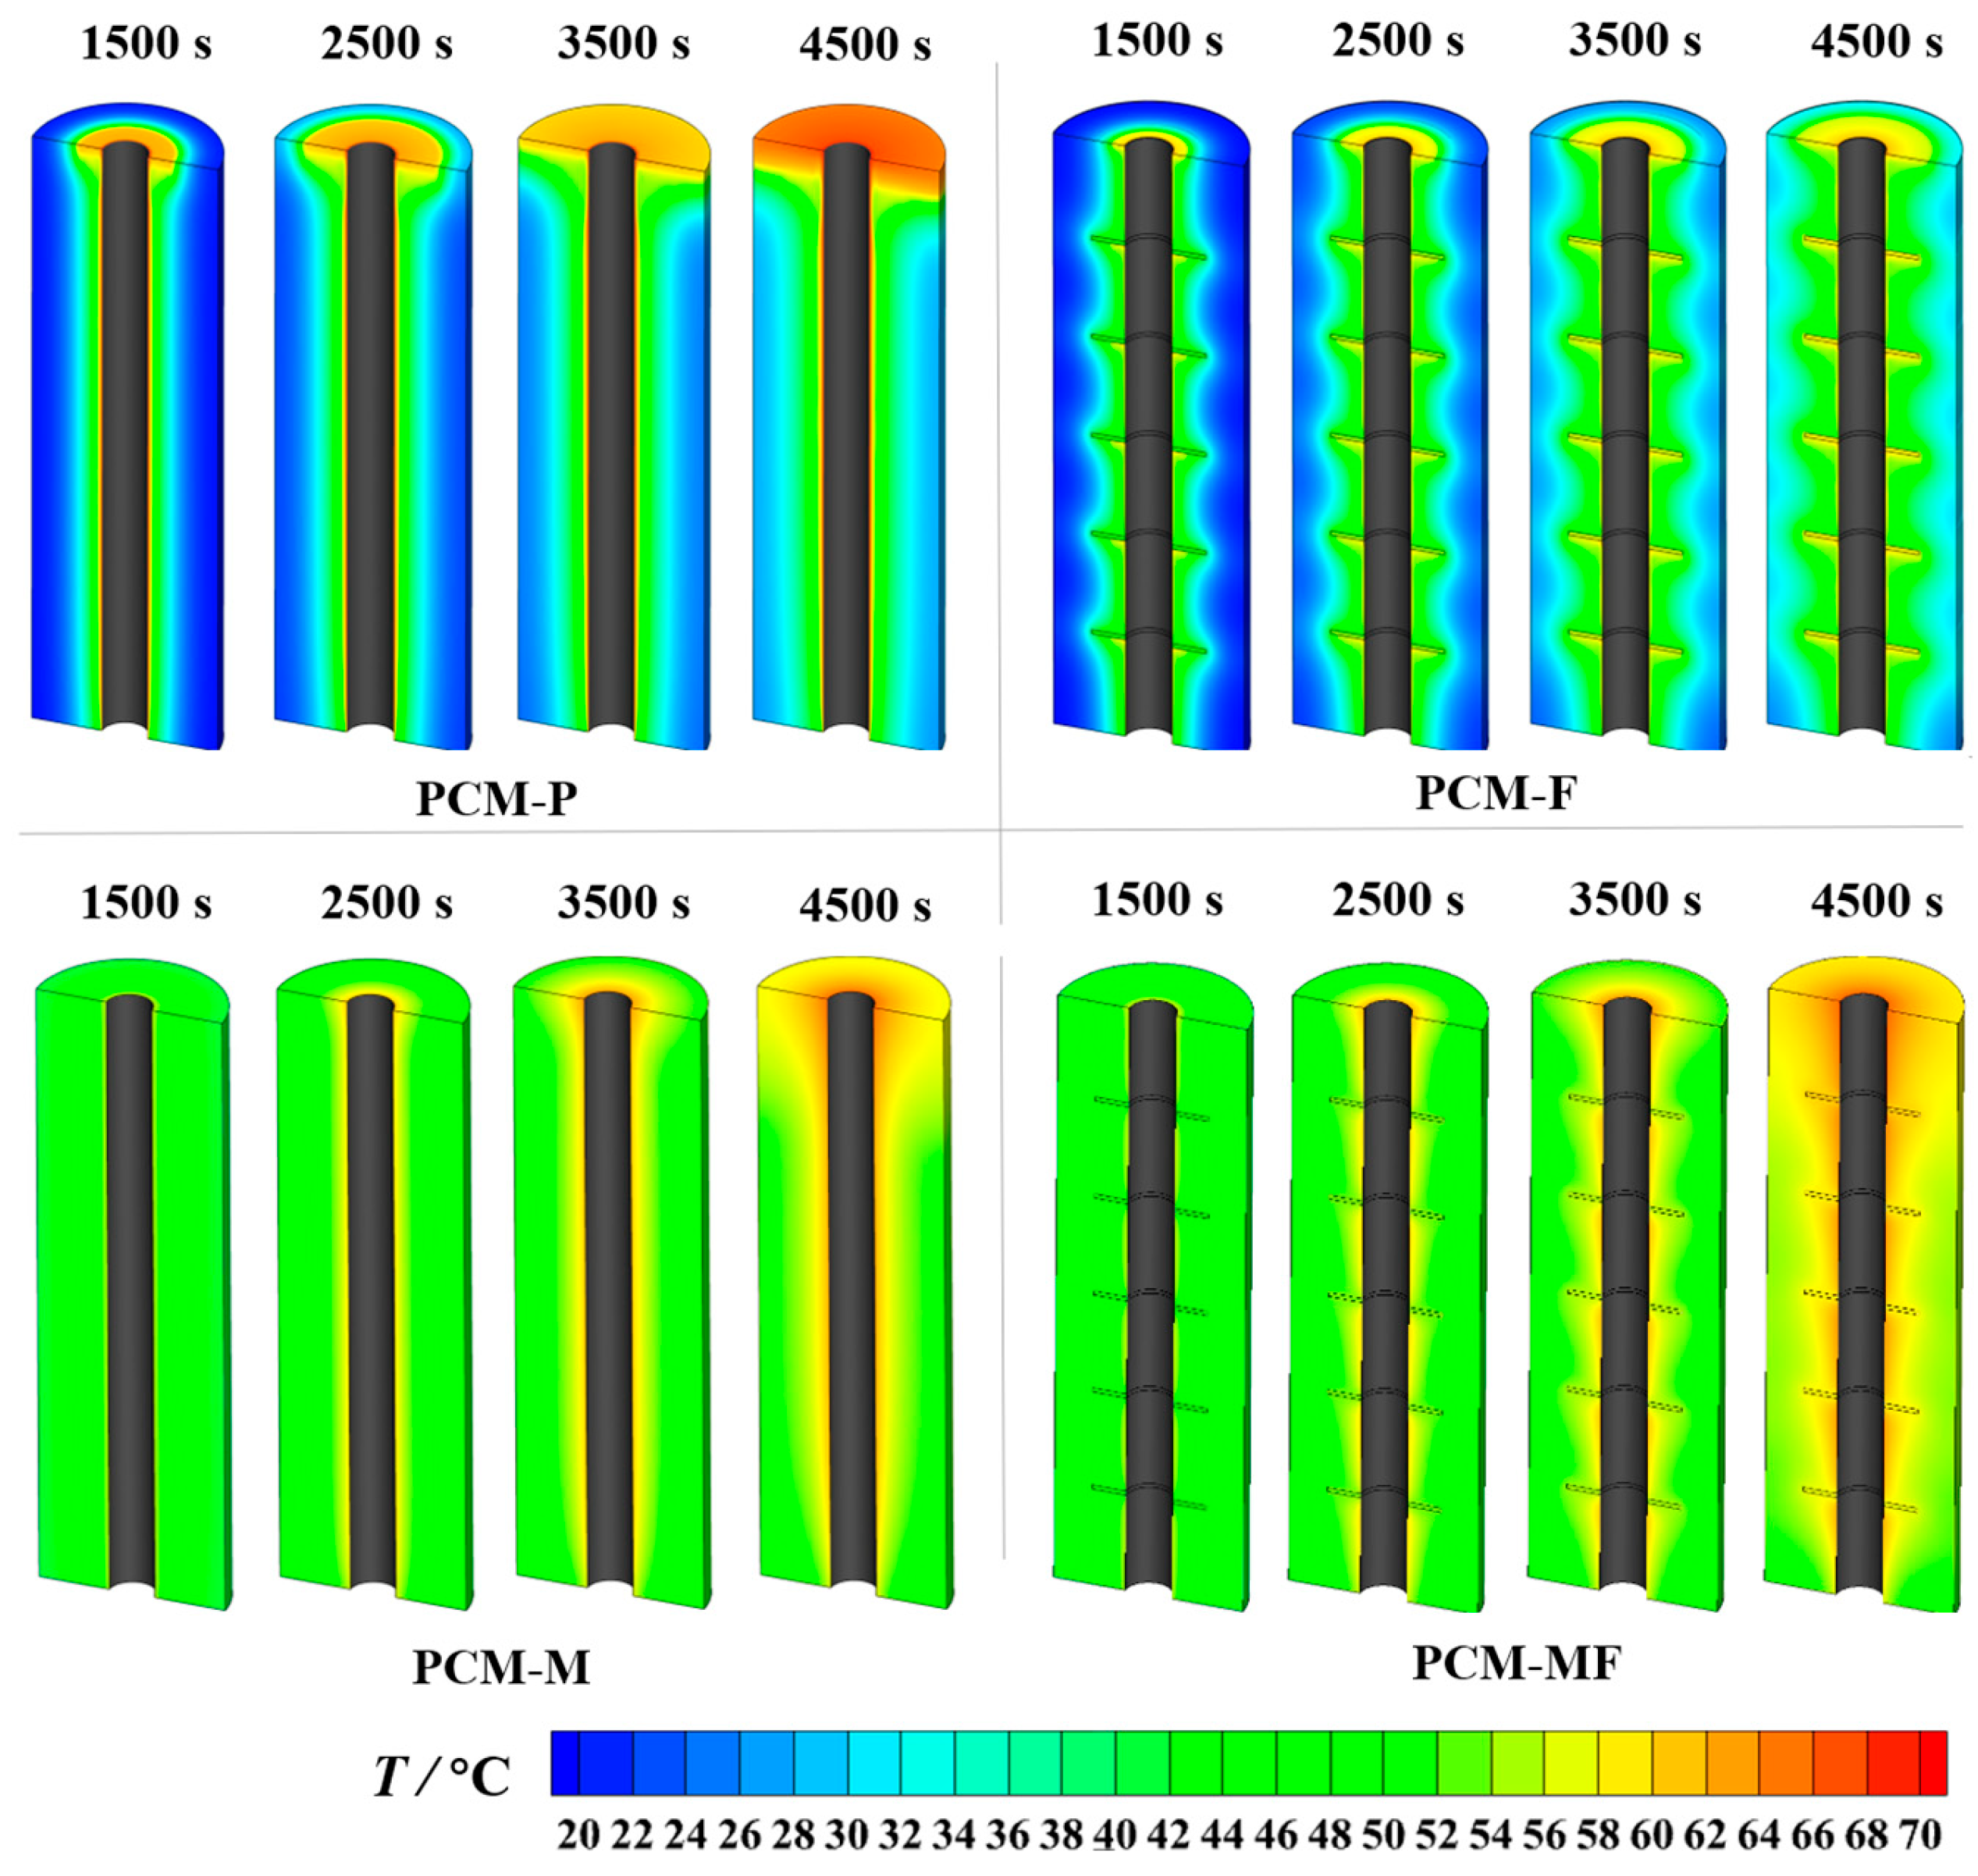
In terms of the temperature field, the temperatures of all four structures increase over time, as demonstrated in Figure 5. The smooth tube exhibits a large overall temperature gradient, with higher temperatures observed in the top region and near the HTF wall. At 4500 s, the regional temperature difference can reach 38 °C. Conversely, the temperature fields of the other three structures are more uniform, particularly those of the metallic foam tube and the metallic foam-finned tube. Additionally, the temperature field of the finned tube demonstrates a corrugated pattern, with the temperature gradient decreasing from the outer tube to the inner tube. This phenomenon can be ascribed to the enhancement of thermal performance by the fins, which facilitate the transfer of heat to the interior of the paraffin along the fins. Simultaneously, the high heat-conducting property of the metallic foam improves the uniformity of the temperature field, as thermal energy is evenly transferred to the paraffin along with the metallic ligament. These findings provide strong evidence that metallic foam contributes to the heat conductivity and uniformity.
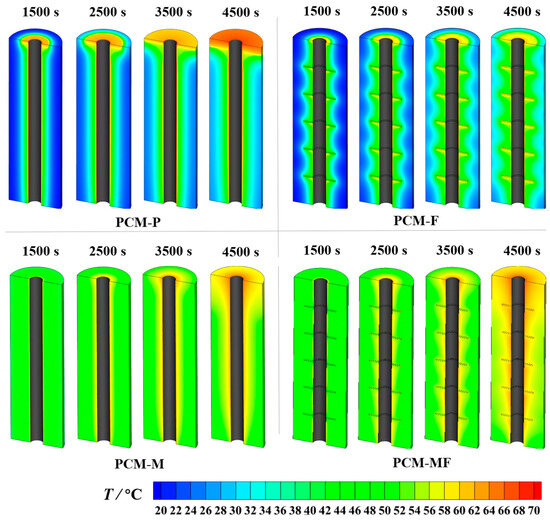
Figure 5.
The temperature contours of four structures.
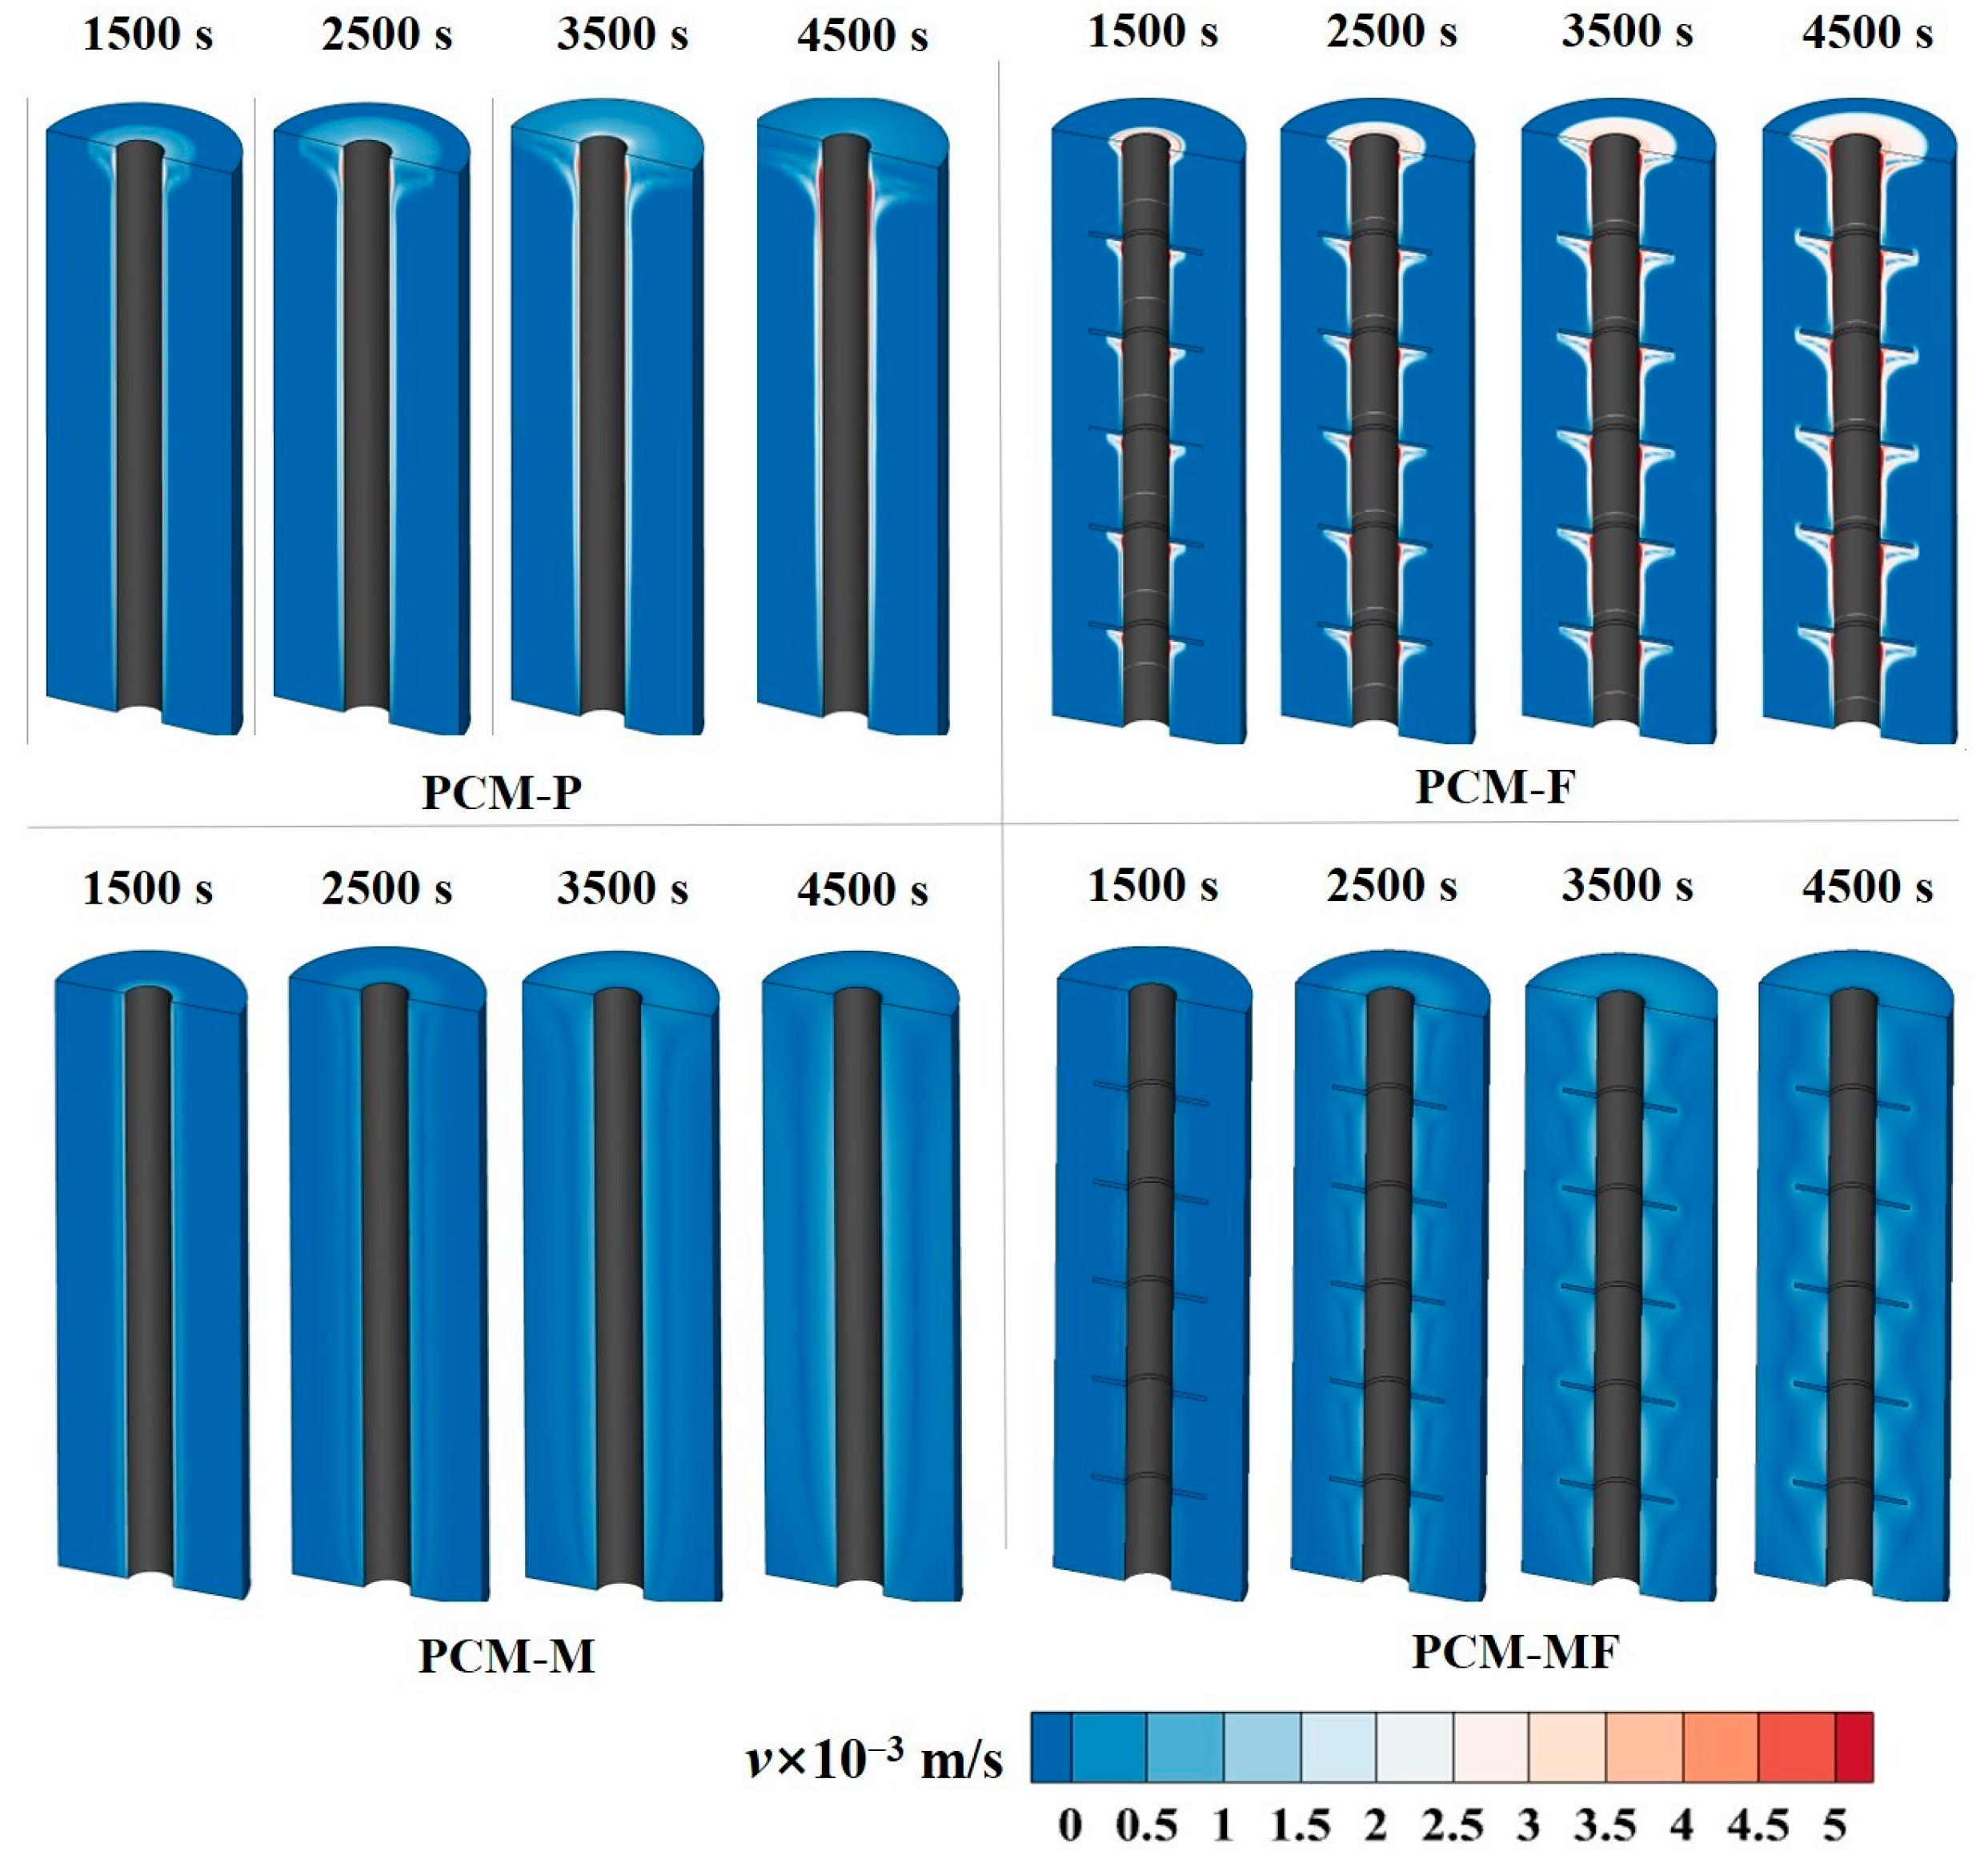
The flow velocity field reflects the strength of natural convection and the local natural convection enhances the advancement of the phase interface to some extent, but also intensifies the inhomogeneity of the temperature field. As depicted in Figure 6, natural convection serves as the dominant mechanism in smooth tubes, with the maximal velocity of liquid paraffin in smooth tubes reaching 5.1 × 10⁻³ m/s. The application of metallic foam inhibits natural convection, leading to a shift in the dominant mechanism from natural convection to heat conduction. As a result, the velocity gradient of PCM significantly decreases, and the flow velocity of the metallic foam tube and the metallic foam-finned tube is one order of magnitude lower than that of the smooth tube and the finned tube. To further explore the effect of enhanced heat transfer methods on both the HTF and PCM side, the charging time and heat flux at various HTF flow rates are discussed below.
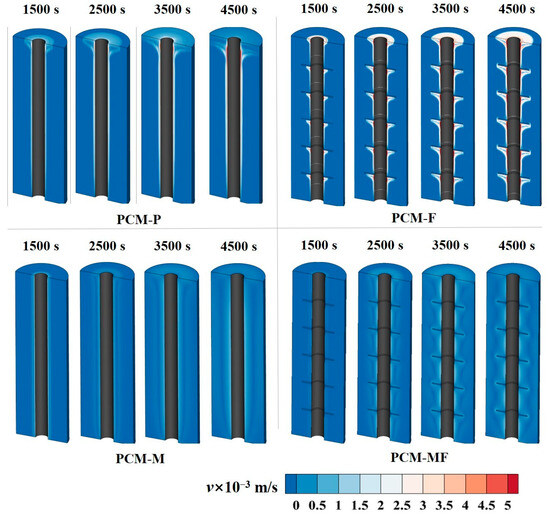
Figure 6.
The velocity contours of four structures.
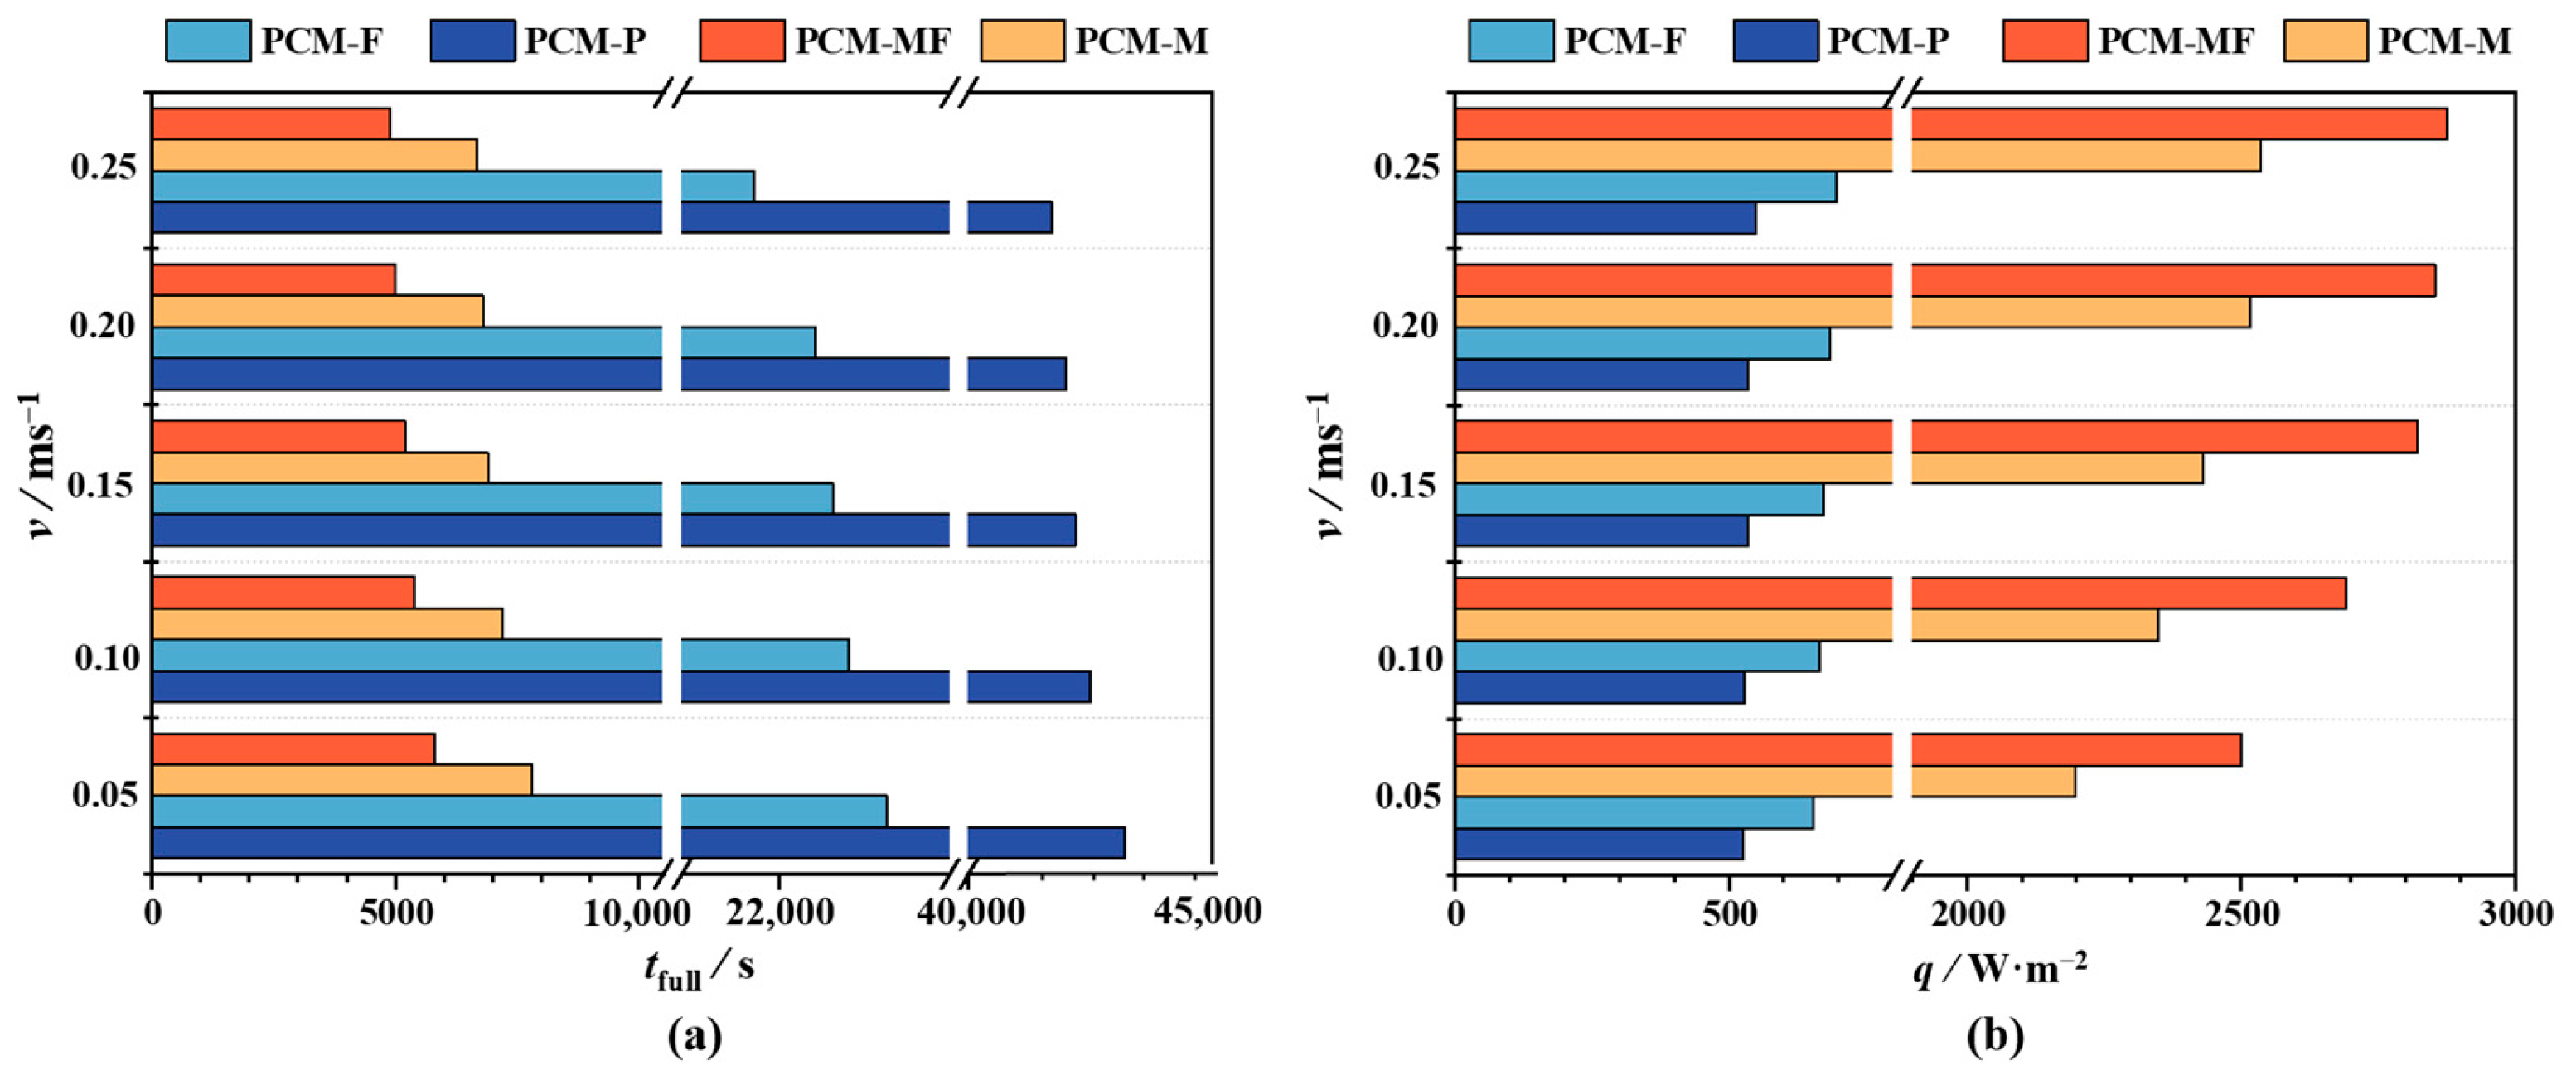
Figure 7a illustrates the influence of different flow rates on complete charging time. The results demonstrate that as the flow rate increases, the complete charging time steadily decreases. Regarding the charging process with a flow rate of 0.05 m/s, the complete melting times are 43,200 s for PCM-P, 24,200 s for PCM-M, 7800 s for PCM-F, and 5800 s for PCM-MF, achieving reductions of 48.5%, 83.9%, and 88.3%, respectively, compared to PCM-P. Increasing the flow rate to 0.25 m/s results in respective reductions of 1730 s (3.5%), 2720 s (11.2%), 1120 s (14.4%), and 900 s (15.5%) in complete melting time compared to a flow rate of 0.05 m/s. For the metal foam tube, the complete phase-transformation time of 0.10 m/s, 0.15 m/s, 0.20 m/s and 0.25 m/s is shortened by 6.9%, 7.69%, 8.00% and 8.16% compared with the flow rate of 0.05 m/s, and the optimization efficiency is higher when the velocity is increased from 0.05 m/s to 0.15 m/s. These findings clearly demonstrate that the introduction of metallic foam and fins optimizes the charging efficiency, and increasing the flow rate of the HTF is an effective means to improve phase transition efficiency.
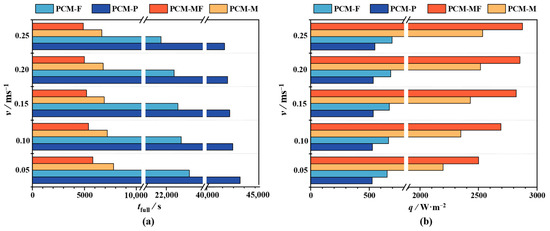
Figure 7.
Effect of various flow velocity of four kinds of TES units: (a) Complete melting time and (b) Heat flux.
Figure 7b directly illustrates the effect of velocity changes on the heat flux of the outer wall of the heat exchange tube. It is evident that within the range of 0.05–0.25 m/s, a higher flow rate results in a greater heat flux. For a flow rate of 0.05 m/s, PCM-P exhibits a heat flux of 525.3 W/m2. With this as a baseline, the heat fluxes for PCM-M, PCM-F, and PCM-MF increase by 25.1%, 320.0%, and 337.9%, respectively. At a flow rate of 0.25 m/s, the heat flux for all four TES units improves by 4.52%, 6.41%, 15.39%, and 14.99%, respectively, compared to a flow rate of 0.05 m/s. The results indicate that the flow rate has the greatest impact on PCM-MF, followed by PCM-M, PCM-F, and PCM-P. In terms of the metal foam tube, the heat flux of 0.10 m/s, 0.15 m/s, 0.20 m/s and 0.25 m/s is increased by 7.57%, 11.92%, 12.49% and 13.13%. This is because the total resistance is a combination of the HTF and PCM side. In the case of pure paraffin, the thermal resistance of the PCM side is significantly higher than that of the HTF side. Increasing the HTF velocity has limited impact on promoting phase transition. However, the addition of metallic foam and fins effectively mitigates this issue, especially when metallic foam and fins are combined. This approach effectively reduces thermal resistance on the PCM side, making the strengthening effect of increasing flow velocity on reducing heat resistance on the HTF side more pronounced.
4.2. Economic Analysis
4.2.1. Initial Cost
This study analyzes the benefits of optimizing TES units using an economic analysis method. We assume that the heat stored in the phase-change TES unit is completely utilized, and the heat loss (the shell is wrapped with thermal insulation cotton) is ignored, thus calculating the initial investment and operating costs. The initial investment and operating costs of TES units are calculated for various flow rates. The economic benefits of the four composite structures are evaluated by calculating the return on investment time. The profit-return time T is defined as follows:
where is initial cost and donates annual cost reduction during heating system operation.
Compared to traditional plate–fin solar heat exchangers, the manufacturing cost of latent TES heat exchangers is obviously higher. The initial investment cost of the heat storage device primarily includes material costs and welding manufacturing costs . The metallic foam is cut from the metallic foam board at a cost of 25,000 yuan per cubic meter, while the ring fin costs 2 yuan per piece, and the single heat storage tube device costs 30 yuan. In accordance with the manufacturing process, the welding cost is merely a small portion of the total material cost—approximately 10%. Consequently, the initial investment can be calculated as follows:
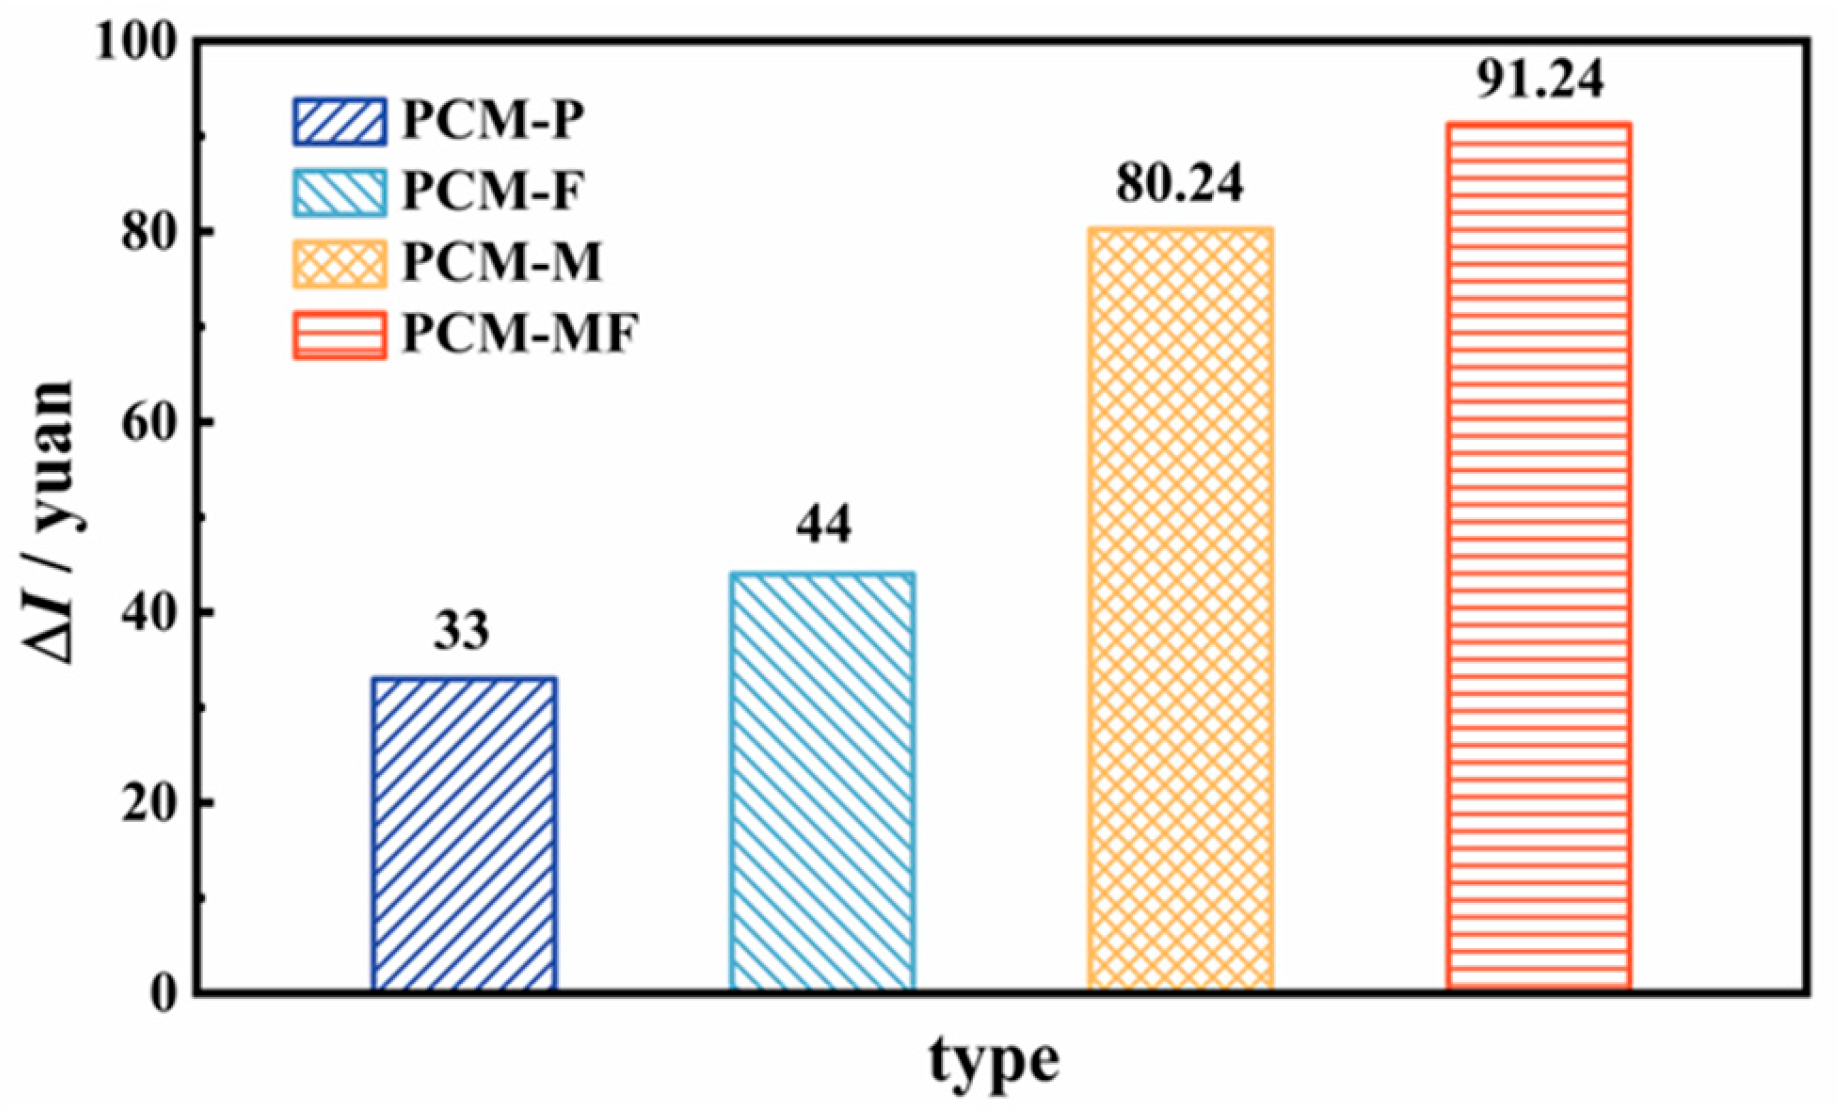
Additionally, since the metallic foam is inserted and welded into the gap between contiguous circular fins, the cost of the metallic foam is principally determined by the void volume of the heat storage device (PCM volume). Using the calculation method described above, we can determine the unit price of the four types of storage tubes, as shown in Figure 8.
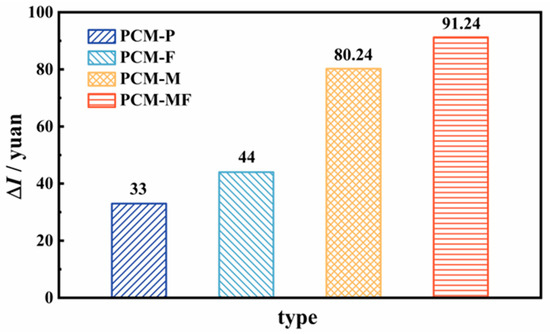
Figure 8.
Unit price of four kinds of structures.
4.2.2. Operating Cost
For the solar TES heating system, which includes power-consuming equipment such as water pumps, it is necessary to calculate the resistance loss along the pipeline at various flow rates. In this study, we assume that a TES device is composed of 10 TES units in parallel, and the length of the pipeline (excluding the length of the device heat pipe) is denoted L (estimated at 10 m). The operating time N of the solar TES heating system is acquired based on the daylight time (5 h in Xi’an). The calculation formula for pipeline resistance loss is as follows:
where donates resistance loss along the pipeline; presents resistance coefficient along the pipeline; represent the length of the pipeline (10 m), pipe diameter (0.2 m), length of heat storage tube (0.3 m) and diameter of the TES tube (0.02 m), respectively; and n accounts for the number of accumulator tubes (10).
Pipeline resistance coefficient λ:
Under ideal conditions, the performance period of the annual solar TES system with reference to the heating season is 121 days, and the electricity is estimated according to the current Xi’an residential electricity price standard 0.4983 yuan/kWh, then the operating cost of the solar TES system in the heating period is:
The daily complete heat storage volume of a single TES unit :
The complete heat storage and daily benefits of a single TES unit can be calculated as:
4.2.3. Payback Period and Daily Return
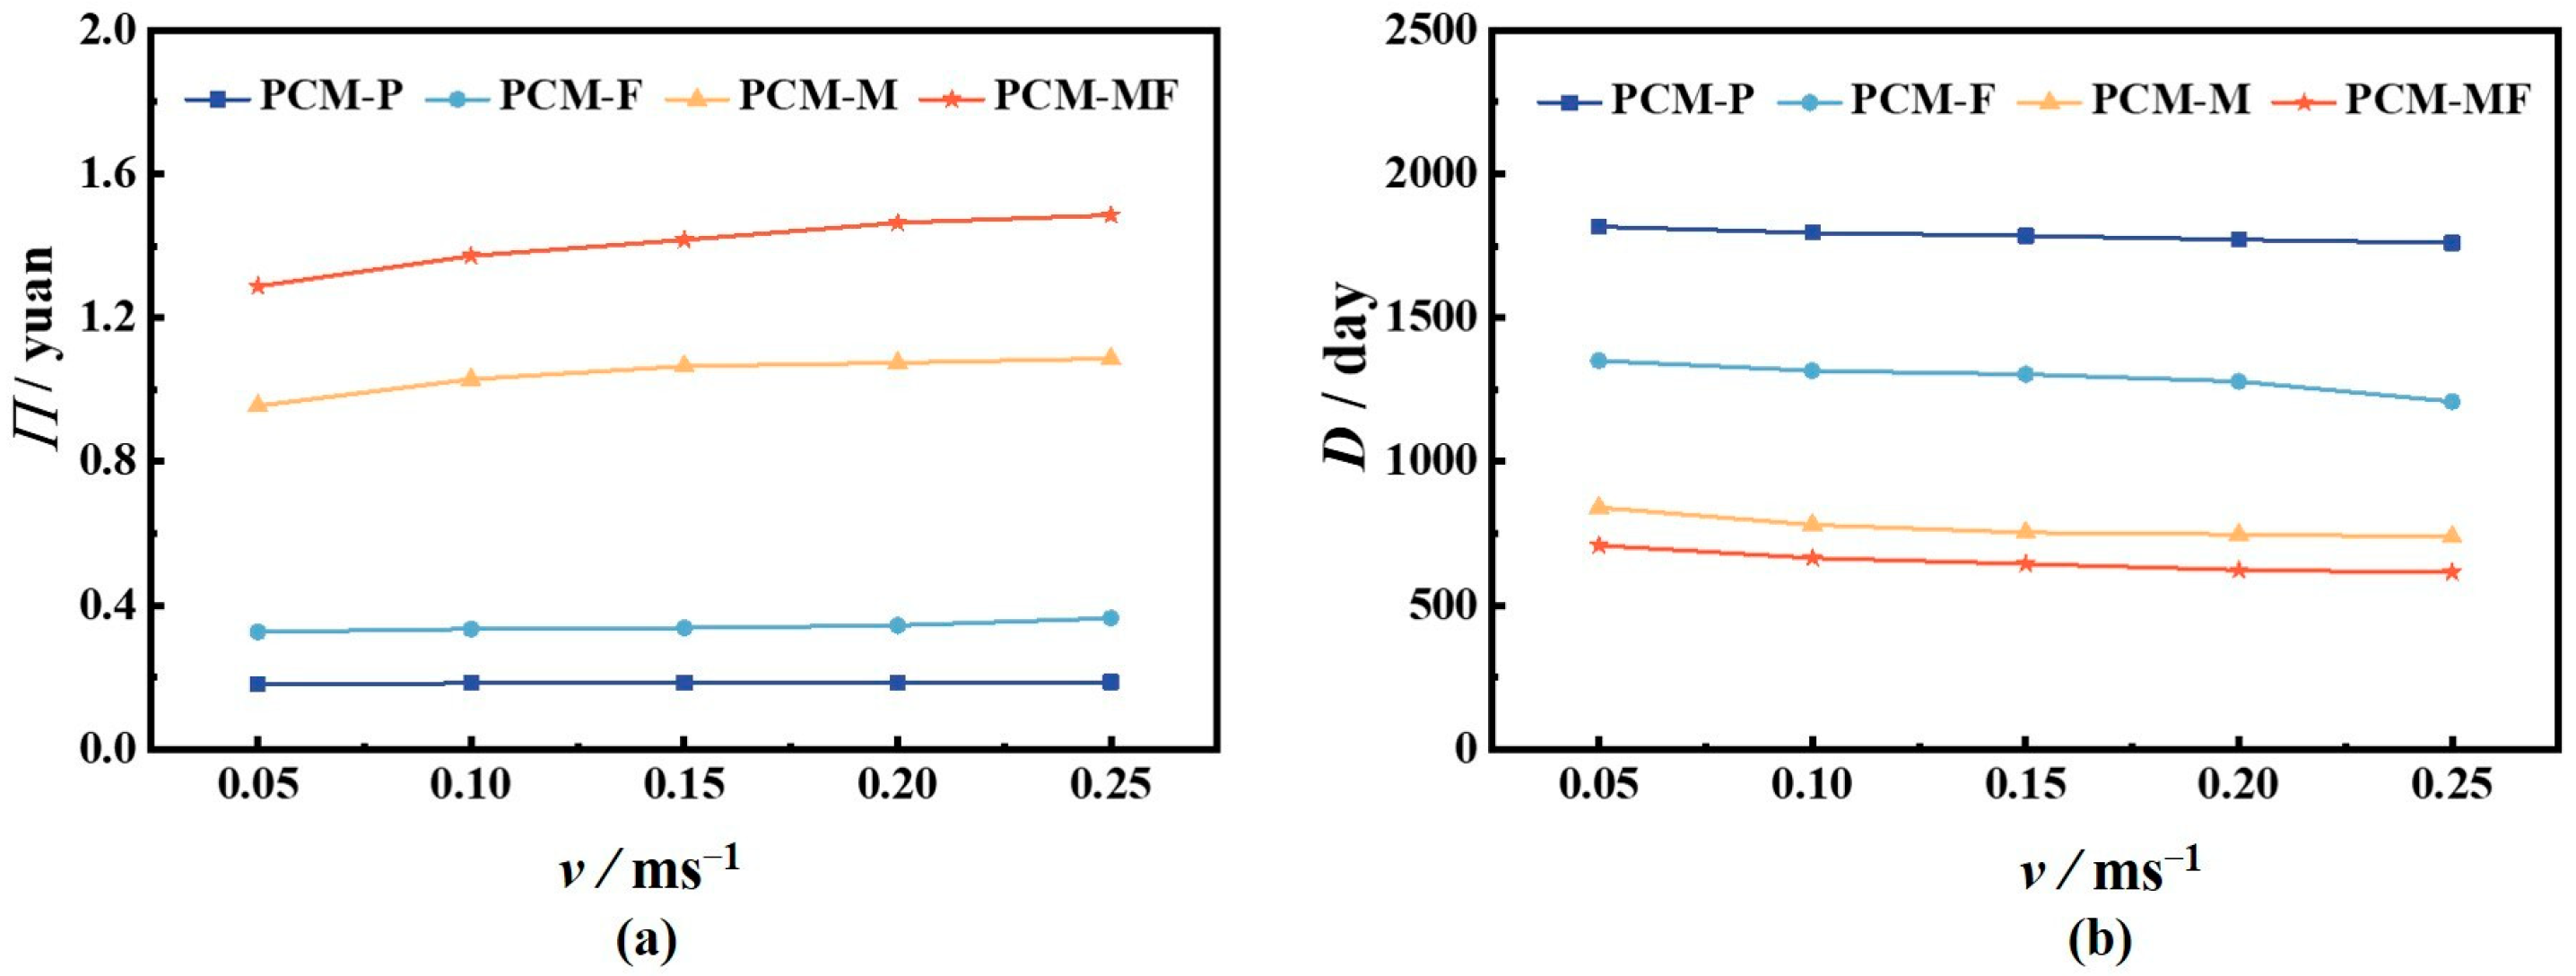
Figure 9a presents the daily returns of the four TES units under various flow velocity. It is evident that the flow velocity has a crucial influence on the return of the metallic foam and metallic foam-finned tubes, with daily returns increasing significantly with flow rate. However, the effect on the smooth tube and finned tube is not as pronounced. For a flow rate of 0.05 m/s, the daily returns for the smooth tube, finned tube, metallic foam tube, and metallic foam-finned tube are 0.18 yuan, 0.33 yuan, 0.96 yuan, and 1.29 yuan, respectively. Increasing the flow velocity to 0.25 m/s results in daily returns of 0.19 yuan, 0.36 yuan, 1.09 yuan, and 1.49 yuan, respectively. These results indicate that increasing the flow rate enhances the daily returns of the four structures by 3.18%, 11.71%, 13.77%, and 15.34%, respectively.
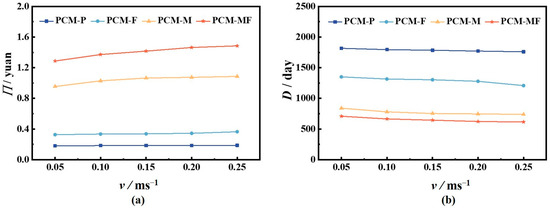
Figure 9.
Payback period and daily returns of four structures at various flow rates: (a) Daily income and (b) Payback period.
Regarding the payback period, Figure 9b quantitatively presents the results for the four structures at different flow rates. The findings demonstrate that as the flow rate increases, the investment payback period is shortened, particularly for the metallic foam-finned and metallic foam tubes. At a flow rate of 0.05 m/s, the payback periods for the smooth, finned, metallic foam, and metallic foam-finned tubes are 1816 days, 1350 days, 840 days, and 709 days, respectively. Increasing the flow rate to 0.25 m/s reduces the payback periods for the four structures by 3.08%, 10.48%, 12.1%, and 13.3%, respectively. In practical projects, the investment payback period is a crucial consideration, as it relates to fund recovery. A shorter payback time is more favorable for project applications. These results unequivocally demonstrate that compared to the other three structures, the PCM-MF composite structure exhibits excellent economic applicability for solar TES systems. If the metallic foam-finned tube composite structure is widely applied in heat storage projects, greater economic benefits are expected.
4.3. Case Study
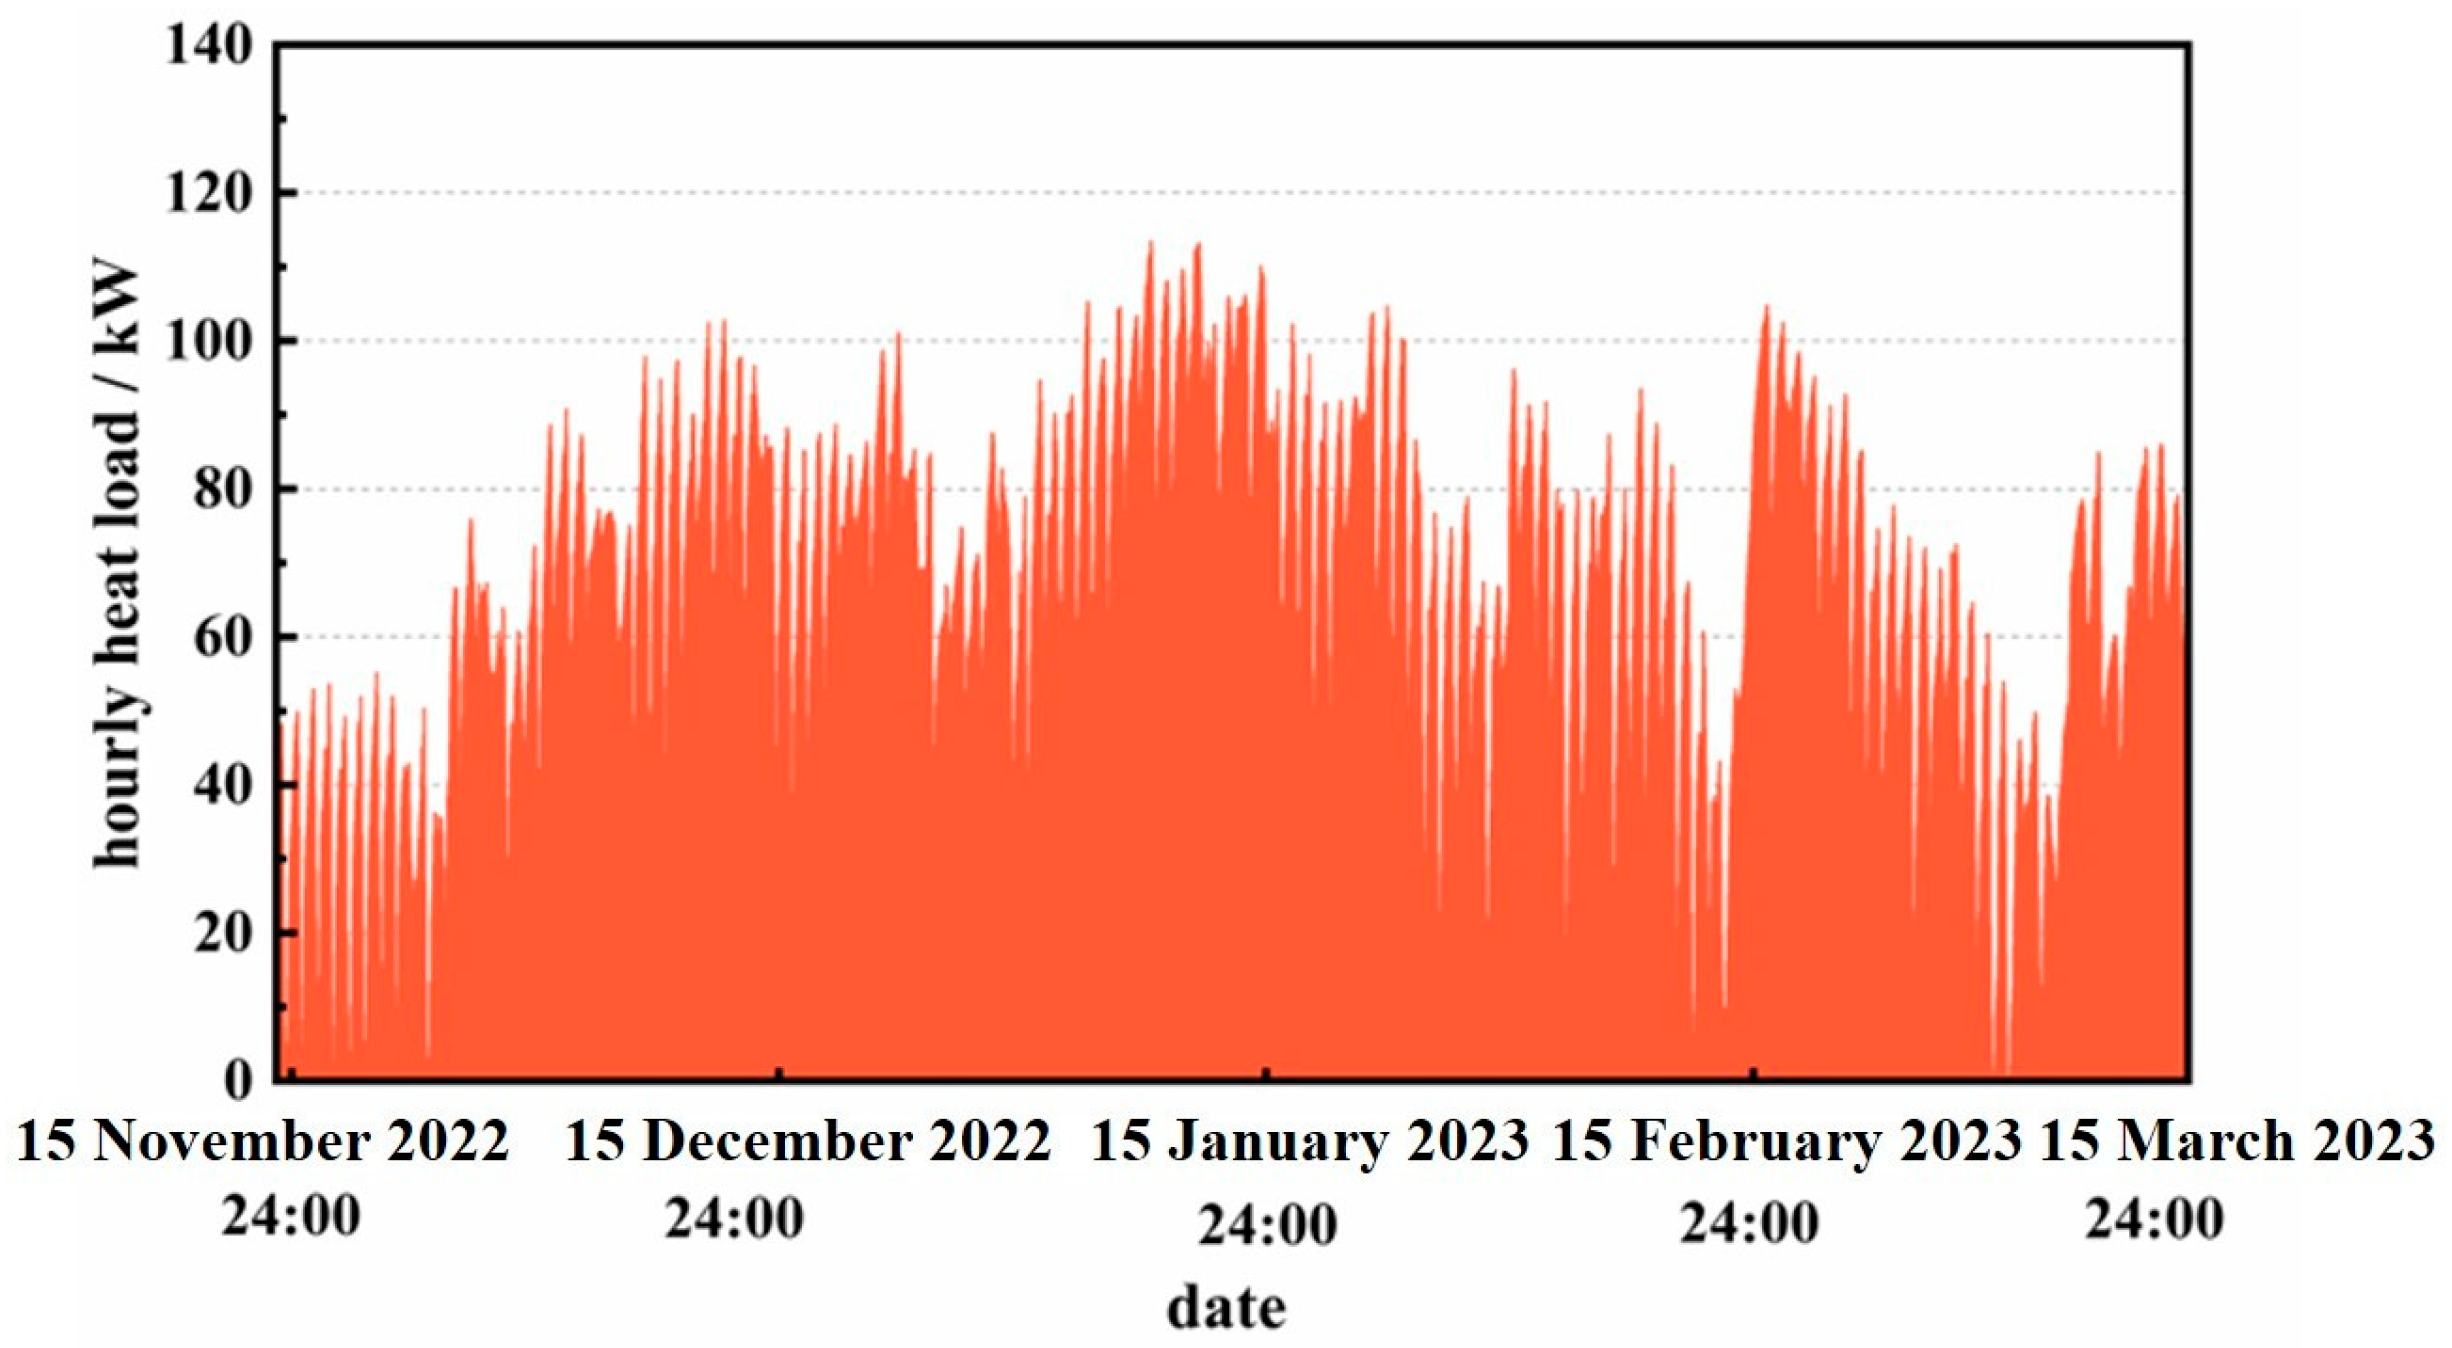
Figure 10 illustrates the simulation results of the residential hourly heat load. Due to the building’s thermal inertia, the heat load typically peaks in the morning (7:00–10:00). Throughout the 2022–2023 heating period, the maximum heat load recorded at 8 a.m. on 17 January was 96.9 kW. By considering the residential building’s heating range, the heating load index is simulated to be 38.1 W/m2. On 21 January, the maximal residential heat consumption reached 774.51 kWh. These simulation results serve as the foundation for designing the solar system.
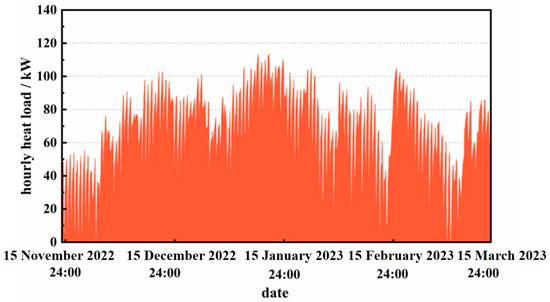
Figure 10.
Hourly heat load.
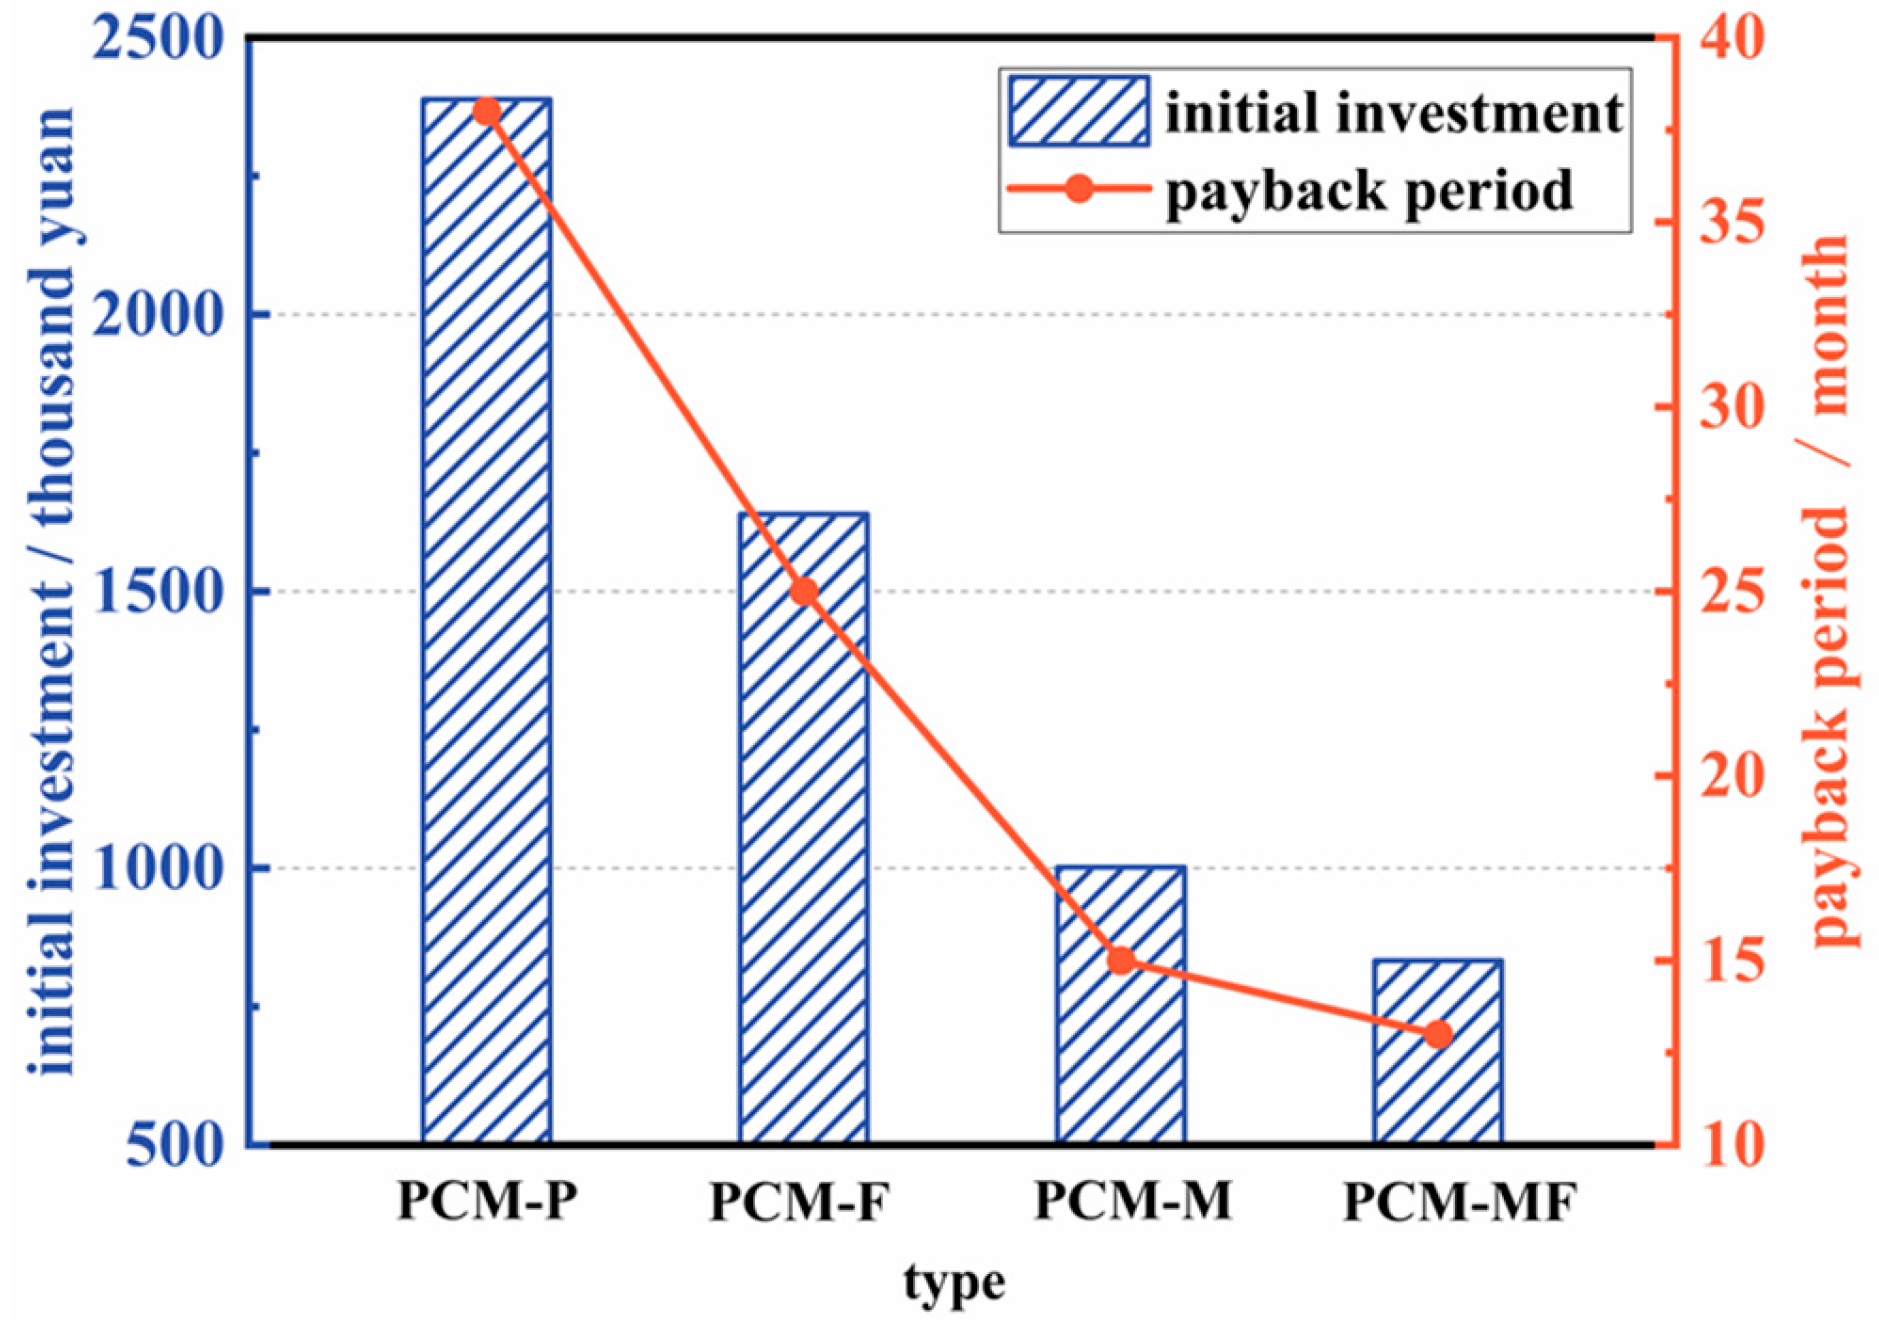
To meet the design heat load, 7237 sets of PCM-P, 3727 sets of PCM-F, 1248 sets of PCM-M, and 914 sets of PCM-MF devices are required when the HTF flow rate is set to 0.25 m/s. At this flow rate, the initial investments for these four groups of devices are 2388.2 thousand yuan, 1639.6 thousand yuan, 1001.8 thousand yuan, and 899.4 thousand yuan, respectively, as shown in Figure 11. Furthermore, according to the Xi’an central heating charging standard, the factory price of central heating for residential users is 5.3 yuan/m2 per month. Taking into account that the heating period lasts 121 days, or approximately 4 months, the annual heating cost for the residential building amounts to around 66.1 thousand yuan. By performing equivalent calculations, the payback periods for PCM-P, PCM-F, PCM-M, and PCM-MF are determined to be 38 months, 25 months, 15 months, and 13 months, respectively. In other words, compared to PCM-P, the payback periods for the other structures are reduced by 31.5%, 58.2%, and 65.4%.
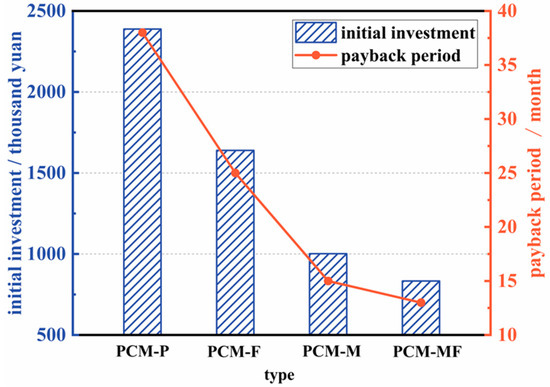
Figure 11.
Economic parameters of the residential building.
In conclusion, the metallic foam-finned composite tube demonstrates significant economic benefits in engineering applications. For heating the same building project, the metallic foam-finned structure not only requires a low initial investment and occupies minimal space but also boasts a short investment payback period, allowing for cost recovery in a brief period. Moreover, the utilization of the solar phase-change TES heating system can contribute to a reduction of 9100 t in carbon dioxide emissions from the building during the heating season. This achievement is of significant consequence in achieving energy savings and emission reduction goals. Under such favorable conditions, we can maximize economic benefits and mitigate energy waste.
5. Discussion
This paper investigates the melting characteristics and economic parameters of smooth, finned, metallic foam, and metal foam-finned tubes at various flow rates. Combined with practical cases, the economic conditions for selecting thermal storage unit engineering are analyzed, leading to the following findings.
- (1)
- The results reveal that the charging–discharging efficiency of smooth tube TES units is inefficient and does not meet the requirements for engineering applications. However, the introduction of fins, metallic foam, and the metallic foam-finned composite structure effectively enhances heat transfer efficiency. Among them, the metallic foam-finned composite structure achieves the minimum complete melting time of 5800 s, which is 88.3% less compared with the smooth tube. Furthermore, raising the flow rate improves the heat storage effect, with the complete melting time of the four structures decreased by 3.5%, 11.2%, 14.4%, and 15.5%, respectively.
- (2)
- As the flow rate increases from 0.05 m/s to 0.25 m/s, the daily returns of smooth tubes, finned tubes, metallic foam tubes, and metallic foam-finned tubes are enhanced by 3.18%, 11.71%, 13.77%, and 15.34%, respectively. Similarly, the payback period for metallic foam tubes and metallic foam-fin tubes is shortened by 3.08%, 10.48%, 12.1%, and 13.3%, respectively. These findings demonstrate the economic applicability of the metallic foam-finned tube for solar thermal storage systems. Widespread application of the new metallic foam-finned tube composite structure in heat storage is expected to yield even greater economic benefits.
- (3)
- Additionally, the metallic foam-finned tube demonstrates significant economic benefits in practical engineering applications. For residential building heating projects, the metallic foam-finned tube not only requires a low initial investment and occupies a small space, but also has a short payback period of just 13 months. Moreover, the system reduces carbon emissions from the building by approximately 9100 t throughout the heating season. It serves as an effective approach to realize energy-conservation and emission reductions in the building sector.
Author Contributions
Conceptualization, X.Y.; Methodology, X.G., Z.L., J.Y. and B.S.; Software, Z.L., J.Y. and J.G.; Validation, J.Y.; Formal analysis, X.G. and J.G.; Resources, X.Y.; Writing—original draft, X.G.; Writing—review & editing, X.Y. and B.S.; Visualization, X.G. and Z.L.; Supervision, X.Y. and B.S. All authors have read and agreed to the published version of the manuscript.
Funding
This work was supported by the Key Scientific and Technological Innovation Team of Shaanxi Province (2023-CX-TD-29), Key Science and technology project of Xi’an (2021JH-QCY1-0052) and Key research and development project of Shaanxi Province (2022QCY-LL-25).
Data Availability Statement
Not applicable.
Conflicts of Interest
The authors declare no conflict of interest.
Nomenclature
| Symbols | |
| Am | Liquid fraction term |
| CE | Inertial coefficient (m−1) |
| D | Thickness of the ligaments (mm) |
| cd | Drag coefficient |
| cp,f | Specific heat of PCM (J·kg−1·K−1) |
| cp,s | Specific heat of metal foam (J·kg−1·K−1) |
| df | Fiber diameter (m) |
| dp | Pore diameter (m) |
| fm | Melting fraction |
| g | Gravitational acceleration (m·s−2) |
| G | Shape function for metallic ligaments |
| H | Height (m) |
| h | Thickness (m) |
| hsf | Heat transfer coefficient between internal ligament of metal foam and paraffin (W·m−1·K−1) |
| K | Permeability (m−2) |
| L | Latent heat of fusion of PCM (kJ·kg−1) |
| Pr | Prandtl number |
| R | Radius of the heat storage tube (m) |
| Re | Reynolds number |
| t | Time (s) |
| T | Temperature (K) |
| Tm1 | Melting temperature of PCM liquid point (°C) |
| Tm2 | Melting temperature of PCM solid point (°C) |
| Velocity vector (m·s−1) | |
| Greek symbols | |
| α | Filling ratio of metal foam |
| αsf | Specific area (m−2) |
| γ | Thermal expansion coefficient (K−1) |
| ε | Porosity |
| δ | Numerical constant, 10−4 |
| λe | Effective thermal conductivity (W·m−1·K−1) |
| λfe | Thermal conductivity of paraffin (W·m−1·K−1) |
| λlig | Thermal conductivity of metal framework (W·m−1·K−1) |
| λse | Effective thermal conductivity of metal foam (W·m−1·K−1) |
| μ | Dynamic viscosity of paraffin (kg·m−1·s−1) |
| ρl | Density of paraffin (kg·m−3) |
| ρs | Density of metal foam(kg·m−3) |
| σ | Liquid fraction liquid in the metal foam |
| ψ | Paste zone coefficient, take 108 |
| χ | Flow tortuosity |
| ω | Pore density |
| Subscript | |
| f | PCM in fluid phase |
| fe | Paraffin |
| m | Melting |
| s | PCM in solid phase |
| se | Metal foam |
References
- Hou, Z.; Luo, J.; Xie, Y.; Wu, L.; Huang, L.; Xiong, Y. Carbon Circular Utilization and Partially Geological Sequestration: Potentialities, Challenges, and Trends. Energies 2023, 16, 324. [Google Scholar] [CrossRef]
- Xie, Y.; Qi, J.; Zhang, R.; Jiao, X.; Shirkey, G.; Ren, S. Toward a Carbon-Neutral State: A Carbon–Energy–Water Nexus Perspective of China’s Coal Power Industry. Energies 2022, 15, 4466. [Google Scholar] [CrossRef]
- Wei, X.T.; Qiu, R.; Liang, Y.T.; Liao, Q.; Klemes, J.J.; Xue, J.J.; Zhang, H. Roadmap to carbon emissions neutral industrial parks: Energy, economic and environmental analysis. Energy 2022, 238, 121732. [Google Scholar] [CrossRef]
- Yu, X.; Chen, H.B.; Wang, B.; Wang, R.; Shan, Y.L. Driving forces of CO2 emissions and mitigation strategies of China’s National low carbon pilot industrial parks. Appl. Energy 2018, 212, 1553–1562. [Google Scholar] [CrossRef]
- Bouyer, J.; Inard, C.; Musy, M. Microclimatic coupling as a solution to improve building energy simulation in an urban context. Energy Build. 2011, 43, 1549–1559. [Google Scholar] [CrossRef]
- Cai, Y.Y.; Newth, D.; Finnigan, J.; Gunasekera, D. A hybrid energy-economy model for global integrated assessment of climate change, carbon mitigation and energy transformation. Appl. Energy 2015, 148, 381–395. [Google Scholar] [CrossRef]
- Huebner, G.M.; Hamilton, I.; Chalabi, Z.; Shipworth, D.; Oreszczyn, T. Explaining domestic energy consumption—The comparative contribution of building factors, socio-demographics, behaviours and attitudes. Appl. Energy 2015, 159, 589–600. [Google Scholar] [CrossRef]
- Brzezińska, D.; Brzezińska, M. Performance-Based Solutions of Thermal and Smoke Control Ventilation in Industrial Power Plant Buildings. Energies 2023, 15, 7396. [Google Scholar] [CrossRef]
- Huang, L.; Hou, Z.; Fang, Y.; Liu, J.; Shi, T. Evolution of CCUS Technologies Using LDA Topic Model and Derwent Patent Data. Energies 2023, 16, 2556. [Google Scholar] [CrossRef]
- Khadka, S.; Rijal, H.B.; Amano, K.; Saito, T.; Imagawa, H.; Uno, T.; Genjo, K.; Takata, H.; Tsuzuki, K.; Nakaya, T.; et al. Study on Winter Comfort Temperature in Mixed Mode and HVAC Office Buildings in Japan. Energies 2022, 15, 7331. [Google Scholar] [CrossRef]
- Pitchaimuthu, S.; Sridharan, K.; Nagarajan, S.; Ananthraj, S.; Robertson, P.; Kuehnel, M.F.; Irabien, A.; Maroto-Valer, M. Solar Hydrogen Fuel Generation from Wastewater—Beyond Photoelectrochemical Water Splitting: A Perspective. Energies 2022, 15, 7399. [Google Scholar] [CrossRef]
- Estami, M.; Bahrami, M.A. Sensible and latent thermal energy storage with constructal fins. Int. J. Hydrog. Energy 2017, 42, 17681–17691. [Google Scholar]
- Kasper, L.; Pernsteiner, D.; Koller, M.; Schirrer, A.; Jakubek, S.; Hofmann, R. Numerical studies on the influence of natural convection under inclination on optimal aluminium proportions and fin spacings in a rectangular aluminium finned latent-heat thermal energy storage. Appl. Therm. Eng. 2021, 190, 116448. [Google Scholar] [CrossRef]
- Gasia, J.; Maldonado, J.M.; Galati, F.; De Simone, M.; Cabeza, L.F. Experimental evaluation of the use of fins and metal wool as heat transfer enhancement techniques in a latent heat thermal energy storage system. Energy Convers. Manag. 2019, 184, 530–538. [Google Scholar] [CrossRef]
- Khan, L.A.; Khan, M.M. Role of orientation of fins in performance enhancement of a latent thermal energy storage unit. Appl. Therm. Eng. 2020, 175, 115408. [Google Scholar] [CrossRef]
- Li, W.; Wang, M.; Meng, F.; Zhang, Y.; Zhang, B. A Review on the Effects of Pretreatment and Process Parameters on Properties of Pellets. Energies 2022, 15, 7303. [Google Scholar] [CrossRef]
- Cheng, F.; Xu, Y.; Zhang, J.; Wang, L.; Zhang, H.; Wan, Q.; Xu, S.; Li, W.; Wang, L.; Huang, Z. A novel flexible carbon fiber with carbon nanotubes growing in-situ via chemical vapor deposition to impregnate paraffin for thermal energy application. J. Energy Storage 2023, 68, 107718. [Google Scholar] [CrossRef]
- Faraj, K.; Khaled, M.; Faraj, J.; Hachem, F.; Chahine, K.; Castelain, C. Energetic and economic analyses of integrating enhanced macro-encapsulated PCM’s with active underfloor hydronic heating system. Energy Rep. 2022, 8, 848–862. [Google Scholar] [CrossRef]
- Larwa, B.; Cesari, S.; Bottarelli, M. Study on thermal performance of a PCM enhanced hydronic radiant floor heating system. Energy 2021, 225, 120245. [Google Scholar] [CrossRef]
- Mekrisuh, K.U.; Giri, S.; Udayraj Singh, D.; Rakshit, D. Optimal design of the phase change material based thermal energy storage systems: Efficacy of fins and/or nanoparticles for performance enhancement. J. Energy Storage 2021, 33, 102126. [Google Scholar] [CrossRef]
- Mohamed, F.; Eames, P.C. Thermal performance evaluation of a latent heat thermal energy storage unit with an embedded multi-tube finned copper heat exchanger. Exp. Heat Transf. 2023, 36, 143–162. [Google Scholar]
- Mozafari, M.; Hooman, K.; Lee, A.; Cheng, S. Numerical study of a dual-PCM thermal energy storage unit with an optimized low-volume fin structure. Appl. Therm. Eng. 2022, 215, 119026. [Google Scholar] [CrossRef]
- Gao, X.; Wei, P.; Yu, J.; Huang, X.; Yang, X.; Sundén, B. Design and assessments on graded metal foam in heat storage tank: An experimental and numerical study. Int. Commun. Heat Mass Transf. 2023, 146, 106902. [Google Scholar] [CrossRef]
- Li, Y.; Huang, X.; Huang, X.; Gao, X.; Hu, R.; Yang, X.; Sunden, B. Machine learning and multilayer perceptron enhanced CFD approach for improving design on latent heat storage tank. Appl. Energy 2023, 347, 121458. [Google Scholar] [CrossRef]
- El Idi, M.M.; Karkri, M. Heating and cooling conditions effects on the kinetic of phase change of PCM embedded in metal foam. Case Stud. Therm. Eng. 2020, 21, 100716. [Google Scholar] [CrossRef]
- Behi, H.; Karimi, D.; Gandoman, F.H.; Akbarzadeh, M.; Khaleghi, S.; Kalogiannis, T.; Hosen, M.S.; Jaguemont, J.; Van Mierlo, J.; Berecibar, M. PCM assisted heat pipe cooling system for the thermal management of an LTO cell for high-current profiles. Case Stud. Therm. Eng. 2021, 25, 100920. [Google Scholar] [CrossRef]
- Diallo, T.M.O.; Yu, M.; Zhou, J.Z.; Zhao, X.D.; Shittu, S.; Li, G.Q.; Ji, J.; Hardy, D. Energy performance analysis of a novel solar PVT loop heat pipe employing a microchannel heat pipe evaporator and a PCM triple heat exchanger. Energy 2019, 167, 866–888. [Google Scholar] [CrossRef]
- Mathew, A.A.; Thangavel, V. A novel thermal storage integrated evacuated tube heat pipe solar air heater: Energy, exergy, economic and environmental impact analysis. Sol. Energy 2021, 220, 828–842. [Google Scholar] [CrossRef]
- Acharya, N. On the hydrothermal behavior and entropy analysis of buoyancy driven magnetohydrodynamic hybrid nanofluid flow within an octagonal enclosure fitted with fins: Application to thermal energy storage. J. Energy Storage 2022, 53, 105198. [Google Scholar] [CrossRef]
- Hosseinzadeh, K.; Mogharrebi, A.R.; Asadi, A.; Paikar, M.; Ganji, D.D. Effect of fin and hybrid nano-particles on solid process in hexagonal triplex Latent Heat Thermal Energy Storage System. J. Mol. Liq. 2020, 300, 112347. [Google Scholar] [CrossRef]
- Laouer, A.; Teggar, M.; Tuncbilek, E.; Hachani, L.; Arici, M.; Ismail, K.A.R. Melting of hybrid nano-enhanced phase change material in an inclined finned rectangular cavity for cold energy storage. J. Energy Storage 2022, 50, 104185. [Google Scholar] [CrossRef]
- Li, Y.; Niu, Z.; Gao, X.; Guo, J.; Yang, X.; He, Y.-L. Effect of filling height of metal foam on improving energy storage for a thermal storage tank. Appl. Therm. Eng. 2023, 229, 120584. [Google Scholar] [CrossRef]
- Bazri, S.; Badruddin, I.A.; Usmani, A.Y.; Anwar Khan, S.; Kamangar, S.; Naghavi, M.S.; Mallah, A.R.; Abdelrazek, A.H. Thermal hysteresis analysis of finned-heat-pipe-assisted latent heat thermal energy storage application for solar water heater system. Case Stud. Therm. Eng. 2022, 40, 102490. [Google Scholar] [CrossRef]
- Liu, Z.; Yan, X.; Liu, Z.; Xiao, T.; Huang, X.; Yang, X.; Sunden, B. Effect of phase change heat storage tank with gradient fin structure on solar energy storage: A numerical study. Int. J. Heat Mass Transf. 2023, 215, 124384. [Google Scholar] [CrossRef]
- Krane, P.; Ziviani, D.; Braun, J.E.; Jain, N.; Marconnet, A. Techno-economic analysis of metal-hydride energy storage to enable year-round load-shifting for residential heat pumps. Energy Build. 2022, 256, 111700. [Google Scholar] [CrossRef]
- Liu, G.; Li, Y.; Wei, P.; Xiao, T.; Meng, X.; Yang, X. Thermo-Economic Assessments on a Heat Storage Tank Filled with Graded Metal Foam. Energies 2022, 15, 7213. [Google Scholar] [CrossRef]
- Pelella, F.; Zsembinszki, G.; Viscito, L.; William Mauro, A.; Cabeza, L.F. Thermo-economic optimization of a multi-source (air/sun/ground) residential heat pump with a water/PCM thermal storage. Appl. Energy 2023, 331, 120398. [Google Scholar] [CrossRef]
- Saravanan, M.; Arul Selvan, S.; Radhakrishnan, N.; Srinivasa Rao, S.; Sharma, V.; Madhavarao, S.; Chandran, S.S. Improving the thermal efficiency of a solar water heater by using PCM. Mater. Today Proc. 2023, 7, 233. [Google Scholar] [CrossRef]
- Gao, X.; Niu, Z.; Huang, X.; Yang, X.; Yan, J. Thermo-economic assessments on building heating by a thermal energy storage system with metal foam. Case Stud. Therm. Eng. 2023, 49, 103307. [Google Scholar] [CrossRef]
- Zukauskas, A. Some aspects of heat transfer from tubes in crossflow. Heat Transf. Sci. Technol. 1996, 1996, 82–93. [Google Scholar]
- Yang, X.H.; Bai, J.X.; Yan, H.B.; Kuang, J.J.; Lu, T.J.; Kim, T. An Analytical Unit Cell Model for the Effective Thermal Conductivity of High Porosity Open-Cell Metal Foams. Transp. Porous Media 2014, 102, 403–426. [Google Scholar] [CrossRef]
- Georgiadis, J.G.; Catton, I. Dispersion in Cellular Thermal-Convection in Porous Layers. Int. J. Heat Mass Transf. 1988, 31, 1081–1091. [Google Scholar] [CrossRef]
- Bhattacharya, A.; Calmidi, V.V.; Mahajan, R.L. Thermophysical properties of high porosity metal foams. Int. J. Heat Mass Transf. 2002, 45, 1017–1031. [Google Scholar] [CrossRef]
- Fourie, J.G.; Du Plessis, J.P. Pressure drop modelling in cellular metallic foams. Chem. Eng. Sci. 2002, 57, 2781–2789. [Google Scholar] [CrossRef]
Disclaimer/Publisher’s Note: The statements, opinions and data contained in all publications are solely those of the individual author(s) and contributor(s) and not of MDPI and/or the editor(s). MDPI and/or the editor(s) disclaim responsibility for any injury to people or property resulting from any ideas, methods, instructions or products referred to in the content. |
© 2023 by the authors. Licensee MDPI, Basel, Switzerland. This article is an open access article distributed under the terms and conditions of the Creative Commons Attribution (CC BY) license (https://creativecommons.org/licenses/by/4.0/).

