Article

Optimizing the Layout of a Ground Source Heat Pump System with a Groundwater–Thermal Coupling Model

1
School of Water and Environment, Chang’an University, Xi’an 710054, China
2
Key Laboratory of Subsurface Hydrology and Ecological Effect in Arid Region of the Ministry of Education, Chang’an University, Xi’an 710054, China
*
Author to whom correspondence should be addressed.
Energies 2023, 16(19), 6895; https://doi.org/10.3390/en16196895
Submission received: 26 August 2023 / Revised: 23 September 2023 / Accepted: 27 September 2023 / Published: 29 September 2023
(This article belongs to the Section J: Thermal Management)

Abstract

:
The exploitation and utilization of shallow geothermal energy are of great significance to realizing China’s “double carbon” goal and promoting a green economy and social development. However, many projects using ground source heat pumps to exploit shallow geothermal energy have disrupted the thermal balance of the geothermal field due to insufficient preliminary research, affecting the sustainable utilization of shallow geothermal energy. Therefore, a 3D groundwater–thermal coupling model was established in this paper using the geotemperature data of a ground source heat pump system in Xi’an. This study investigated the response characteristics of the groundwater–thermal system to the ground source heat pump system using the numerical simulation method and discussed the optimal layout scheme of the system on this basis. After years of simulation, it was found that long-term operation of the ground source heat pump system under actual operation produces “cold accumulation”. In addition to artificial intervention of the groundwater flow field, the effects of the system operating parameters and layout settings are also investigated to alleviate this cold accumulation. The results show that changing the operating parameters so that the heat transfer is the same in winter and summer, cross-locating the cooling holes with the heating holes, and placing multiple pumping and recharge wells downstream can alleviate the cold accumulation in the heat exchange zone. The results of this numerical simulation study provide an important reference for solutions to mitigate the accumulation of ground cold and heat in developing shallow geothermal energy using borehole heat exchangers and to suppress the downstream geotemperature disturbance via the ground source heat pump system.

1. Introduction

Shallow geothermal energy, as a new low-carbon, clean natural energy source, is thermal energy stored in the rock-soil body, groundwater, and surface water at a specific depth range (<200 m) below the ground surface [1] that has value for exploitation. The temperature of this energy is usually below 25 °C [2], with abundant resources in China. According to 2015 survey data, the amount of shallow geothermal energy available in the surveyed area of 169,000 km2 is equivalent to 7 × 10¹² kg of standard coal [3], of which nearly 60% of the resources are distributed in central and eastern China [4]. To achieve the “double carbon goal” as soon as possible, China recently implemented a series of policy measures dedicated to energy restructuring and transformation, encouraging the development and utilization of geothermal resources [5,6]. As a key region in preventing and controlling air pollution in China, the Guanzhong region of Shaanxi Province is actively promoting the rational development and use of geothermal resources. This is of great significance for adjusting the energy structure and improving the quality of the ecological environment.
The rock-soil body was suggested as a heat source for heat pumps by Zoelly in 1912 [7]. Since then, research on ground source heat pump (GSHP) systems has increased, and the development and use of shallow geothermal energy have gradually emerged. Several factors influence the efficiency of GSHP systems, including engineering design, climatic conditions, and geological structure [8,9]. Studies have shown that the lithology, structure [10], and thermal parameters of the rock-soil body [11,12,13] are also important factors influencing the distribution of the shallow geotemperature field. In addition, groundwater hydrodynamic parameters such as the permeability coefficient, hydraulic gradient, and porosity [14,15,16] significantly impact the development of the thermal influence area of GSHP systems.
The actual operation of GSHP systems tends to disturb the thermal equilibrium of the rock-soil body due to inadequate research and design. Thus, there are issues with cold and heat accumulation [17,18]. A different heat exchange capacity in the heat storage–release cycle mode significantly affects the geotemperature equilibrium, while a reasonable intermittent operation mode can encourage the recovery of the geothermal field and improve the heat exchange performance [19,20]. The cold plume develops most when there is a heat imbalance in the borehole heat exchanger (BHE), but seasonal heat storage can diminish the effect [21,22]. Additionally, a groundwater flow field can somewhat increase the heat exchange efficiency and sustainability of BHEs [23,24,25]. Moreover, the recovery of the rock-soil body temperature is more favorable with a higher rate of groundwater percolation [26]. An artificial flow field can be imposed to effectively mitigate the cumulative thermal effects of BHEs and lessen the impact of temperature plumes [27]. Pumping wells acting downstream of the system can greatly improve the performance of BHEs [28]. The higher the pumping capacity of the well, the more significant the increase in the thermal conductivity of the BHEs and the better the heat exchange efficiency [29]. Different pumping and recharge well-group layout schemes also have a greater impact on heat exchange efficiency [30]. It has been discovered that the groundwater level has an overall decreasing trend with a longer extraction time, but the temperature remains largely unchanged [31]. Meanwhile, the recoverable reserves of geothermal resources are not directly related to the actual exploitation quantity but have a more direct relationship with the amount of recharge [32]. Therefore, consideration should be given to the sustainable use of shallow geothermal energy and minimizing the impact on the geothermal field when using and researching ground source heat pumps. However, there is currently little research on the influence of the geotemperature field and the cold and heat accumulation of the ground in the actual engineering of GSHP systems, which cannot provide theoretical support for said actual engineering.
In this study, complete heating and cooling operation monitoring data of a GSHP system were collected in the Xi’an region. A numerical groundwater–thermal coupling model was established based on hydrogeological conditions and stratigraphic thermal parameters. The impact of the operation of the GSHP project on the geothermal field around the site was simulated, and its layout was optimized. Scientific recommendations are then made for the construction of projects using GSHP systems.

2. Materials and Methods
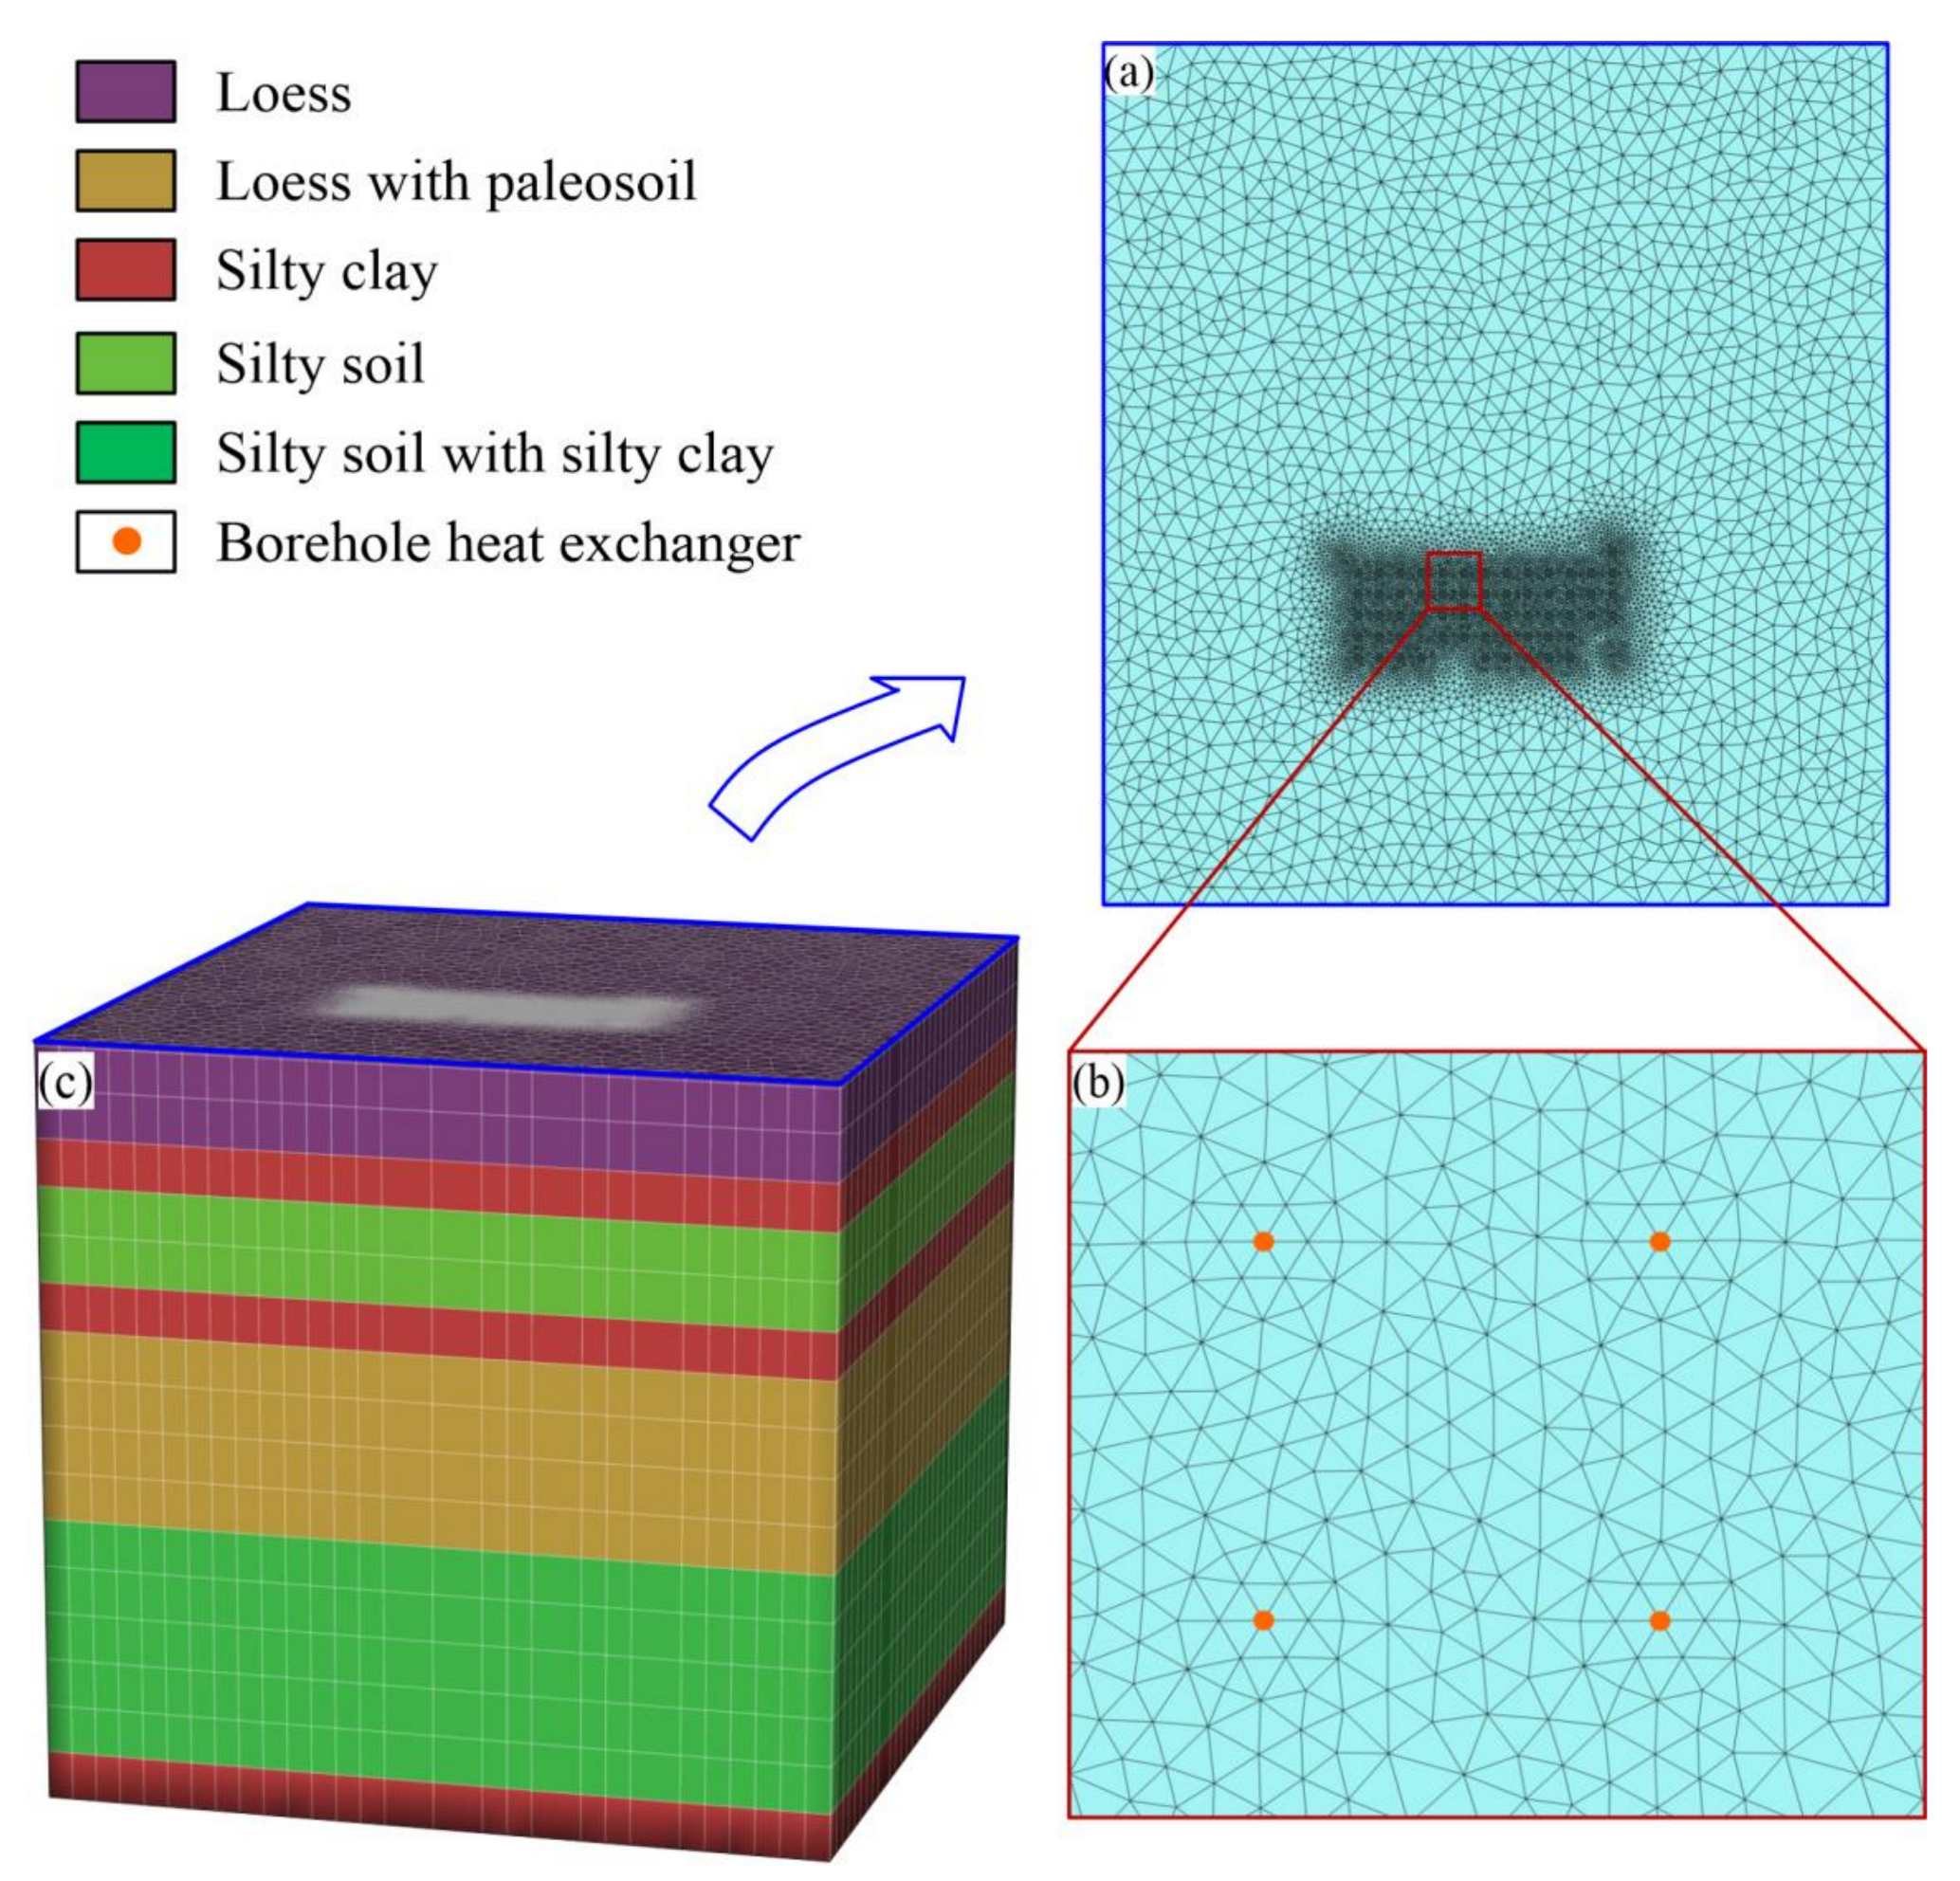
2.1. Study Area

The study area was located in the northeastern part of Yanta District, Xi’an City, Shaanxi Province, in the Guanzhong Basin between the Qinling Mountains and the Loess Plateau. The climate type is warm temperate continental monsoon type with an average annual temperature of 12.7 °C and an average annual rainfall of approximately 600 mm. The Guanzhong Basin is a Cenozoic subsidence basin through which the Wei River flows from west to east. The terrain on the north and south sides slopes toward the Wei River, in which the flood plains, loess plateaus, and alluvial plains are mainly distributed in stepped geomorphology. According to geological borehole data, the study area’s stratigraphy primarily comprises quaternary eolian and alluvial–proluvial strata.
A GSHP system was built in the study area, with 60 BHEs and 12 geotemperature monitoring holes. Figure 1a shows the layout of the holes. The monitoring hole for the background value of the geotemperature W1 was positioned in the lower-right corner of the heat exchange area, on the outskirts of the group of heat exchange holes, and upstream of the direction of the groundwater runoff, which was 9 m away from the outermost periphery of the hole group. Figure 1c shows that the BHE geotemperature monitoring holes were situated inside the heat exchange area. The monitoring hole for the geotemperature change in the hole during operation of the GSHP system was chosen as BHE W2. The thermally affected monitoring holes inside the heat exchange area, arranged around the W2 hole, were W3, W4, W5, and W8, while W6 and W7 were placed between W2 and W8 to strengthen the monitoring in the downstream direction of groundwater runoff. As shown in Figure 1b, in the upper-left corner of the heat exchange area, the four monitoring holes W9–W12 were arranged with equal spacing and were thermally affected monitoring holes outside the heat exchange area.

2.2. Sample Collection

The thermal properties of the rock-soil body are important factors influencing the development and utilization of shallow geothermal energy, especially for the heat exchange efficiency of BHEs in the GSHP system, which has a greater impact. A total of 33 groups of borehole samples were gathered in the study area, including 32 groups of soil samples and one group of sand samples. The thermal properties of the rock-soil body were measured, and the statistical findings are shown in Table 1.
In addition, according to the geotemperature profiles (Figure 2) of the monitoring hole W1 for the background value of the geotemperature, it can be seen that the geotemperature at a buried depth of 10 m was affected by the climate. There was a significant difference in the distribution of the temperature over time.
The least variation in temperature was observed at a depth of 15–30 m, with temperatures ranging from 17.2 to 17.6 °C. This is consistent with the overall depth and geotemperature of the thermostat layer in the Xi’an area. From 30 m downwards, the geotemperature gradually increased with depth, and the gradient of the geotemperature was approximately 2 °C /100 m. Thus, it was determined that the depth of the constant-temperature layer in the study area was from −15 m to −30 m, and the temperature was from 17.2 to 17.6 °C.

2.3. Method

The development and utilization of shallow geothermal energy through the GSHP systems inevitably perturb the groundwater–thermal system. This paper established a groundwater–thermal coupling model based on the existing information, calibrated and verified using geotemperature monitoring data.
The groundwater types in the heat exchange area are loose rock pore phreatic water and alluvial–proluvial pore-confined water. Groundwater flows from southeast to northwest. Taking the heat exchange area of the borehole as the center, a rectangular area with the boundary of the heat exchange area perpendicular to the groundwater flow extending 50 m to the east and west, 100 m to the downstream, and 50 m to the upstream along the direction of the groundwater flow was chosen as the simulation area. According to the actual boreholes, the groundwater infiltration medium in the area is mainly the eolian and pluvial deposits of the quaternary system. Therefore, the permeable medium in the model area was generalized as porous and non-homogeneous.
In this study, the numerical simulation was calculated for the simulation area using the finite element numerical simulation method. The simulation area was divided using the triangular sectioning method, and locally increased density sectioning was performed in the heat exchange area. The sectioning results are displayed in Figure 3a, showing that the final planar section was split into 7375 nodes and 14,629 cells. In the vertical direction, according to the actual stratigraphy of the simulation area, the model was divided into 17 layers, with a top surface elevation of 437 m, a bottom surface elevation of 277 m, and a total thickness of 160 m. To facilitate the setting of the boundary conditions in the surface layer according to the actual air temperature, the first layer was set as a thin layer of 1 m, the second layer as 9 m, and every 10 m from the third layer onward was dissected into one layer. The model had 132,750 nodes and 248,693 computational cells overall. The BHEs were modeled in the simulation software using a special one-dimensional finite element [33], while the rock-soil body was modeled in three dimensions. As shown in Figure 3b, the BHEs were regularly dissected around the nodes where they were located for the convenience of the calculations.
To represent the stratigraphic properties accurately, the numerical model’s boundary conditions were set according to the actual boundary, and the parameters of the different model layers were assigned according to the sampled data. The individual parameters in the model were adjusted to fit the measured geotemperature data better, and the final hydrogeological and thermal properties are depicted in Table 2. According to the observation data of W1, the phreatic depth of the simulation area was approximately 85 m. The groundwater flowed from southeast to northwest with a hydraulic gradient of approximately 1. In the southern and northern regions of the model, the constant head was set as 353 and 351 m, respectively. The heat exchange area had no hydraulic connection to the aquifer, so the thermal properties of the model (Figure 3c) were assigned values zonally based on the steady groundwater flow model. Additionally, based on measured data, the initial temperatures were set to increase from the surface to the depth. The top surface of the model was set as a temperature-known boundary based on multi-year average monthly temperatures. The bottom surface was set as the heat flux boundary, and the heat flux in the model was set to 3200 J/(m2·d), namely 0.037 W/m2. The BHEs in the model were set as the borehole heat exchanger boundary, which extended 150 m downward from the ground surface. The parameter settings of the BHEs are shown in Table 3.
This simulation was based on a 3D steady groundwater flow simulation for unsteady heat transport. Depending on the actual operation, the summer cooling period of the GSHP system was from 15 June 2018 to 15 September 2018, while the winter heating season ran from 15 November 2018 to 15 March 2019. A one-year cycle was simulated to establish the model validation, with the actual monitoring date of 23 March 2018 as the starting point. The error between the simulated and measured temperatures is approximately 0.5 °C after repeatedly adjusting the model parameters. The fitting results of the measured values and the simulated values of the four monitoring holes (W4, W5, W8, and W12) at the depths of 50 m and 100 m underground are depicted in Figure 4. The model is thought to meet the criteria for simulation and prediction for the study area because the validation is good.

3. Results and Discussion

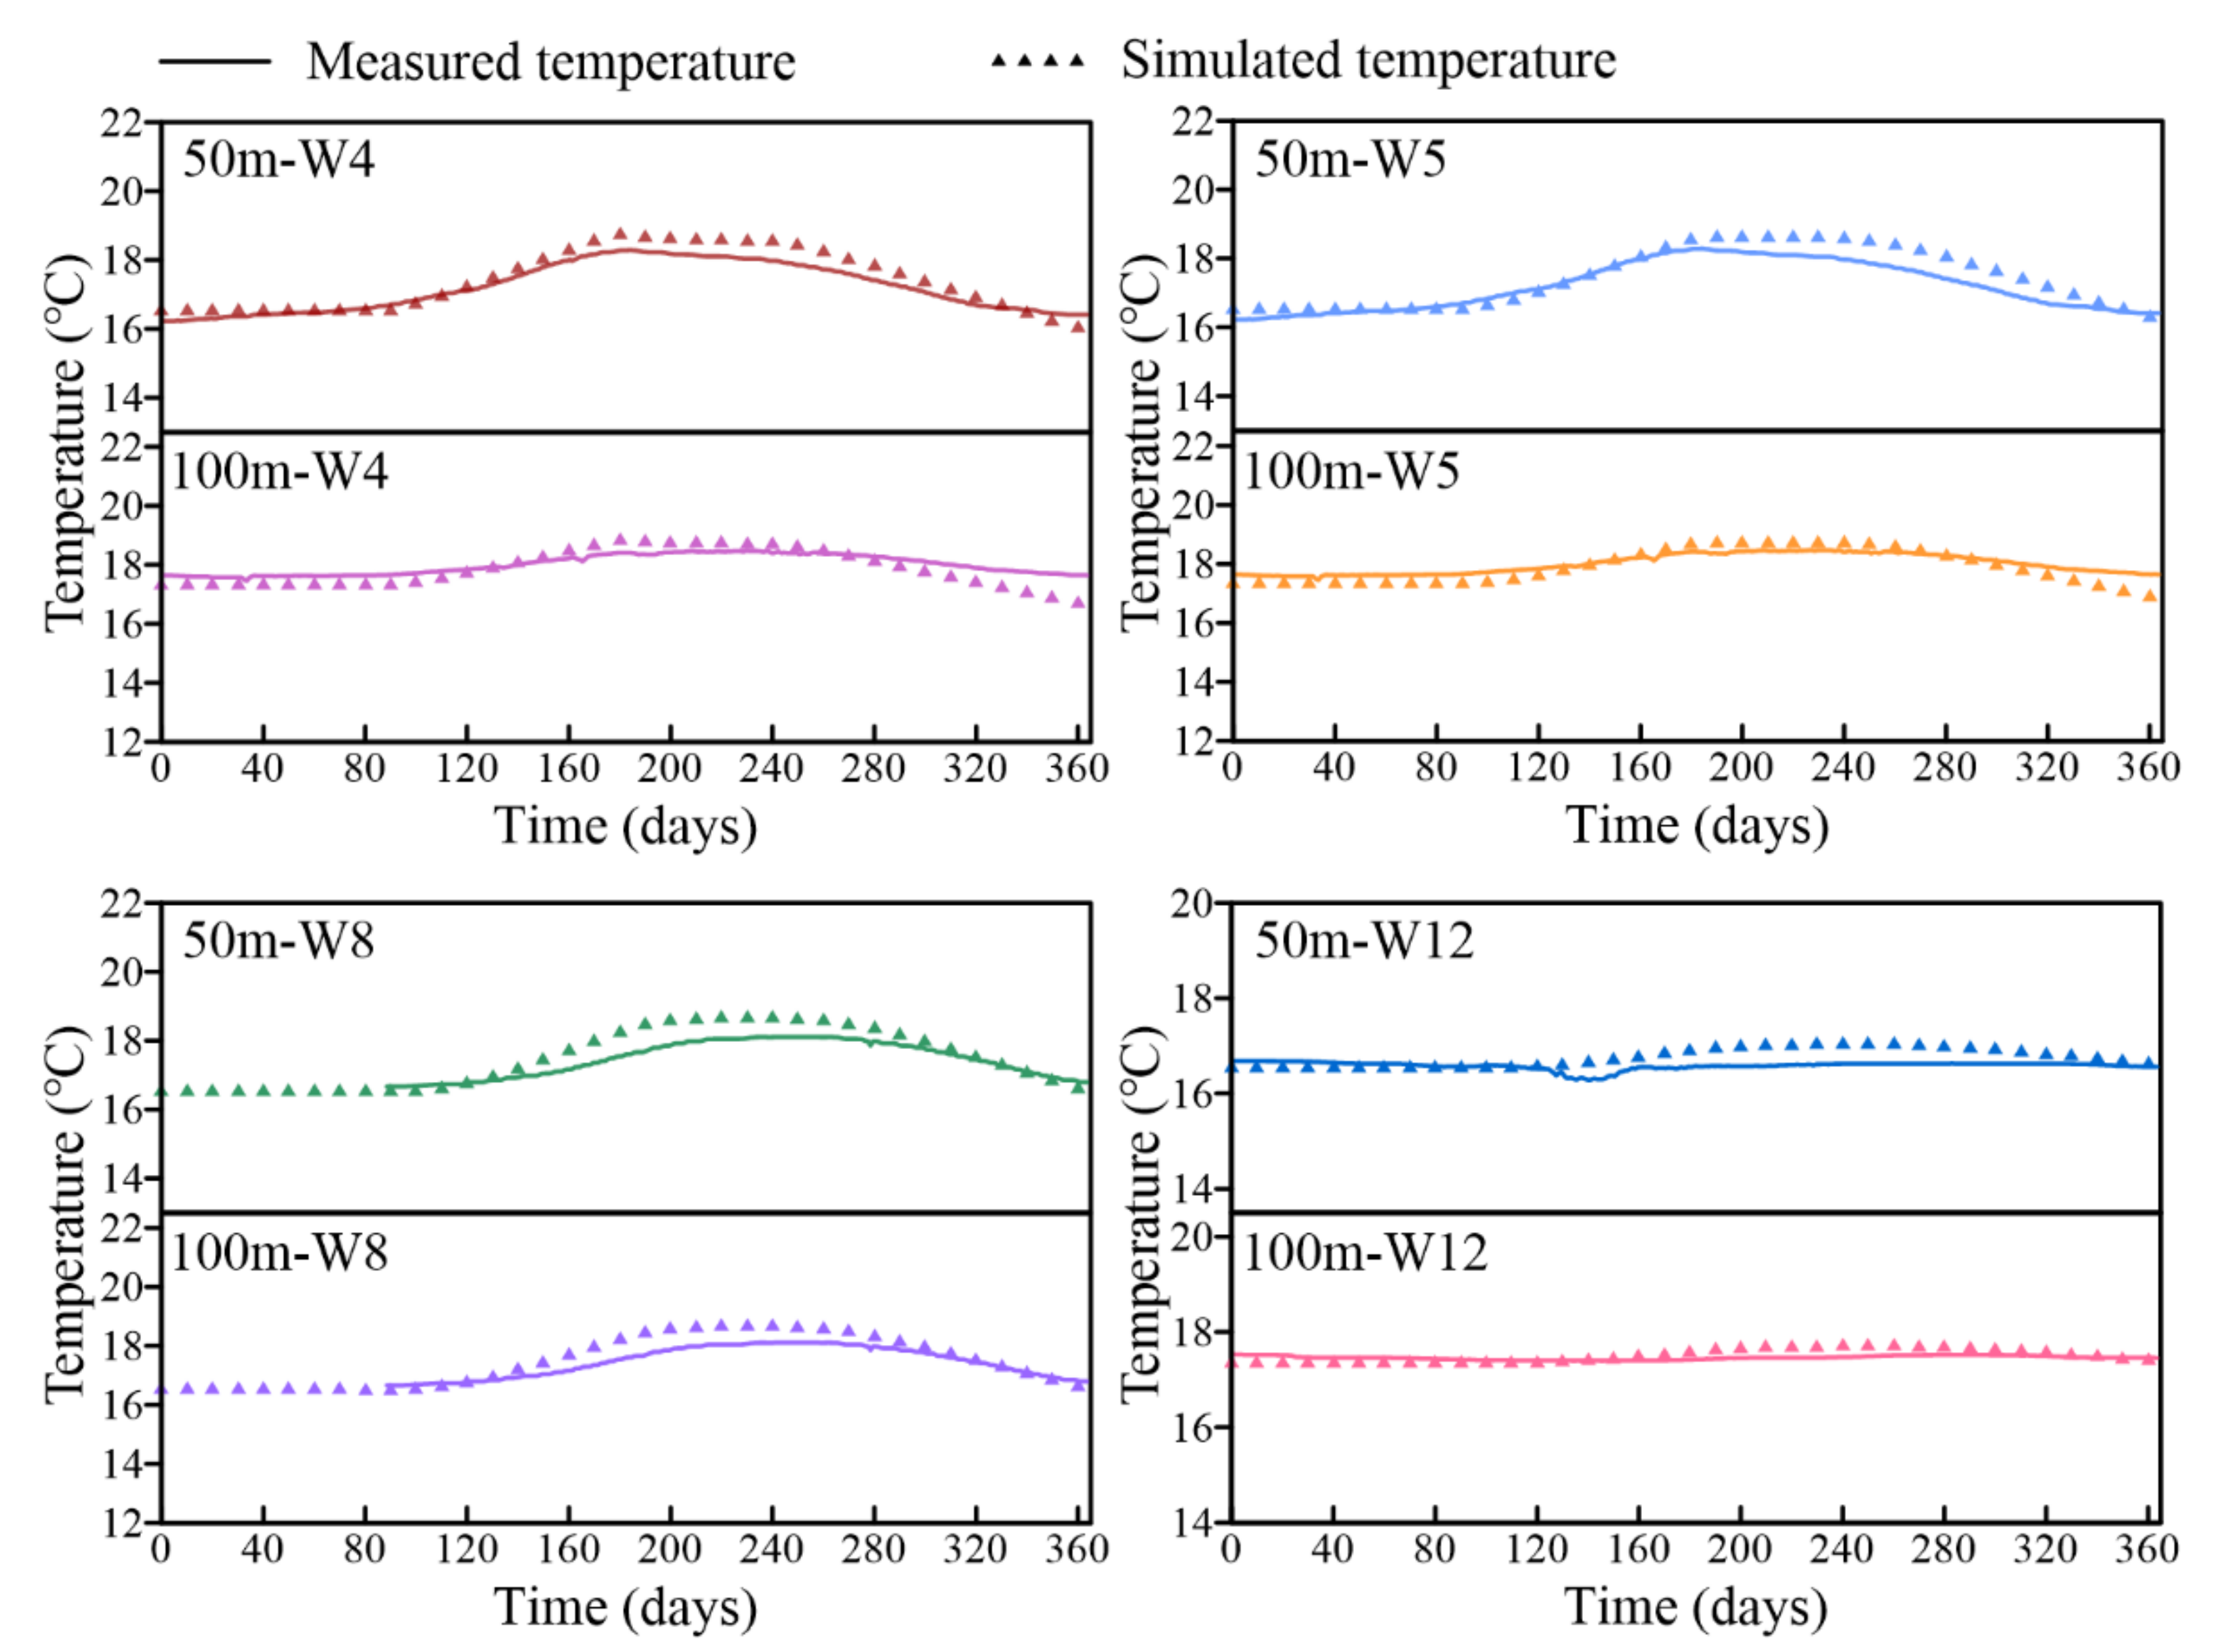
3.1. Response Characteristics of the Groundwater–Thermal System under Actual Operation

To investigate the reaction of the groundwater–thermal system to the GSHP system, a numerical model was calibrated to simulate a complete cooling, heating, and recovery period for the BHEs. This included examining the geotemperature in the study area, the “cold accumulation” after a period of operation, and the characteristics of the changes in geotemperature after many years.

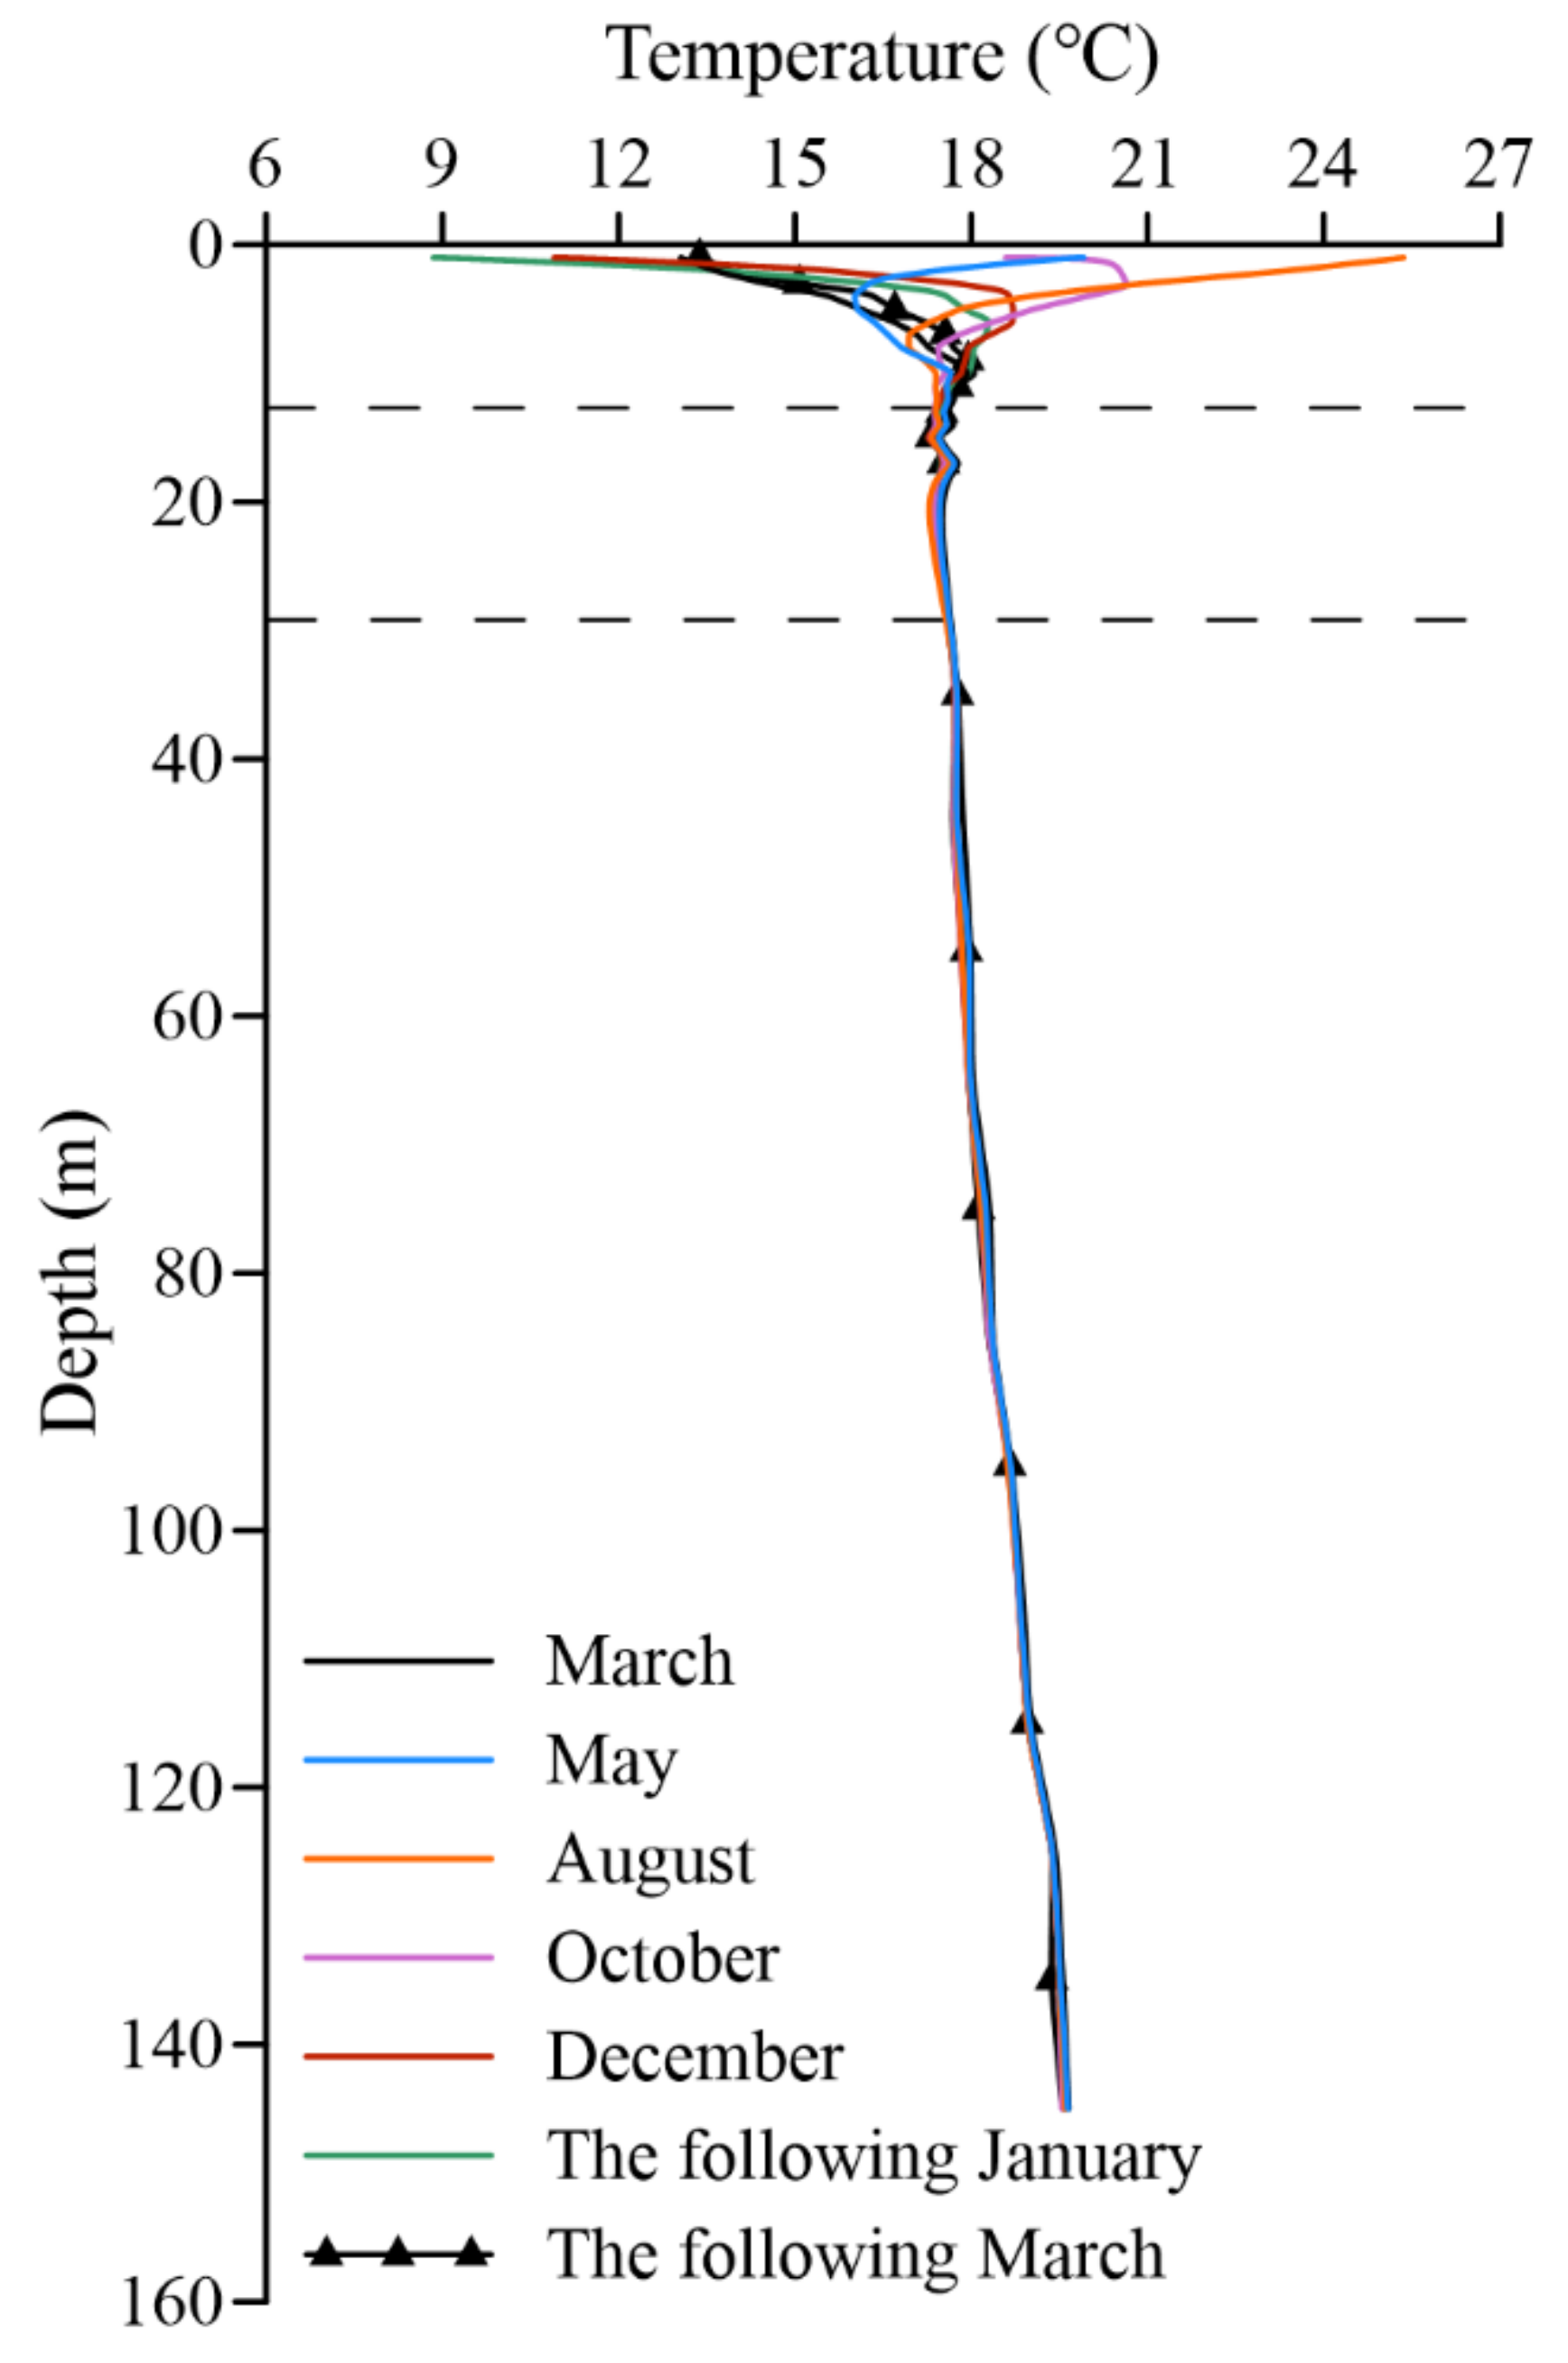
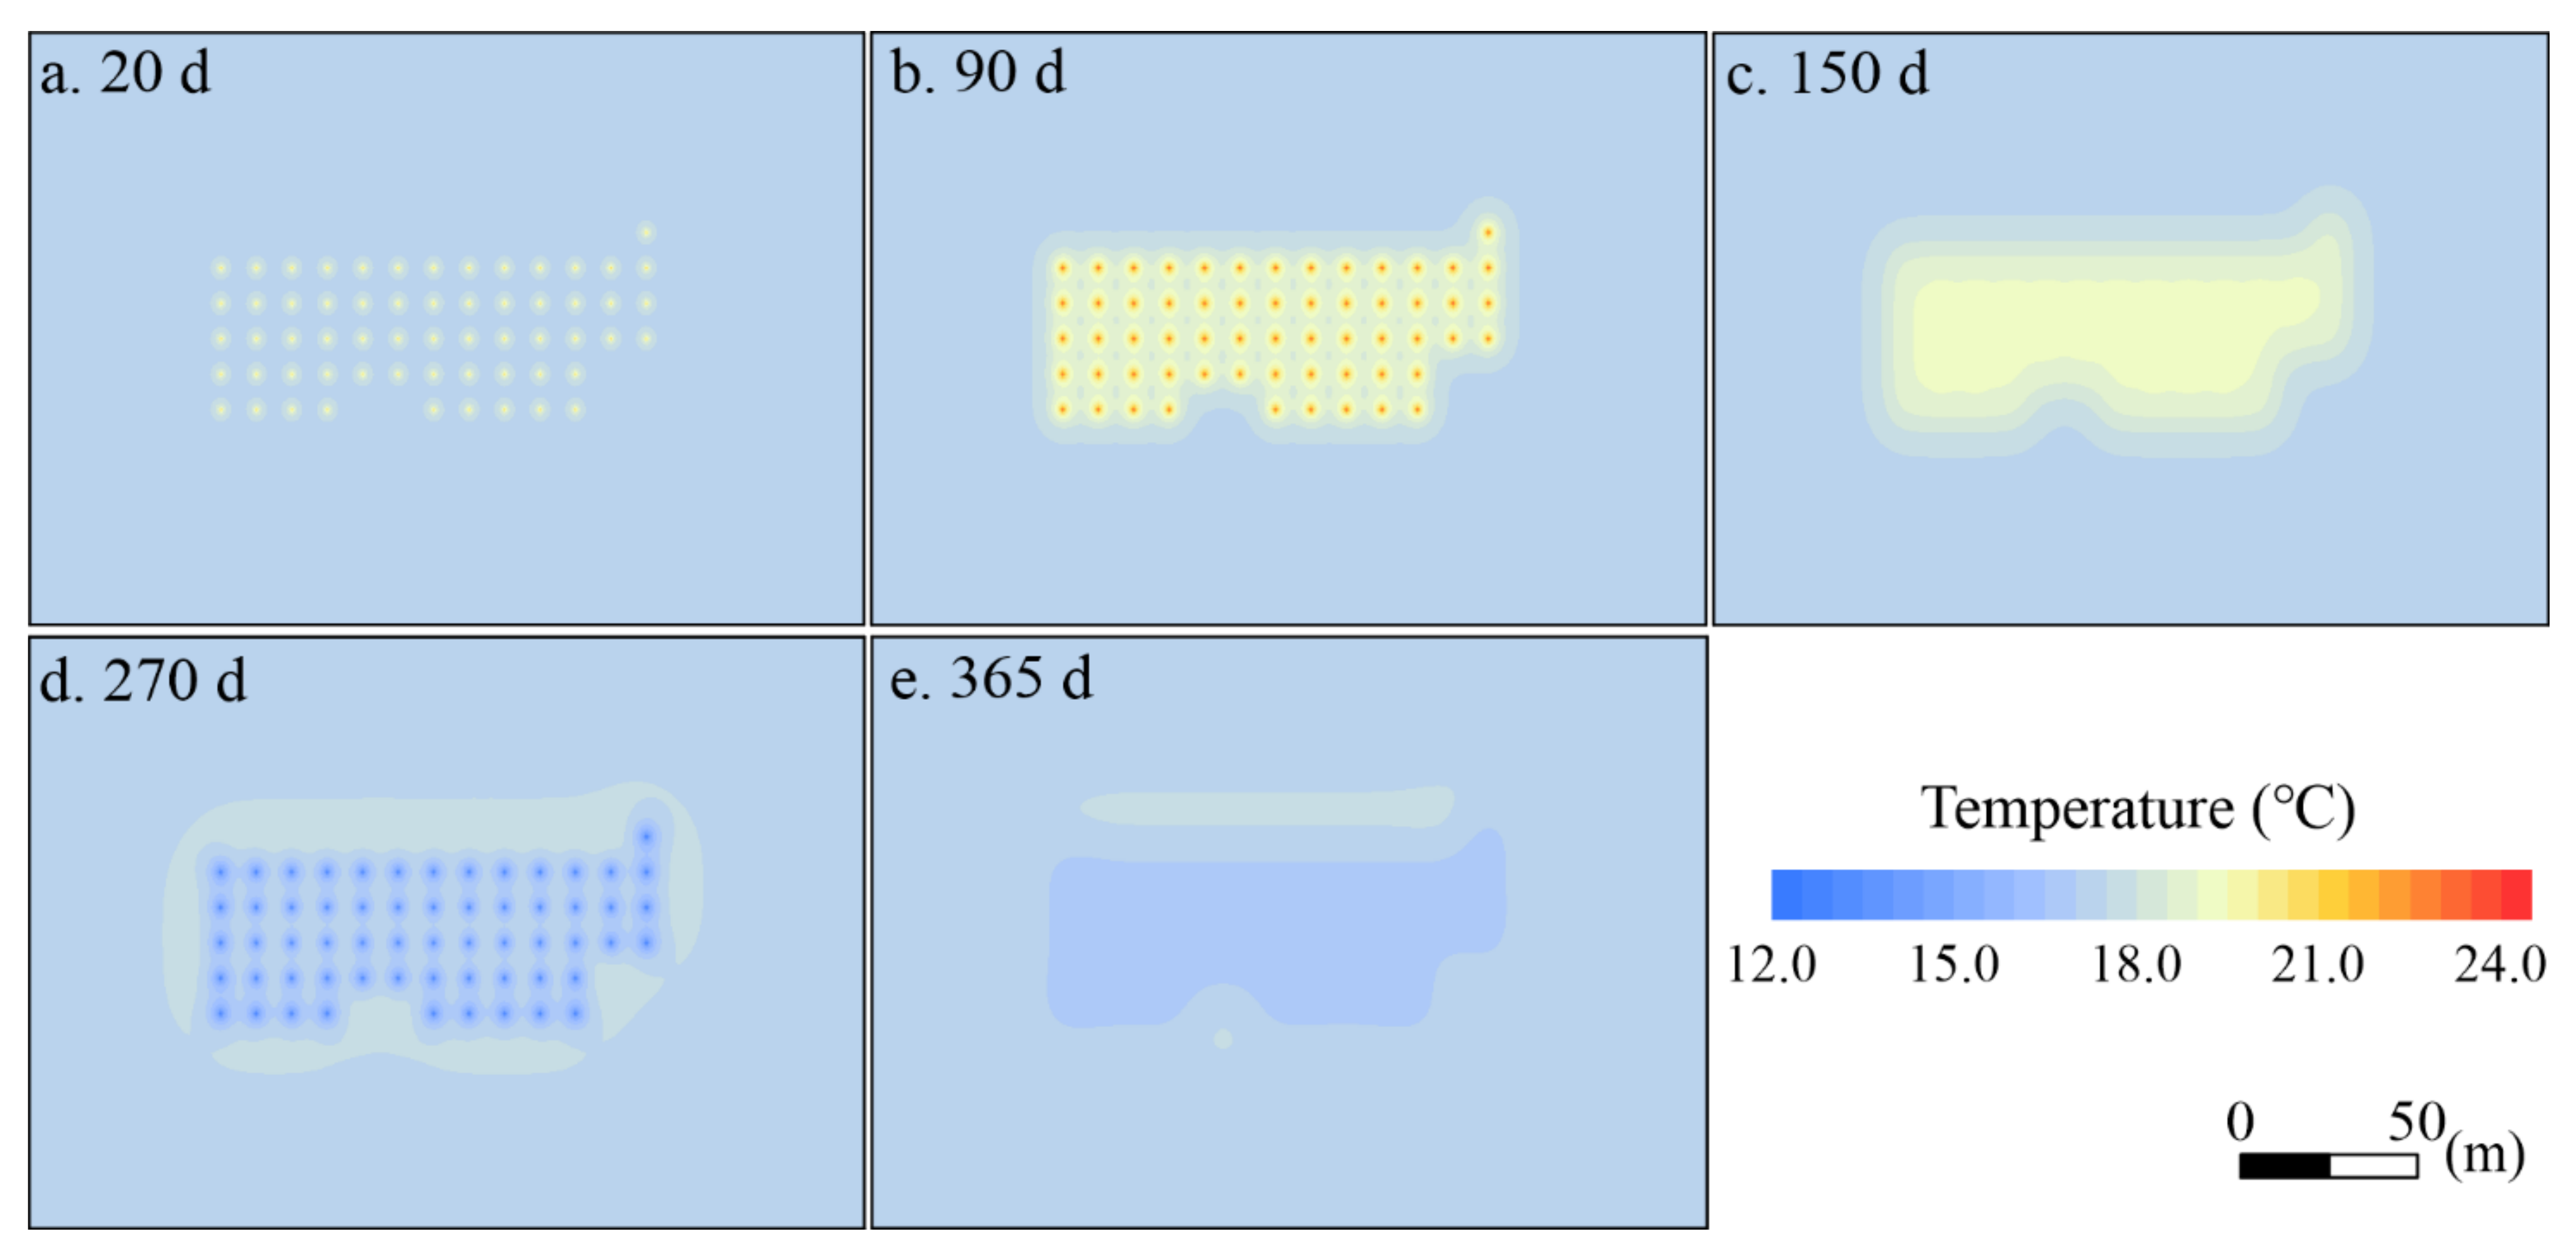
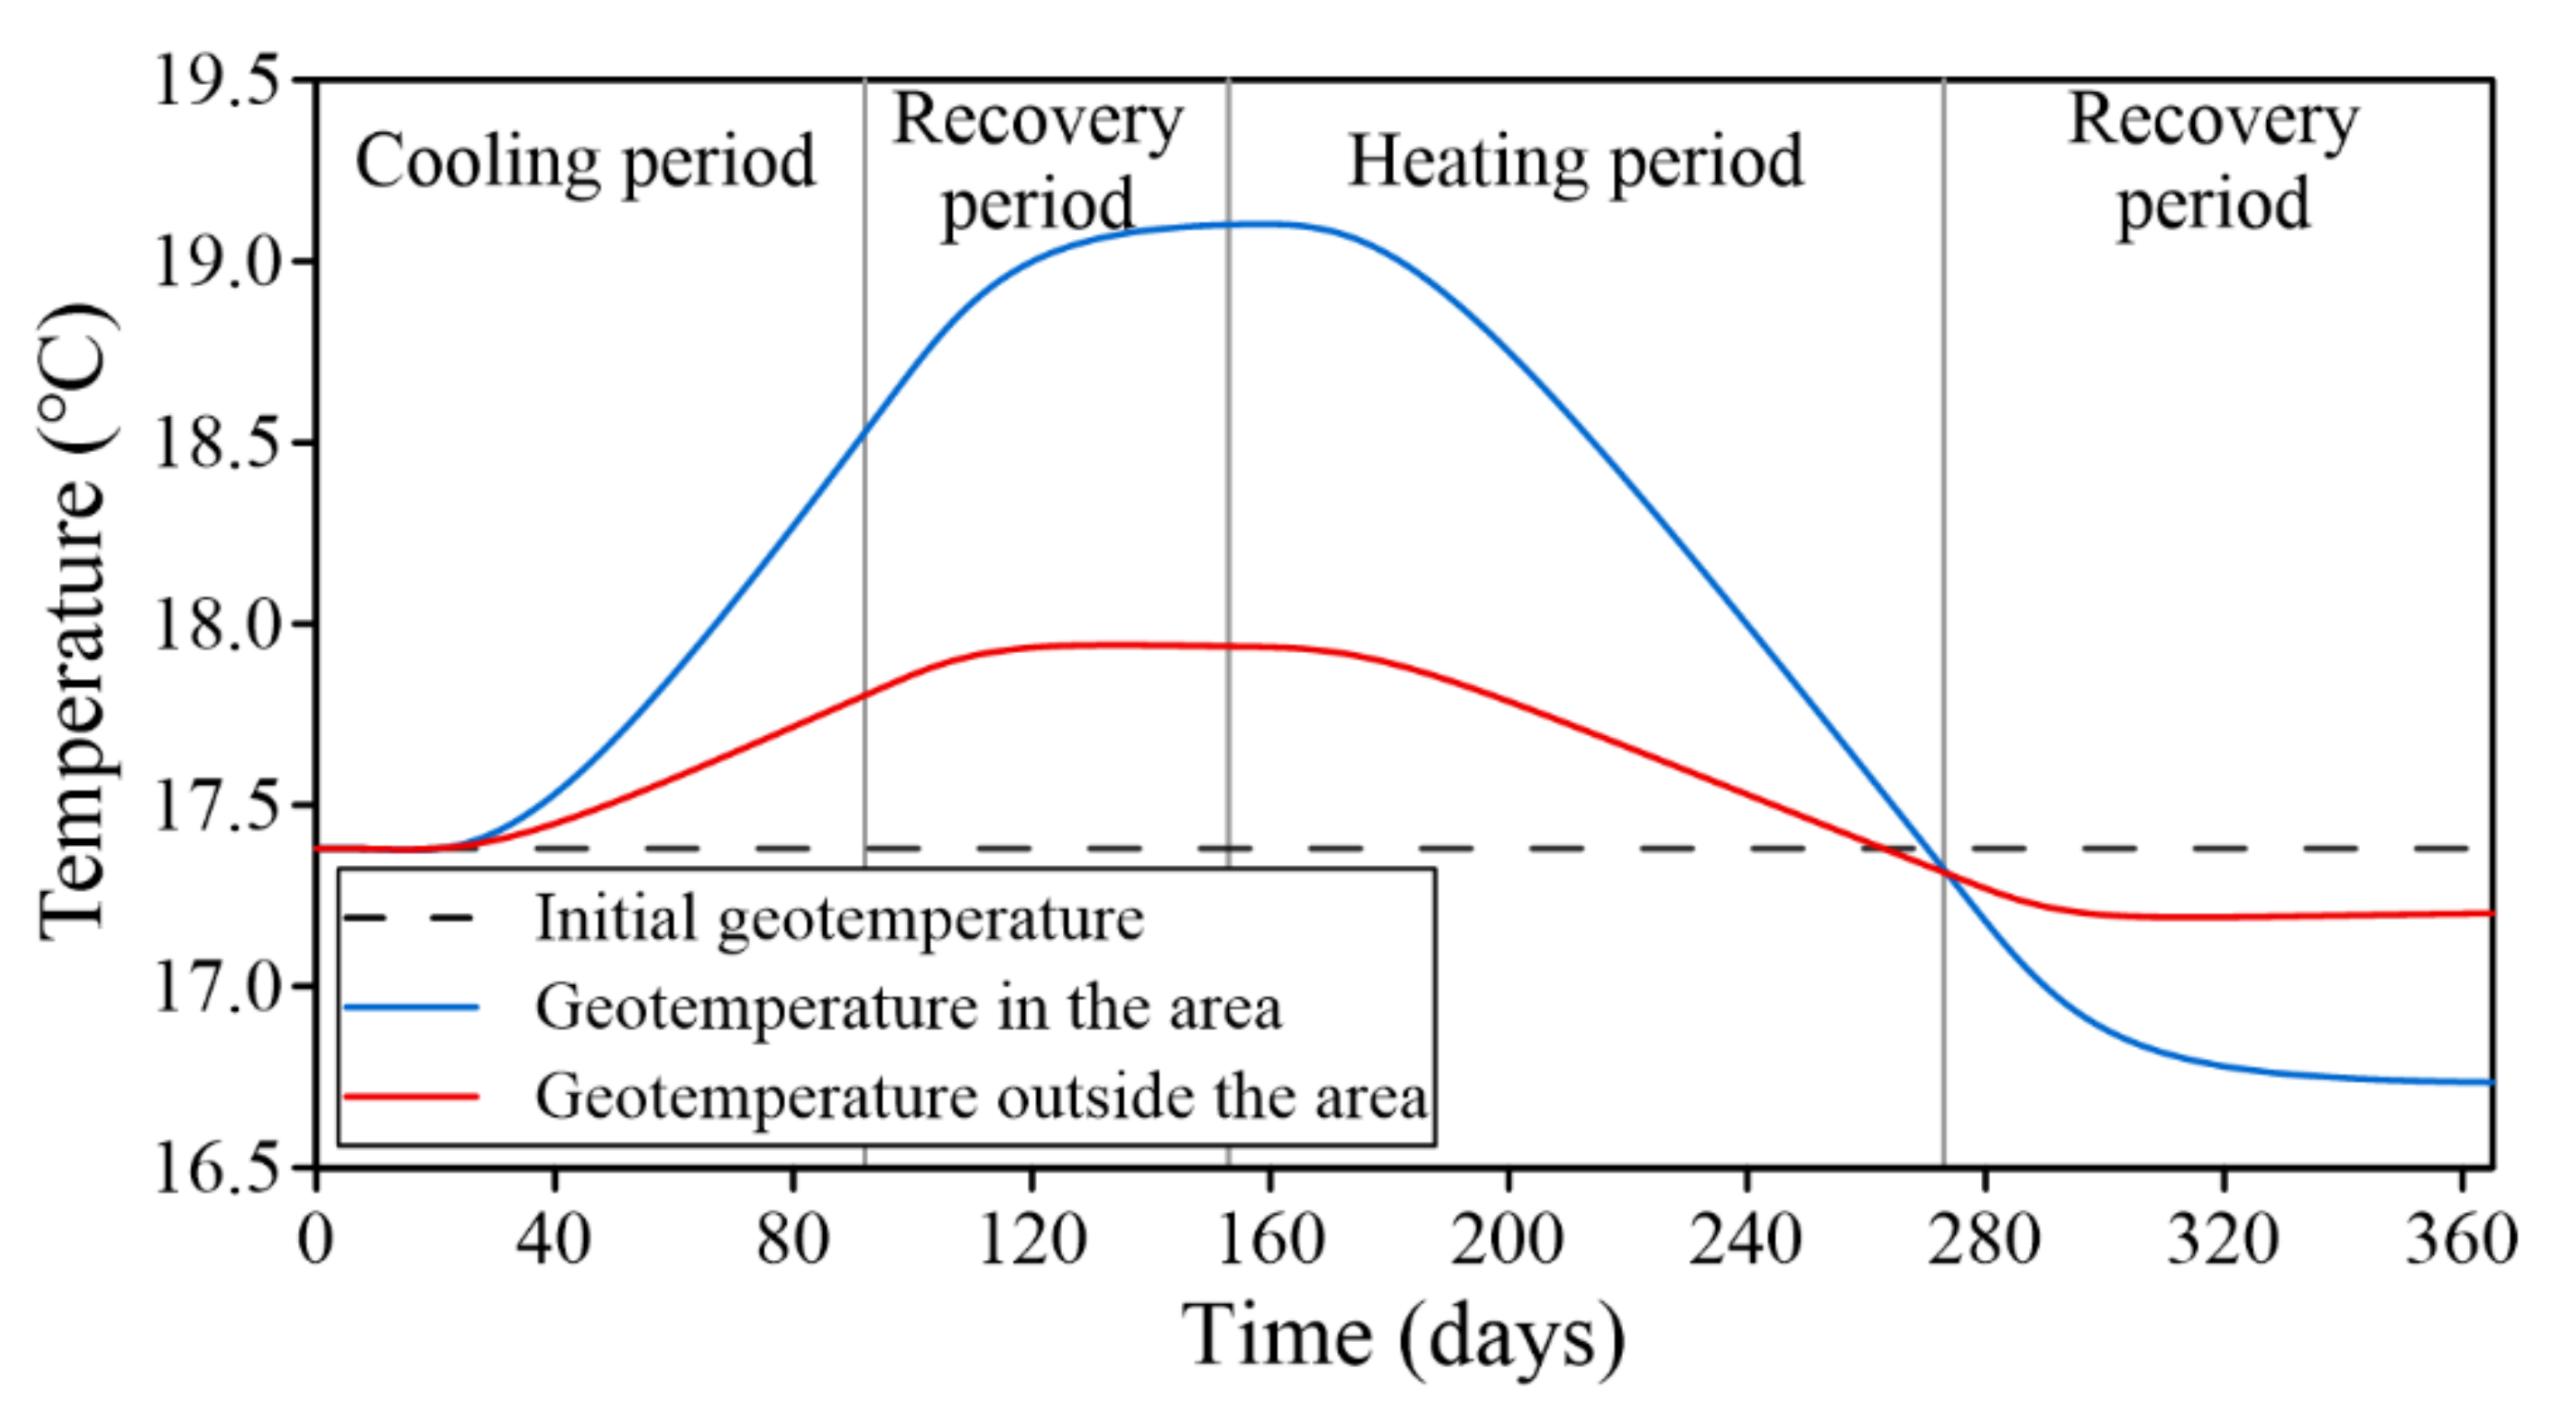
3.1.1. Intra-Annual Variation Characteristics of the Geotemperature under Intermittent Operation

A geotemperature distribution map of various moments of the phreatic aquifer at a burial depth of 100 m was chosen for comparison analysis to investigate the characteristics of the intra-annual geotemperature change of the GSHP system in one year of intermittent operation (Figure 5).
Figure 5a,b show the beginning and end of the cooling period. The heat circulating into the rock-soil body during the operation of the BHEs at the start of the cooling period built up around the BHEs. The thermal plume spread outward in a circular pattern. When the GSHP system was running continuously, a “thermal breakthrough” occurred as the thermal plumes between neighboring BHEs connected, resulting in temperature perturbation, which affected the efficiency of the BHEs. The geotemperature rose by 2.23 °C at a distance of 1 m from the BHEs, and the heat exchange area experienced the phenomenon of “heat accumulation” due to the obvious temperature difference between the heat exchange area and the surrounding rock and soil.
Figure 5b,c indicate the start and conclusion of the cooling recovery period. The thermal plume in the heat exchange area continued to expand outward during the recovery period, moving more toward the northern part of the area or downstream in the direction of groundwater runoff. This numerical method indicates that the heat was “carried” downstream due to groundwater movement in the porous medium. Additionally, there was still a noticeable “heat accumulation” in the heat exchange area at the end of the recovery period, with a temperature difference of roughly 1.73 °C between the interior and exterior of the heat exchange area.
The beginning and end of the heating period are depicted in Figure 5c,d. After transitioning from the cooling recovery period into the heating period, the geotemperature at the BHEs began to decrease and eventually formed a cold plume. This is because the BHEs circulated the heat from the rock-soil body for heating, and the cold circulated during the continuous operation of the GSHP system built up at the BHEs. The temperature of the BHEs was 4.83 °C lower than that of the rock-soil body outside the heat exchange area by the end of the heating period. At the same time, the efficiency of the GSHP system was impacted as the cold plume continued to spread out and connect with nearby BHEs.
The start and conclusion of the heating recovery period are presented in Figure 5d,e. During the GSHP system operation, the cold and heat accumulation near the heat exchange area was continuously neutralized. Most of the area near the heat exchange area experienced a return of its geotemperature to what it was before the operation of the GSHP system. However, there was still a cold accumulation within the heat exchange area. In addition, some heat accumulation downstream of the heat exchange area remained unneutralized. This is because the heat was carried downstream by the groundwater runoff, away from the heat exchange area, before it was neutralized by cooling during the heating period.
The typical monitoring holes W8 and W11 inside and outside the heat exchange area at a burial depth of 100 m were chosen to investigate the characteristics of the geotemperature change further during the operation of the GSHP system. A geotemperature duration curve at the monitoring holes is plotted in Figure 6. During the cooling period, the geotemperature inside the heat exchange area rose significantly, and the maximum temperature was higher than that outside the heat exchange area. Meanwhile, the initial warming time occurred much earlier than the outside-area geotemperature. This resulted from the “heat accumulation” effect in the heat exchange area caused by the superposition of several BHEs. The geotemperature, both inside and outside the heat exchange area, continued to rise and stabilize after entering the cooling recovery period. When viewed in conjunction with Figure 5, it is evident that heat accumulation at the BHEs following the end of the cooling period gradually transported and diffused outward, causing the geotemperature of the surrounding rock-soil body to rise even after the GSHP system had stopped working. Similarly, there was a lag in reducing the geotemperature inside and outside the heat exchange area during the heating period, and the geotemperature inside the area fell significantly. During this period, the geotemperature inside and outside the heat exchange area continued to decrease briefly before stabilizing. However, the geotemperature in the area was significantly lower than that outside the area. After a year of operation of the GSHP system, “cold accumulation” occurred in the heat exchange area, which was the cause of this.

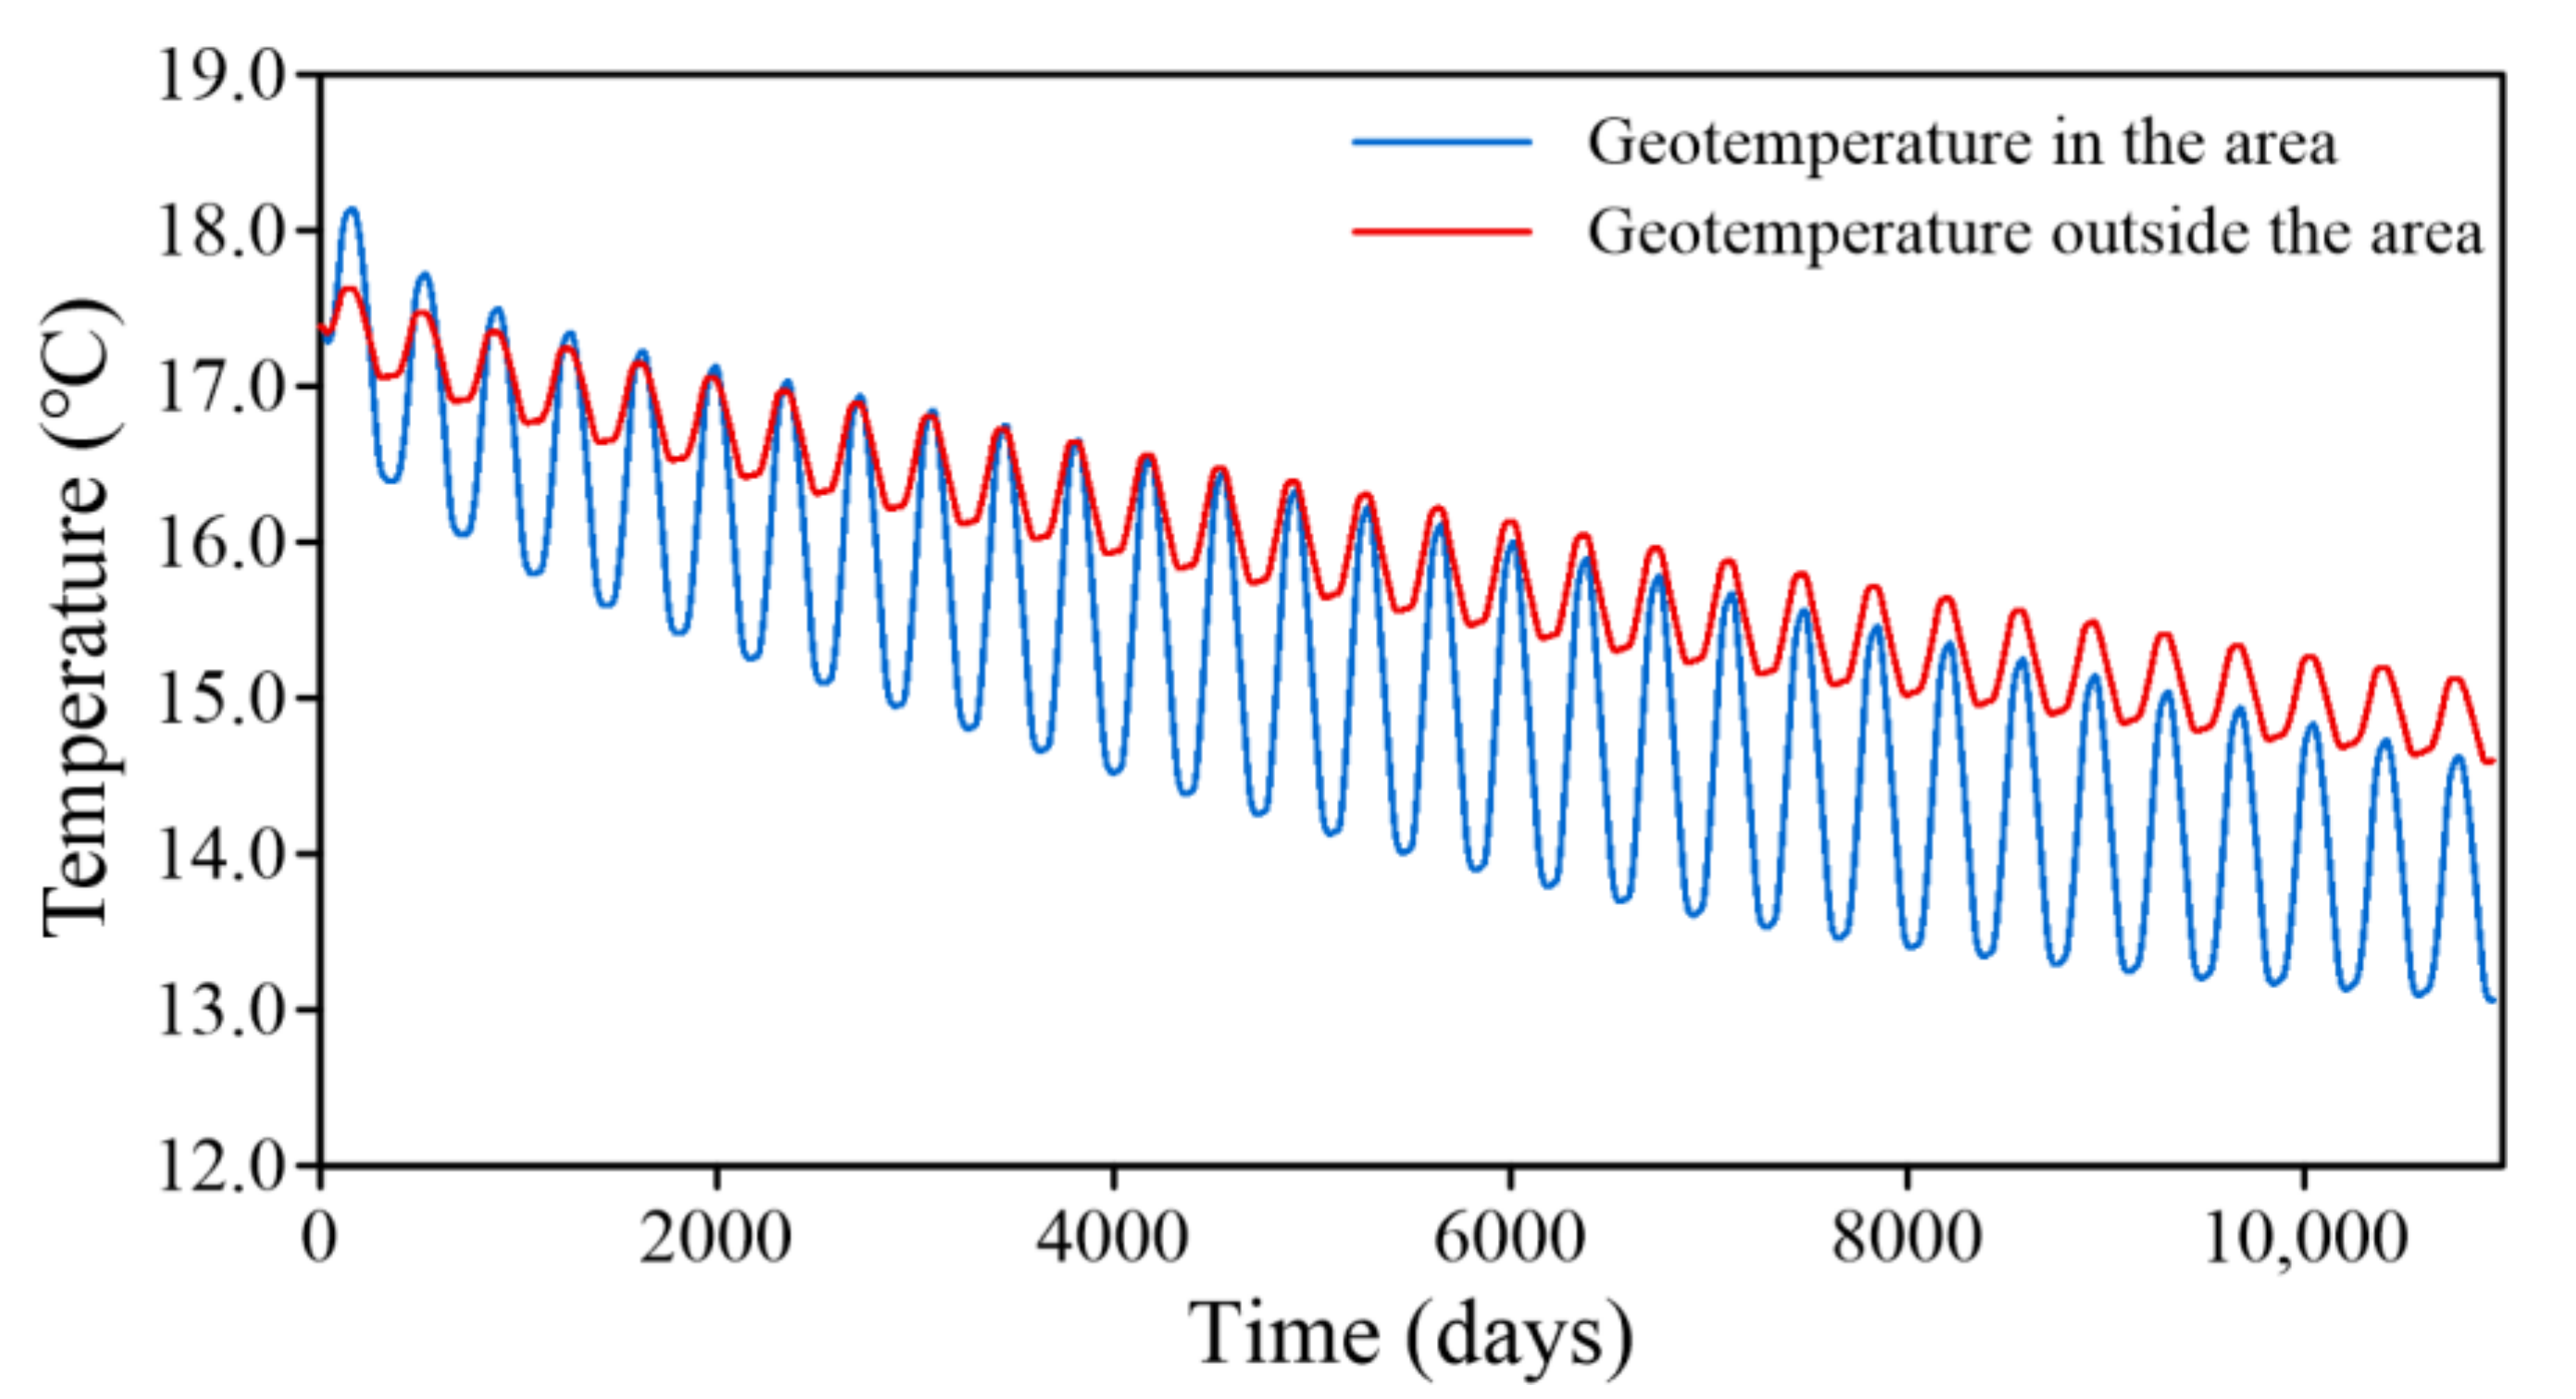
3.1.2. Multi-Year Variation Characteristics of the Geotemperature under Intermittent Operation

This section investigates the characteristics of geotemperature changes in the study area under the intermittent operation of “cooling in summer and heating in winter” of the GSHP system. Numerical modeling was used to predict the geotemperature field in the study area for the next 30 years based on the actual operation described above.
The geotemperature fluctuations (GTFs) in the aquifer at a depth of 100 m from the surface after different years of operation of the GSHP system (Figure 7) were selected for comparative analysis. As can be seen from the figure, a “cold plume” was generated in the heat exchange area after years of intermittent operation of the GSHP system. The geothermal equilibrium in the area was disturbed, and the cold plume range gradually expanded over time. At the same time, groundwater runoff carries downstream the “cold accumulation” in the heat exchange area. This resulted in a cold plume that extended farther downstream in the direction of the groundwater runoff.
Combined with the area of geotemperature variation, we explored the degree of “cold accumulation” in the heat exchange area after many years of operation to evaluate the rationality of the GSHP system. From the statistical results, the geotemperature in the heat exchange area dropped by approximately 1 °C after a year of the GSHP system being in use. After 30 years of operation, the geotemperature in the heat exchange area decreased by 4.81 °C. Compared to a year of operation, the area of geotemperature that decreased by more than 0.5 °C increased by approximately 6194 m2, while the size of the area that decreased by more than 1 °C increased by approximately 4758 m2. It can be seen that long–term operation of the GSHP system under the actual working conditions leads to a continuous decrease in temperature and the gradual expansion of the cold plume within the heat exchange area, resulting in a decrease in the geotemperature of a larger area.
In order to more clearly show the trend of temperature change within and outside the heat exchange area, observation holes W8 and W11 were selected to plot the geotemperature over time (Figure 8). Figure 8 makes it abundantly clear that the geotemperature inside and outside the heat exchange area fluctuation lowered with continuous operation of the GSHP system. In each heat exchange cycle, the geotemperature inside the area varied significantly, whereas the geotemperature outside the area had a smaller amplitude. The geotemperature continued to decrease, and the overall trend was consistent inside and outside the area. However, the final geotemperature decrease in the area was approximately 1.5 °C less than in the area, and the amount of “cold accumulation” was less.

3.2. Layout Optimization of the GSHP System

Based on an analysis of actual operation, this section explored the use of various measures to tackle the issue of “cold accumulation” in the heat exchange area and the impact on the downstream area to prolong the working life and maintain the efficiency of the GSHP system.
The locations of the BHEs in the heat exchange system are not completely regular in actual operation. Therefore, the BHEs were changed to a 10 × 6 regular layout to facilitate the study without changing the total number. The numerical model established in the previous section was used to simulate and predict the change of the geotemperature field after changing the working conditions of the heat exchange system.

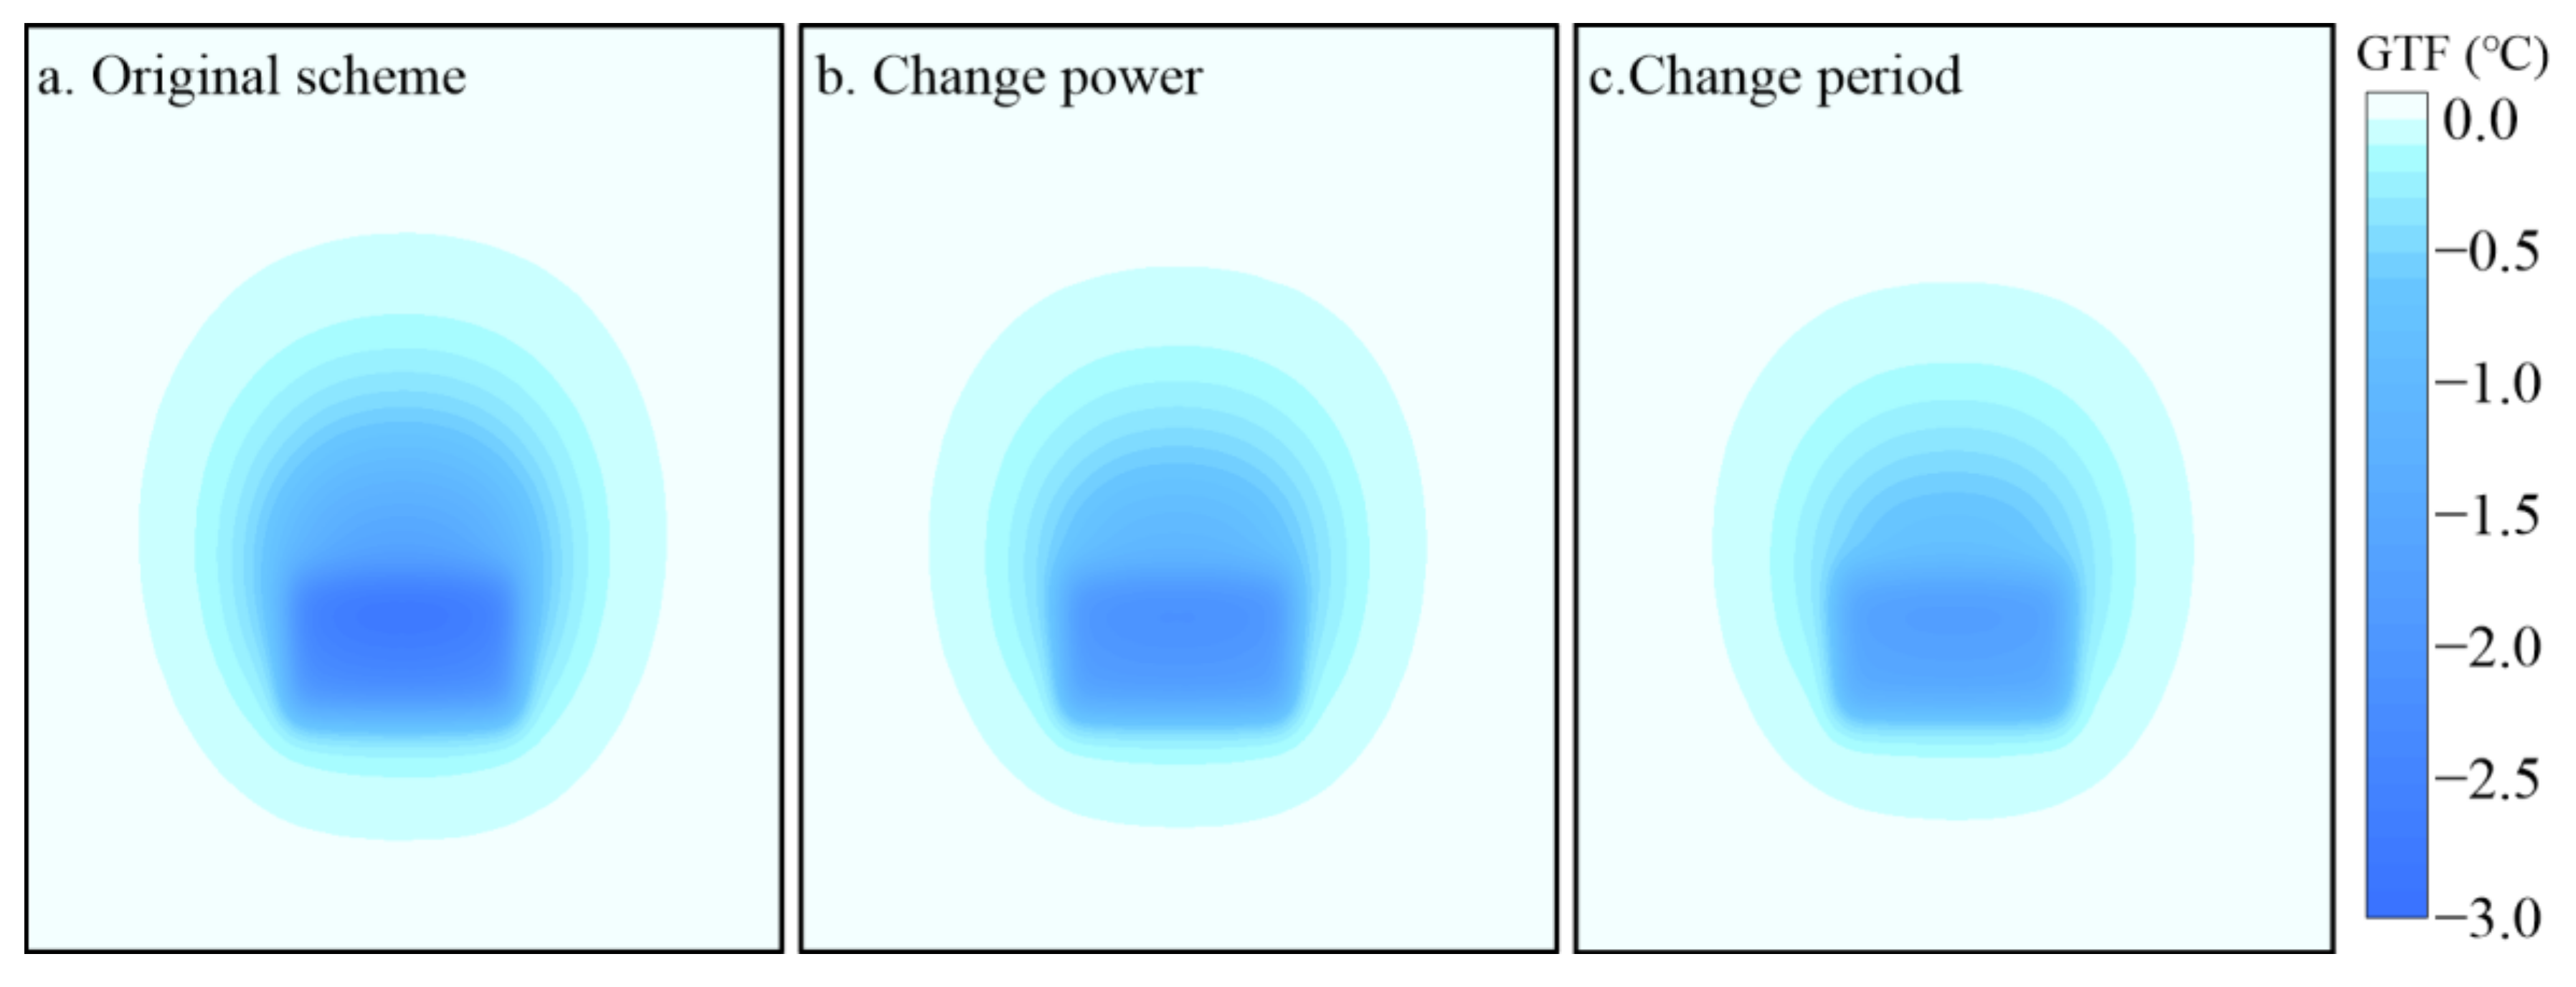
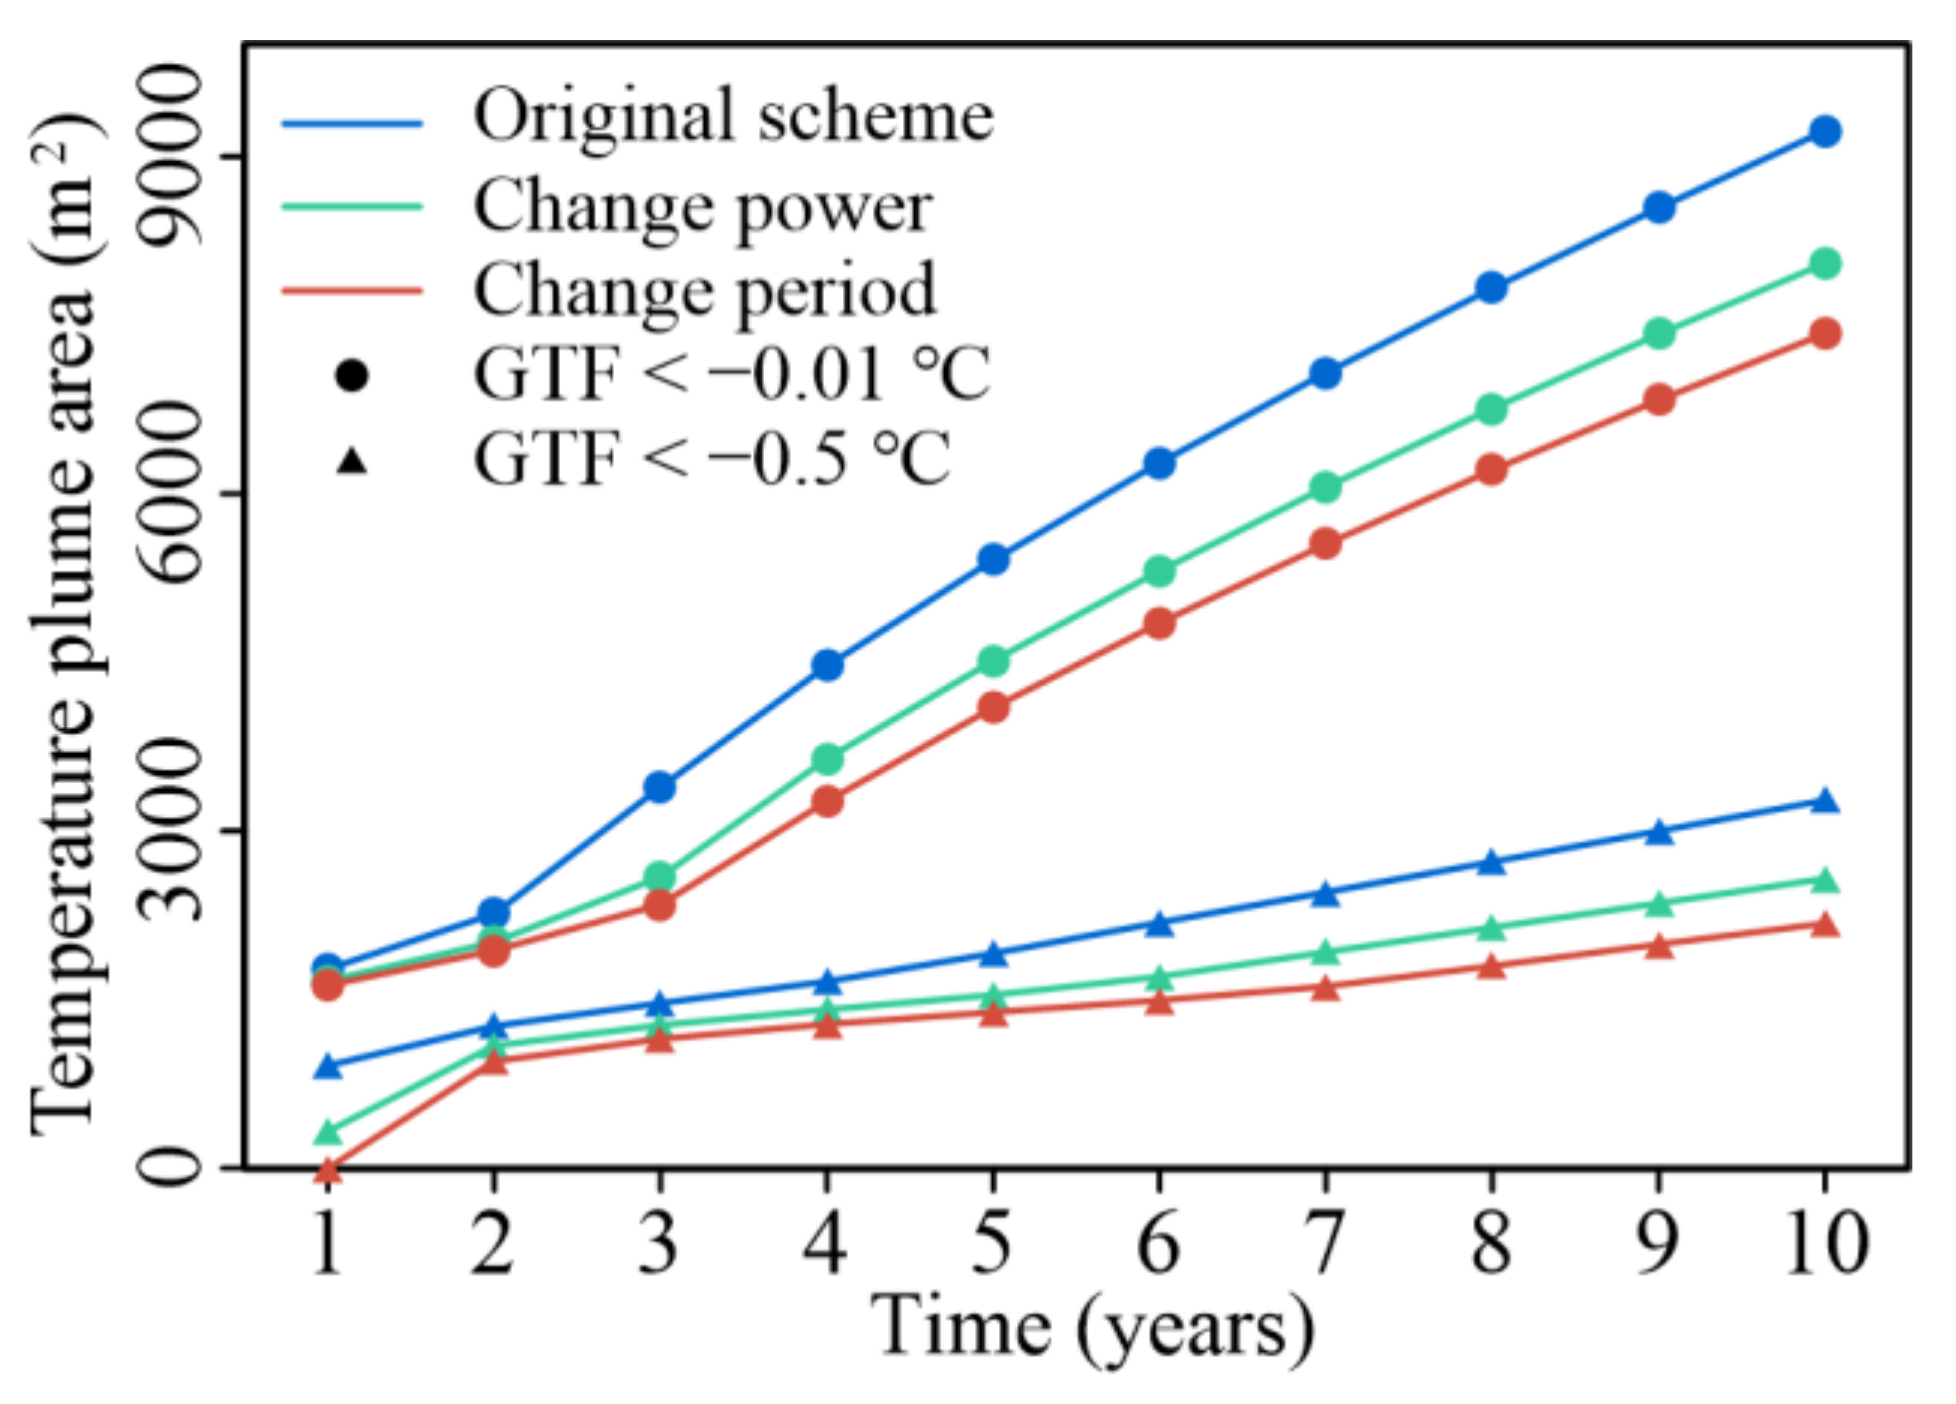
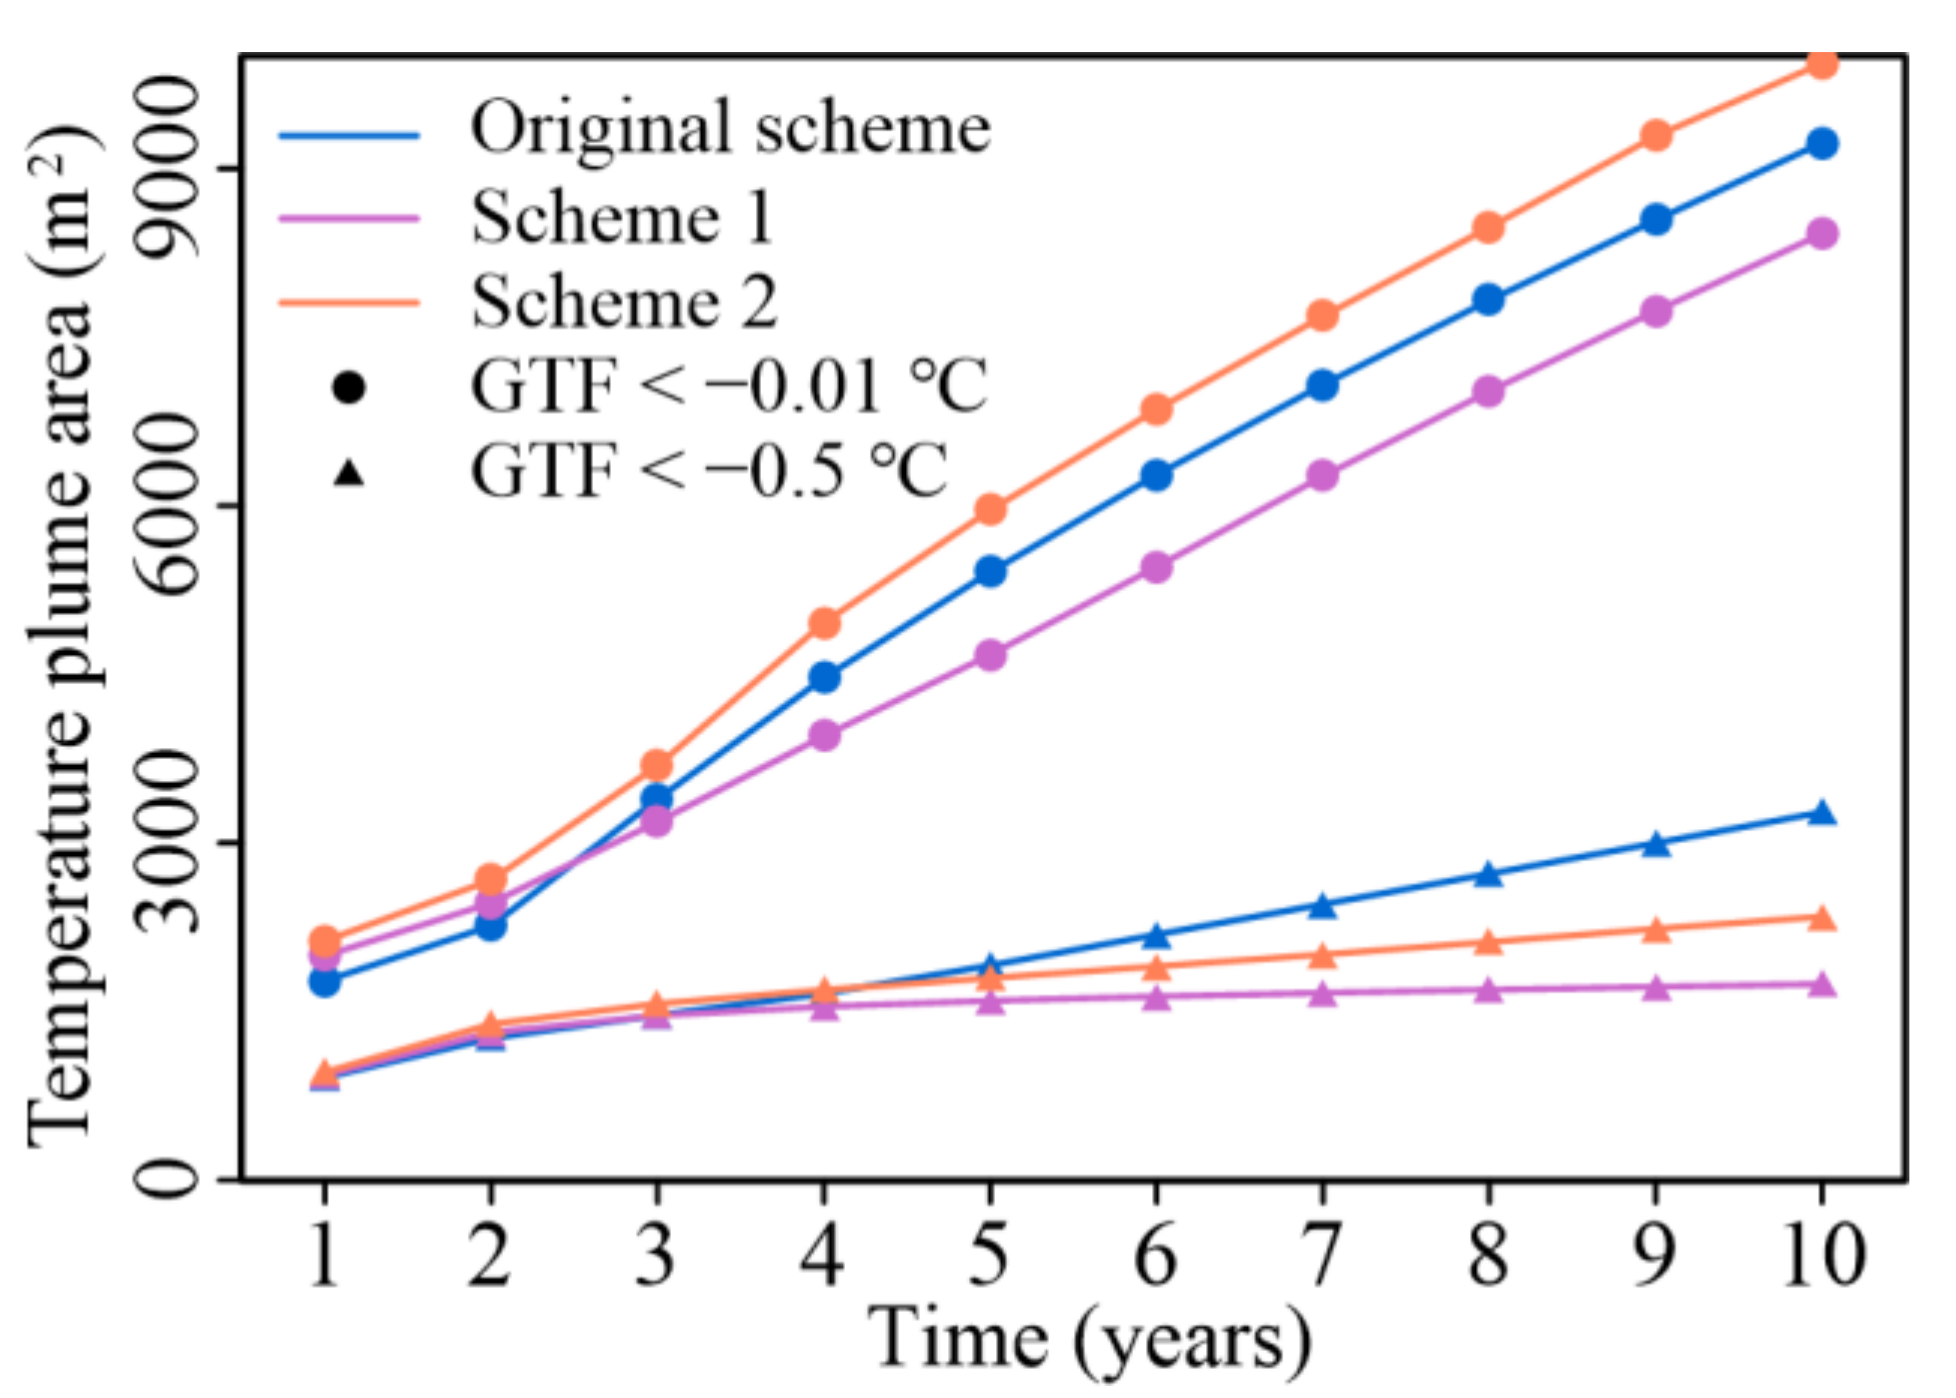
3.2.1. Changing the Operating Parameters of the BHEs

The actual load of a single BHE in the operation of the GSHP system is presented in the modeling. The summer cooling load was 4968 kW·h, while the winter heating load was 5558.4 kW·h, where the cooling period was 90 days and the heating period was 120 days. The heat exchange power of a single BHE was 2.3 kW for the cooling period and 1.93 kW for the heating period. Since the working time and power of the GSHP system were different in winter and summer, different heat exchange rates emerged, which caused a heat imbalance in the geothermal field.
As a result, the effects of different heat exchange parameters on the geotemperature field are discussed later by changing the heat exchange power and heat exchange period. Based on the original working condition, two different schemes were designed: (1) Change power, in which the working time of the heat exchange period and the heat exchange power of a single hole in the cooling period were kept unchanged. In the heating period, the heat exchange power of the single BHE was changed to 1.725 kW so that the actual load of the single hole was the same. (2) Change period, in which, according to the actual demand, the length of the cooling and heating periods was changed to 110 days, and the heat exchange capacity remained the same as that of scheme 1. Then, the cooling and heating periods of the single BHE heat exchange power were 1.882 kW. The numerical model predicted the results of the heat exchange system for each scheme after a certain time. The model parameters, in addition to the aquifer permeability coefficient of 1 m/d, and the rest of the parameters remained unchanged.

Illustrates Indicate

Figure 9 shows the GTFs at a 100 m depth for each scheme after ten years of operation of the GSHP system. Figure 10 depicts the change in the area of different GTFs with operating time. The cold plume area within the heat exchange area of both scheme 1 and scheme 2 was significantly reduced, i.e., the cold accumulation within the heat exchange area was alleviated. A smaller temperature drop in scheme 2 than in scheme 1 further reduced the problem of cold accumulation while also reducing the size of the cold plume and delaying the movement of cold downstream.
As can be seen, the aquifer’s heat balance was supposedly undisturbed when the operating time and power of the heat exchange period were the same. However, because groundwater was present, the heat exchange during the cooling period caused localized heat accumulation carried downstream by groundwater runoff. A cold accumulation eventually occurred at the end of the cooling period because the heat exchange during the heating period was unable to remove all of the heat that had accumulated during the cooling period.

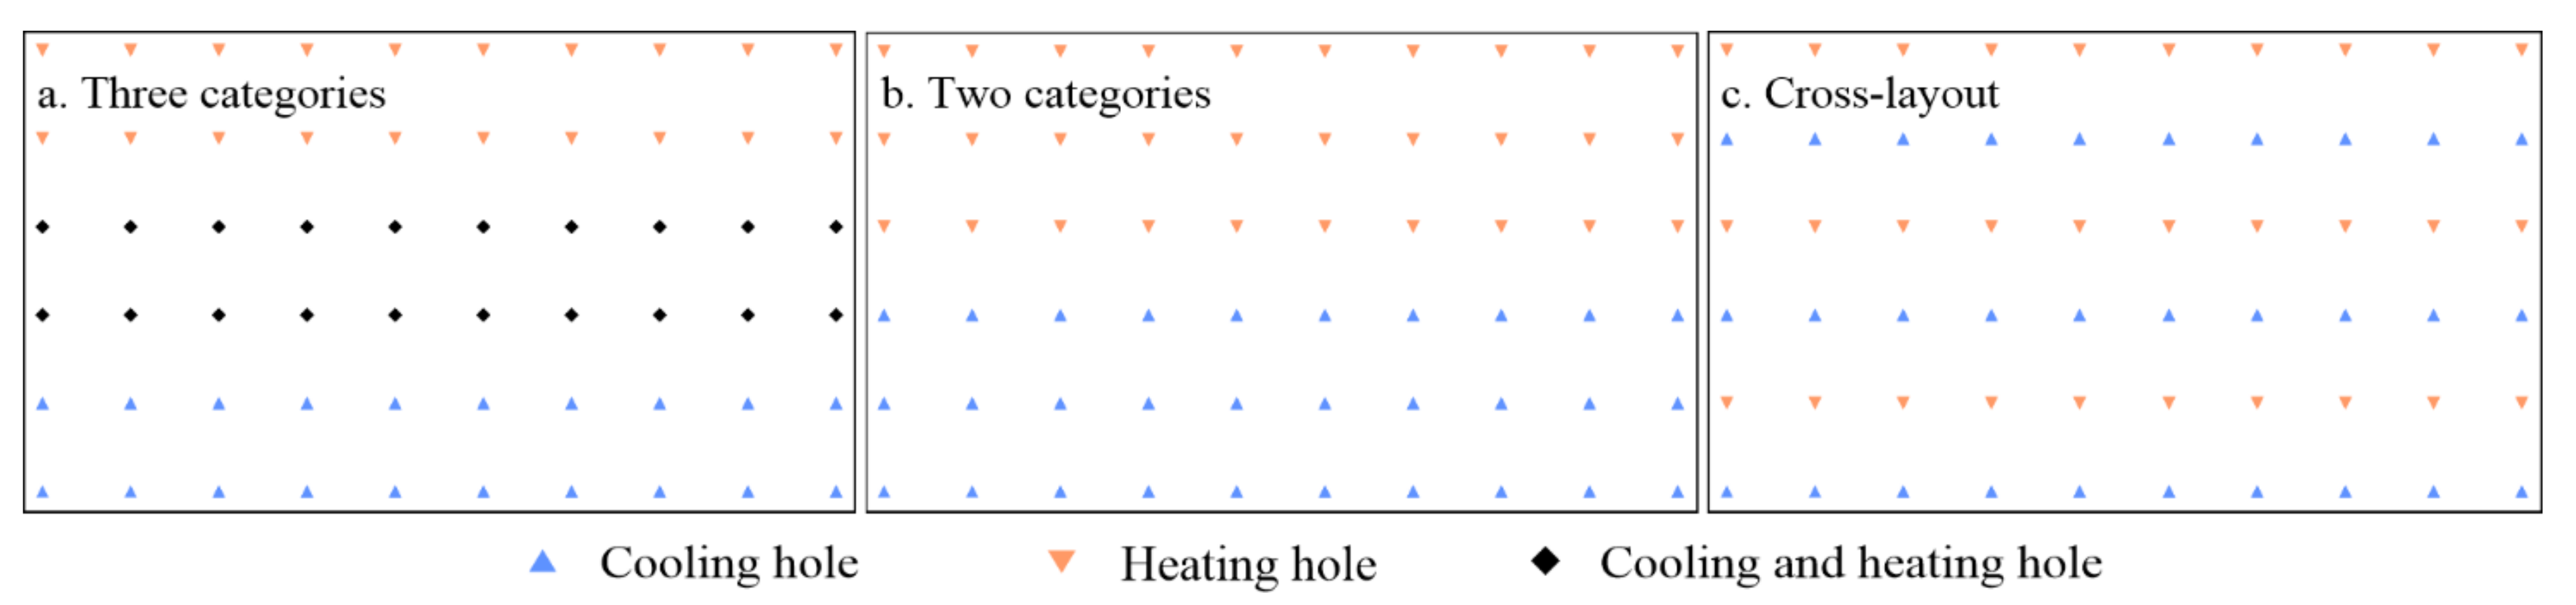
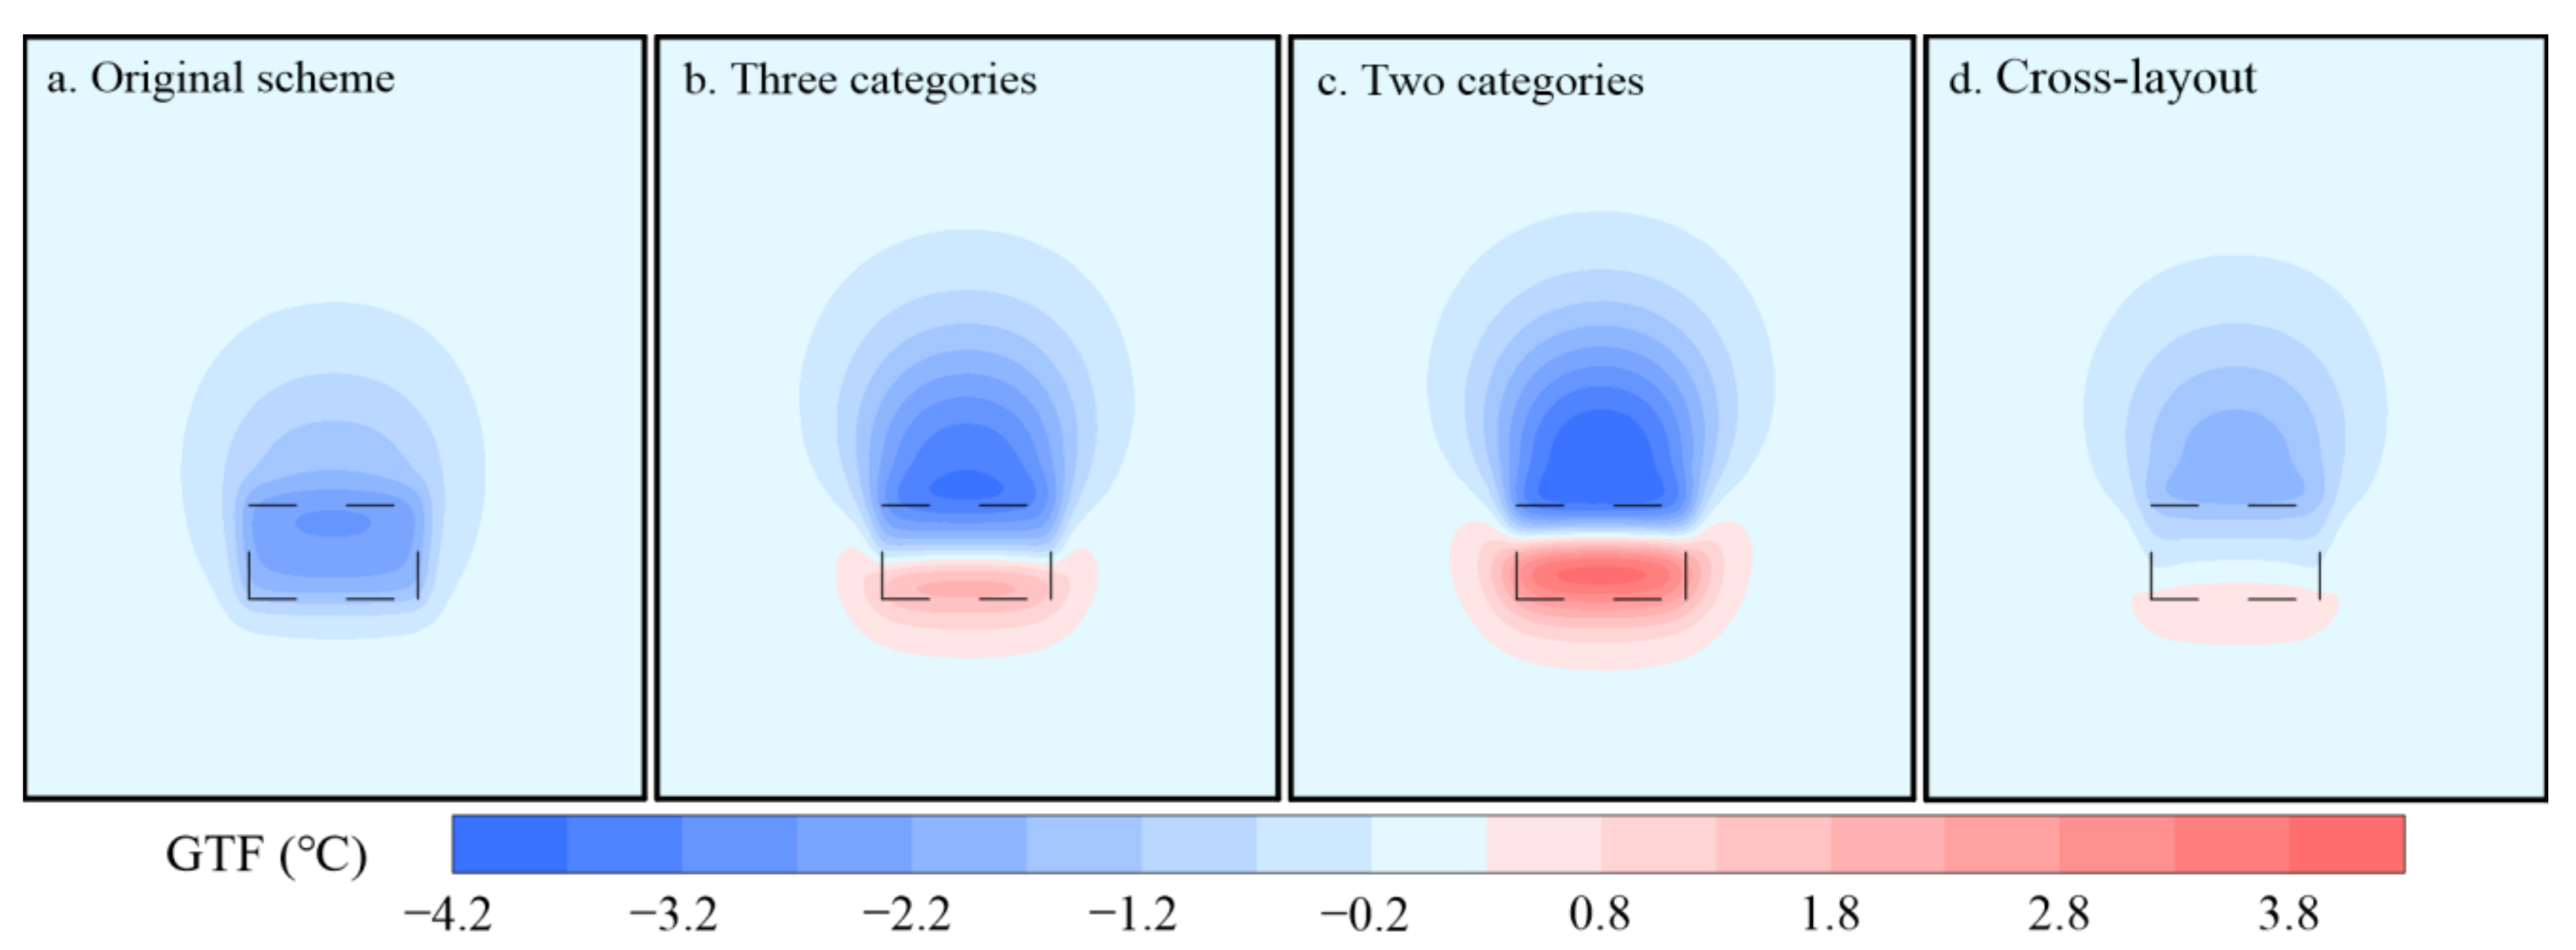
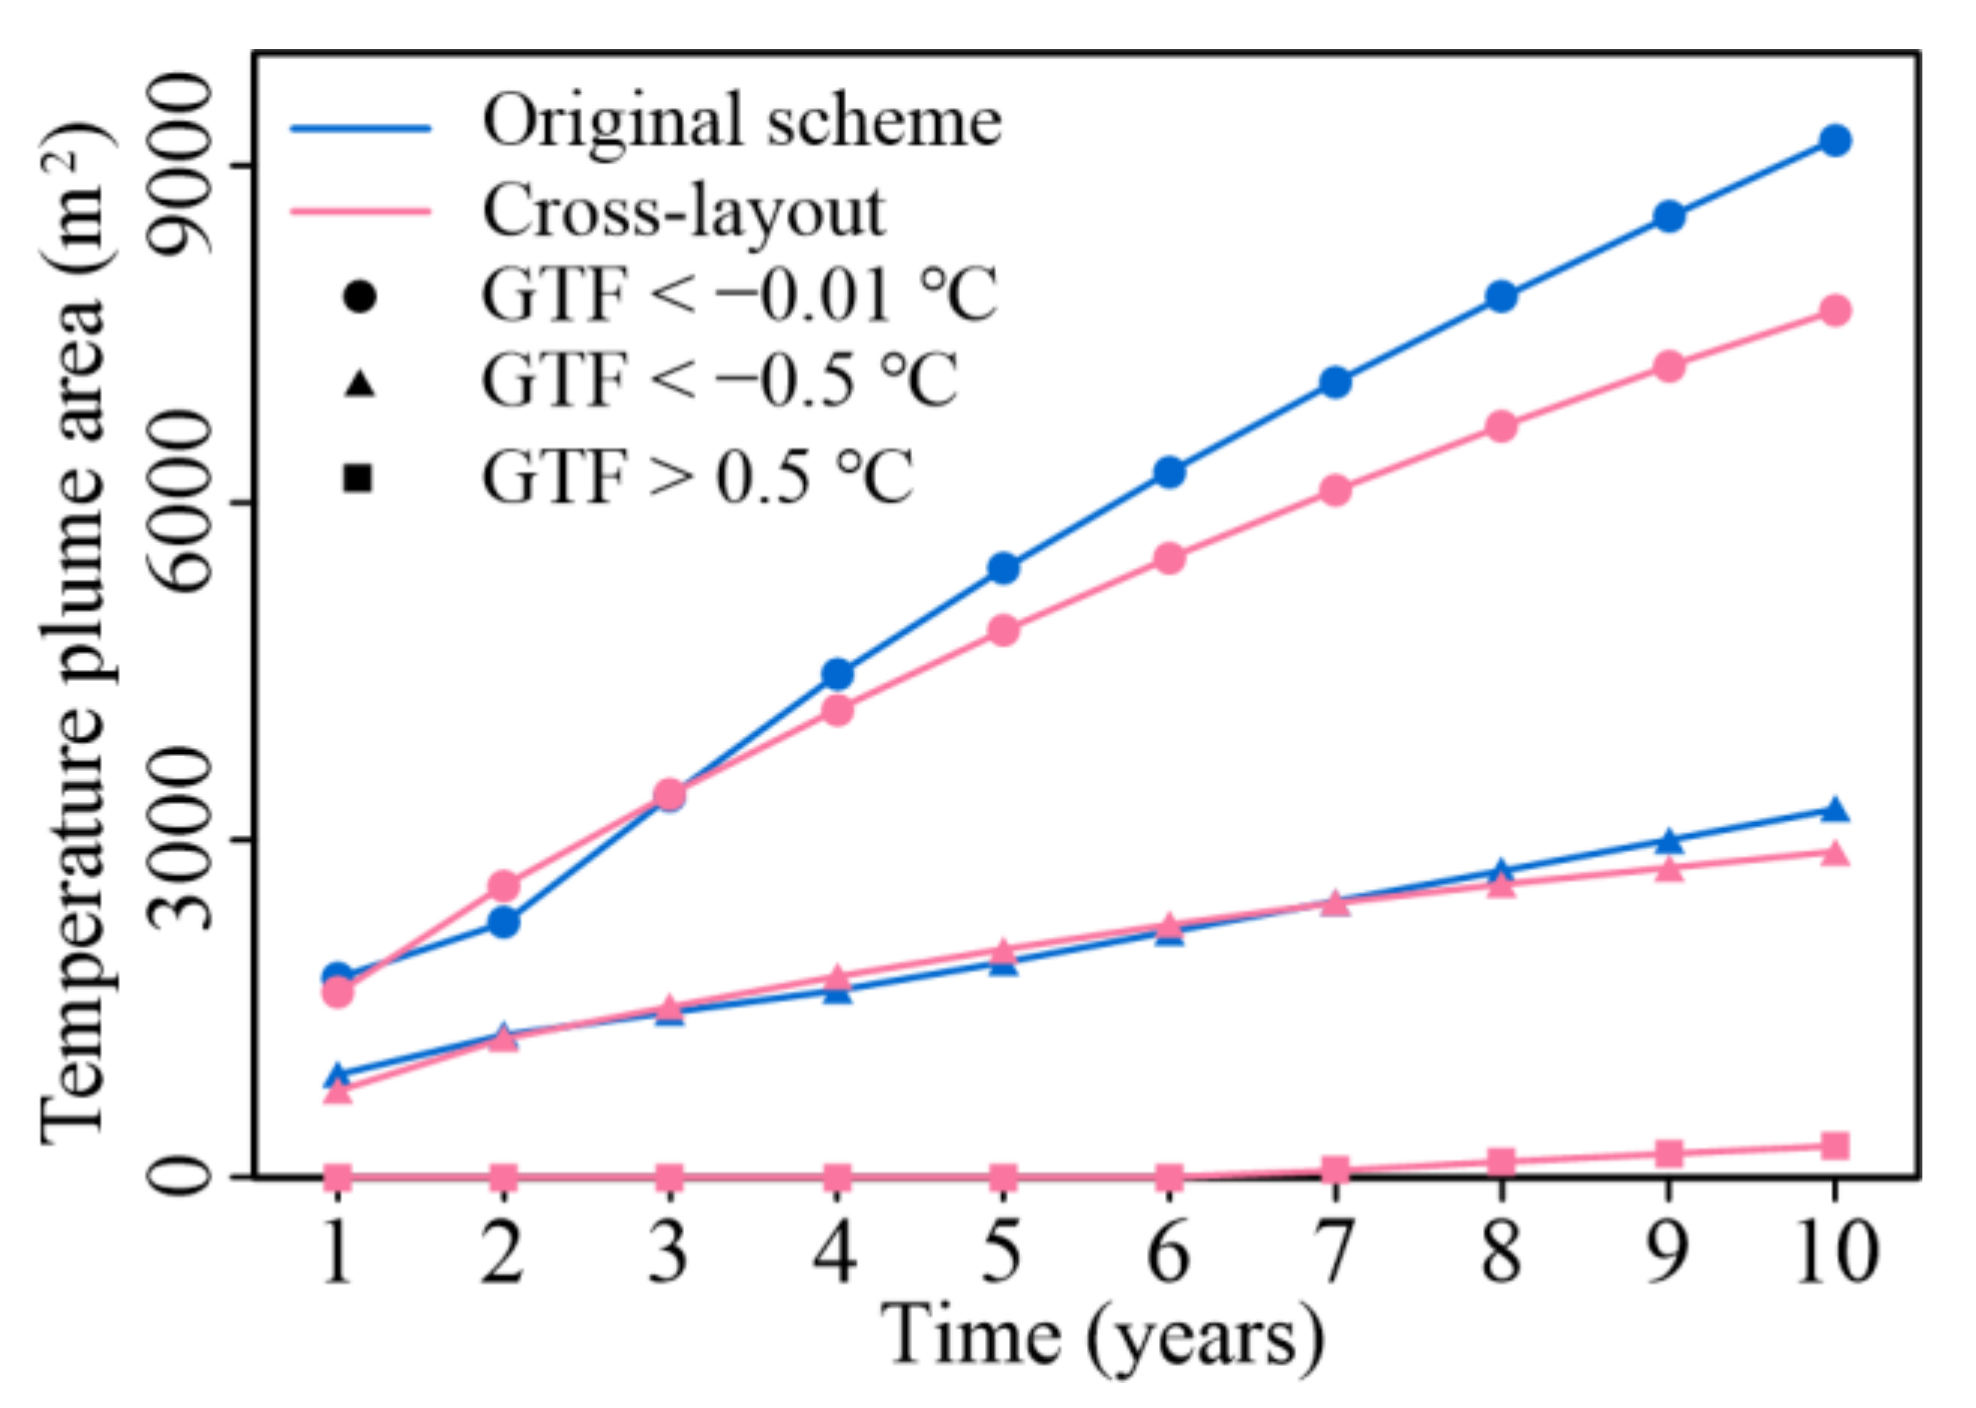
3.2.2. Changing the Layouts and Settings of the BHEs

The previous study found that due to the groundwater runoff, the cold and heat accumulation caused by the operation of the GSHP system was transported downstream, thus affecting the geothermal equilibrium in the downstream area. For this reason, this section discusses the effect on the geotemperature field by changing the layout and operation of the BHEs.
Based on the original working conditions, two different schemes were designed (Figure 11a,b): (1) Three categories, in which the BHEs were divided into three categories: The upstream 20 holes were only for cooling, the middle 20 holes were for cooling and heating at the same time, and the downstream 20 holes were only for heating. (2) Two categories, in which the BHEs were divided into two categories: The upstream 30 holes were only for cooling, and the downstream 30 holes were only for heating. Due to the change in the settings of the BHEs, to ensure that the amount of heat exchanged was consistent with the original program, the heat exchanger efficiency of the BHEs needed changing. The heat exchange power of the single hole was changed to 3.45 kW for the cooling period and 2.895 kW for the heating period in scheme 1, while it was changed to 4.6 kW for the cooling period and 3.86 kW for the heating period in scheme 2.
The geotemperature changes of the two schemes were compared with the original scheme in which the GSHP system was operated for 10 years (Figure 12a–c). The results show that the two new schemes produced areas of very small GTF within the heat exchange area compared to the original scheme. However, the upstream and downstream BHEs were operated in a single mode, thus more likely leading to heat accumulation upstream and cold accumulation downstream. In particular, in order not to change the heat exchange power, fewer BHEs were operated during the heat exchange period, and the heat exchange power of a single hole increased, which in turn made the local temperature accumulation intensify. It can be seen that dividing the BHE schemes into areas for heat exchange periods is not feasible under certain circumstances; although it can produce a small area of GTF in the heat exchange area, the disturbance of the geotemperature in and around the heat exchange area becomes more serious.
Although the results of the two schemes are imperfect, there was still a region where the GTF was very small. The main reason is that the cooling and heating holes were adjacent in the area, which neutralized the cold and heat accumulation generated by the BHEs when the GSHP system operated separately. Thus, (3) a cross-layout, in which the cooling and heating holes are arranged crosswise (Figure 11c), was proposed, and the change in the geotemperature in the heat exchange area was observed by running for a certain period.
Figure 12a,d and Figure 13 present the changes in geotemperature for 10 years of operation of the GSHP system in the cross-layout and original schemes. The data show that the cross-layout scheme of BHEs alleviated cold accumulation in the heat exchange area, but some heat accumulation occurred in the upstream area of the heat exchange area. The cold and heat accumulation of the new scheme was located more at the edge of the heat exchange area. At the same time, there was a significant improvement in the cold accumulation in the heat exchange area compared to the original scheme. This is because the energy injected into the rock-soil body during the heat exchange period was secondarily utilized to a certain extent, and the cross-layout BHEs neutralized the heat accumulation during time-phased operation. Nevertheless, the operation of the outermost BHEs resulted in cold and heat accumulation, particularly downstream of the heat exchanger area, where there was a clear tendency for cold accumulation and transportation downstream. The cross-layout scheme significantly reduced the cold plume in the region. Although a portion of the thermal plume was also produced via the cross-layout scheme, the heat accumulation area was situated upstream of the heat exchange area. The heat was transported downstream by groundwater and exchanged within the heat exchange area, thus mitigating the downstream transport of the thermal plume.

3.2.3. Artificial Intervention in the Groundwater Flow Field

According to the results of the above study, the effect of groundwater seepage on the geotemperature in the operation of the GSHP system is very apparent. With the continuous development of human activities, especially groundwater extraction and recharge, anthropogenic disturbances indirectly affect the distribution of the geotemperature field and heat exchange efficiency in the heat exchange area by changing the local groundwater flow field [34,35,36]. To effectively inhibit the diffusion of the temperature plume caused by heat exchange and avoid the impact of the GSHP system’s operation on the geotemperature of the downstream rock-soil body, the system was optimized by artificially interfering with the flow field.
Regarding the different combinations of pumping and recharge wells, there are two schemes: (1) Scheme 1, a row of five pumping wells 10 m downstream from the outermost BHEs and a row of five recharge wells 10 m downstream from the pumping wells. (2) Scheme 2, a row of five recharge wells 10 m upstream from the outermost BHEs and a row of five pumping wells 10 m downstream from the outermost BHEs.
Figure 14 shows the GTFs at a 100 m depth for each scheme after ten years of operation of the GSHP system. Figure 15 depicts the change in the area of different GTFs with operating time. The findings indicate that the range of influence was reduced with a GTF < −0.01 °C in scheme 1. Cold accumulation mainly occurred in the heat exchange area and downstream, which was significantly mitigated compared to the original scenario. Even though the area of influence grew, the cold accumulation in scheme 2 was less severe than in the original scheme. However, a broadly dispersed cold plume was upstream of the heat exchange region. This was due to an increased hydraulic gradient with the nearby aquifer caused by the upstream recharge well. The change in groundwater direction and velocity that occurred when the cold plume traveled around the recharge wells caused the cold plume to travel to some areas of the upstream region.
From a comprehensive standpoint, scheme 1 performed relatively better because it effectively inhibited the cold plume from traveling downstream while alleviating the cold accumulation. In conclusion, the method of artificially altering the flow field has the potential to significantly reduce the cold and heat accumulation brought on by the operation of the GSHP system while also limiting the downstream spread and speed of a cold plume.

4. Conclusions

Based on a GSHP system in Xi’an, this study simulated and predicted the response characteristics of the geotemperature field in the heat exchange area to the GSHP system under actual operation by analyzing the measured geotemperature data and using the numerical simulation method. The optimization scheme of the GSHP system under the specific environment was also investigated by altering the layout and operating power of the system. The main conclusions are as follows:
  • During the actual operation of the GSHP system, the intra-annual variation in geotemperature demonstrated the cold and heat accumulation cycle. Cold accumulates in the heat exchange area and the surrounding rock-soil body after a prolonged period of operation, and a particular range of cold plumes is formed downstream due to groundwater runoff;
  • The heat exchange power is changed so that the amount of heat exchange is the same in the winter and summer; the problem of cold and heat accumulation can be alleviated to some extent. A program that simultaneously changes the heat exchange power and the length of the heat exchange period so that the amount of heat exchange is the same is more effective for suppressing cold and heat accumulation compared to other programs;
  • In different buried pipe operation methods, the upstream cooling and downstream heating methods do not effectively alleviate the accumulation of heat and cold in the heat exchange area but rather create a more serious accumulation problem around the heat exchange area. However, the cross-layout of cooling and heating holes is a better solution because it can effectively relieve the accumulation of heat and cold in the heat exchange area and simultaneously inhibit the transportation of cold and thermal plumes to the surrounding area;
  • A combination of pumping and recharge wells around the heat exchange area is less likely to produce cold and heat accumulation. The combination of multiple pumping and recharge wells located downstream is the preferred option, which causes less disturbance to the geotemperature field in the upstream region than the upstream recharge option.
  • In this study, the optimization scheme of a GSHP system was qualitatively discussed using numerical simulation. Therefore, future research can carry out quantitative calculations for the scenarios with better results to explore the optimal solution for the operation of the GSHP system.

Author Contributions

Conceptualization, Y.L. (Yujiao Li) and P.L.; methodology, Y.L. (Yujiao Li), P.L. and X.K.; software, Y.L. (Yujiao Li) and Y.J.; investigation, Y.L. (Yujiao Li) and Y.L. (Yitian Liu); data curation, Y.J. and Y.L. (Yitian Liu); writing—original draft, Y.L. (Yujiao Li); writing—review and editing, W.W. and H.L.; supervision, W.W. All authors have read and agreed to the published version of the manuscript.

Funding

This research received no external funding.

Data Availability Statement

All data generated or used during the study are reasonably available from the corresponding author.

Acknowledgments

The authors give special thanks to the editor and reviewers of this paper for their patience and the valuable comments used to revise the manuscript.

Conflicts of Interest

The authors declare that they have no known competing financial interests or personal relationships that could have appeared to influence the work reported in this paper.

Nomenclature

3DThree-dimensional
BHEBorehole heat exchanger
GSHPGround source heat pump
GTFGeotemperature fluctuations

References

  1. Zhou, Z.Y.; Liu, S.L.; Liu, J.X. Study on the Characteristics and Development Strategies of Geothermal Resources in China. J. Nat. Resour. 2015, 30, 1210–1221. [Google Scholar] [CrossRef]
  2. Liu, A.; Zheng, J.; Li, J.; Du, J.; Li, F. Comparison Study on Resource Evaluation Methods of Shallow Geothermal Energy and Traditional Geothermal Energy. Urban Geol. 2018, 13, 37–41. [Google Scholar] [CrossRef]
  3. Xu, Y.S.; Wang, X.W.; Shen, S.L.; Zhou, A. Distribution Characteristics and Utilization of Shallow Geothermal Energy in China. Energy Build. 2020, 229, 110479. [Google Scholar] [CrossRef]
  4. Zhang, L.; Chen, S.; Zhang, C. Geothermal Power Generation in China: Status and Prospects. Energy Sci. Eng. 2019, 7, 1428–1450. [Google Scholar] [CrossRef]
  5. Wang, G.; Lu, C. Progress of Geothermal Resources Exploitation and Utilization Technology Driven by Carbon Neutralization Target. Geol. Resour. 2022, 31, 412–425+341. [Google Scholar] [CrossRef]
  6. Wang, S.; Li, F.; Yan, J.; Hu, J.; Wang, K.; Ren, H. Evaluation Methods and Application of Geothermal Resources in Oilfields. Acta Pet. Sin. 2020, 41, 553–564. [Google Scholar] [CrossRef]
  7. Li, Z.; Sun, J. Investigation and Analysis of New Energy Technology Application Status in Beijing—Water Source Heat Pump System. In Energy Solutions to Combat Global Warming. Lecture Notes in Energy; Zhang, X., Dincer, I., Eds.; Springer: Cham, Switzerland, 2017; Volume 33, pp. 497–507. [Google Scholar] [CrossRef]
  8. Shah, A.; Krarti, M.; Huang, J. Energy Performance Evaluation of Shallow Ground Source Heat Pumps for Residential Buildings. Energies 2022, 15, 1025. [Google Scholar] [CrossRef]
  9. Wang, S.; Gao, J.; Zhang, X.; Wang, Y.; Cai, X. Experimental and Numerical Investigations on the Thermal Behavior of Ground Heat Exchanger in Stratified Soils across Unsaturated and Saturated Layers. Appl. Therm. Eng. 2021, 195, 117163. [Google Scholar] [CrossRef]
  10. Wei, W.; Zheng, G.; Luan, Y. Characteristics and influencing factors of the shallow geothermal field in Beijing plain area. Geol. China 2010, 37, 1733–1739. [Google Scholar]
  11. Yang, W.; Kong, L.; Chen, Y. Numerical Evaluation on the Effects of Soil Freezing on Underground Temperature Variations of Soil around Ground Heat Exchangers. Appl. Therm. Eng. 2015, 75, 259–269. [Google Scholar] [CrossRef]
  12. Zhou, Y.; Mu, G.; Zhang, H.; Wang, K.; Liu, J.; Zhang, Y. Geothermal field division and its geological influencing factors in Guanzhong basin. Geol. China 2017, 44, 1017–1026. [Google Scholar] [CrossRef]
  13. Wang, W.; Wang, G.; Liu, F.; Liu, C. Characterization of Ground Thermal Conditions for Shallow Geothermal Exploitation in the Central North China Plain (NCP) Area. Energies 2022, 15, 7375. [Google Scholar] [CrossRef]
  14. Sauty, J.P.; Gringarten, A.C.; Fabris, H.; Thiery, D.; Menjoz, A.; Landel, P.A. Landel Sensible Energy Storage in Aquifers: 2. Field Experiments and Comparison with Theoretical Results. Water Resour. Res. 1982, 18, 253–265. [Google Scholar] [CrossRef]
  15. Russo, S.L.; Taddia, G.; Verda, V. Development of the Thermally Affected Zone (TAZ) around a Groundwater Heat Pump (GWHP) System: A Sensitivity Analysis. Geothermics 2012, 43, 66–74. [Google Scholar] [CrossRef]
  16. Li, C.; Cleall, P.J.; Mao, J.; Muñoz-Criollo, J.J. Numerical Simulation of Ground Source Heat Pump Systems Considering Unsaturated Soil Properties and Groundwater Flow. Appl. Therm. Eng. 2018, 139, 307–316. [Google Scholar] [CrossRef]
  17. Luo, Z.; Du, J. Heat exchange scheme simulation optimization for ground source heat pump system with buried pipes by thermal equilibrium analysis. Trans. Chin. Soc. Agric. Eng. (Trans. CSAE) 2018, 34, 246–254. [Google Scholar] [CrossRef]
  18. Long, X.T.; Yuan, R.Q.; Pi, J.G.; Sun, X.L.; Liu, C.M. Survey and Evaluation of Shallow Geothermal Energy in Changsha. J. Nat. Resour. 2016, 31, 163–176. [Google Scholar] [CrossRef]
  19. Wu, X.; Liu, W.; Lu, Z.; Liang, P.; Jin, G. Simulation on temperature variation characteristics of soil around buried pipe in process of heat storage and release. Trans. Chin. Soc. Agric. Eng. (Trans. CSAE) 2017, 33, 204–213. [Google Scholar] [CrossRef]
  20. Han, C.; Yu, X. Sensitivity Analysis of a Vertical Geothermal Heat Pump System. Appl. Energy 2016, 170, 148–160. [Google Scholar] [CrossRef]
  21. Hałaj, E.; Pająk, L.; Papiernik, B. Finite Element Modeling of Geothermal Source of Heat Pump in Long-Term Operation. Energies 2020, 13, 1341. [Google Scholar] [CrossRef]
  22. You, T.; Wu, W.; Shi, W.; Wang, B.; Li, X. An Overview of the Problems and Solutions of Soil Thermal Imbalance of Ground-Coupled Heat Pumps in Cold Regions. Appl. Energy 2016, 177, 515–536. [Google Scholar] [CrossRef]
  23. Long, T.; Chen, G.; Hu, C.; Wang, B. Research on Hydro-thermal Coupling of the Borehole Heat Exchangers. Saf. Environ. Eng. 2015, 22, 16–21+27. [Google Scholar] [CrossRef]
  24. Li, H.; Nagano, K.; Lai, Y.; Shibata, K.; Fujii, H. Evaluating the Performance of a Large Borehole Ground Source Heat Pump for Greenhouses in Northern Japan. Energy 2013, 63, 387–399. [Google Scholar] [CrossRef]
  25. Kaneko, S.; Tomigashi, A.; Ishihara, T.; Shrestha, G.; Yoshioka, M.; Uchida, Y. Proposal for a Method Predicting Suitable Areas for Installation of Ground-Source Heat Pump Systems Based on Response Surface Methodology. Energies 2020, 13, 1872. [Google Scholar] [CrossRef]
  26. Shang, S.; Liu, J.; Liu, B.; Ji, M.; Li, L. Ground-Coupled Group Heat Exchanger Factors Affecting Temperature Simulation. J. Shenyang Jianzhu Univ. 2018, 34, 566–576. [Google Scholar] [CrossRef]
  27. Ning, H.; Hu, C.; Chen, G.; Long, T. Analysis and Simulation of Heat Transfer Performance of Buried Pipe Banks Under Artificial Flow Field: Taking an Area in Fujian Province as an Example. Geol. Sci. Technol. Inf. 2018, 37, 239–245. [Google Scholar] [CrossRef]
  28. Tsuya, S.; Fujii, H.; Kosukegawa, H.; Yamashita, K.; Bina, S.M. Effect of Pumping Well Operation on Borehole Heat Exchangers. Geothermics 2022, 105, 102536. [Google Scholar] [CrossRef]
  29. Bina, S.M.; Fujii, H.; Kosukegawa, H.; Katsuragi, M. Evaluation of Groundwater Pumping Impact on the Thermal Conductivity of Neighboring Ground Source Heat Exchangers. Geothermics 2023, 108, 102618. [Google Scholar] [CrossRef]
  30. Li, Y.; Shu, L.; Xiao, R.; Niu, S.; Tao, Y.; Ling, Z. How Groundwater Flow Field Change Affects Heat Transfer in Groundwater Heat Pumps Based on Physical Experiments. Energy Build. 2023, 282, 112804. [Google Scholar] [CrossRef]
  31. Li, J. Three-Dimensional Numerical Modeling of Thermal Groundwater in the Bedrock Resenvior in the Dongli Lake Area near Tianjin. Master’s Thesis, China University of Geosciences, Beijing, China, 2015. [Google Scholar]
  32. Duan, Z.; Pang, Z.; Wang, X. Sustainability Evaluation of Limestone Geothermal Reservoirs with Extended Production Histories in Beijing and Tianjin, China. Geothermics 2011, 40, 125–135. [Google Scholar] [CrossRef]
  33. Diersch, H.-J.G.; Bauer, D.; Heidemann, W.; Rühaak, W.; Schätzl, P. Finite Element Modeling of Borehole Heat Exchanger Systems: Part 2. Numerical Simulation. Comput. Geosci. 2011, 37, 1136–1147. [Google Scholar] [CrossRef]
  34. Zeng, Z.; Lü, H.; Zhao, Y.; Ge, R. Numerical simulation of Effect of Groundwater Seepage on Vertically Buried Tubular Heat Exchanger. Acta Energiae Solaris Sin. 2015, 36, 3007–3014. [Google Scholar]
  35. Peng, T.; Sun, T.; Wang, B.; Li, Y.; Zhao, J. The energy efficiency enhancement technique of soil source heat pump system through groundwater artificial flow field. Hydrogeol. Eng. Geol. 2017, 44, 169–174. [Google Scholar] [CrossRef]
  36. Yang, P.; Chen, J.; Chen, J.; Li, M. Simulation and analysis of heat transfer performance of double U-tube ground heat exchangers. J. Cent. South Univ. 2021, 52, 1733–1738. [Google Scholar] [CrossRef]
Figure 1. Layout of (a) overall layout and geotemperature monitoring holes (b) outside and (c) inside the heat exchange area.
Energies 16 06895 g001
Figure 2. Temperature profiles for the geotemperature background value.
Energies 16 06895 g002
Figure 3. The 3D and 2D views of the numerical model. (a) Planar subdivision, (b) regular subdivision of borehole, and (c) thermal properties partition of the model.
Energies 16 06895 g003
Figure 4. The fitting results of simulated temperature and measured temperature at different depths of four boreholes.
Energies 16 06895 g004
Figure 5. Geotemperature distribution of intermittent operation in (a) 20 days, (b) 90 days, (c) 150 days, (d) 270 days, and (e) 365 days.
Energies 16 06895 g005
Figure 6. Geotemperature duration curve of intermittent operation during the year.
Energies 16 06895 g006
Figure 7. GTFs of intermittent operation in (a) one year, (b) ten years, (c) twenty years, and (d) thirty years. GTF, geotemperature fluctuation.
Energies 16 06895 g007
Figure 8. Geotemperature duration curve of intermittent operation for 30 years.
Energies 16 06895 g008
Figure 9. The GTFs after 10 years under different operating parameters. (a) Original scheme, (b) change power, and (c) change period. GTF, geotemperature fluctuation.
Energies 16 06895 g009
Figure 10. The area of GTFs in original scheme, change power, and change period for 10 years of operation. GTF, geotemperature fluctuation.
Energies 16 06895 g010
Figure 11. Layout of the borehole heat exchangers in (a) three categories, (b) two categories, and (c) cross-layout.
Energies 16 06895 g011
Figure 12. The GTFs after 10 years under (a) original scheme, (b) three categories, (c) two categories, and (d) cross-layout. GTF, geotemperature fluctuation.
Energies 16 06895 g012
Figure 13. The area of GTFs in original and cross-layout schemes for 10 years of operation. GTF, geotemperature fluctuation.
Energies 16 06895 g013
Figure 14. The GTFs after 10 years under (a) original scheme, (b) scheme 1, and (c) scheme 2. GTF, geotemperature fluctuation.
Energies 16 06895 g014
Figure 15. The area of GTFs in original scheme, scheme 1, and scheme 2 for 10 years of operation. GTF, geotemperature fluctuation.
Energies 16 06895 g015
Table 1. Rock-soil body thermal properties.
Soil Sample TypeSample SizeSoil Water ContentDry Unit Weight Thermal Conductivity Specific Heat Capacity
(%)(kN/m3)(W/m·K)(kJ/kg·K)
Loess11 16.7 ~ 22.4 18.65 15.2 17.3 16.53 1.04 1.68 1.40 1.11 1.43 1.32
Silty clay10 16.5 20.3 17.72 16 17.2 16.74 1.20 1 . 51 1.37 1.16 1.42 1.34
Silty soil8 17.4 22.1 18.70 14.2 16.9 16.30 1.05 1.56 1.34 1.13 1.40 1.29
Paleosoil2 16.5 16.8 16.65 17 17.3 17.15 1.19 1.38 1.29 13.2 1.43 1.38
Coarse sand1 20.1 ~ 20.1 20.1 16 ~ 16 16 1.13 ~ 1.13 1.13 1.46 ~ 1.46 1.46
Note: In a b c , a is the minimum value, b is the maximum value, and c is the mean value.
Table 2. Hydrogeological and thermal properties of the numerical model.
LithologyHydraulic Conductivity (m/d)PorosityVolumetric Heat Capacity
MJ/(m3·K)
Thermal Conductivity
W/(m·K)
HorizontalVertical
Loess0.200.250.372.441.70
Loess with paleosoil0.150.200.382.901.65
Silty clay0.050.0050.392.981.67
Silty soil0.500.050.362.901.64
Silty soil with silty clay0.100.010.372.851.65
Table 3. Borehole heat exchanger parameters.
ParametersValue
LoadSummer, 4968 kW·h; winter, 5558.4 kW·h
Flow rate120 m3/d
Borehole depth150 m
Diameter0.15 m
Backfill materials’ thermal conductivity1 W/(m·K)
Circulating fluid’s thermal conductivity0.48 W/(m·K)
Disclaimer/Publisher’s Note: The statements, opinions and data contained in all publications are solely those of the individual author(s) and contributor(s) and not of MDPI and/or the editor(s). MDPI and/or the editor(s) disclaim responsibility for any injury to people or property resulting from any ideas, methods, instructions or products referred to in the content.

