Article

Long-Term Pore-Scale Experiments on MEOR by Surfactant-Producing Microorganisms Reveal the Altering Dominant Mechanisms of Oil Recovery

School of Civil and Resources Engineering, University of Science and Technology Beijing, Beijing 100083, China
*
Author to whom correspondence should be addressed.
Energies 2023, 16(19), 6854; https://doi.org/10.3390/en16196854
Submission received: 29 August 2023 / Revised: 17 September 2023 / Accepted: 22 September 2023 / Published: 27 September 2023
(This article belongs to the Section H: Geo-Energy)

Abstract

:
During microbial-enhanced oil recovery (MEOR), surfactant-producing microorganisms are reported to improve displacement efficiency. However, the sweep efficiency could be improved by emulsified droplets or be reduced by low-IFT (interfacial tension)-induced fingering flow. Therefore, whether sweep efficiency can be improved by surfactant-producing microorganisms is currently unclear. To reveal the EOR mechanisms by surfactant-producing microorganisms, a 2D micro-model was used to conduct a long-term pore-scale experiment. In the results, 19.4% of the original oil in place (OOIP) was recovered, and surfactant-producing microorganisms can improve not only displacement efficiency (16.9% of the OOIP in the main stream) but also sweep efficiency (27.7% of the OOIP in the margin). Furthermore, the sweep efficiency was improved during flooding and shut-in periods. For instance, 19.5% of the OOIP in margins migrated to the main stream during the 1st shut-in period. Regarding mechanisms of sweep, it was improved by Jamin’s effect during the flooding period, while during the shut-in period, the oil migration was attributed to the spontaneously spreading biomass and their wettability altering the biosurfactant. This long-term experiment revealed that the dominant oil recovery mechanisms were altering with declining oil saturation, based on which sweep efficiency contributed to oil recovery only at oil saturation higher than 40.5%. While at lower oil saturation, only displacement efficiency could be improved.

1. Introduction

The oil recovery of petroleum reservoirs depends on both the sweep efficiency and displacement efficiency [1]. In microbial-enhanced oil recovery (MEOR), biomass and microbial products such as biosurfactants, biopolymers, acids, gases and solvents had the ability to recover the residual oil [2]. Biopolymers and biomass were generally used to improve the sweep efficiency by plugging high-permeability zones to redirect the flood of water to oil-rich channels [3]. Acids and solvents were used to dissolve the carbonate rock for better permeability and porosity [4]. Biosurfactants were used to reduce the oil–water interfacial tension (IFT) [5], alter rock wettability [6] and emulsify crude oil [7], and surfactant-producing microorganisms were generally considered to improve the displacement efficiency [8]. Regarding the sweep efficiency, it can be improved by Jamin’s effect caused by the emulsified oil droplets [9]. Meanwhile, the sweep efficiency can be reduced by the fingering phenomenon caused by low IFT (less than 0.01 mN/m) in the main stream [10]. Therefore, whether surfactant-producing microorganisms can improve the sweep efficiency is currently unclear.
Since the sweep efficiency is important to the oil recovery, it is necessary to clarify whether the effect of surfactant-producing microorganisms on the sweep efficiency is positive or negative. In the previous studies, biogas produced by surfactant-producing microorganisms blocked the large pores in core and increased the flow resistance (Jamin’s effect), which drove the fluid to displace the residual oil in small pores and improved the sweep efficiency [11]. It was also reported that the emulsification led by the biosurfactant can increase the viscosity of water and alter the oil–water mobility ratio, which enlarged the sweep area [12]. Furthermore, microorganisms grew in the reservoirs to form biofilms, which can aid in sweep efficiency by the selective plugging of oil-less zones [13]. However, in these studies, the improvement of sweep efficiency was only inferred by the phenomenon of the residual oil’s reduction, and no evidence were provided to directly prove the sweep efficiency improvement.
A 2D micro-model has been used in the studies of MEOR. The model can exhibit the pore-scale flow field and the distribution of the residual oil, based on which the EOR mechanisms dominating the oil recovery can be revealed. For instance, it was revealed by the model that the biosurfactant emulsified the residual oil, and the sweep efficiency was improved (29.5% of the OOIP was recovered) based on bridging and Jamin’s effect of oil droplets [14]. It was also indicated by the model that the loss of polymer’s shear resistance under high salinity caused breaching in the main stream and plugging in the margin, which resulted in the decline of sweep efficiency (oil recovery was 5% of that under low salinity) [15]. Referring to previous studies, this 2D micro-model can be applied to study the possibility of improving the sweep efficiency.
In order to completely reveal the EOR mechanisms by surfactant-producing microorganisms and especially the mechanisms regarding the sweep efficiency, in this study, a 2D micro-model mimicking a real pore structure was used to carry out a long-term (155 days) multi-round MEOR experiment. Six flooding periods and four shut-in periods were involved in the experiment. The biomass was recorded to exhibit the growth of the microorganisms. After each period, the total and divisional (margin and the main stream) oil saturation in the model were quantified, respectively, to reveal the change of oil saturation during the long-term experiment. Furthermore, the distribution and morphology of residual oil were observed and analyzed during both flooding and shut-in periods to study the EOR mechanisms. The results in this study can provide reference for the field applications on the introduction timing and optimization in MEOR process.

2. Materials and Methods

2.1. Materials

The simulated oil (viscosity of 50 mPa·s at 40 °C) used in the experiments was a mixture of kerosene and crude oil from Shengli Oilfield (Shandong, China). The simulated formation water used in the experiments consisted of NaCl (6 g/L), NaHCO3 (0.8 g/L), CaCl2 (0.2 g/L), MgCl2 (0.5 g/L) and KCl (1 g/L), with a salinity of 8284 mg/L [16].
The components of the BS medium were as follows: glucose (30 g/L), (NH4)2SO4 (1 g/L), KH2PO4·H2O (3 g/L), K2HPO4·3H2O (7 g/L), MgSO4·7H2O (0.1 g/L), and sodium citrate (0.5 g/L) [17]. The pH of the BS medium was 7.0. After preparation, the BS medium was sterilized at 120 °C for 20 min.

2.2. Microorganisms Cultivation

The strain TH used in the experiments was isolated from the produced water in the Shengli Oilfield. TH has been sequenced as Bacillus subtilis, which metabolizes to produce lipopeptide surfactants [18]. The TH stored on the inclined plane was inoculated in a BS medium in a flask, and the culture was cultivated at 40 °C with 180 rpm for 48 h. Afterwards, the biomass was centrifuged and washed with sterile water, after which it was suspended in fresh BS medium to 1.4 × 10⁸ cells/mL. The mixture of the biomass and BS medium was AB culture.

2.3. Micro-Flooding Device
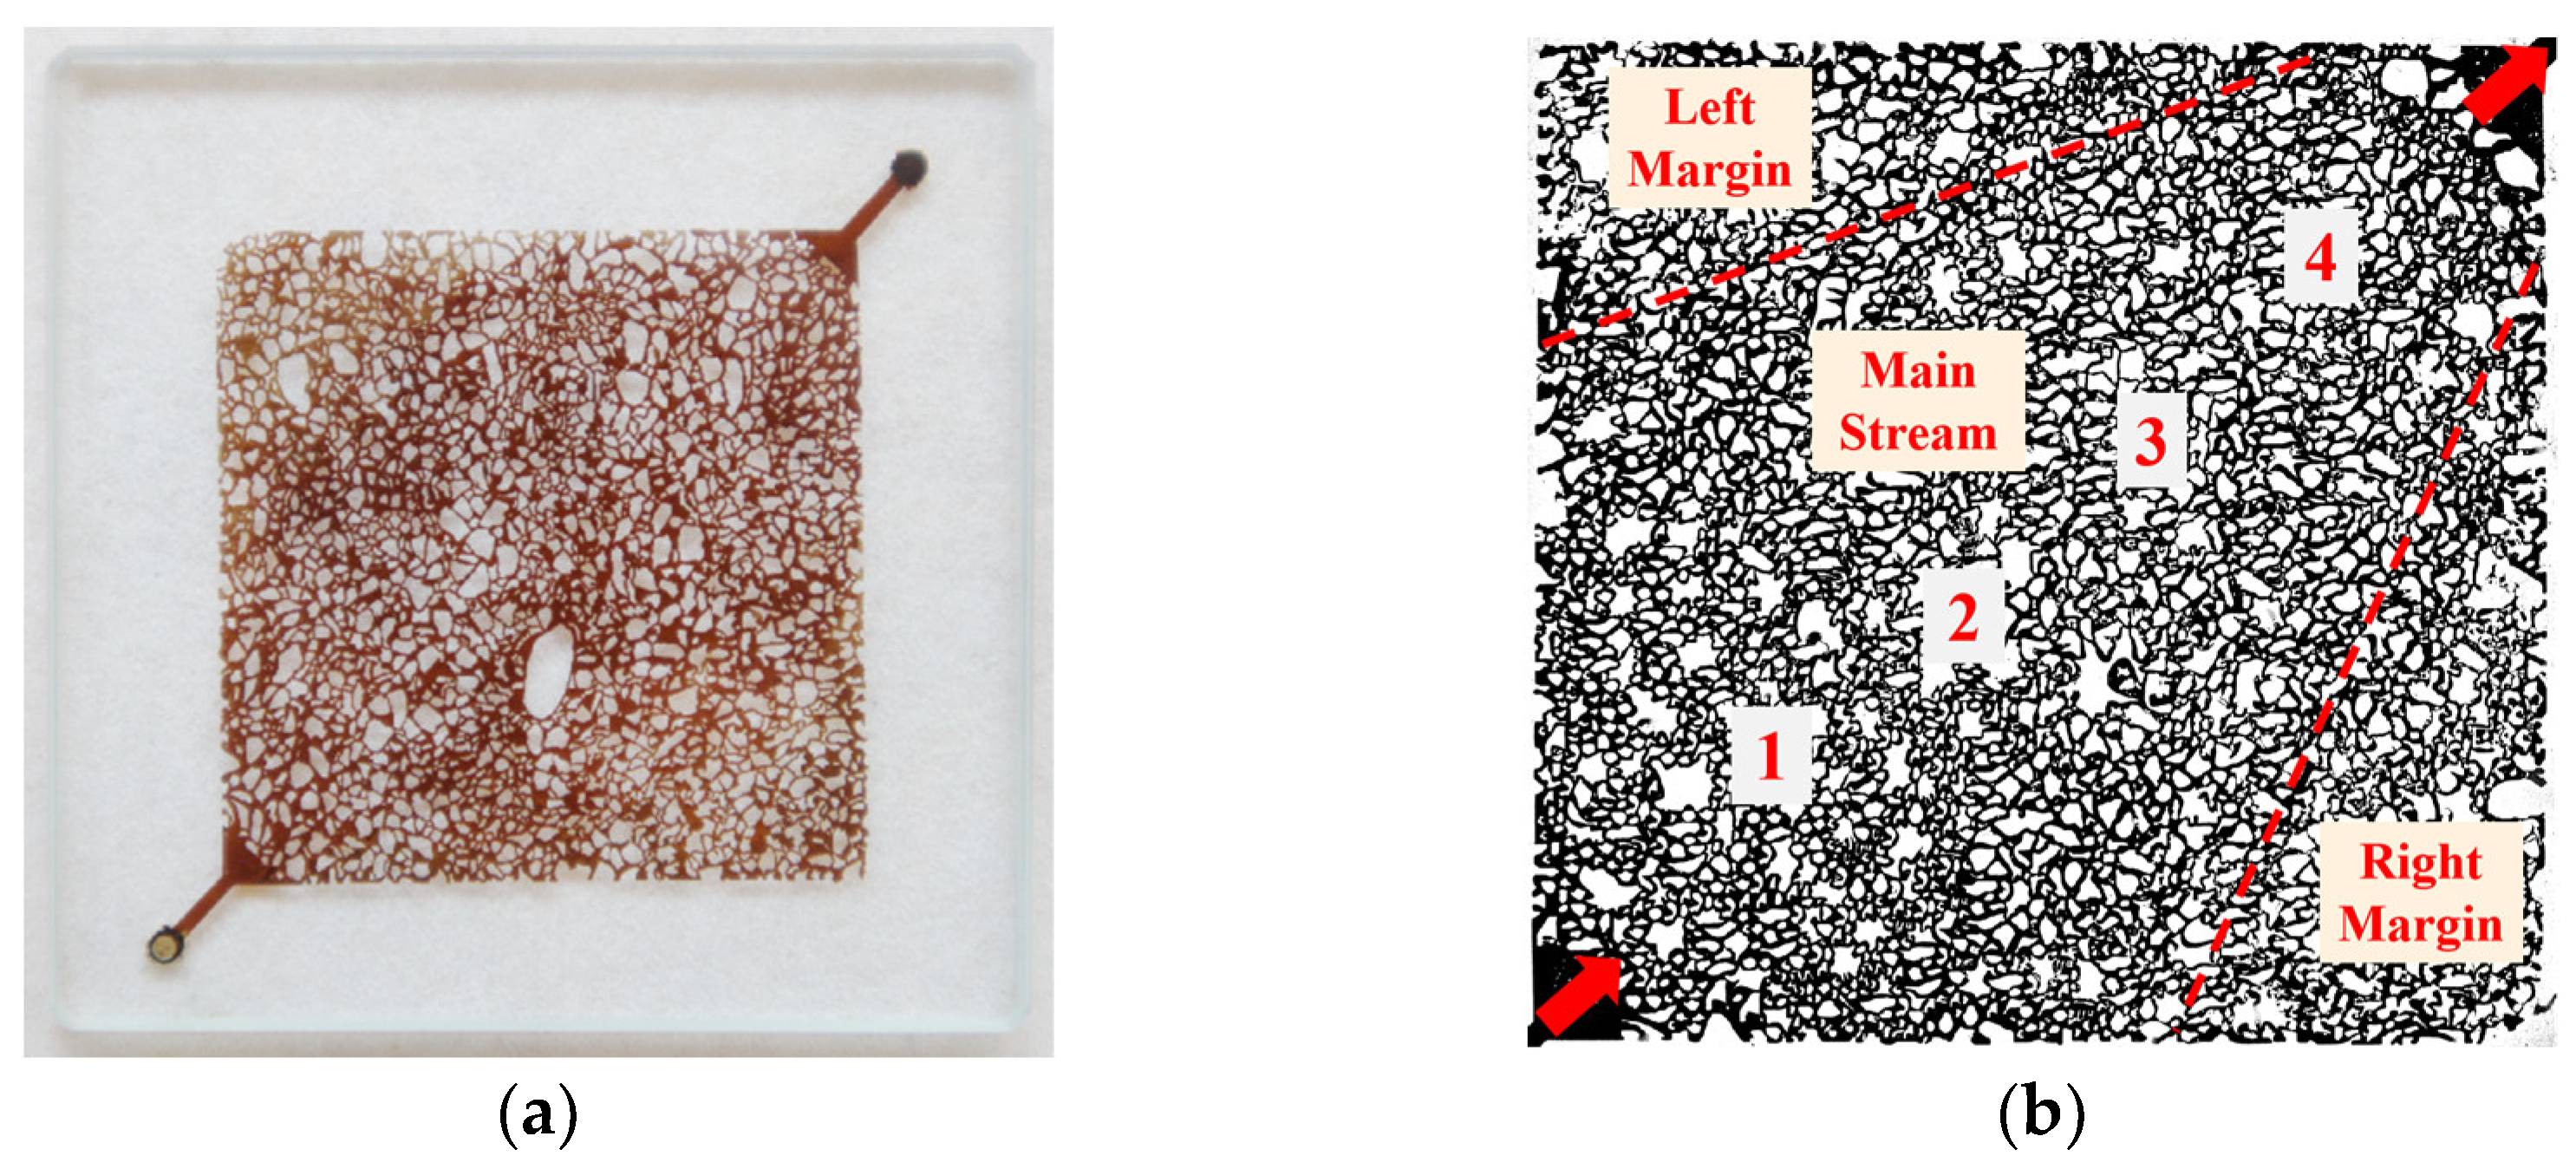
The micro-flooding device (Figure 1) was composed of two primary systems: a flooding system and an image-capturing system. The flooding system mainly included a syringe pump (Shimadzu, Japan), accumulators and a model holder. The image-capturing system mainly included a microscope (View Solutions, Rancho Cucamonga, CA, USA), CCD camera (Basler, Ahrensburg, Germany) and computer.

2.4. Micro-Model

As the heart of the micro-flooding device, the micro-model (Figure 2a) used a transparent two-dimensional plane made of optical glass. The fabrication process was as follows. Firstly, the magnified pore system of a core thin-section from Shengli Oilfield was precisely photolithographed onto the glass; secondly, the glass coated with photosensitive material was exposed; thirdly, the exposed glass was treated with hydrofluoric acid and then sintered.
The micro-model had visibility, based on which the residual oil and biomass in pores can be directly observed. It also had the ability to simulate the reservoir geometry based on its real pore structure of the natural core from Shengli Oilfield.
The micro-model (Figure 2b) can be divided into a main stream and left and right margin, and two small holes were drilled at the opposite two corners to simulate the injection well and the production well. The two red arrows in the model (Figure 2b) indicated that the liquid flowed in from the left hole and out through the right hole. The size of the micro-model was 6.5 cm × 6.5 cm, and the pore area was 4.0 cm × 4.0 cm. The pore diameter, pore volume and the porosity were 20–100 μm, 27 μL and 42.5%, respectively. Four typical regions (Figure 2b) in the model were selected for the observation of the distribution and morphology of residual oil during the injections.

2.5. Micro-Flooding Experiment

During the experiment lasting 155 days, the micro-model was firstly saturated with 2.0 pore volumes (PVs) of simulated oil, after which it was aged for 10 days in an incubator at 80 °C. Afterwards, the micro-model was fixed in the model holder for the connection of the flooding pipeline, and several key areas were selected in the main stream and margin for observation.
There were six rounds including water flooding, four injections and post-water flooding. Formation water was injected as the water flooding and the post-water flooding, and the injections were stopped when the water cut at the outlet reached 98%. As for the four injections, 3.0 PVs of AB culture including both biomass and nutrition was injected as the 1st injection, while 3.0 PVs of BS medium including only nutrition was injected as the other three injections. The injection rate and temperature were 0.02 mL/min and 40 °C, respectively. During the water flooding, four injections and post-water flooding, the form and distribution of residual oil were observed and recorded.
The interval between each injection was the shut-in period. In order to study the growth of microorganisms in the pore system over a long time, combined with on-site MEOR experiments in Shengli Oilfield, four shut-in periods with different durations were selected in this experiment. The durations were 10 days, 87 days, 40 days and 16 days, respectively. During the shut-in periods, the micro-model was incubated in an incubator at 40 °C for regular observations.
This long-term experiment was repeated twice, and the consistent phenomena and data were integrated to summarize the EOR mechanisms by surfactant-producing microorganisms.

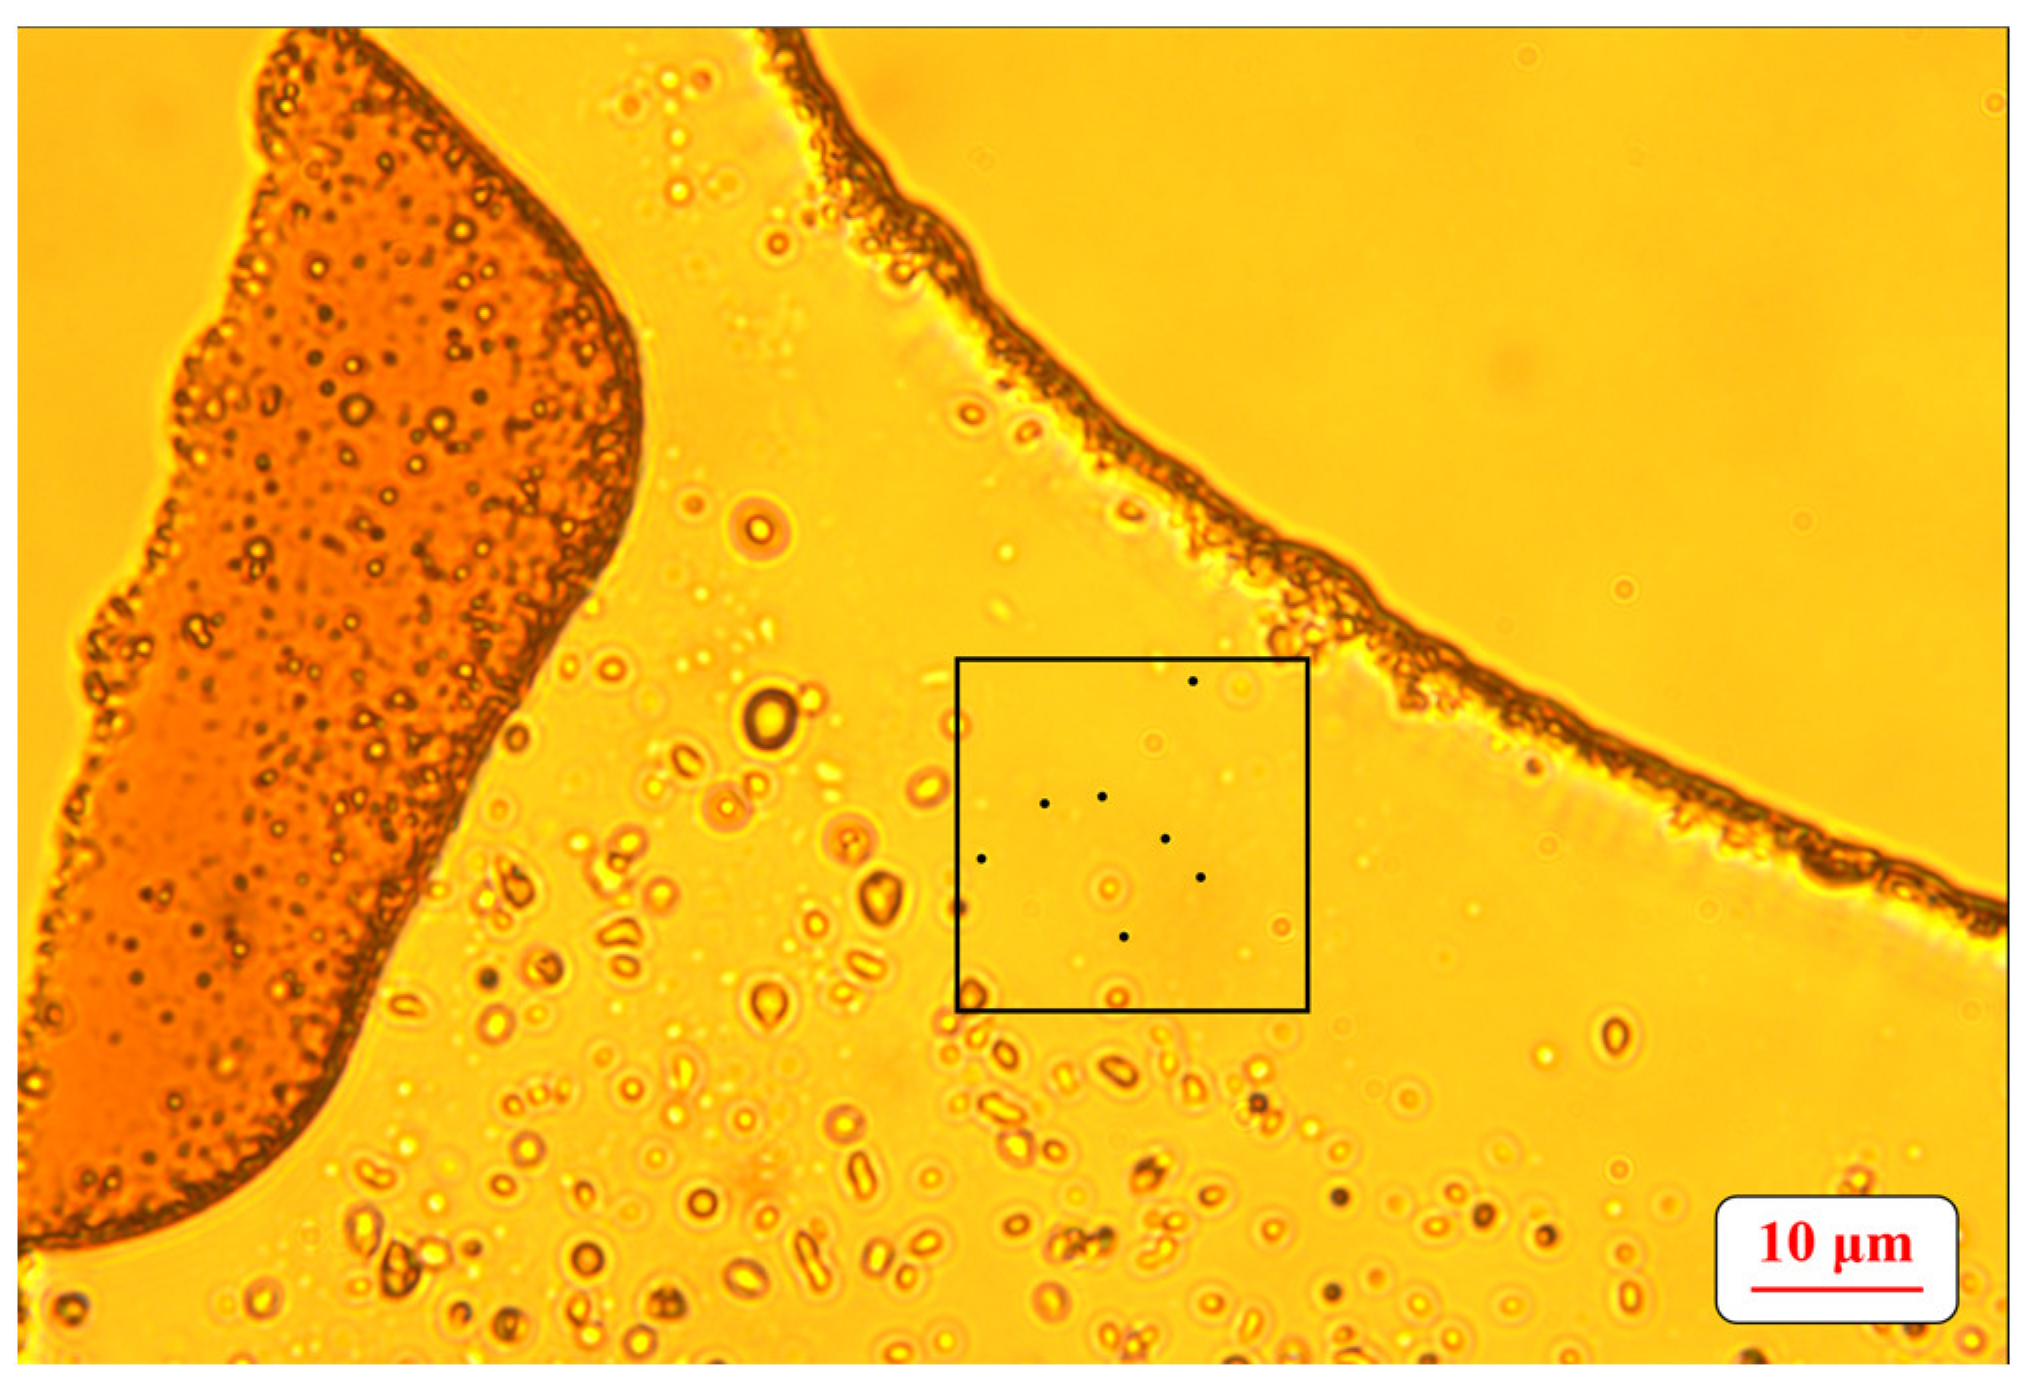
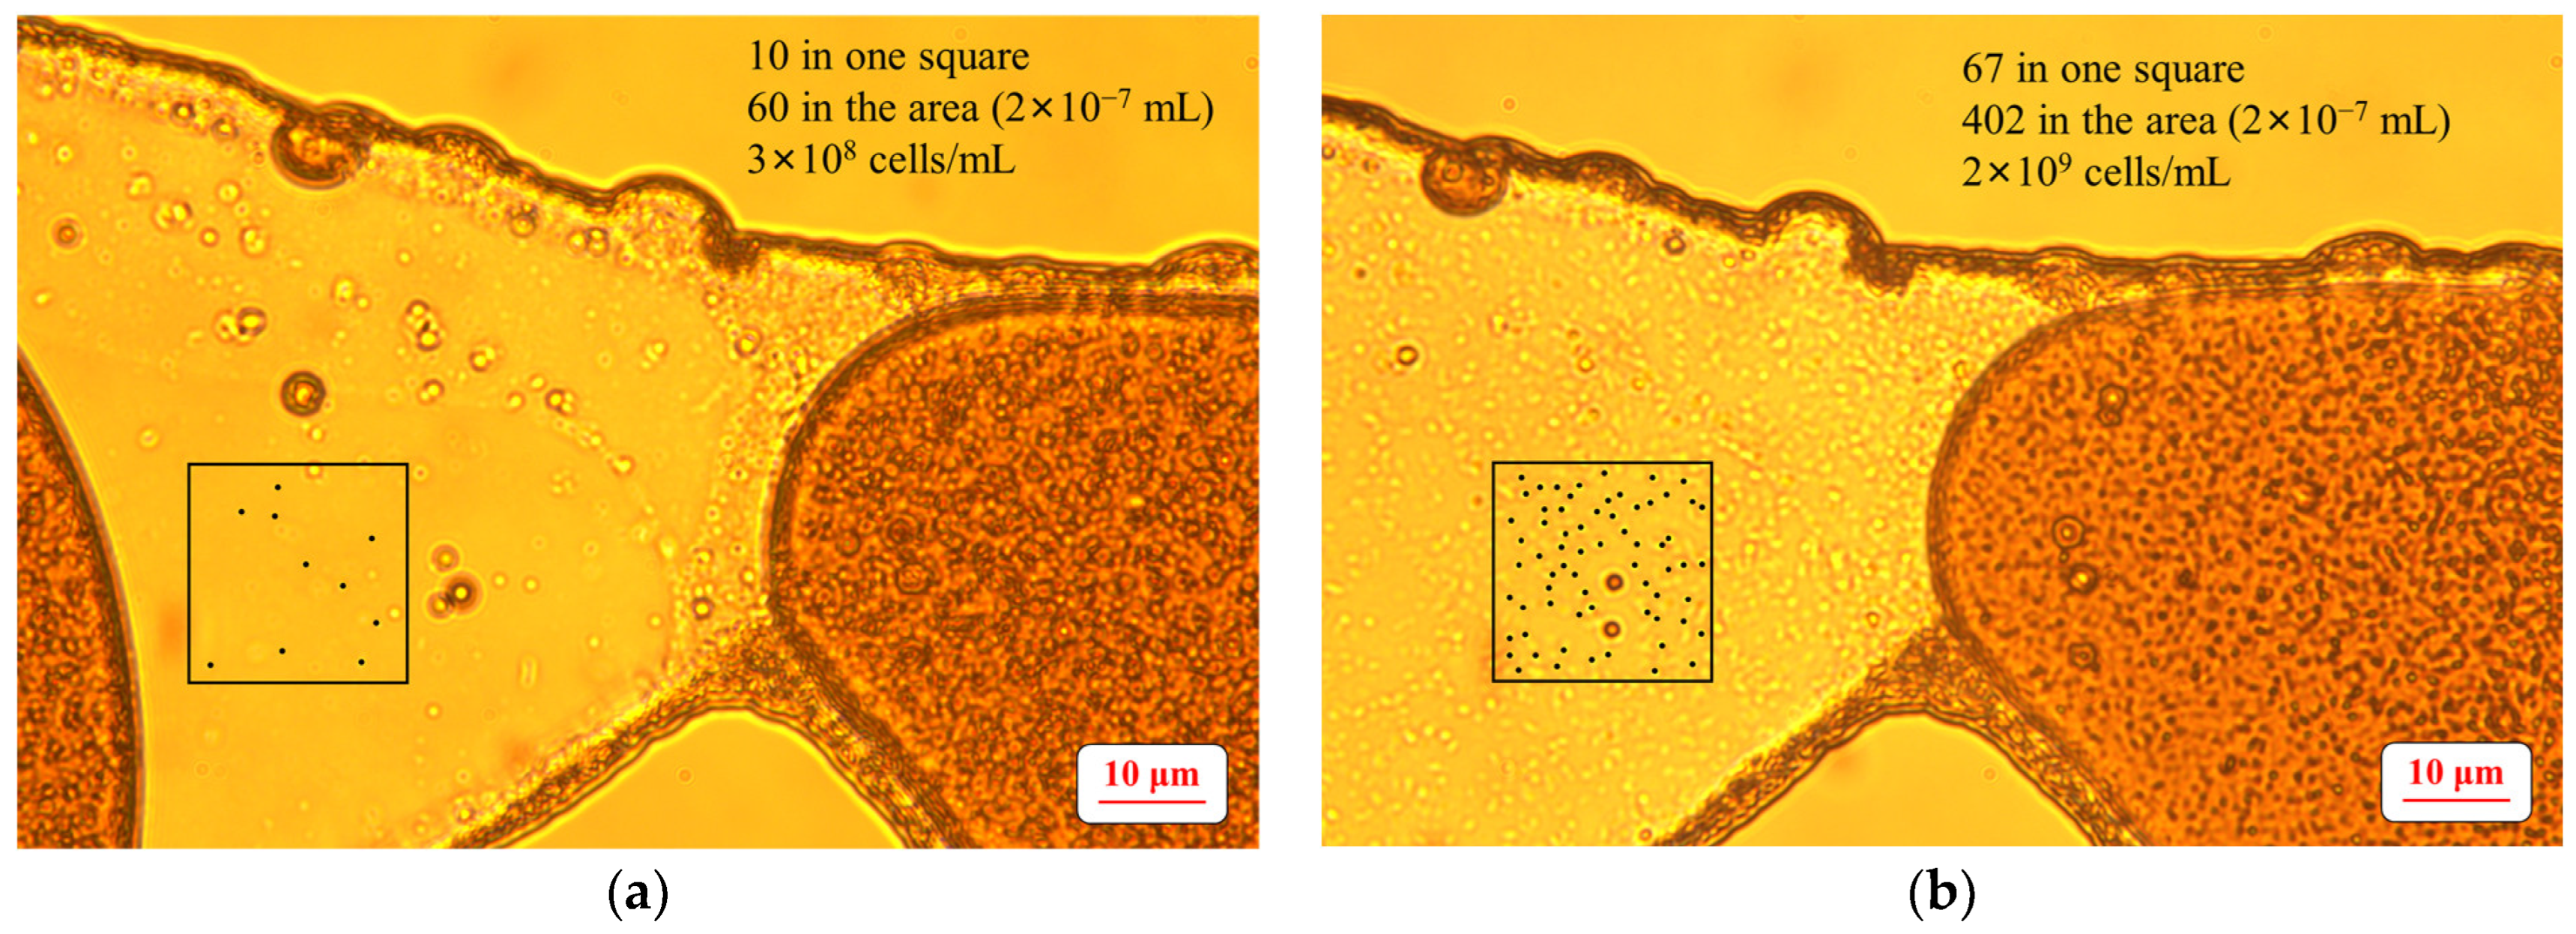
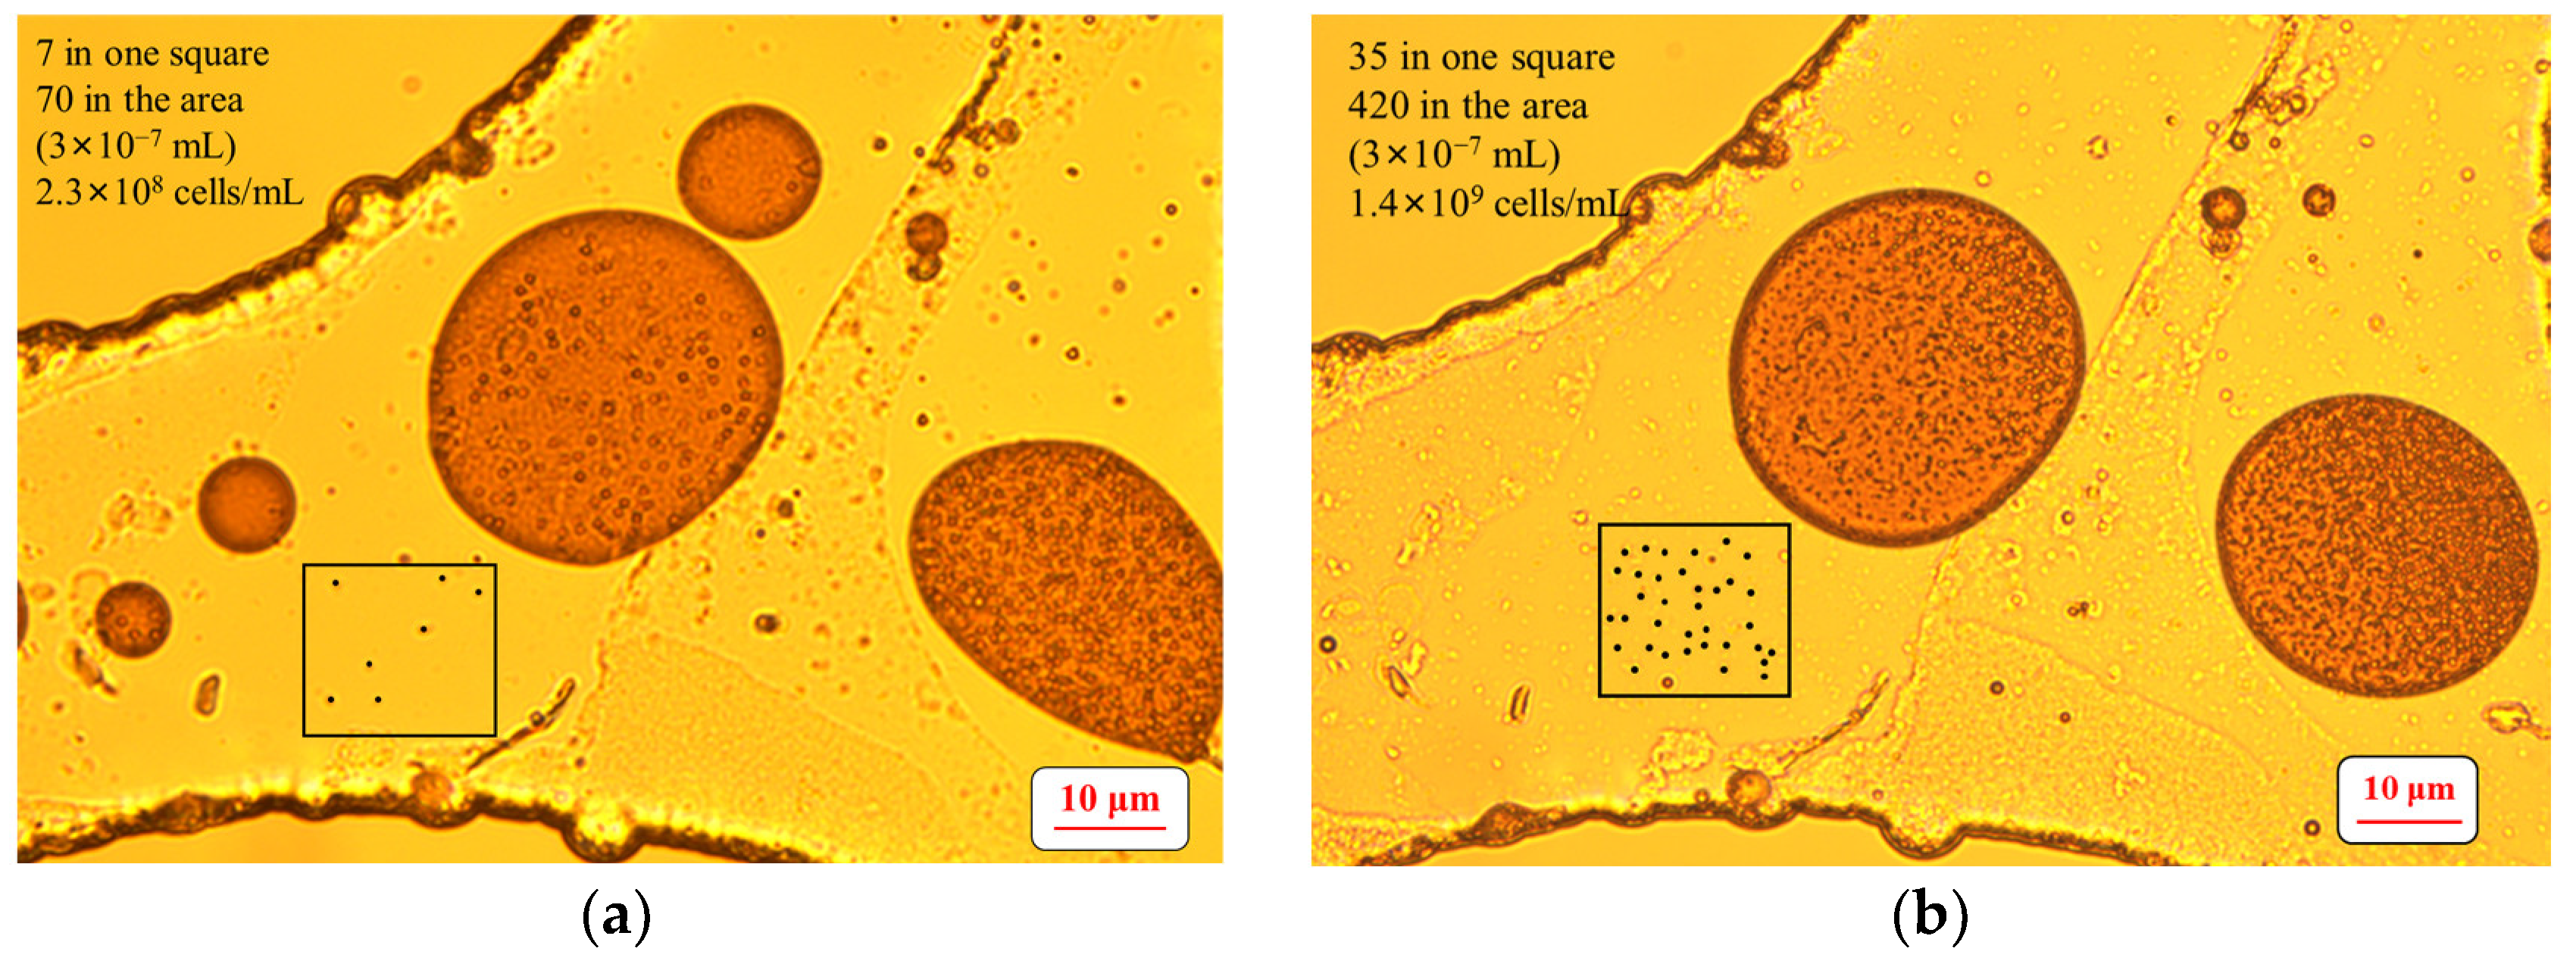
2.6. Determination of the Number of Microbial Cells

The number of cells in the model were counted based on the photos taken by the microscope during the shut-in periods, and the photo showed the existence of biomass in a rectangular area with a size of 90 × 120 μm. The depth of the pores in the model was 20 μm, all the cells in this area were considered to be evenly distributed on a 2D plane, and the overlapping of cells was ignored. The area was divided into multiple squares (the black box in Figure 3 is one of the squares), and the number of cells in the whole area can be calculated according to the number of cells in one square. For instance, in Figure 3, the number of cells in one square is 7, and the number of cells in the whole area (containing 6 squares) is 42. Therefore, the cell concentration in this area (volume of 2 × 10⁻⁷ mL) is 2.1 × 10⁸ cells/mL.
To reveal the growth of the surfactant-producing microorganisms in the main stream and margin, 40 areas of the above size were evenly selected in the main stream and margin, respectively. The average cell concentration of these 40 areas represented the cell concentration in the main stream or margin.

2.7. Determination of Oil Saturation in the Micro-Model

After each period (flooding and shut-in periods), the image of the model recorded by the microscope was binarized, and the percentage of black area in the image was read based on a MATLAB program to calculate the oil saturation. The oil saturation was calculated by the following:
S oi = N i N ,
where Soi is the oil saturation after each period; Ni is the number of black pixels in the binarized image after each period; and N is the number of black pixels in the binarized image saturated with simulated oil.

2.8. Measurement of the Contact Angle

According to the photos taken during the shut-in period, the contact angle was determined by measuring the angle between the oil film and the pore surface. The wettability (oil-wet or water-wet) of the pore surfaces in the micro-model can be determined based on the contact angle [19]. A total of 20 areas (80 × 90 μm) were evenly selected at the inlet, center and outlet of the main stream, respectively, and 40 areas (80 × 90 μm) were evenly selected in the margin. The contact angles between oil film and the pore surfaces in all the selected areas were measured after the water flooding and during different shut-in periods.

3. Results

3.1. Growth of the Surfactant-Producing Microorganisms

No biomass was observed after the water flooding. After the 1st injection, the distribution of biomass in the model was uneven, and the average biomass in the main stream (1.2 × 10⁸ cells/mL) was higher than that in the margin (9.3 × 10⁷ cells/mL). During the shut-in period, the biomass in the main stream (Figure 4) and margin (Figure 5) significantly increased, and after the 1st shut-in period, the average biomass in the main stream and margin increased to 1.5 × 10⁹ cells/mL and 1.1 × 10⁹ cells/mL, respectively.
In the subsequent periods, the average biomass of the two regions varied in the range of 1.3 × 10⁹ cells/mL to 1.6 × 10⁹ cells/mL and 9.8 × 10⁸ cells/mL to 1.2 × 10⁹ cells/mL, respectively.

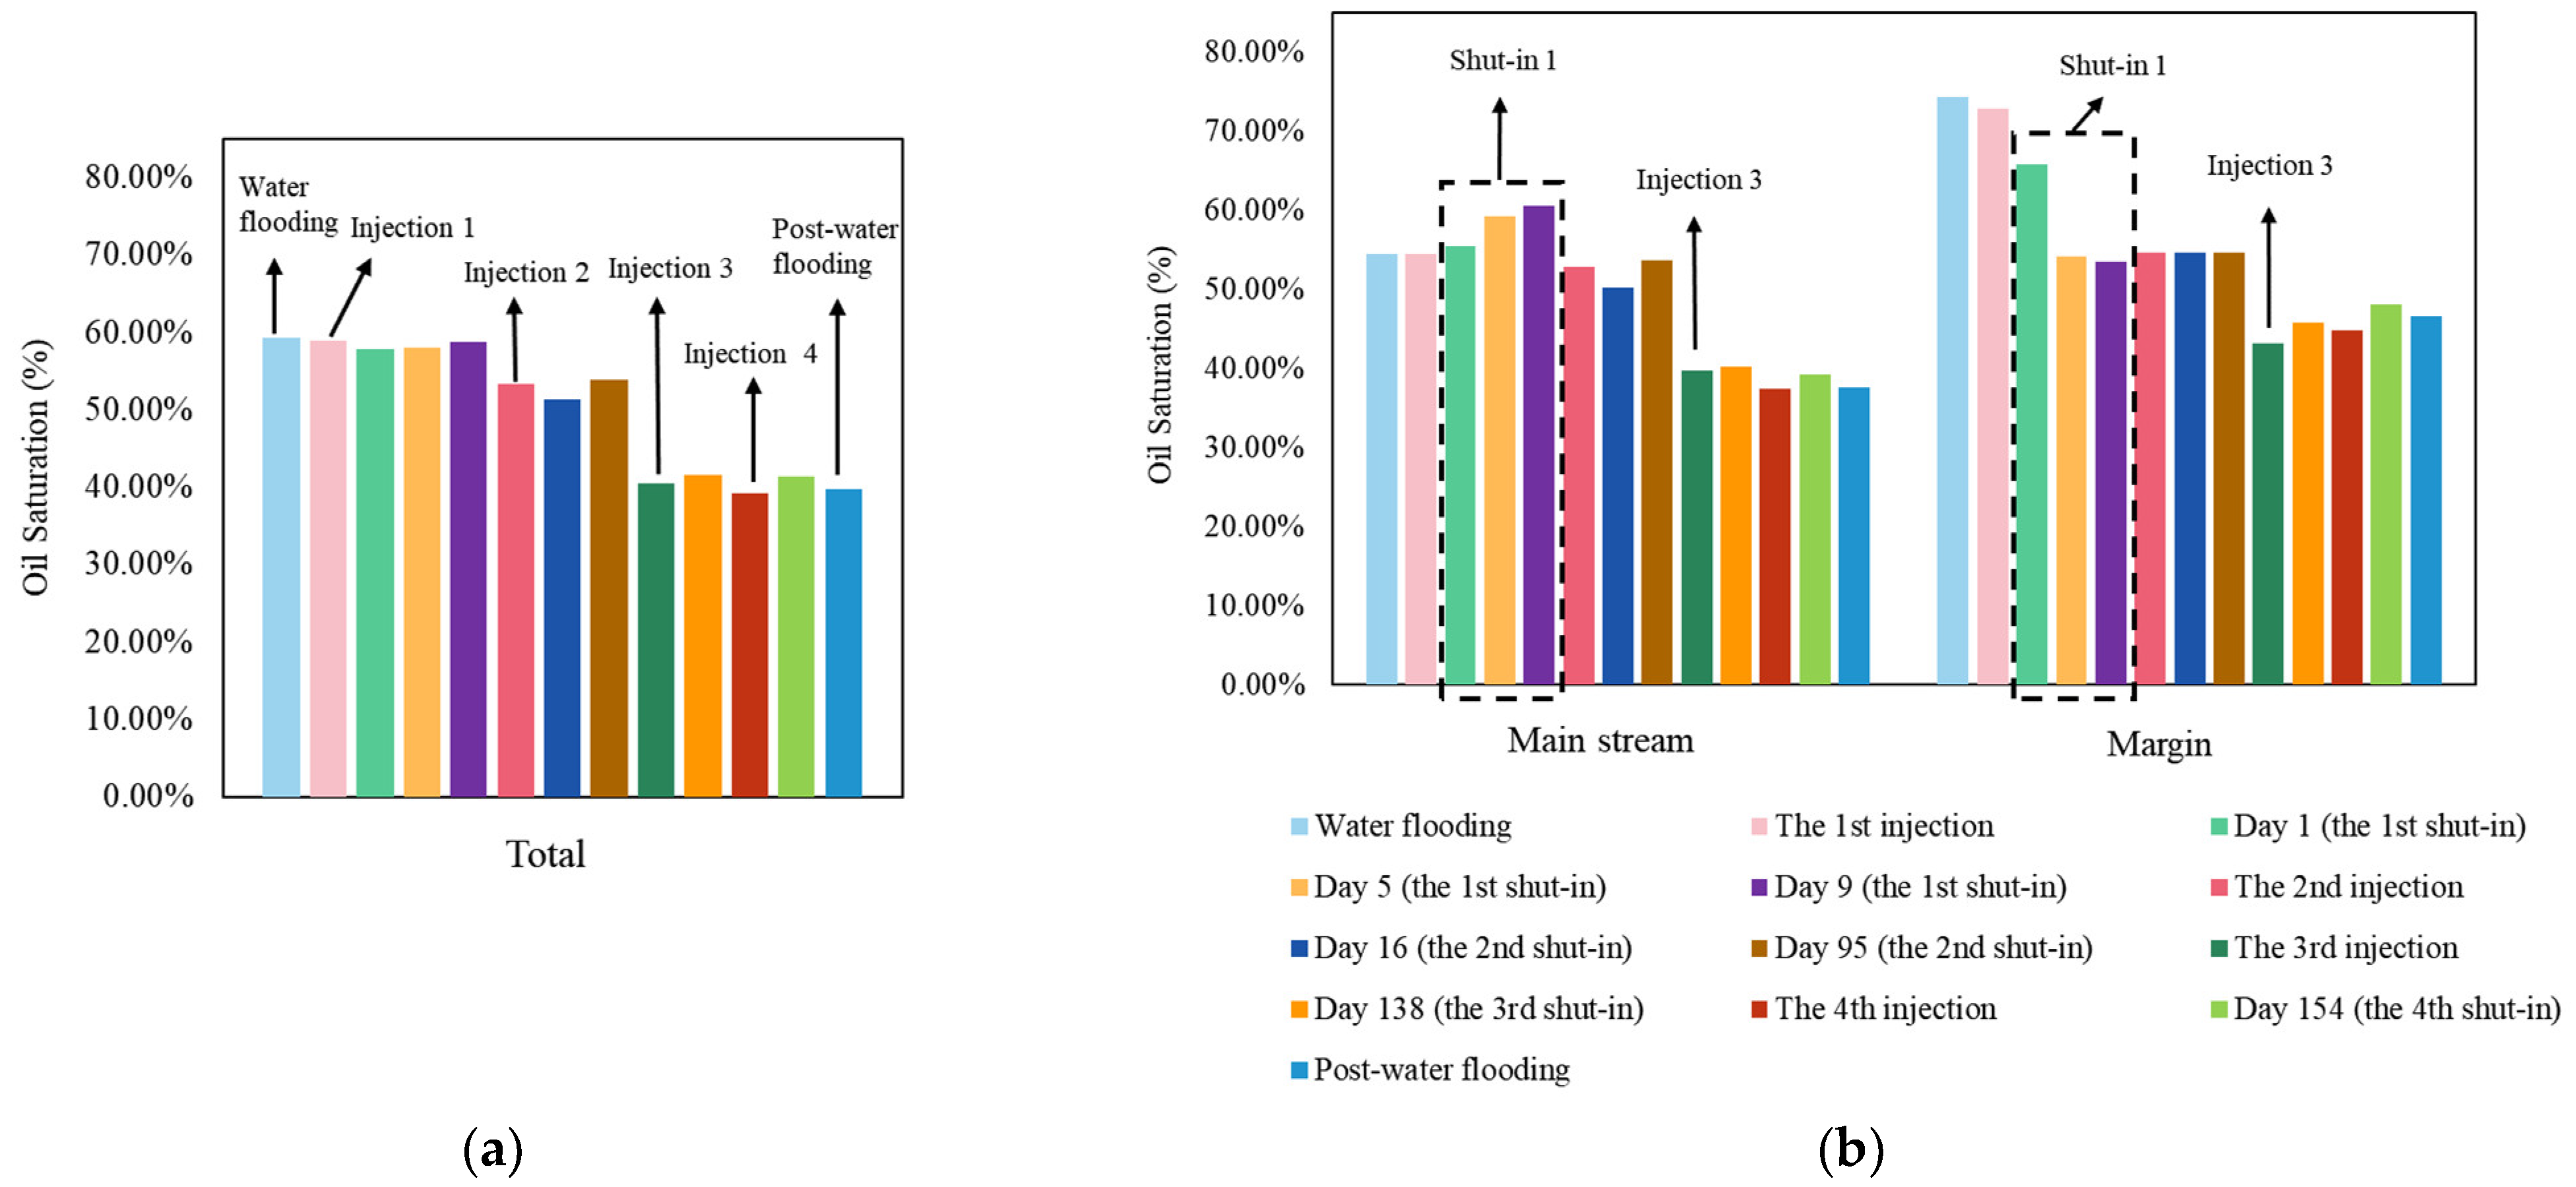
3.2. The Total and Divisional Oil Saturation after Each Stage by Surfactant-Producing Microorganisms

In the experiment, the total (Figure 6a) and divisional (Figure 6b) oil saturation after flooding and shut-in periods were calculated. During the shut-in periods, since no residual oil was produced, the total oil saturation (oil recovery) between each injection should be constant. However, it varied from 0.2% of the OOIP (original oil in place) to 1% of the OOIP due to the recording after the changes of residual oil distribution. After the long-term experiment, 19.4% of the OOIP was recovered in total by the surfactant-producing microorganisms.
After the water flooding, the total oil recovery was 40.8% of the OOIP.
After the 1st injection, the increase in the total recovery was only 0.3% of the OOIP. However, in the 1st shut-in period (from day 1 to day 9), the oil saturation increased from 54.5% to 60.5% in the main stream, while decreased from 72.9% to 53.4% in the margin. This dynamics of the oil saturation indicated the migration of residual oil from the margin to the main stream.
After the 2nd injection, the increases in total oil recovery and margin oil recovery were 5.7% of the OOIP and 18.3% of the OOIP, respectively, compared with the oil recovery after the 1st injection.
After the 3rd injection, the increases in total oil recovery and margin oil recovery were 12.7% of the OOIP and 11.5% of the OOIP, respectively, compared with the oil recovery after the 2nd injection.
After the subsequent 4th injection and the post-water flooding, only 0.7% of the OOIP was recovered in the total recovery compared with the 3rd injection.

3.3. Wettability Alteration on Pore Surface

After the water flooding, the pore surface was mainly oil-wet in the model, and 98% of contact angles in the model were larger than 90°. After the 1st injection, the pore surfaces in the margin became more water-wet (Figure 7). By the comparison of contact angles of oil films between day 1 and day 9 during the 1st shut-in period, the proportion of margin contact angles smaller than 90° increased from 4% to 91%. In the subsequent shut-in periods, the proportion increased from 91% to 96%.
From day 1 to day 9 during the 1st shut-in period, the increases in the proportion of main stream contact angles smaller than 90° at the inlet, center and outlet were 90%, 83%, and 77%, respectively (Table 1). This indicated that in the main stream, the pore surface close to the inlet was more water-wet.

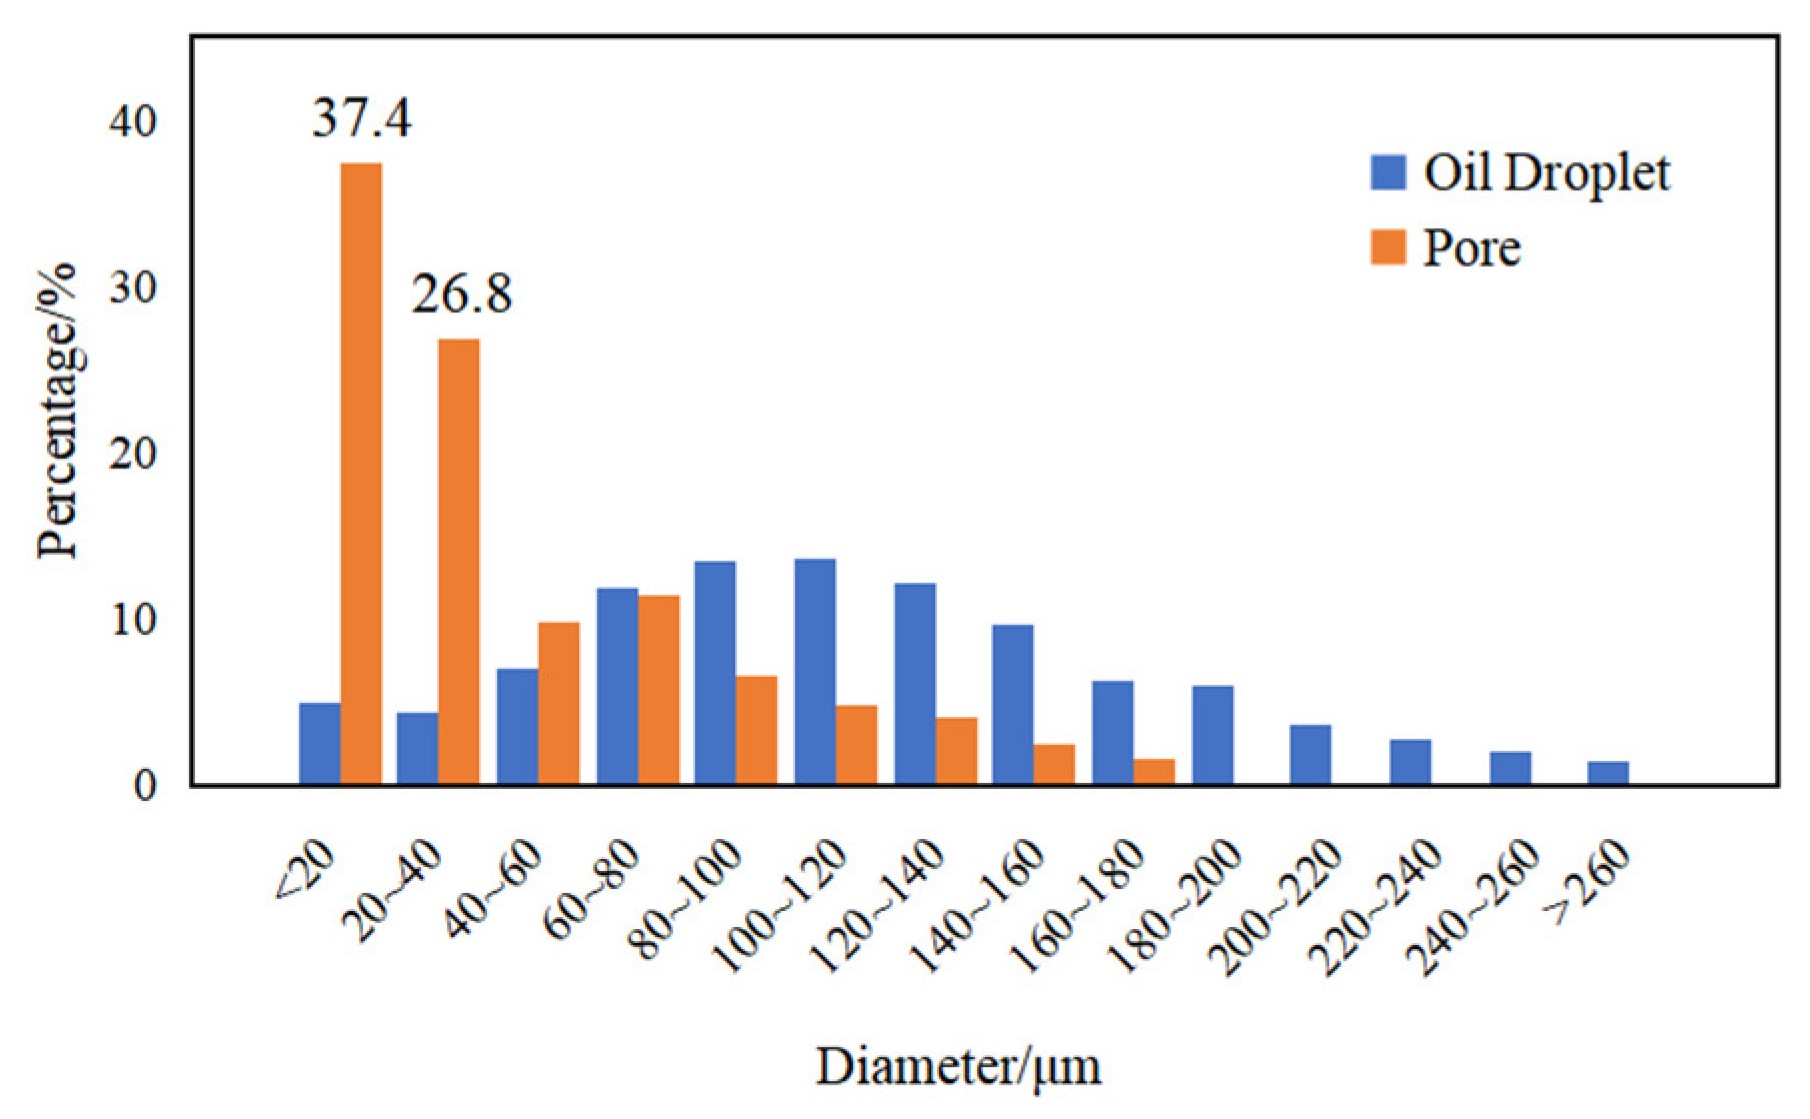
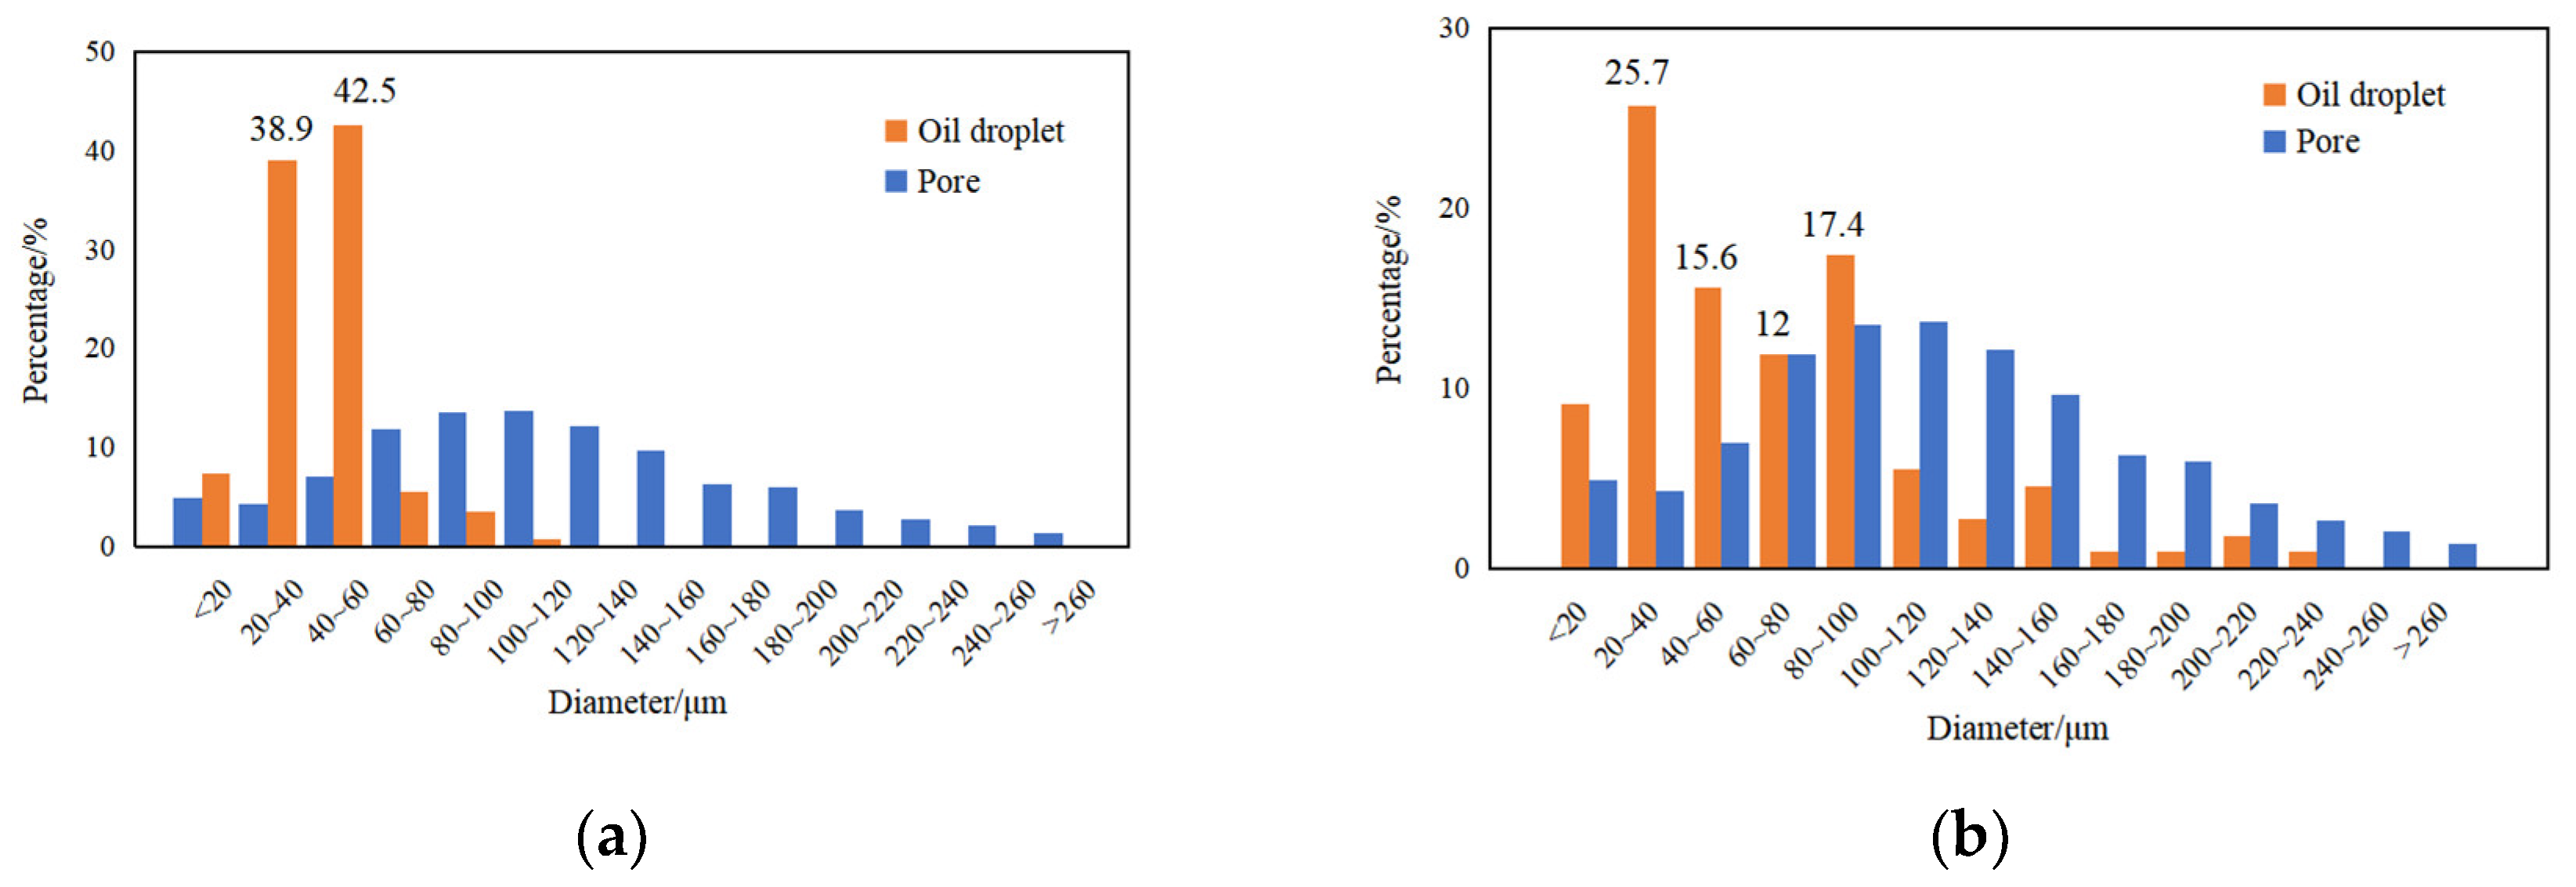
3.4. Emulsification of Residual Oil

No emulsification was observed in the pore system after the water flooding, and the early emulsification was observed during the 1st injection. During the 1st shut-in period, the emulsified oil droplets concentrated in the main stream. As shown in Figure 8, in one area of the main stream, the number of emulsified oil droplets on day 9 in the red box had increased compared to day 1. A total of 20 areas (1 mm × 0.8 mm) were evenly selected in the main stream, and the average oil droplet diameter distribution was obtained based on the distribution in each area. In Figure 9, the distribution was uneven, and the proportion of oil droplets with a diameter between 0 and 20 μm was the largest (37.4%).
From the inlet to the outlet of the main stream, four typical regions were selected (Figure 2b). As shown in Figure 10, the emulsification of these regions during the 3rd injection was different, and it can be found that more emulsified oil droplets appeared at the center of the main stream (region 2 and region 3).
During the injection, 20 photos of regions 2 and 3 were selected at the same time interval, respectively, and the average oil droplet diameter distribution in the two regions was obtained based on the distributions in all photos. In region 2, the median particle size of oil droplets was 43.2 μm, and diameters of 81.4% of the oil droplets concentrated between 20 and 60 μm, which corresponded to the small pore sizes in the pore system (Figure 11a). In region 3, the median particle size was larger (61.3 μm), which indicated that more than 50% of the oil droplets can block the small pores in this region (Figure 11b).
Average flow rates in the main stream, left and right margin during flooding periods are shown in Figure 12. During the water flooding, the average flow rate in the main stream (124 μm/s) was much higher than that of the left and right margin (55 and 59 μm/s) due to the fingering phenomenon. During the 1st injection, the introduction of microorganisms made the distribution of flow field more uniform, and during the 3rd injection, the flow rate in margin rose or even exceeded (176 and 112 μm/s) that in the main stream (96 μm/s). During the 4th injection and post-water flooding, the flow rates of the main stream and margin tended to be consistent, which were higher than that during the water flooding.

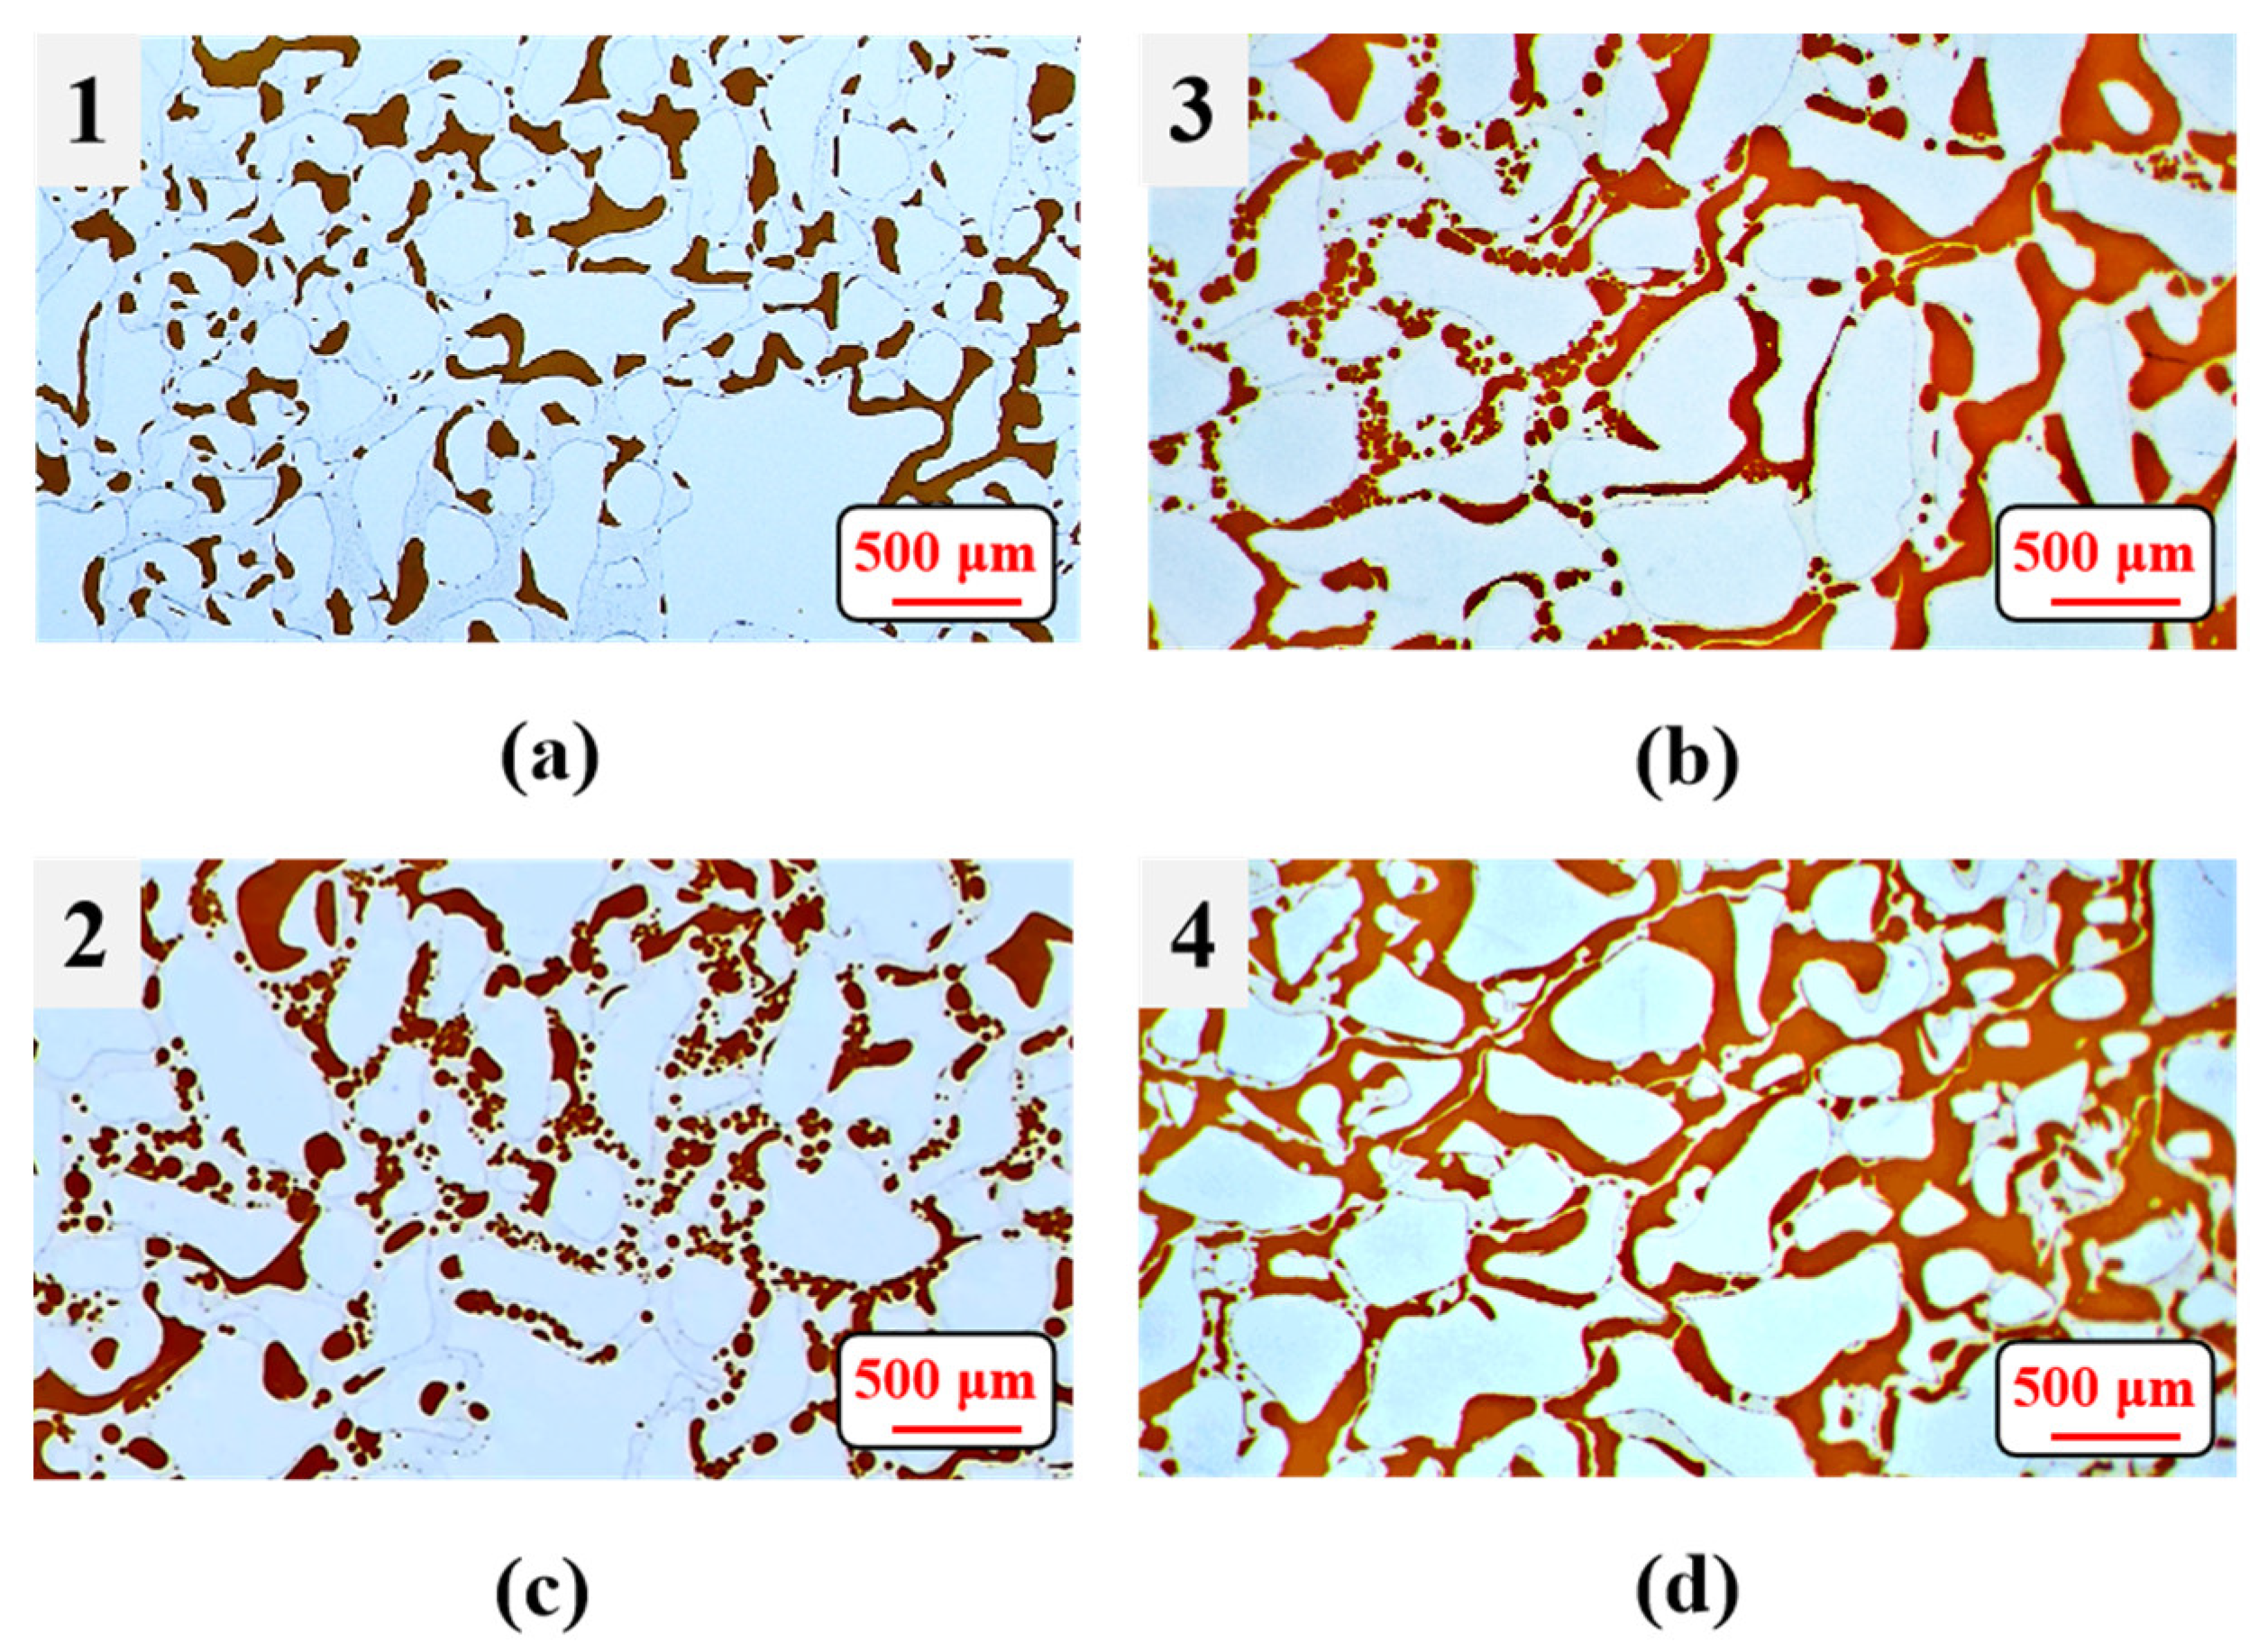
3.5. Effects of Surfactant-Producing Microorganisms on Residual Oil Distribution

After the water flooding, the residual oil saturation of the total, main stream and margin were 59.2%, 54.5% and 74.3%, respectively. This difference indicated a fingering phenomenon, which resulted in a low oil recovery of 40.8% of the OOIP.
After the 1st injection, the distribution of residual oil started to change. On day 1 during the 1st shut-in period, the residual oil at the margin began to migrate (Figure 13a,b), and the margin oil saturation decreased to 65.8%. On day 5, almost all the residual oil in the left margin migrated to the downstream of the main stream (Figure 13c), which resulted in the reduction in the margin oil saturation to 54.2%. On day 9, the amount of residual oil in the downstream continued to increase, and the margin oil saturation decreased to 53.4% (Figure 13d).
From the distribution of residual oil before and after the 3rd injection (Figure 13e,f), the red arrows indicated that the boundary of the main stream expands outward, which meant that the sweep area was significantly enlarged. By the flooding fluid, a large amount of residual oil in the model (13.4% of the OOIP) was driven out, and 13.9% of the OOIP and 11.6% of the OOIP were recovered in the main stream and margin, respectively.

4. Discussion

4.1. Surfactant-Producing Microorganisms Can Improve Not Only Displacement Efficiency but Also Sweep Efficiency

In this study, 19.4% of the OOIP was recovered in total, which was achieved by the improvement of displacement efficiency and sweep efficiency.
The improvement of the displacement efficiency was proved by the increase in the oil recovery (16.9% of the OOIP) in the main stream, which was achieved by the wettability alteration and emulsification. Regarding wettability alteration, the pore surfaces in the margin became more water-wet by the microorganisms after the 1st injection. While in the main stream, the wettability of pore surface varied from the inlet (more water-wet) to the outlet (more oil-wet). This was because during the migration of cells, their concentration decreased due to the adhesion and retention in the pores [20], and this uneven distribution of biomass in the main stream led to the different wettability alterations.
Regarding emulsification, the formation of emulsified oil droplets was caused by both biosurfactant and shear action. During the shut-in period, the residual oil was emulsified into oil droplets with varying particle sizes by the biosurfactant. During the flooding period, most of the emulsified oil droplets appeared at the center of the main stream, and in the local area of the center, 81.4% of the oil droplets matched the size of small pores. This is because compared to pores with larger diameters, the shear effect was stronger in small pores due to high flow rates, which can make the diameter of emulsified oil droplets smaller and more uniform [21].
In previous MEOR studies regarding the sweep efficiency, the biomass and biopolymer redirected the water flooding by plugging the high-permeability zones in the reservoir, which can enlarge the sweep area [22]. However, for surfactant-producing microorganisms, no previous study was reported to directly prove its potential to improve the sweep efficiency. In this study, the improvement was proved by the increase (27.7% of the OOIP) of the oil recovery in the margin during not only the flooding but also the shut-in periods, which will be discussed as follows.

4.2. Surfactant-Producing Microorganisms Improve Sweep Efficiency during Not Only Flooding Period but Also Shut-in Period

The sweep efficiency was improved during both the flooding period and the shut-in period. During the flooding periods, 14.7% of the OOIP was recovered in the margin, and during the 1st shut-in period, 19.5% of the OOIP in the margin migrated to the main stream.
During the flooding periods, the large emulsified oil droplets increased the flow resistance in the main stream when passing the narrow pores (Jamin’s effect) [23]. As a result, the flow rate in the main stream decreased (from 124 to 113 μm/s) after the 1st injection, which indicated a weakened fingering phenomenon. By the block of oil droplets (diameter larger than 61.3 μm) in the margin stream, the margin flow rate was significantly increased (from 69 to 176 μm/s in the left margin) during the 3rd injection, which indicated that the sweep area was enlarged. In the 4th injection and the post-water flooding, most of the pore surfaces had become water-wet, which resulted in an overall acceleration of flow rate [24], and the difference of flow rate between the main stream and margin was smaller due to the weakened emulsification [25].
During the shut-in period, it was reported in a previous study that a biosurfactant can mobilize the residual dead-end oil; however, the dead-end oil had little contribution to the oil recovery due to its micrometer scale [26]. In this study, the sweep area was enlarged to the centimeter scale, and the flooding fluid can reach the edge of the margin regions, which indicated that the improvement of sweep efficiency would be much larger. The mechanisms will be discussed as follows.

4.3. Mechanism of the Improvement of Sweep Efficiency in Shut-in Period

Regarding the improvement of sweep efficiency in the dead end, cells migrated into the dead end (the red box in Figure 14c) to produce a biosurfactant in situ, which altered the wettability of the pore surface. After the wettability alteration, the residual oil in the dead end was coalesced by the capillary force and existed in the form of oil droplets (the red box in Figure 14b). Based on the mechanism to improve the sweep efficiency on a micrometer scale, the process in the centimeter scale can be proved as follows.
First, the mobilization of the margin residual oil indicated that the pore surface there had become water-wet, which was also proved in the 1st shut-in period. Therefore, it can be inferred that after the wettability alteration, the residual oil in the margin was driven by capillary force to the downstream of the main stream, which was more oil-wet than the upstream [27]. For the wettability alteration, a sufficient amount of biosurfactant was needed [28]. However, the biosurfactant in the main stream cannot reach the margin by itself at the centimeter scale [29]. Therefore, cells were required to produce the biosurfactant in situ [30].
Second, there were sufficient cells present in the margin to produce the biosurfactant. It was proved in the previous study that cells can spontaneously diffuse in a porous medium from high-concentration to low-concentration regions [31], and the diffusion coefficient of Bacillus subtilis used in this study was 1.2 × 10⁻⁶ cm2/s [32]. It took about 7.7 days for cells to diffuse from the inlet to the margin, and the shortest shut-in period was 10 days, which was enough to reach the edge of the model. Moreover, it was reported in previous studies that Bacillus subtilis tended to move in the direction of high residual oil concentration because of its chemotaxis [33]. Therefore, the cells in the main stream (oil saturation of 54.5%) tended to move toward the margin (oil saturation of 72.9%) where the residual oil was enriched, because of which the migration time can be further shortened. After reaching the margin, the cells continued to grow (multiplied 12 times in average) during the 1st shut-in period, which indicated that sufficient biosurfactant can be metabolized for the wettability alteration.
Based on the above two points and the mechanism of the dead-end oil, the whole process to improve the sweep efficiency in the shut-in period can be summarized as follows. The cells of Bacillus subtilis spontaneous diffused to the margin to produce sufficient biosurfactant in situ for the wettability alteration, after which the residual oil was driven by the capillary force to migrate to the oil-wet downstream of the main stream.
During the 1st shut-in period, as mentioned in Section 3.4, the emulsification was not obvious and mainly occurred in the main stream, so in the margin, the emulsification was not sufficient to mobilize the residual oil by reducing its viscosity. Therefore, in the process of the mobilization, only the agglomeration of the microbes and the wettability alteration played the main role.

4.4. The Long-Term Experiment Reveals the Dominant EOR Mechanisms Altering with Residual Oil Saturation

From the discussions above, it can be seen that many mechanisms existed during the entire process. Although these mechanisms may coexist, the dominant mechanism kept altering. Therefore, according to different dominant oil recovery mechanisms, the long-term experiment can be divided into three stages.
The first stage (total oil saturation from 58.9% to 53.3%) included the 1st shut-in period and the 2nd injection. In this stage, sweep efficiency contributed to the improved oil recovery, and the spontaneously spreading biomass and their wettability-altering biosurfactant played the dominant role to improve the sweep efficiency.
The second stage (total oil saturation from 53.3% to 40.5%) included the 2nd shut-in period and the 3rd injection. In this stage, the sweep efficiency still contributed to the improved oil recovery, and the emulsion-induced Jamin’s effect was the dominant mechanism.
The third stage (total oil saturation from 40.5% to 39.8%) included the 3rd shut-in period, the 4th injection, the 4th shut-in period and the post-water flooding. In this stage, only displacement efficiency contributed to the improved oil recovery, and the emulsification and wettability alteration led by the biosurfactant were the dominant mechanisms.
In summary, for surfactant-producing microorganisms, when the total oil saturation was higher than 40.5%, the sweep efficiency was the contributor to the increase in oil recovery. When the total oil saturation was lower than 40.5%, only the displacement efficiency contributed to the oil recovery, and the increase in the oil recovery was not obvious.
In previous studies, several mechanisms had been revealed in MEOR, such as IFT reduction by biosurfactant [34], selective plugging and viscosity modification by biopolymers [35,36] and biofilm formation [37]. However, all these mechanisms played a dominant role independently to improve the oil recovery throughout the entire process, and they were not closely related to the oil saturation. Therefore, the altering dominant oil recovery mechanisms is a new understanding in MEOR based on which the timing of introducing surfactant-producing microorganisms can be determined by current residual oil saturation for higher oil recovery.
In previous studies regarding the introducing timing of microorganisms in MEOR, it was reported that when the water cut was higher than 80%, the residual oil recovered by the microbial flooding would be lower than 7% of the OOIP [38]. In addition, indigenous microorganism flooding at the water cut higher than 90% resulted in an increase in oil recovery lower than 4% of the OOIP [39]. Previous studies have shown an understanding that the introduction of microorganisms at high water cut (low residual oil saturation) could not significantly improve the oil recovery, which is consistent with the results obtained in this study. However, this study further reveals the mechanism: that is, at low residual oil saturation, sweep efficiency is no longer the contributor to the oil recovery, and the contribution of displacement efficiency is also limited due to the low residual oil saturation in the main stream. Furthermore, compared with previous studies, the introduction timing of the microorganism revealed in this study is earlier, which can be a reference for the field applications in MEOR.

5. Conclusions

In this study, a long-term (155 days) pore-scale MEOR experiment was conducted to reveal the EOR mechanisms by surfactant-producing microorganisms. The results revealed that not only displacement efficiency but also sweep efficiency were improved, which totally recovered 19.4% of the OOIP. The improvement of sweep efficiency (27.7% of the OOIP was recovered in the margin) was achieved during not only flooding but also during shut-in periods with different mechanisms. During the flooding, an emulsion-induced Jamin’s effect played a main role, and during shut-in periods, the spontaneously spreading biomass and their wettability-altering biosurfactant played a main role. This long-term experiment revealed that the dominant oil recovery mechanisms altered with the declining residual oil saturation, based on which the sweep efficiency was the contributor to improve the oil recovery only at oil saturation higher than 40.5%. While at lower oil saturation, only the displacement efficiency contributed to the oil recovery. The new knowledge contributed to the decision of introducing timing and the optimization of the MEOR process for the field applications of surfactant-producing microorganisms.

Author Contributions

Conceptualization, X.Y. and H.L.; methodology, H.L.; software, X.Y.; validation, Z.S.; formal analysis, X.Y.; investigation, Z.S.; resources, W.Z.; data curation, W.Z.; writing—original draft preparation, X.Y.; writing—review and editing, X.Y.; visualization, Z.S.; supervision, Z.S.; project administration, X.Y.; funding acquisition, Z.S. All authors have read and agreed to the published version of the manuscript.

Funding

This research was funded by the National Natural Science Foundation of China (51974013).

Data Availability Statement

The original contributions presented in the study are included in the article, and further inquiries can be directed to the corresponding author.

Conflicts of Interest

The authors declare no conflict of interest.

References

  1. Al-Adasani, A.; Bai, B.J. Analysis of EOR projects and updated screening criteria. J. Pet. Sci. Eng. 2011, 79, 10–24. [Google Scholar] [CrossRef]
  2. Sen, R. Biotechnology in petroleum recovery: The microbial EOR. Prog. Energy Combust. Sci. 2008, 34, 714–724. [Google Scholar] [CrossRef]
  3. Niu, J.J.; Liu, Q.; Lv, J.; Peng, B. Review on microbial enhanced oil recovery: Mechanisms, modeling and field trials. J. Pet. Sci. Eng. 2020, 2020192, 107350. [Google Scholar] [CrossRef]
  4. Jahan, R.; Bodratti, A.M.; Tsianou, M.; Alexandridis, P. Biosurfactants, natural alternatives to synthetic surfactants: Physicochemical properties and applications. Adv. Colloid Interface Sci. 2020, 275, 102061. [Google Scholar] [CrossRef]
  5. Amani, H.; Sarrafzadeh, M.H.; Haghighi, M.; Mehrnia, M.R. Comparative study of biosurfactant producing bacteria in MEOR applications. J. Pet. Sci. Eng. 2010, 75, 209–214. [Google Scholar] [CrossRef]
  6. Ansah, E.O.; Sugai, Y.; Nguele, R.; Sasaki, K. Integrated microbial enhanced oil recovery (MEOR) simulation: Main influencing parameters and uncertainty assessment. J. Pet. Sci. Eng. 2018, 171, 784–793. [Google Scholar] [CrossRef]
  7. Ke, C.Y.; Lu, G.M.; Li, Y.B.; Sun, W.J.; Zhang, Q.Z.; Zhang, X.L. A pilot study on large-scale microbial enhanced oil recovery (MEOR) in Baolige Oilfield. Int. Biodeterior. Biodegrad. 2018, 127, 247–253. [Google Scholar] [CrossRef]
  8. Zhuang, J.; Lu, C.Y.; Zhang, X.; Yang, W.J.; Yuan, W.B. Mechanism and community distribution of microbially activated water flooding in Sai 169 low-permeability reservoir. Spec. Oil Gas Reserv. 2022, 29, 47–153. [Google Scholar]
  9. Armstrong, R.T.; Wildenschild, D. Investigating the pore-scale mechanisms of microbial enhanced oil recovery. J. Pet. Sci. Eng. 2012, 94–95, 155–164. [Google Scholar] [CrossRef]
  10. Yao, C.J.; Meng, X.X.; Qv, X.H.; Zhan, G.X.; Li, L.; Lei, G.L. Reaction kinetics model and numerical simulation method of microbial flooding in oil reservoirs. J. China Univ. Petrol. (Ed. Nat. Sci.) 2021, 45, 84–91. [Google Scholar]
  11. Ma, J.Y.; Guo, S.X.; Lei, G.L.; Wang, W.D. Microscopic mechanism studies on microbial enhanced oil recovery under high temperature high pressure reservoir conditions. Oilfield Chem. 2008, 25, 369–373. [Google Scholar]
  12. Zhu, W.Y.; Tian, Y.A.; Wang, W.D.; Song, Z.Y.; Han, H.Y.; Song, Y.T.; Li, C.F. Mechanisms of oil displacement by indigenous microorganism producing bio-emulsifier using microscopic modeling. J. Cent. South Univ. (Sci. Tech.) 2016, 47, 3280–3288. [Google Scholar]
  13. Wang, W.D. Research advance and development trend in microbial enhanced oil recovery technology. Petrol. Geol. Recovery Effic. 2021, 28, 1–9. [Google Scholar]
  14. Li, H.; Zhu, W.Y.; Song, Z.Y. 2-D pore-scale oil recovery mechanisms of the anionic and nonionic surfactants. Colloids Surf. A 2022, 655, 130245. [Google Scholar] [CrossRef]
  15. Zhu, W.Y.; Li, H.; Chen, Z.; Song, Z.Y. Pore-scale experiments reveal distinct flow field of polymer flooding with viscoelasticity loss by high salinity. Colloids Surf. A 2023, 668, 131473. [Google Scholar] [CrossRef]
  16. Li, C.F.; Li, Y.; Wu, X.Y.; Cao, Y.B.; Wang, W.D.; Bao, M.T. Study on the activation Geobacillus species in Zhan 3 blocks of Shengli Oilfield. J. Univ. Petrol. (Ed. Nat. Sci.) 2016, 40, 163–167. [Google Scholar]
  17. Xu, H.Y.; Ding, M.S.; Liu, J.; Wang, H.J.; Ren, S.L. Physical simulation experiment of oil displacement by bacillus subtilis for enhanced oil recovery. Chem. Eng. Oil Gas 2016, 45, 61–66. [Google Scholar]
  18. Wang, J.; Lin, J.Z.; Song, X.; Tan, X.M.; Hu, J.; Chen, J.B. A strain of lipopeptide producing bacteria identification and its metabolic product performance evaluation. J. Northeast Petrol. Uni. 2016, 40, 78–84. [Google Scholar]
  19. Bao, B.; Shi, J.W.; Feng, J.; Yang, Z.Y.; Peng, B.L.; Zhao, S.L. Research progress of surfactant enhanced oil recovery based on microfluidics technology. Acta Petrolei Sin. 2022, 43, 432–442,452. [Google Scholar]
  20. Bi, Y.Q.; Gao, Y.T.; Wang, C.Y.; Xiu, J.L.; Yi, L.N. Effect of permeability on profile control and oil displacement by bacteria. Fault-block Oil Gas Field 2020, 27, 493–497. [Google Scholar]
  21. Shi, S.Y.; Wang, Y.F.; Wang, L.S.; Jin, Y.X.; Wang, T.; Li, W.Z. Effect of shear action on enhanced oil recovery of spontaneous emulsification flooding. Oilfield Chem. 2016, 33, 295–299. [Google Scholar]
  22. Li, H.; Zhu, W.Y.; Niu, H.; Gao, Y.B.; Chen, Z.; Song, Z.Y.; Kong, D.B. 2-D porous flow field reveals different EOR mechanisms between the biopolymer and chemical polymer. J. Pet. Sci. Eng. 2022, 210, 110084. [Google Scholar] [CrossRef]
  23. Zhou, Y.Z.; Yin, D.Y.; Cao, R. Research on profile control and displacement mechanism of discontinuous emulsion in late high water-cut stage. Oilfield Chem. 2016, 33, 285–290. [Google Scholar]
  24. Khajepour, H.; Mahmoodi, M.; Biria, D.; Ayatollahi, S. Investigation of wettability alteration through relative permeability measurement during MEOR process: A micromodel study. J. Pet. Sci. Eng. 2014, 120, 10–17. [Google Scholar] [CrossRef]
  25. Patel, J.; Borgohain, S.; Kumar, M.; Rangarajan, V.; Somasundaran, P.; Sen, R. Recent developments in microbial enhanced oil recovery. Renew. Sustain. Energy Rev. 2015, 52, 1539–1558. [Google Scholar] [CrossRef]
  26. Karimi, M.; Mahmoodi, M.; Niazi, A.; Al-Wahaibi, Y.; Ayatollahi, S. Investigating wettability alteration during MEOR process, a micro/macro scale analysis. Coll. Colloids Surf. B 2012, 95, 129–136. [Google Scholar] [CrossRef]
  27. Falode, O.; Manuel, E. Wettability effects on capillary pressure, relative permeability, and irredcucible saturation using porous plate. J. Pet. Sci. Eng. 2014, 2014, 1–12. [Google Scholar] [CrossRef]
  28. Pathak, K.V.; Keharia, H. Application of extracellular lipopeptide biosurfactant produced by endophytic Bacillus subtilis K1 isolated from aerial roots of banyan (Ficus benghalensis) in microbially enhanced oil recovery (MEOR). 3 Biotech 2014, 4, 41–48. [Google Scholar] [CrossRef]
  29. Cameotra, S.S.; Makkar, R.S.; Kaur, J.; Mehta, S.K. Synthesis of biosurfactants and their advantages to microorganisms and mankind. Adv. Exp. Med. Biol. 2010, 672, 261–280. [Google Scholar]
  30. Jacques, P.; Hbid, C.; Destain, J.; Razafindralambo, H.; Paquot, M.; Pauw, E.D.; Jacques, P.T. Optimization of biosurfactant lipopeptide production from Bacillus subtilis S499 by Plackett-Burman design. Appl. Biochem. Biotechnol. 1999, 77, 223–233. [Google Scholar] [CrossRef]
  31. Evans, S.; Dieckmann, U.; Franklin, O.; Kaiser, C. Synergistic effects of diffusion and microbial physiology reproduce the Birch effect in a micro-scale model. Soil Biol. Biochem. 2016, 93, 28–37. [Google Scholar] [CrossRef]
  32. Li, Y.; Mou, B.Z. The diffusion coefficient of Bacillus subtilis HSO. Oilfield Chem. 2005, 22, 89–92. [Google Scholar]
  33. Abdi, A.; Ranjbar, B.; Kazemzadeh, Y.; Niazi, A.; Riazi, M. Effect of bacteria on oil/water interfacial tension in asphaltenic oil reservoirs. Colloids Surf. A 2022, 639, 128263. [Google Scholar] [CrossRef]
  34. Zang, X.Q.; Li, Z.Y.; Zhang, X.Y.; Jiang, L.; Ren, N.Q.; Sun, K. Advance in bacteria chemotaxis on microfluidic devices. Chin. J. Anal. Chem. 2017, 45, 1734–1744. [Google Scholar] [CrossRef]
  35. Wang, T.Y.; Yu, L.; Xiu, J.L.; Ma, Y.D.; Lin, W.; Ma, T.; Wang, X.Y.; Wang, L. A mathematical model for microbial enhanced oil recovery using biopolymer-producing microorganism. Fuel 2018, 216, 589–595. [Google Scholar] [CrossRef]
  36. Pu, W.F.; Shen, C.; Wei, B.; Yang, Y.; Li, Y.B. A comprehensive review of polysaccharide biopolymers for enhanced oil recovery (EOR) from flask to field. J. Ind. Eng. Chem. 2018, 61, 1–11. [Google Scholar] [CrossRef]
  37. Song, Z.Y.; Zhu, P.R.; Wu, X.L.; Xu, P.; Li, H.; Du, C.A.; He, X.; Yang, L.Z.; Zhu, W.Y. Vertical distribution of biofilm communities along an injection wellbore in a deep petroleum reservoir. J. Pet. Sci. Eng. 2021, 206, 109024. [Google Scholar] [CrossRef]
  38. Yao, C.J.; Meng, X.X.; Qu, X.H.; Cheng, T.X.; Da, Q.A.; Zhang, K.; Lei, G.L. Kinetic model and numerical simulation of microbial growth, migration, and oil displacement in reservoir porous media. ACS Omega 2022, 7, 32549–32561. [Google Scholar] [CrossRef]
  39. Wu, C.B.; Shan, W.W.; Yu, L. Simulation and application of mathematical model of enhanced oil recovery by indigenous microbes. J. Liaoning Tech. Uni. (Nat. Sci.) 2008, 27, 709–712. [Google Scholar]
Figure 1. Schematic diagram of micro-flooding device.
Energies 16 06854 g001
Figure 2. Physical object (a) and schematic diagram (b) of the micro-model mimicking a real pore structure.
Energies 16 06854 g002
Figure 3. The microbial cells in the pore.
Energies 16 06854 g003
Figure 4. The growth of biomass in the main stream from day 1 (a) to day 9 (b) during the 1st shut-in period.
Energies 16 06854 g004
Figure 5. The growth of biomass in the margin from day 1 (a) to day 9 (b) during the 1st shut-in period.
Energies 16 06854 g005
Figure 6. Total (a) and divisional (b) oil saturation after each flooding and shut-in period.
Energies 16 06854 g006
Figure 7. The contact angles of the residual oil films in the margin on day 1 (a,b) and day 9 (c).
Energies 16 06854 g007
Figure 8. Emulsification of residual oil on day 1 (a) and day 9 (b) during the 1st shut-in period.
Energies 16 06854 g008
Figure 9. Average oil droplet diameter distribution on day 9 during the 1st injection.
Energies 16 06854 g009
Figure 10. Emulsification of residual oil at the main stream in region 1 (a), region 2 (b), region 3 (c) and region 4 (d).
Energies 16 06854 g010
Figure 11. Average oil droplet diameter distribution in region 2 (a) and region 3 (b).
Energies 16 06854 g011
Figure 12. Average flow rate in the main stream, left and right margin during flooding periods.
Energies 16 06854 g012
Figure 13. The distribution of residual oil after the 1st injection (a), on day 1 (b), day 5 (c), day 9 (d), before (e) and after (f) the 3rd injection.
Energies 16 06854 g013
Figure 14. The residual dead-end oil before (a) and after (b) mobilization, and the biomass in the dead end (c).
Energies 16 06854 g014
Table 1. Contact angles in the main stream on day 1 and day 9.
PositionProportion of Contact Angles Smaller than 90°/%Increase/%
Day 1Day 9
Inlet89890
Center58883
Outlet38077
Disclaimer/Publisher’s Note: The statements, opinions and data contained in all publications are solely those of the individual author(s) and contributor(s) and not of MDPI and/or the editor(s). MDPI and/or the editor(s) disclaim responsibility for any injury to people or property resulting from any ideas, methods, instructions or products referred to in the content.

