1. Introduction
In recent years, the route plans toward carbon neutrality released by many countries have comprehended the exploitation of hydrogen (H
2) as an energy vector. The technologies available for hydrogen utilization in mobility are spark ignition internal combustion engines and fuel cells [
1]. Although the latter is characterized by a higher conversion efficiency and null pollutant emissions, the former offers advantages in terms of cost, life service, hydrogen purity requirements and technology maturity. Therefore, many vehicle manufacturers are investing in hydrogen internal combustion engine development, especially for heavy duty applications.
One of the most investigated aspects of this scenario is the charge preparation strategy. In particular, in recent decades, the traditional carburetor has been gradually replaced by port or direct injection systems. These two technologies give rise to a different in-cylinder charge quality, which inevitably affects engine performance, fuel conversion efficiency, pollutant emission levels and autoignition tendency [
2].
In [
3], a single cylinder heavy-duty engine was fed with hydrogen, introduced through either port fuel or direct injection systems. The results demonstrated that the charge preparation (homogeneous or stratified) strongly influenced combustion duration, knock tendency, fuel consumption and pollutant—mainly nitrogen oxides, NOx—emission levels. The authors concluded that it is crucial to properly describe the most important phenomena occurring in H
2 spark ignition engines—such as air induction and fuel distribution into the cylinder—in order to integrate the experimental development of the combustion systems with numerical simulations.
These models must be specifically designed for hydrogen, as their behavior shows deep differences compared to conventional fuels [
4].
It is well known that the combustion process and emission characteristics of internal combustion engines are predominantly governed by the fuel injection process. Direct injection of hydrogen has several advantages, such as increased power density and reduced hydrogen slip but, at the same time, presents some drawbacks due to the physical and chemical characteristics of the hydrogen itself. A concern to be taken into account is the phenomenon of autoignition, consisting on the ignition of hydrogen at an undesired timing. If too advanced compared to the desired—spark triggered—timing, this phenomenon causes abnormal engine operating conditions, such as the generation of braking torque that tends to reduce the engine power output, and knocking that can cause engine failure.
Three-dimensional Computational Fluid Dynamics (CFD) has been historically implemented in fuel injection and mixing process investigations as a tool for understanding the mixture conditions before ignition or the root causes behind combustion anomalies, such as preignition, knocking and backfire.
In [
5], Yip et al. highlighted how the combination of CFD and optical techniques allows for the understanding of the governing mechanisms of mixture formation for the enhancement of engine performances, especially in non-premixed hydrogen diffusion combustion typical of Diesel Injection Internal Combustion Engines (DI ICEs).
Rouleau et al. [
6] explained how preignition could be controlled by adjusting the injection timing for different engine speeds, thus defining new mixture conditions by means of CFD calculation applied on a spark-ignited SCE with a direct injection system.
A 3D CFD analysis of the intake system of a PFI-fueled ICE performed by Duan et al. [
7] addressed how the combination of H2–air mixture concentration and temperature around the intake valve at high loads could be optimized by regulating the injection pressure or, alternatively, the valve lift profiles to reduce the backfire phenomenon at high loads.
In [
8], the propagation speed of the autoignition combustion flame during knocking was described via a combined 1D–3D CFD approach to evaluate the change in mass fraction of the relevant species and their distribution within the engine combustion chamber, affecting the flame and pressure wave propagation process.
A similar modeling approach was also implemented by Wei et al. [
9] when addressing the HICE performance at low load; a detailed hydrogen–air chemical reaction mechanism is coupled with a CFD combustion model implemented in the CONVERGE software 3.0 to assess the role of exhaust gas recirculation (EGR) dilution when attempting an increase of the in-cylinder temperature and pressure, and therefore, an increase in the indicated thermal efficiency with a fuel–air ratio below 1.2.
In [
10], Scarcelli et al. combined optical measurement techniques, such as PLIF and Schlieren, with 3D CFD RANS simulations in order to validate and predict the mixture formation achievable through different injector nozzle geometries given an under-expanded jet issued in a passenger car-sized, optically accessible SCE with the final aim of increasing engine efficiency and reducing combustion instabilities, operating on the injection strategy.
A 3D CFD analysis has been performed by this author [
11] on the aforementioned optical measurements provided to validate the numerical model hereby implemented and further discussed.
In this paper, the mixture preparation when using a heavy-duty H2 injector was characterized through a combined numerical–experimental approach. Experimental tests were carried out in a constant volume combustion chamber. First, the injected mass was characterized based on the injection parameters. Then, some tests were performed in which the autoignition of the injected hydrogen was induced. The experimental results obtained under controlled conditions were used to validate specific models of hydrogen mixing preparation and autoignition.
2. Materials and Methods
In this section, the setup and methodology used for both the experimental and numerical activities are presented and discussed.
The experimental tests were finalized to characterize the injector dosing and charge autoignition behavior. To this end, two distinct experimental test protocols were employed. The first test protocol allowed the mass introduced for each injection event for different values of the chamber backpressure to be estimated. The second test protocol, on the other hand, allowed visualization of the autoignition phenomenon of injected hydrogen and measured the related chamber pressure and temperature.
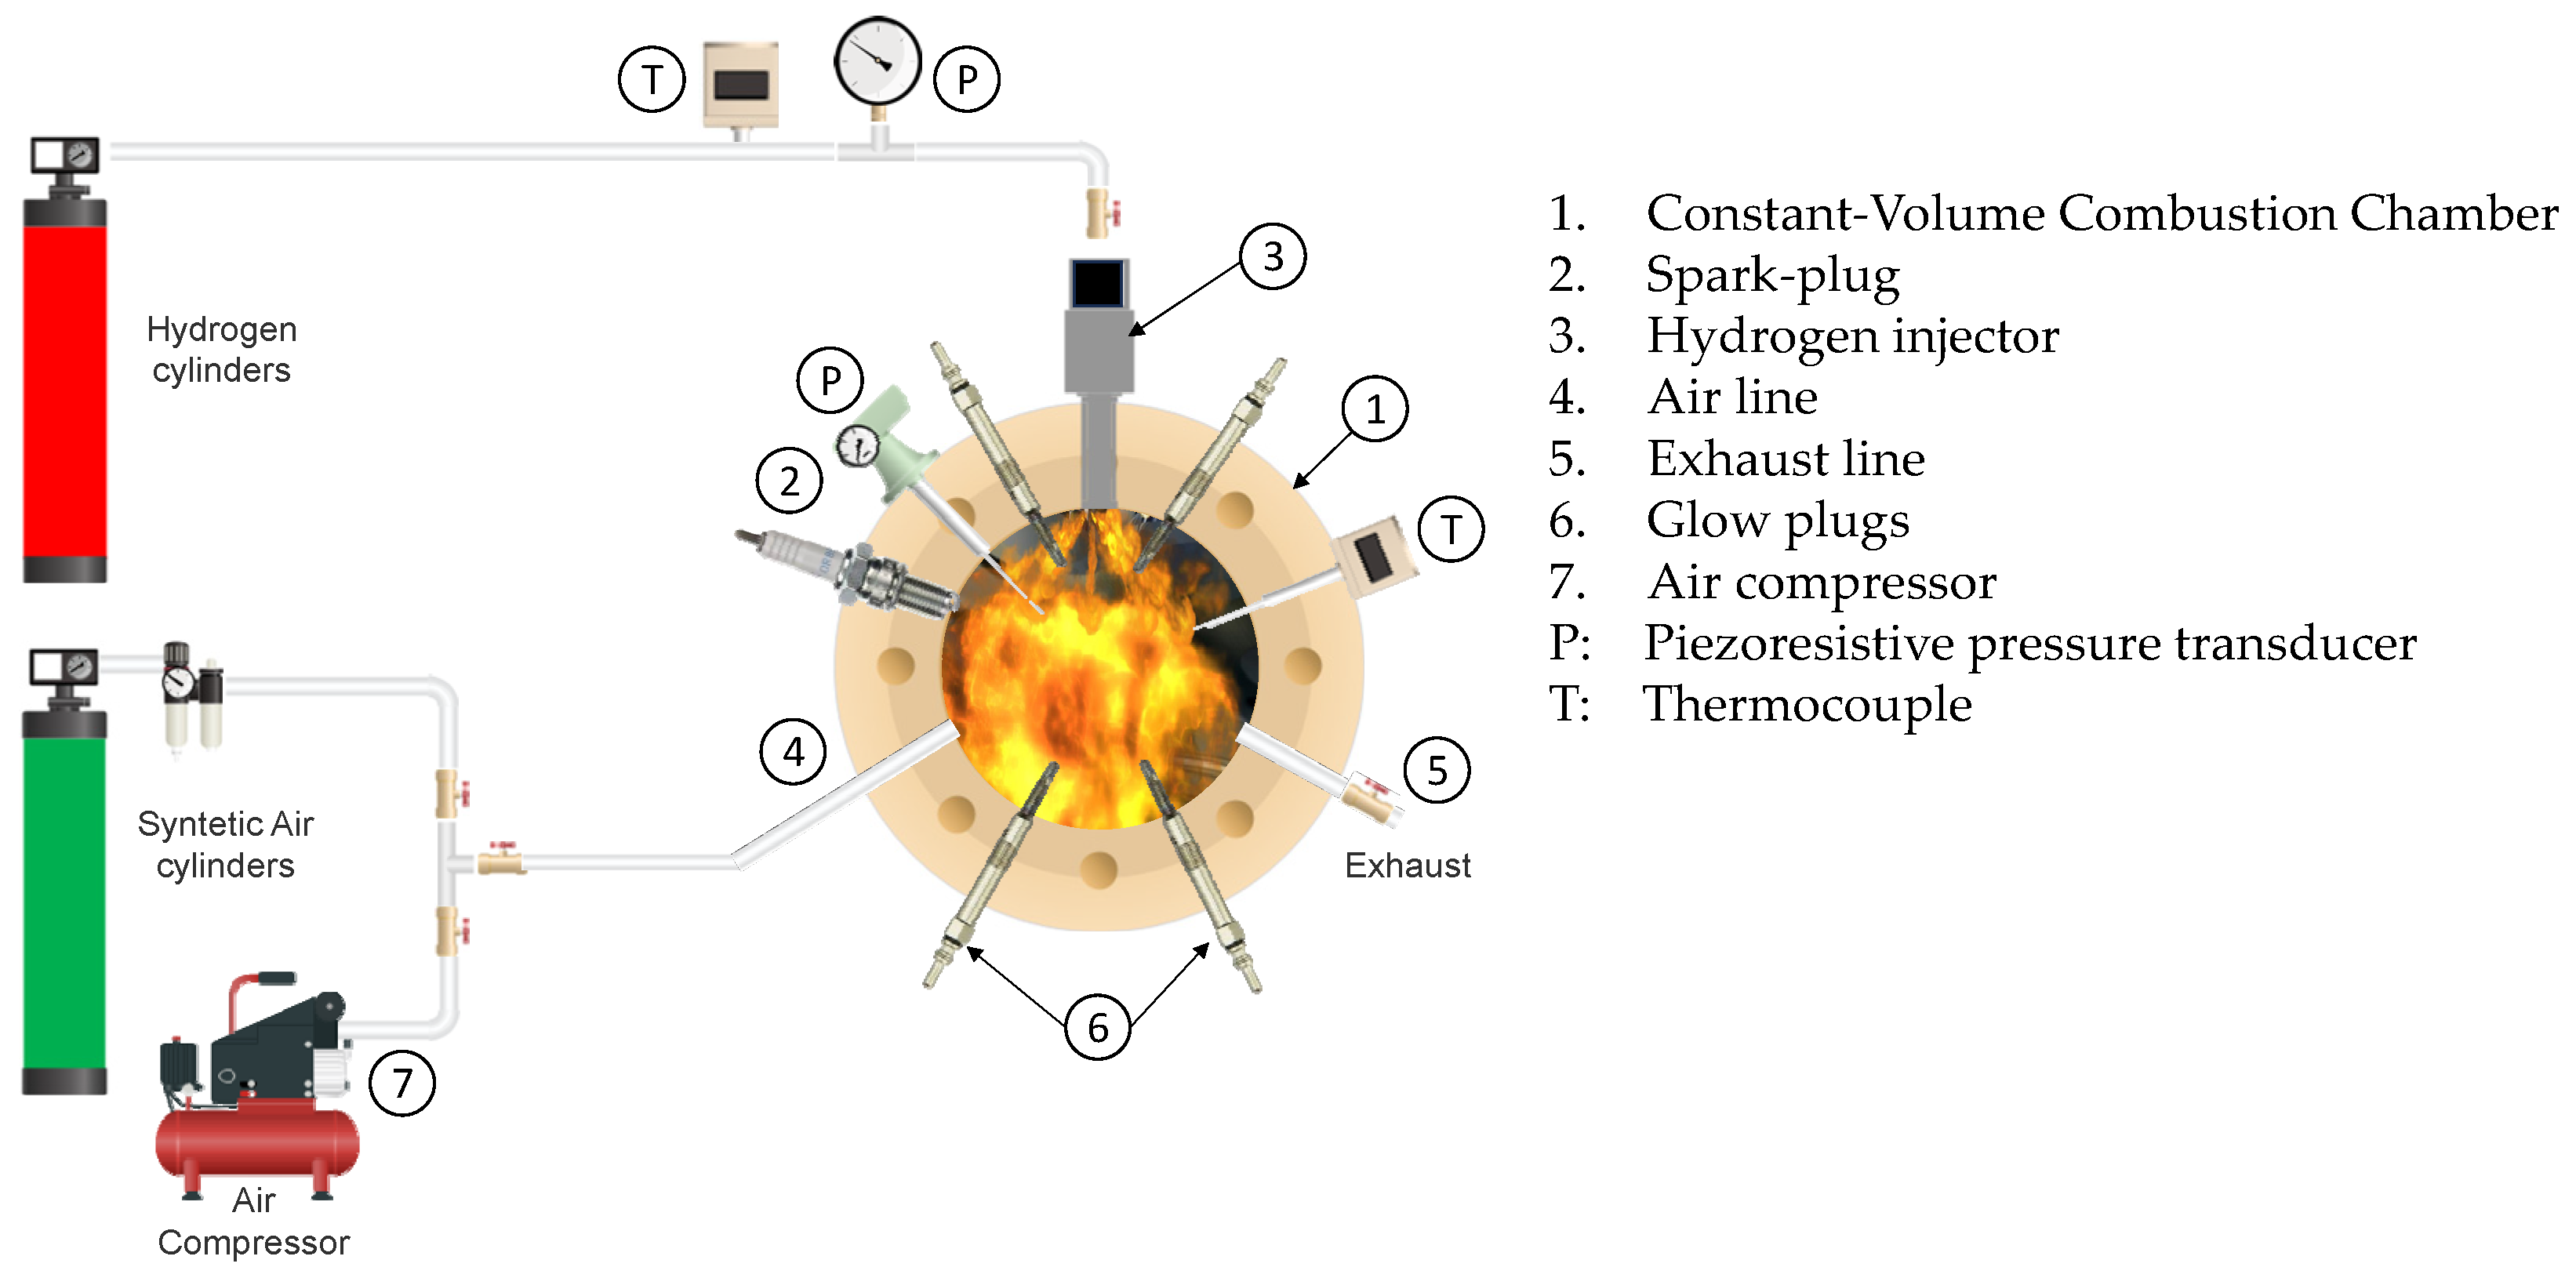
The test rig is schematically shown in
Figure 1. It consists mainly of an optical Constant-Volume Combustion Chamber (CVCC, “1”) having a diameter of 100 mm, a depth of about 35 mm and a volume of 0.27 L, cylindrically shaped and bolted to a steel flange made of Ergal 7075. Combustion was observed through a quartz window in the flange’s opening.
Figure 1 shows visible synthetic air and hydrogen supply cylinders, a heavy-duty hydrogen injector “3”, and other auxiliaries/utilities for the tests execution, such as different on/off valves for air “4” and exhaust “5” lines, glow plugs “6” and a spark plug “2”, respectively, for preheating and igniting the air/fuel mixture, respectively (see ref. [
12] for more details). The piezoresistive pressure transducer labeled “P” (Keller model PA-21Y, KELLER Pressure, Winterthur, Switzerland) was used to “peg” the pressure measurement provided by piezoelectric pressure transducer “2”. Thermocouple “T”, used for controlling the charge initial temperature, and pressure signals were sampled using NI 9213 and NI 9215 slots, respectively, connected to a NI cDAQ 9178 data acquisition board (National Instruments, Austin, TX, USA). The camera used was the Memrecam GX-1 (nac Image Technology, Gilching, Germany), equipped with a Sigma DG macro hypersonic motor 105 mm f/2.8 lens. The frame rate used was 10,000 fps, with a frame size of 384/288 pixels.
The piezoelectric single-hole injector used for hydrogen injection was a prototype model. The injection was obtained using an injector multifunction tester able to accurately simulate the injector driving signal generated by the engine Electronic Control Unit, with the possibility of modifying pulse width and frequency.
During the first experimental protocol, a series of preliminary tests were carried out to estimate the amount of hydrogen introduced into the CVCC for given values of injection pressure and injection duration and different values of chamber backpressure, as listed in
Table 1. The experiments were performed as described below:
Fresh air was first introduced into the CVCC until a certain level of chamber backpressure was reached;
Using a fixed value of injector energizing time and dwell between consecutive injections, a series of twelve hydrogen injections were performed while maintaining a constant hydrogen injection pressure; the Pressure Ratio (PR) was calculated as the ratio between the hydrogen injection pressure (fixed) and the chamber backpressure (variable);
During the injection series, pressure and temperature into the CVCC, as well as injector signal, were recorded.
After twelve injections, the in-CVCC temperature did not significantly differ from the ambient temperature; hence, the filling process was assumed to be isothermal with very good approximation.
As reported in [
12], a series of step pressure variations were recorded, each of which was caused by the introduction of a hydrogen amount equivalent to a single injection event. Every single steep pressure variation allowed indirect estimation of the mass of hydrogen introduced by means of the ideal gas law state equation:
where:
is the mass of hydrogen introduced during a single injection; ∆
p is the pressure increase due to the mass introduction;
V is the volume of the chamber;
is the molar mass of hydrogen;
T is the temperature in the chamber (which, as previously observed, can be assumed to be constant during the injection event);
R is the ideal gas constant. This method provided an estimate of the average mass introduced and the standard deviation associated with a series of twelve injections.
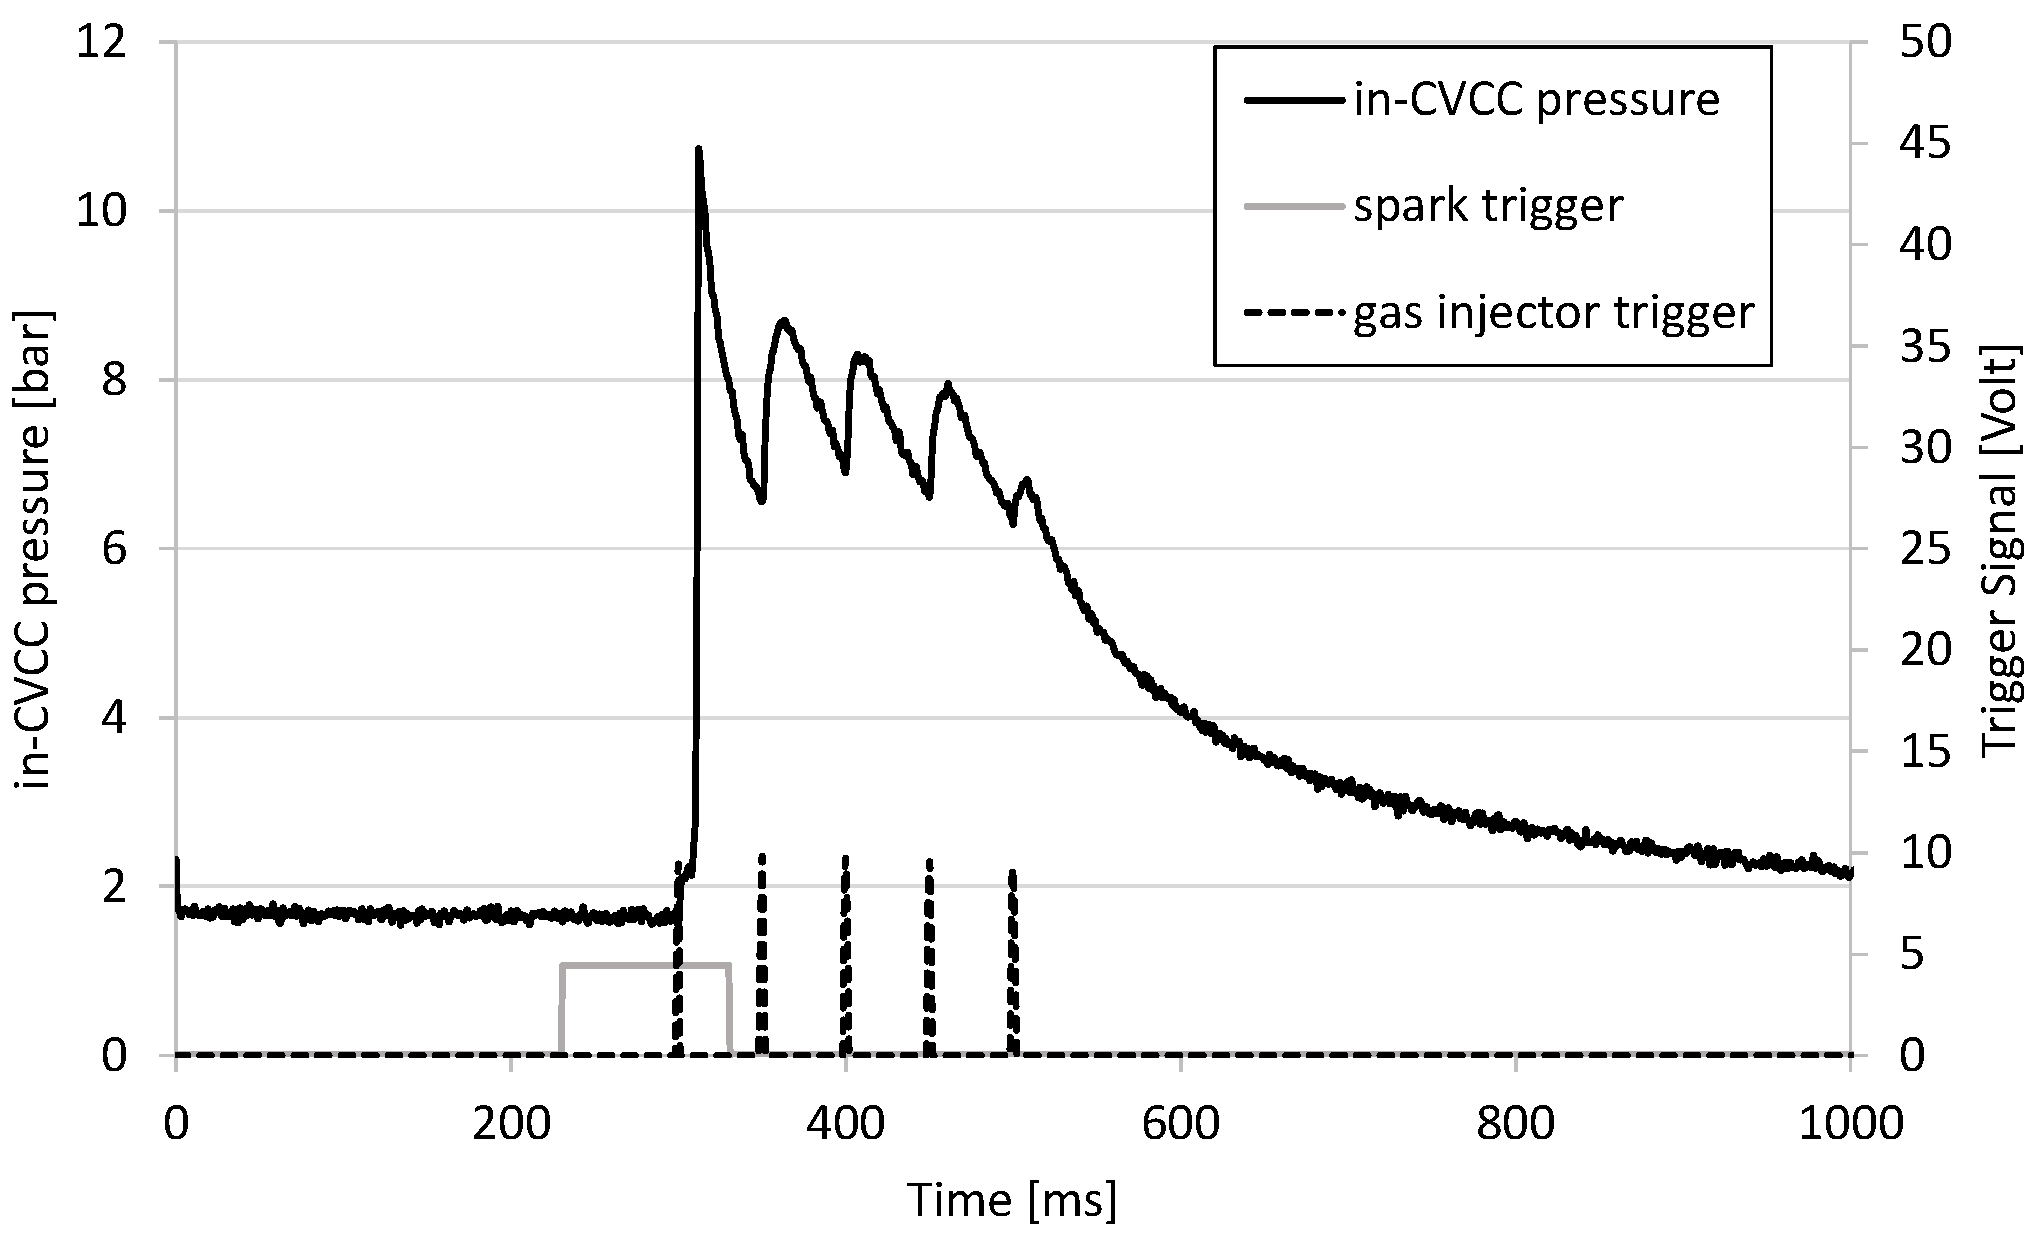
During the second experimental protocol, the hydrogen autoignition conditions inside the chamber were reached, triggering—through spark plug “2”—the combustion of a lean air/hydrogen mixture before the injection of additional hydrogen. As a result, the temperature and pressure in the CVCC were expected to quickly rise and the hydrogen and the associated air to be ideally consumed. In
Figure 2, the in-CVCC the pressure trace superimposed to the injector and spark plug trigger signals are shown. After the first combustion event, triggered by the spark plug and visible by the sudden pressure increase around 300 ms, the temperature and pressure gradually decreased due to the heat exchanged between the exhaust gases and CVCC walls. During this decreasing phase, in the absence of flame propagation, a sequence of several hydrogen injections was performed to ensure that they occurred when the flame characterizing the previous event was extinguished. It can be seen that the injected hydrogen in the chamber, in the presence of residual air and exhaust gases, autoignited in the absence of an ignition source.
The experimental investigation was reproduced by means of a three-dimension Computational Fluid Dynamic (CFD) simulation employing Ansys Fluent v 17.2 commercial code.
An Unsteady Averaged Reynolds Navier Stokes (U-RANS) equations approach was adopted for hydrogen injections with a constant injection pressure of 15 bar. A simulation for the first injection, where hydrogen was ignited by a spark plug, was primarily conducted to verify the actual hydrogen mass injected. Subsequently, a second simulation was performed for the second injection to obtain the in-CVCC thermodynamic conditions and the H2 mass fraction distribution before the first autoignition event.
The computational domain near the nozzle exiting region was discretized for the definition of the issued jet characteristics in terms of cone angle, jet shape, penetration and diffusion affecting the subsequent mixing process involved in the preignition phenomena observed in the experiments.
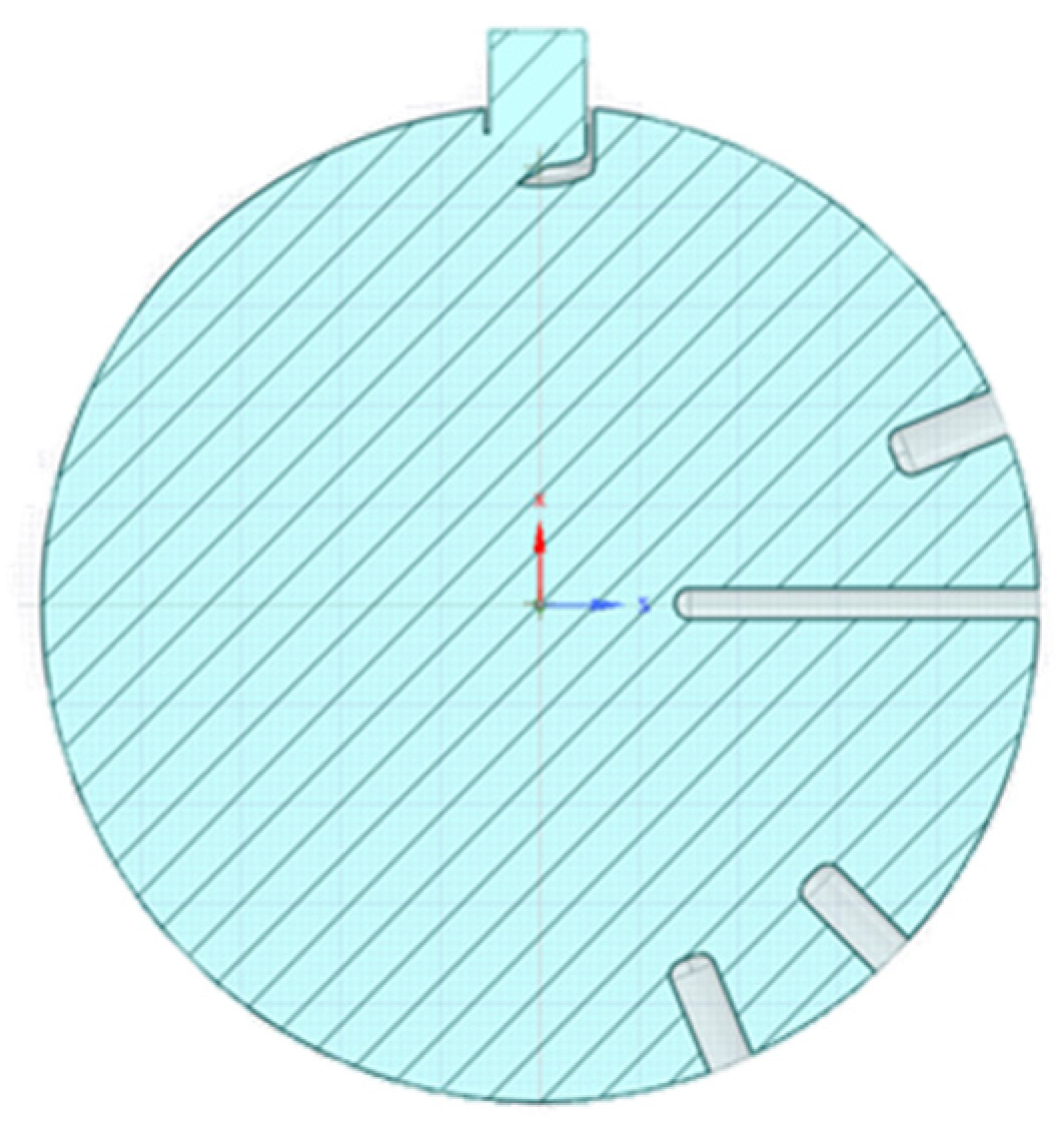
Figure 3 shows the model of the CVCC geometry of the circular section, with a diameter of 100 mm, a depth of about 35 mm and a volume of 0.27 L, properly simplified for 3D CFD simulations in order to achieve a compromise between accuracy and computational costs. Indeed, compared to the experimental configuration, in the geometry employed for CFD purposes, the spark plug was neglected, whereas the glow plugs, as well as the temperature sensor, were considered for reference.
A simplified version of the single-hole injector was represented herein since the flow behavior within the injector was not considered in the current state of these studies. The 3D CAD model, Dassault Systèmes SolidWorks 2018, of the combustion chamber in
Figure 3 shows the orientation of the injector nozzle aiming at a counterclockwise jet.
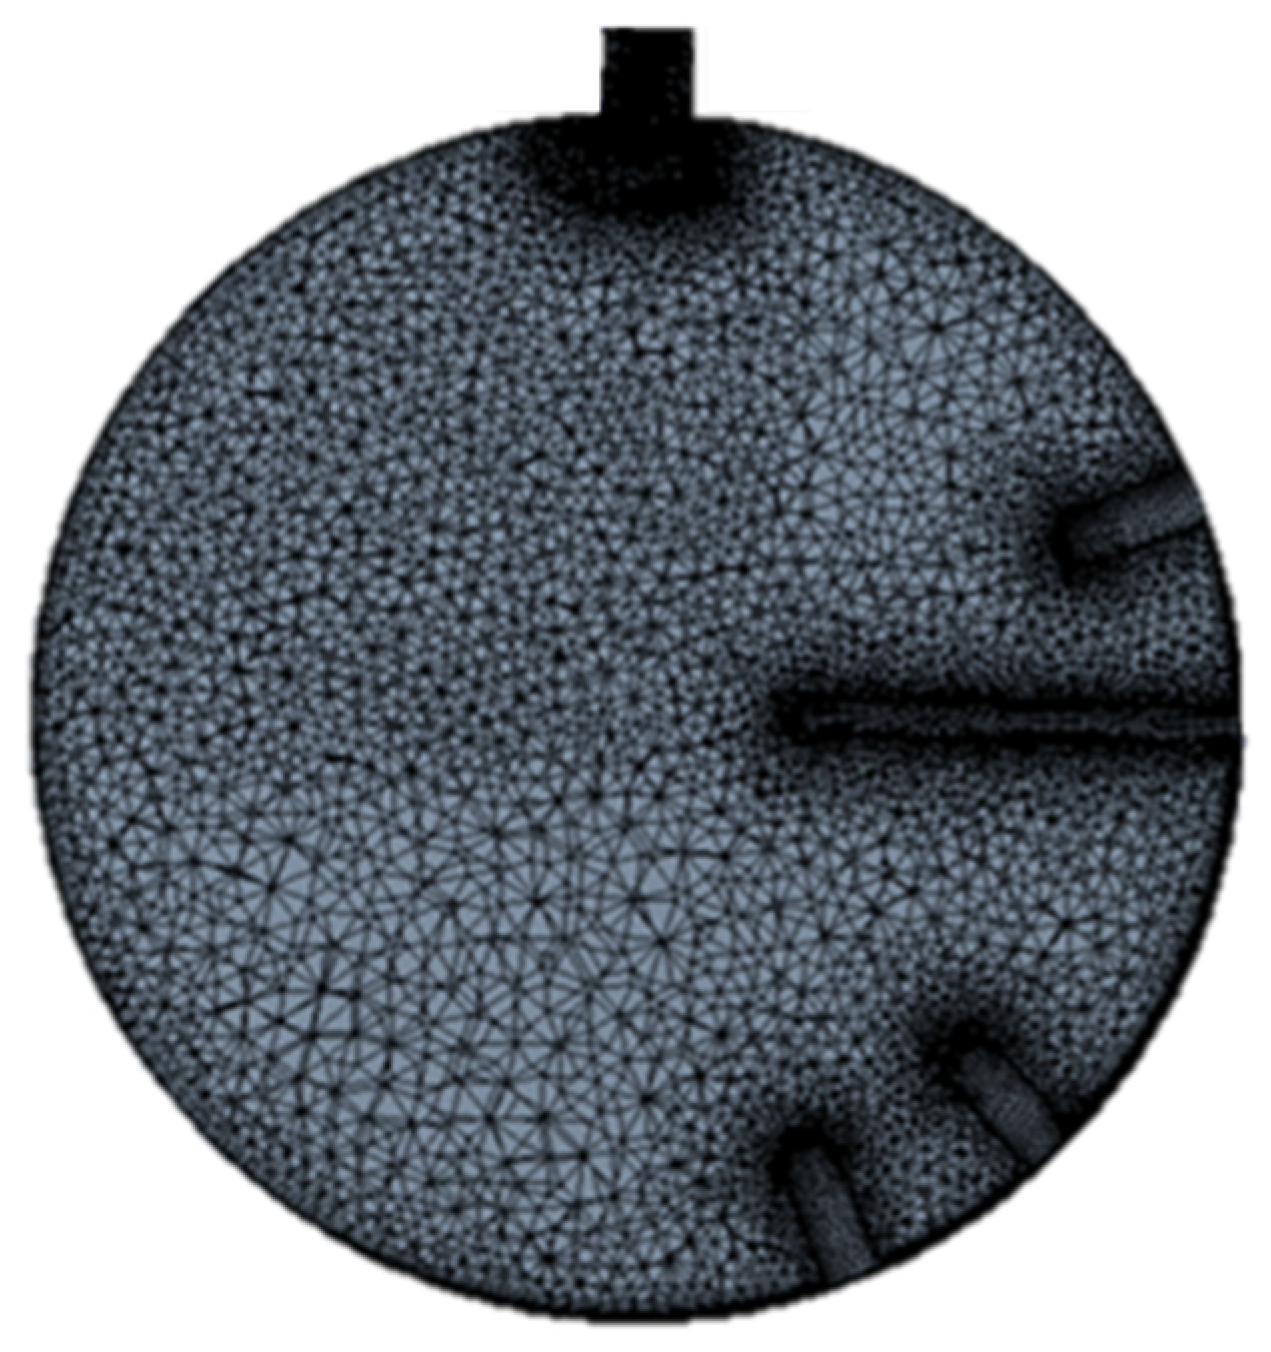
The geometry, in
Figure 4, was generated within the Space Claim environment of The Ansys Workbench 2022 R2, whereas the computational grid was built up using the Design Modeler tool. The computational domain was discretized in about 800,000 tetrahedral elements with a size ranging between 0.2 mm and 1.6 mm. Refinement regions with cell sizes of 0.2 mm were created within the injector and downstream of the 6 mm diameter nozzle, according to previous studies from the literature concerning numerical under-expanded jet validations [
13,
14].
For the current simulations, a U-RANS approach and a pressure-based solver were adopted. The species transport and the viscous model were activated in order to predict the injection behavior and the further mixture formation.
A Pressure-Implicit with Splitting of Operators (PISO) scheme was employed for coupling between pressure and velocity, while for the spatial derivatives discretization, a first order accurate upwind scheme was selected. A first order implicit scheme was chosen for the transient formulation, and a time step size of 1 × 10⁻⁵ s was set for the time discretization of both injections. Thus, with a 1.2 ms injection duration, the simulations were performed for at least 120 time-steps each, with a maximum number of iterations per time step equal to 40.
The following species transport equations were solved for all chemical species involved in the current simulations, namely H
2 and O
2 for the first injection and H
2, O
2 and H
2O for the second injection. Only nitrogen, the most abundant species, was not calculated with the following equation but was computed via subtraction instead.
Yi the mass fraction of the
i-th species, the rate of production due to chemical reaction (
Ri), and the user-defined source term (
Si) were neglected in the current case. Conversely,
Ji, the diffusive flux of the
i-th species, was computed from the following expression:
where
Dm,i is the mass diffusivity coefficient,
DT,I is the thermal diffusivity coefficient,
µT is the turbulent viscosity, and
Sc is the turbulent Schmidt number set constant and equal to 0.9 in this case. The mass diffusion coefficient for the
i-species of the multi-component mixture was computed as:
where
is the mole fraction of species
i, and
is the binary mass diffusion coefficient of component
i in component
j.
The k-ω based Shear Stress Transport Model (SST) was adopted for turbulence closure due to its robustness and its ability to accurately predict flow separation under adverse pressure gradients. Moreover, the transport of the turbulent shear stress provided in this model avoided possible overprediction of the eddy viscosity, which typically arises in other two-equations turbulence models.
3. Results
3.1. Hydrogen Injector Characterization
The results of the tests listed in
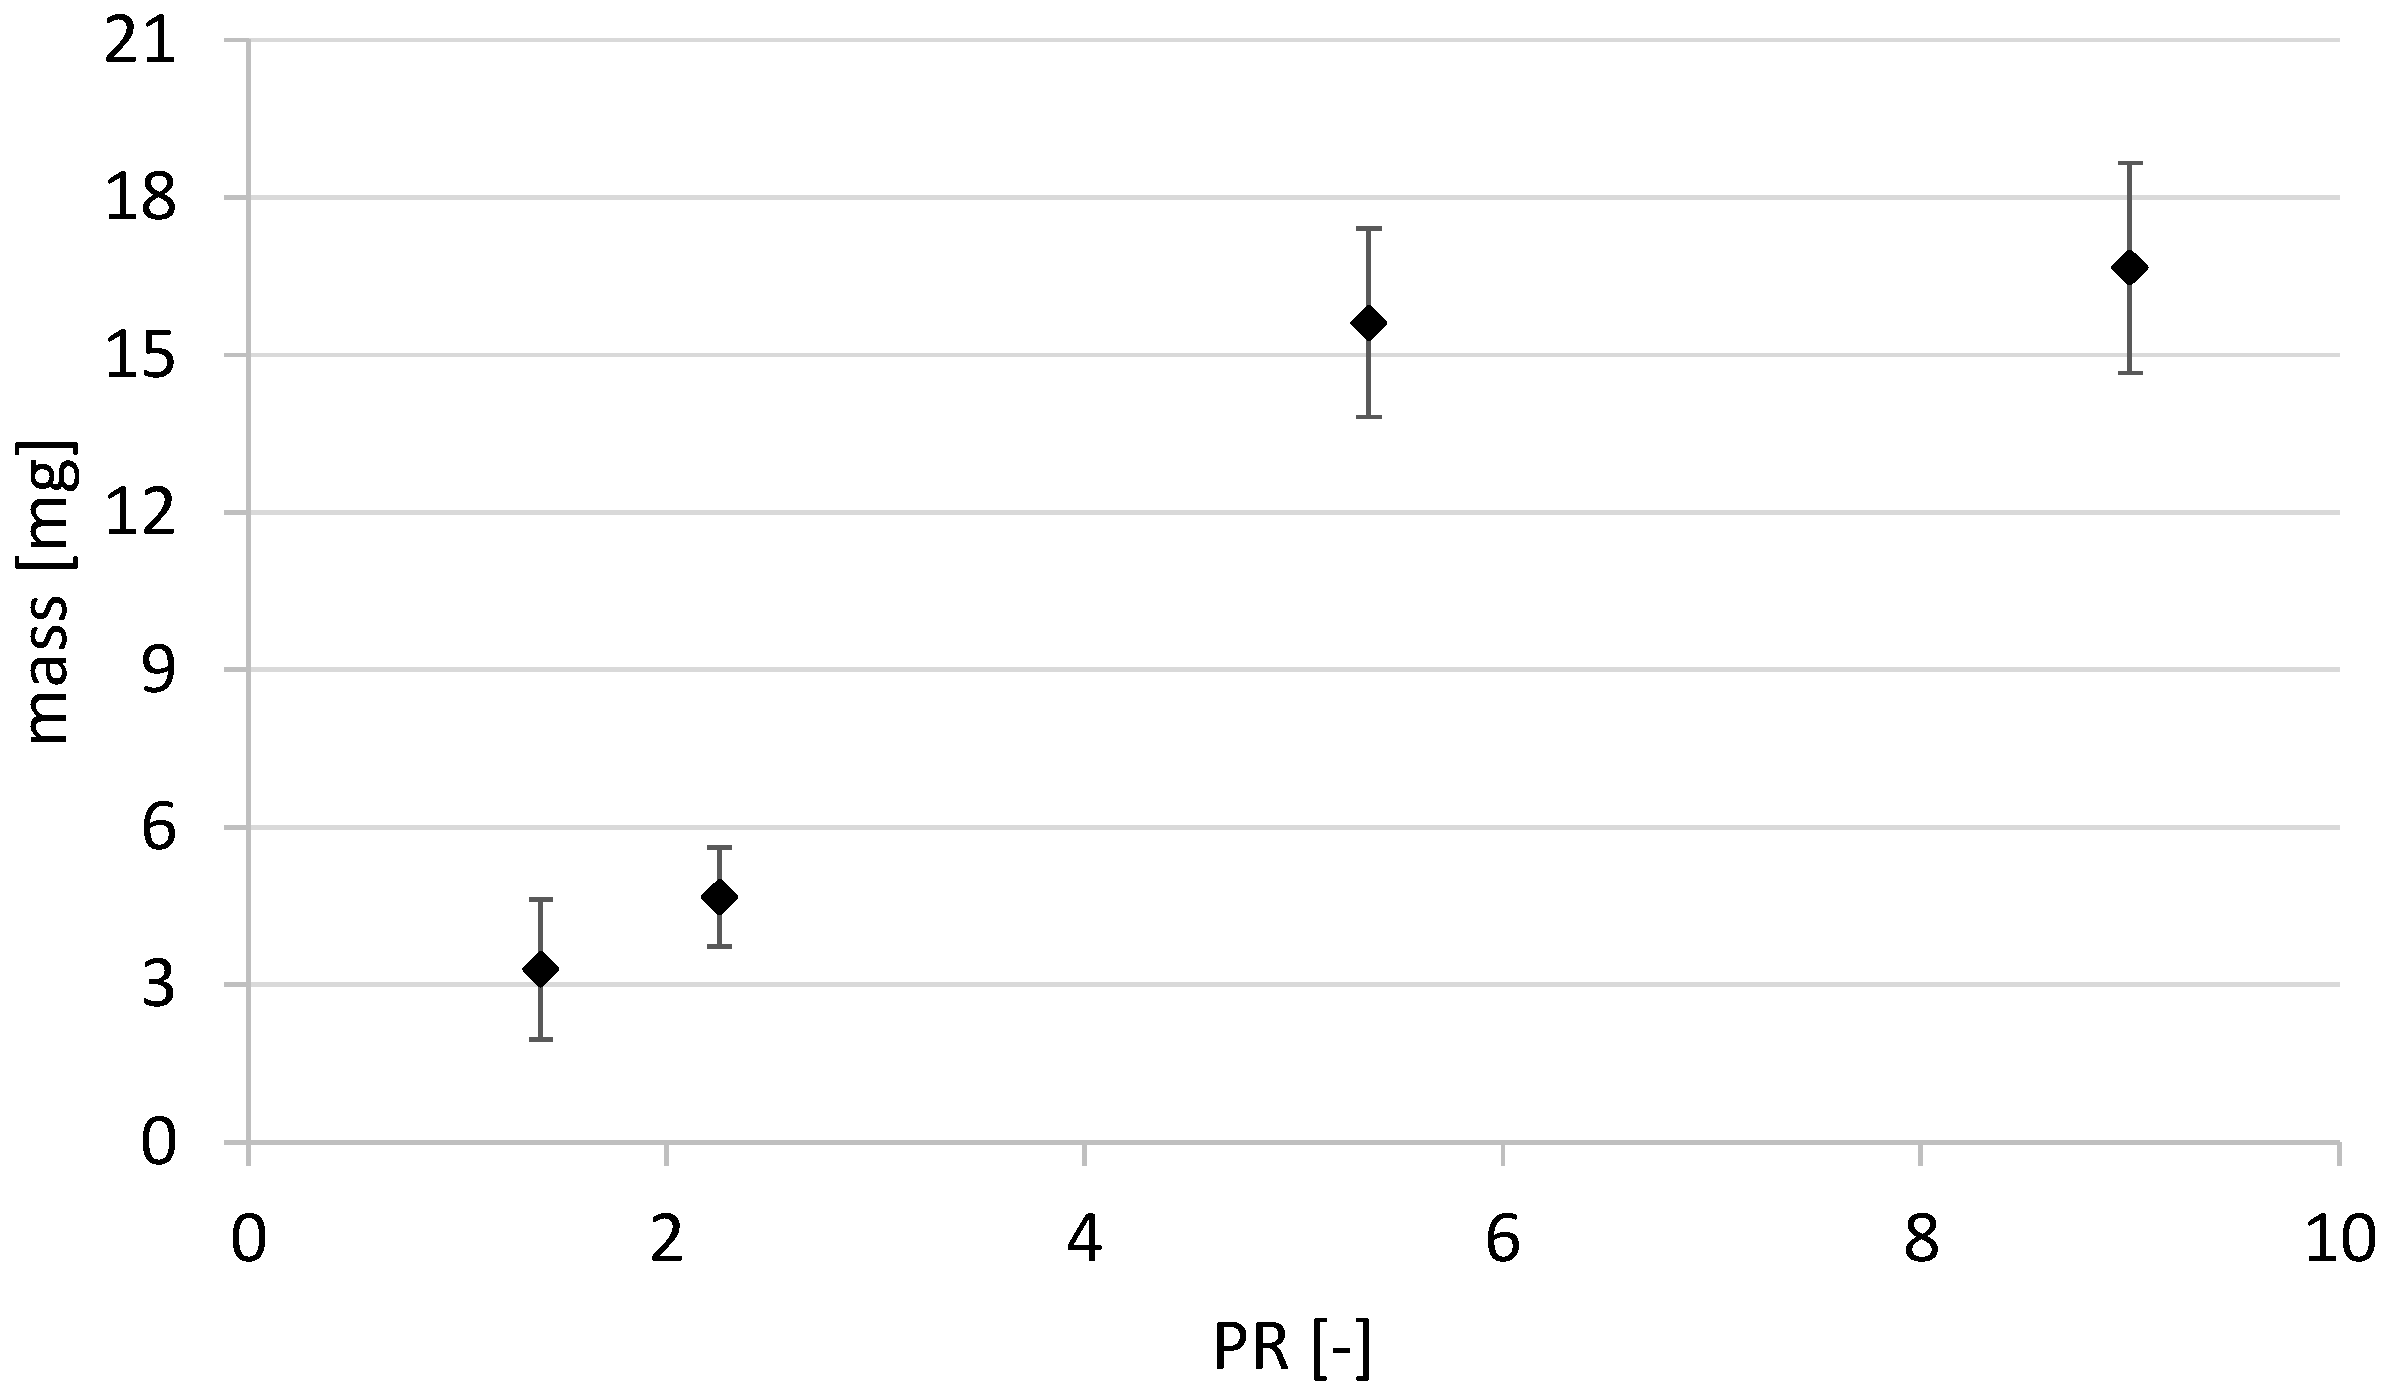
Table 1—performed based on the first test protocol—are grouped in the graph shown in
Figure 5. Here, the average hydrogen mass was plotted with the related standard deviation as a function of the pressure ratio PR. As expected, it was observed that the mass introduced increased with increasing PR. The increase was evident at low pressure ratios, while an asymptotic behavior was observed at high values of the pressure ratio. This trend was consistent with the behavior of compressible gas flow through the ducts of variable section.
It is underlined here that the values for injection pressure, backpressure and injection duration used during these tests were the same used during tests for autoignition and combustion characterization, which are described in the following paragraph.
3.2. Charge Preparation and Autoignition
To ensure the proper evolution of the autoignition process of hydrogen, control of the initial conditions was essential. The initial conditions in this experimental setup depended on the behavior of the first combustion of the initial air/hydrogen mixture ignited by a spark plug.
As previously described, the combustion chamber was initially filled with air at the desired final pressure in order to reach the right amount of air. This latter parameter was controlled by measuring partial pressure and temperature. Once the chamber was filled and sealed, the spark plug and injector were both triggered. However, the spark plug was operated only once so that only the first hydrogen injection was ignited (refer to
Figure 2). After the first combustion, it was possible to observe that the spark plug trigger was elapsed and the hydrogen introduced with subsequent injections, with a frequency of 20 Hz, autoignited due to the conditions, in terms of temperature and pressure, achieved in the CVCC after the first combustion.
Table 2 summarizes the parameters used for autoignition testing.
Although the flammability range for an air/hydrogen mixture is significantly broad (ranging from 4% to 75% by volume), it must be considered that after the combustion of the first injection, the CVCC was filled with residual air and combustion products. Therefore, the combustion of the following hydrogen injections was negatively affected by these boundary conditions. The air-fuel equivalence ratio was defined as:
where (
A/F)
act is the ratio between air and hydrogen mass actually filling the combustion chamber, while (
A/F)
st is the stoichiometric ratio between air and hydrogen, equal to 33.4. Of course, during the present experiments, the value of the equivalence ratio decreased due to the consumption of the air caused by the progressive combustion of hydrogen. For the first combustion process—triggered by the spark plug—the actual
A/F λ
1 was set equal to 2.62. With the assumption of perfect combustion, it was possible to derive the air-fuel equivalence ratio for successive autoignition events (λ
2 = 2.2, λ
3 = 1.2, λ
4 = 0.2 and λ
5 has not been estimated). The other hydrogen injections occurred during the decreasing phase of in-CVCC pressure, particularly when the flame of the first combustion was extinguished.
From
Figure 2, it is possible to observe the preassure peaks due to the autoignition and combustion of the hydrogen injection events (t
2 ≈ 350 ms, t
3 = 410 ms, t
4 = 460 ms and t
5 = 500 ms. These phenomena were also observed through the images acquired with the high-speed camera; it was noted that the hydrogen autoignited near the injection area, and flame development was observed as well, possibly due to the in-CVCC temperature and pressure conditions—higher than autoignition—or to the presence of a hot spot near the injection area due to the previous combustion events.
A series of frames for the test shown in
Figure 2 is depicted below. Each combustion event was represented for every 3 ms interval, and each column represented a combustion event at 50 ms intervals. The first column shows the combustion process triggered by the spark plug, while the other columns represent the autoignition process of the hydrogen injected during the second, third and forth injections. Images related to the fifth injection were not shown because nothing related to combustion was visible in them.
From
Figure 6, it was possible to note how the combustion process triggered by the spark plug exhibited the highest light radiation mainly due to the presence of fresh air. The following hydrogen autoignition processes occurred near the injection exit, and the following combustion process was gradually slower and with a lower light radiation. In particular, the camera hardly captured the combustion associated with the fourth hydrogen injection. As previously discussed, during this injection, λ
4 = 0.2, which means that the residual air from previous combustion processes was not enough for the complete combustion of the hydrogen injected.
3.3. Numerical Results
The test cases selected for numerical data exploitation were the experiments conducted on the spark-ignited injection characterized by an in-CVCC initial pressure of 1.6 bar and the following autoignited injection performed after the previous combustion event, when the in-CVCC pressure was equal to 6.7 bar. Because the present CFD contribution was aiming only at the mixture formation, as a predictive tool of the in-CVCC conditions before autoignition, spark-ignited combustion was not simulated.
The injection pressure was constant for both the simulated injections and equal to 15 bar, thus leading to pressure ratios of 9.375 and 2.3, respectively, for the two aforementioned in-chamber initial pressures. The second injection event occurred after spark-ignited combustion; therefore, the in-chamber initial conditions when the second injection was performed significantly differently from those of the first injection in terms of backpressure and temperature. The initial conditions are reported in
Table 3 and were determined experimentally by means of a pressure sensor and a thermocouple, as described in the previous section. The delay between the two consecutive injections was constant and equal to 50 ms, and the duration of each injection was set to 1.2 ms.
The boundary conditions imposed for the spark plugs, the injector cap and the pressure sensor were wall boundary conditions, and the temperature assigned for each of them was equal to 25 °C and 556.85 °C, respectively, for the first and second injections, according to the experimental data provided. Such temperatures were also employed as the initial values of the in-chamber volume conditions. Similarly, the operating pressure adopted for the domain initialization was set to 1.6 bar for the first injection and equal to 6.7 bar for the second injection.
A mass flow inlet boundary condition was assigned on the inlet surface of the hydrogen injector. The injection profile was defined after the experimental characterization of the injection, which provided for the total amount of hydrogen delivered for different values of the in-chamber backpressure. This led to hydrogen mass flows of 13.88 g/s and 3.89 g/s for the spark-ignited and auto ignited injections, respectively.
Given the mass flow profile, the computed hydrogen mass injected during the first injection of 1.2 ms was equal to 16.659 mg, as expected from the experimental tests. The increase in the in-chamber backpressure due to the hydrogen injected amounted to 0.7 bar instead of the 0.5 bar measured experimentally. This author correlated the discrepancy between the experimental and numerical results to the small aforementioned leakages, although the overestimated numerical increase in backpressure did not significantly influence the overall jet behavior.
Despite the computation being in good agreement with the analogous result calculated via the perfect gas equation of state (1), further investigations on the CFD evaluations will be necessary in order to assess the exact conditions of the in-chamber pressure and temperature, taking into account the possible leakages and thermal exchanges within the walls to model the spark-ignited combustion and to characterize the autoignition phenomenon.
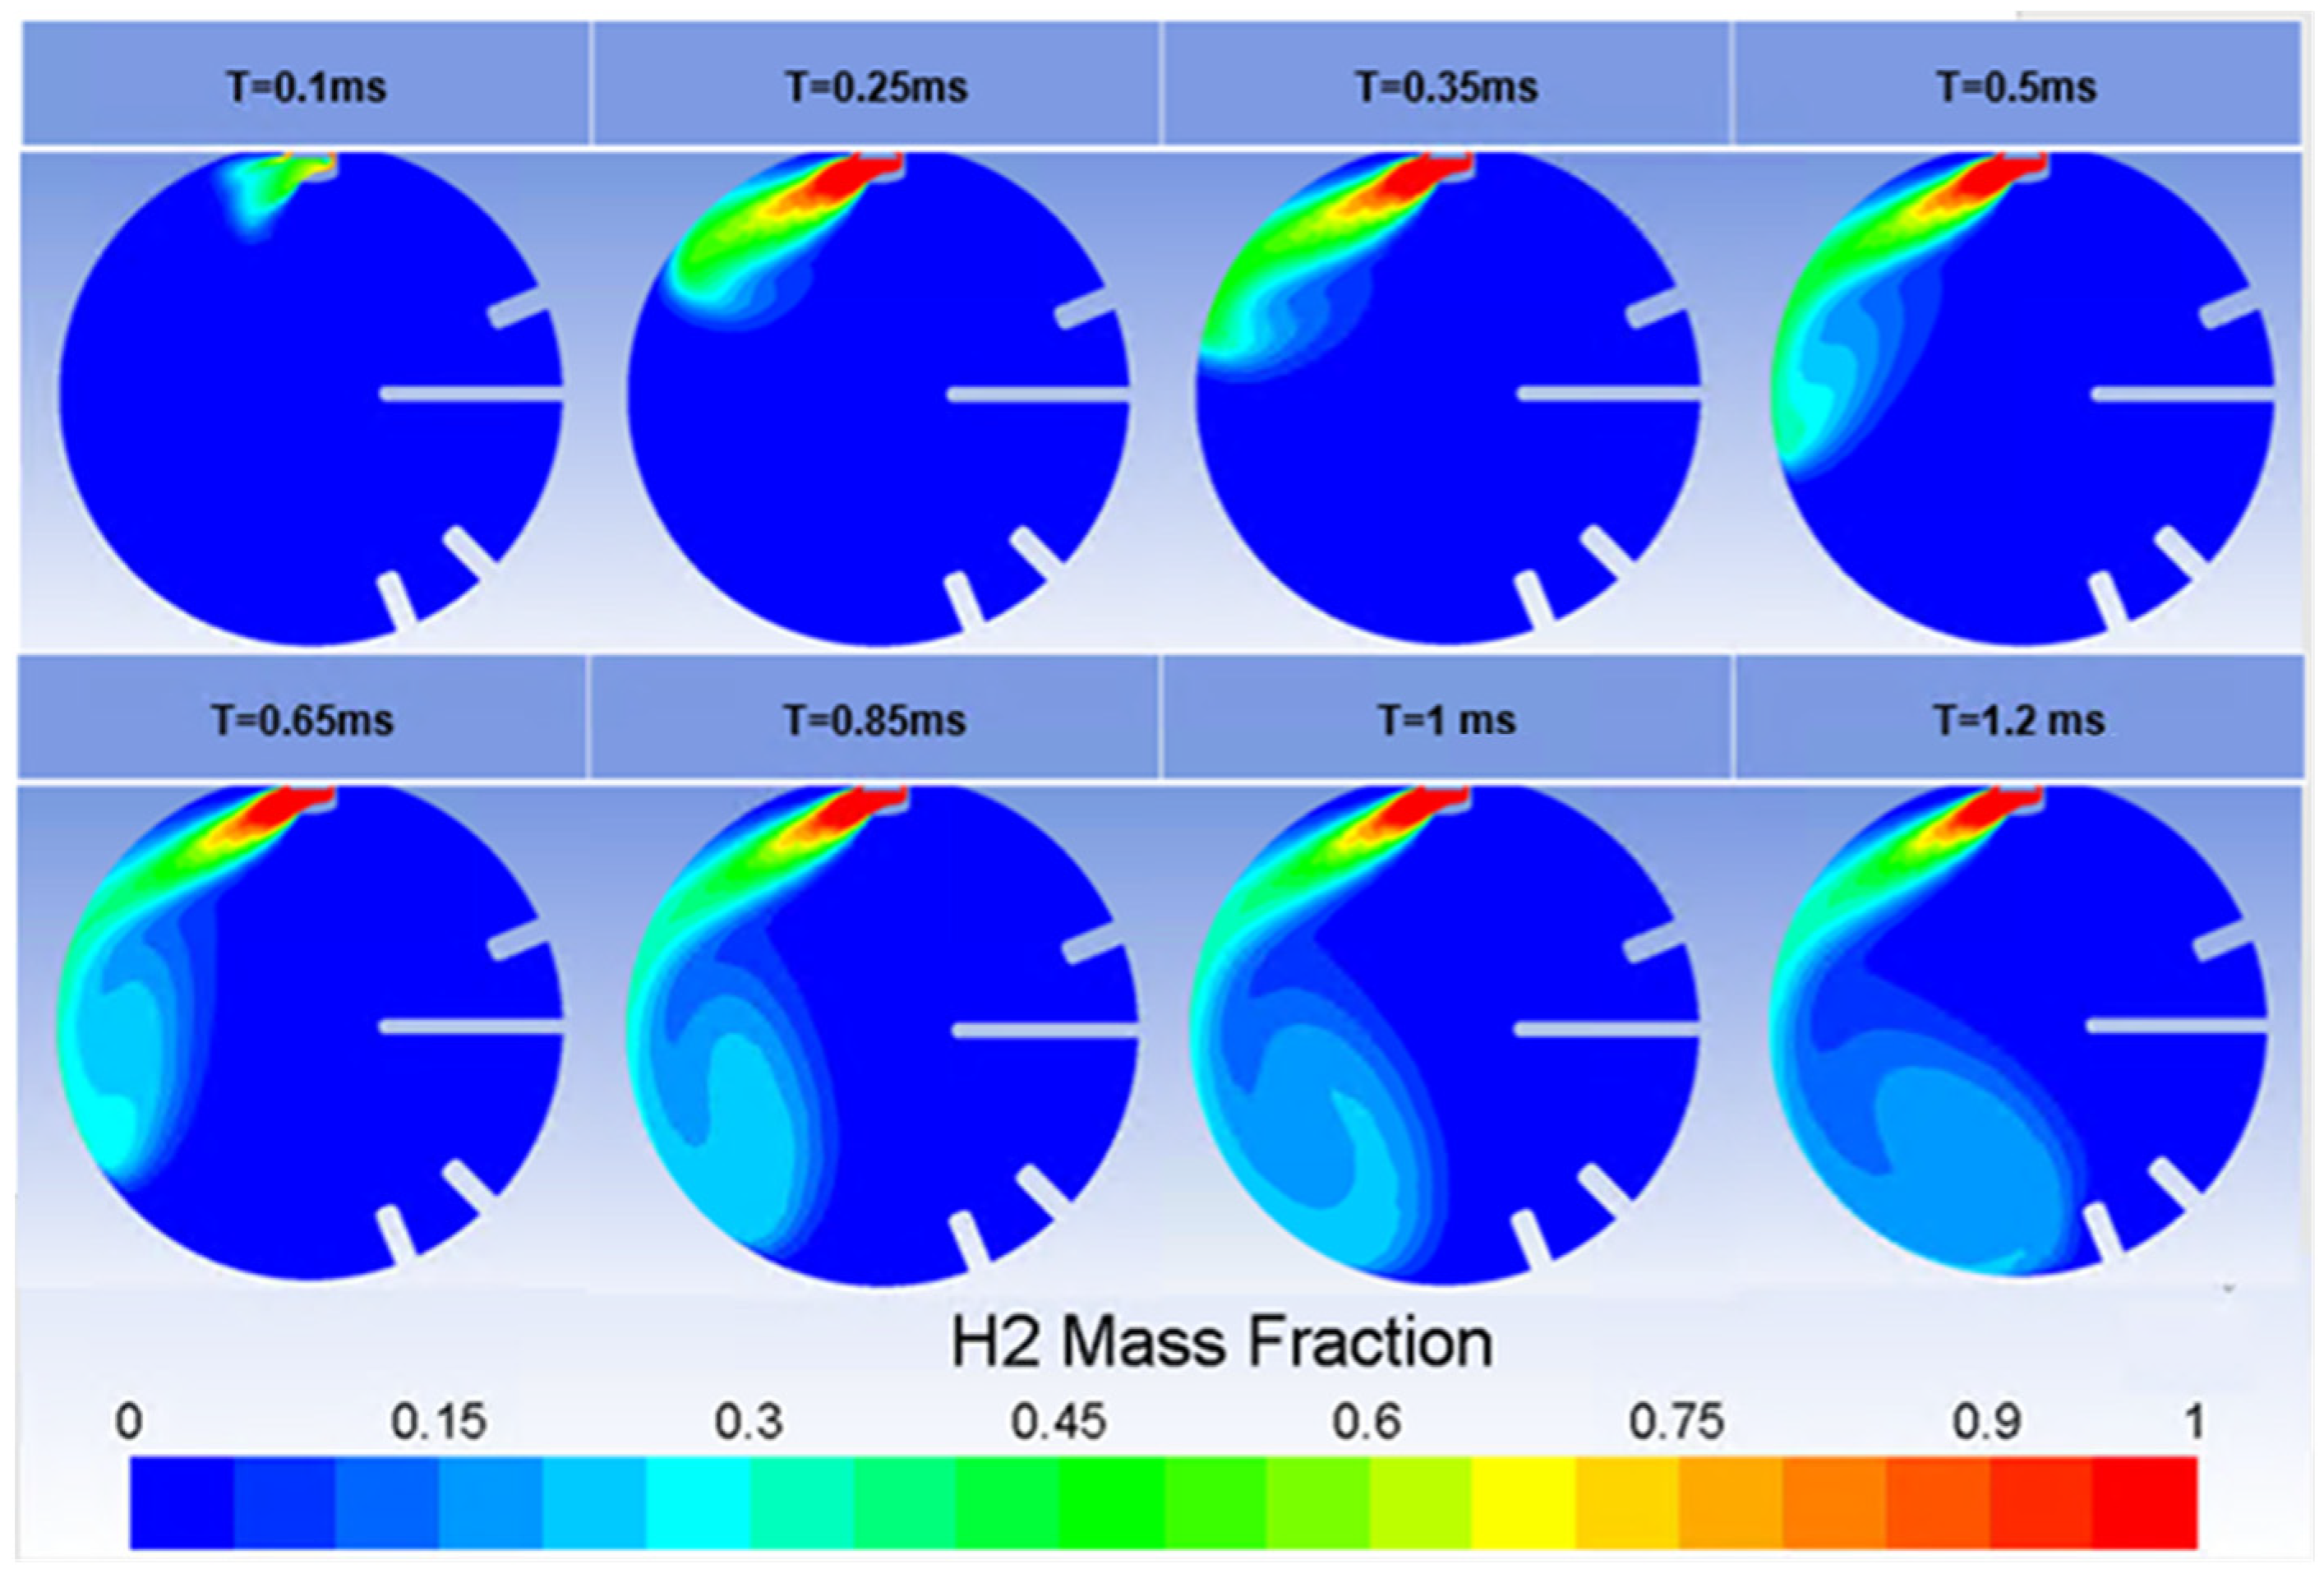
Figure 7 displays the H
2 distribution at different timings by means of contours of the hydrogen mass fraction in the chamber cross-sectional plane. The evolution of the air–fuel mixture was represented from the start until the end of injection at 1.2 ms.
The color scale adopted was identical for all represented frames. Initial conditions of 1.6 bar for the in-chamber pressure and 15 bar for injection pressure allowed for a significant fuel penetration reached at the end of the injection. As the jet entered the chamber, the core structure of unmixed hydrogen formed after 0.25 ms and remained focused due to the presence of a single hole on the injector cap. Thus, the jet was strongly directed against the chamber walls, and as can be seen at 0.35 ms, it was then redirected downstream. Air entrainment only occurred after the jet impinged the chamber walls, thus losing its momentum. From the beginning of the tip vortex interaction with the chamber at 0.5 ms, the penetration depth increased less intensively, and the entrainment region expanded circumferentially around the vortex during the rest of the injection due to wall friction.
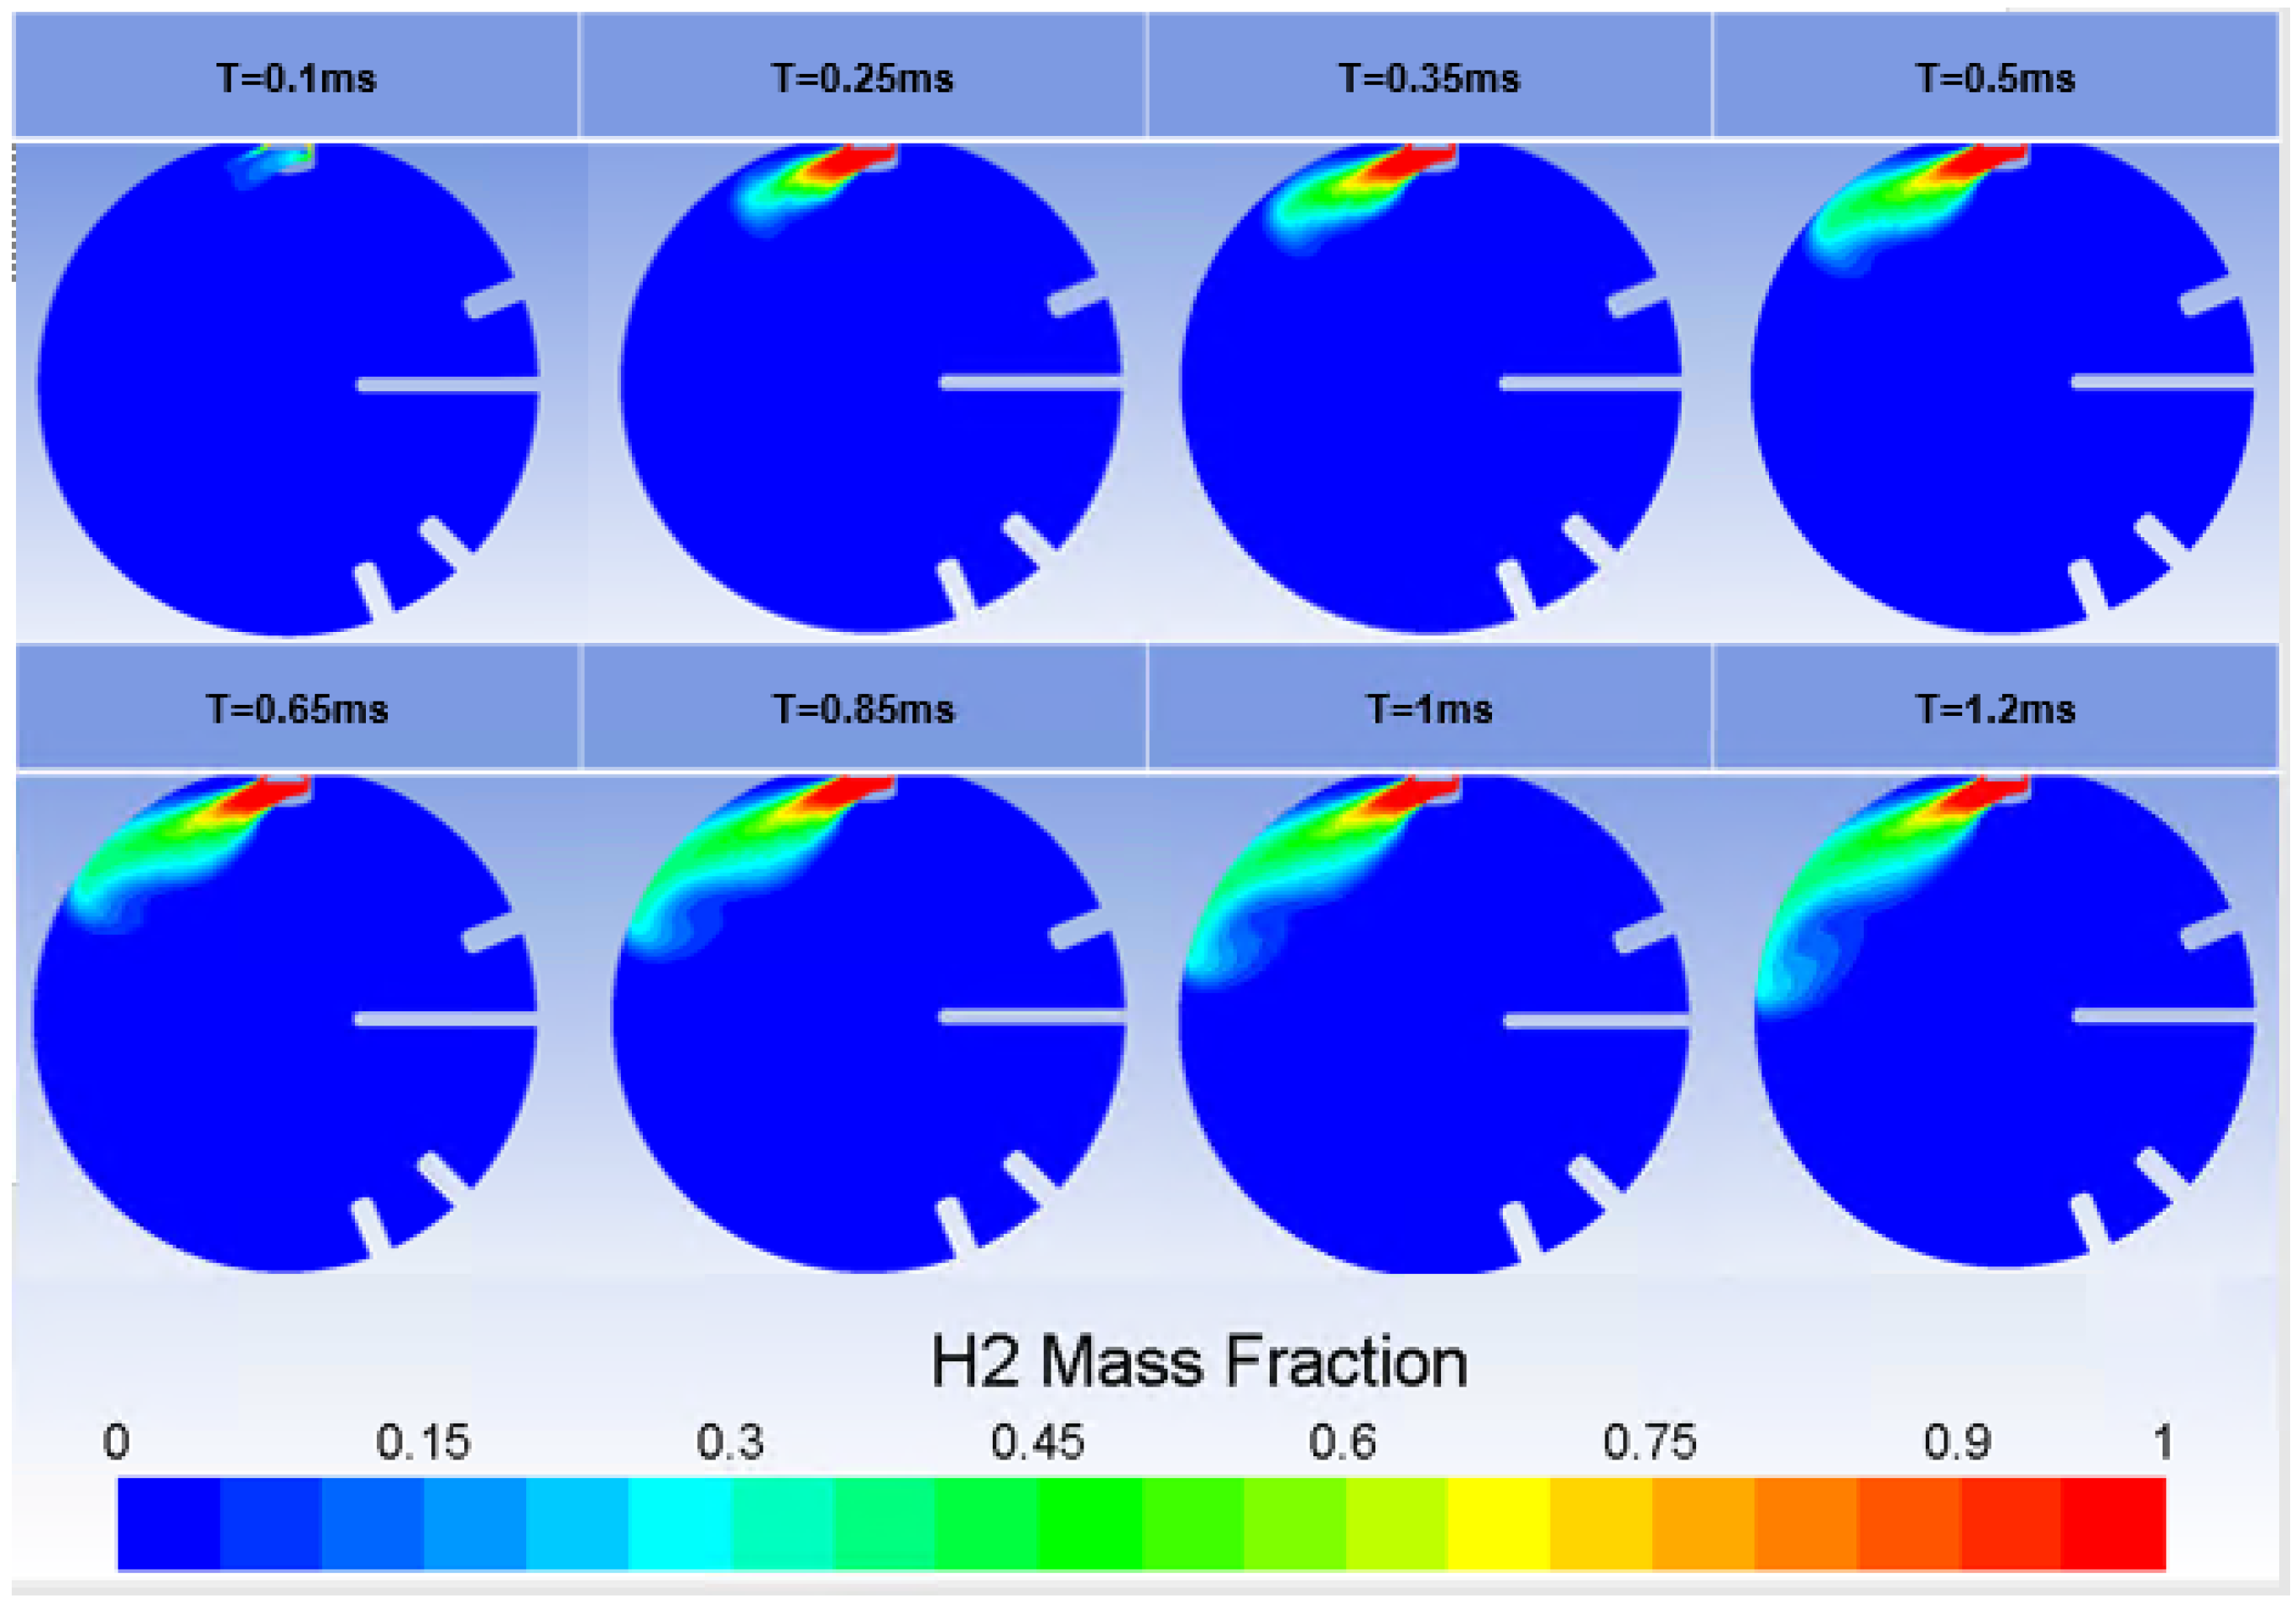
Figure 8 shows the contours of the hydrogen mass fraction during the second injection when the in-chamber pressure was equal to 6.7 bar, and the temperature reached 556.85 °C after the spark-ignited combustion of the H
2 injected during the first injection.
Computations of the second injection were initialized based on the calculation of the residual species from the previous combustion event, given the hydrogen-injected mass, the air mass and the temperature reached during the combustion process experimentally determined, as reported in
Figure 8.
Compared to the first injection, the higher counterpressure inside the chamber decreased the penetration of the issued jet. Despite the jet core exhibiting the same nature, due to the jet forming cap, which enhanced a focused structure rather than a hollow cone, the jet tip vortex development was indeed less prominent. The mass flow profile imposed was adapted according to the experimental results conducted at different pressure ratios.
Nevertheless, the cone angle depicted downstream of the nozzle exit area for the second injection was preserved, as clearly observed at T = 0.5 ms after Start of injection (SOI). The effect of the counterpressure on the mixture formation was highlighted during the later stages of the injection, namely after 0.65 ms, when the jet interacted with the chamber walls. The magnitude of the tip vortex generated after the jet impinged the chamber walls was indeed less pronounced compared to the previous injection performed at a higher pressure ratio. Thus, less air entrainment and diffusivity effects were observed. Towards the end of the injection, the jet still showed a strongly stratified structure with a significant hydrogen concentration along the plume in the near-end region. The mass fraction distribution of hydrogen inside the chamber computed via Ansys Fluent was in good agreement with optically accessible experiments where the autoignition phenomenon was encountered for a rich condition of the mixture in the injection region.
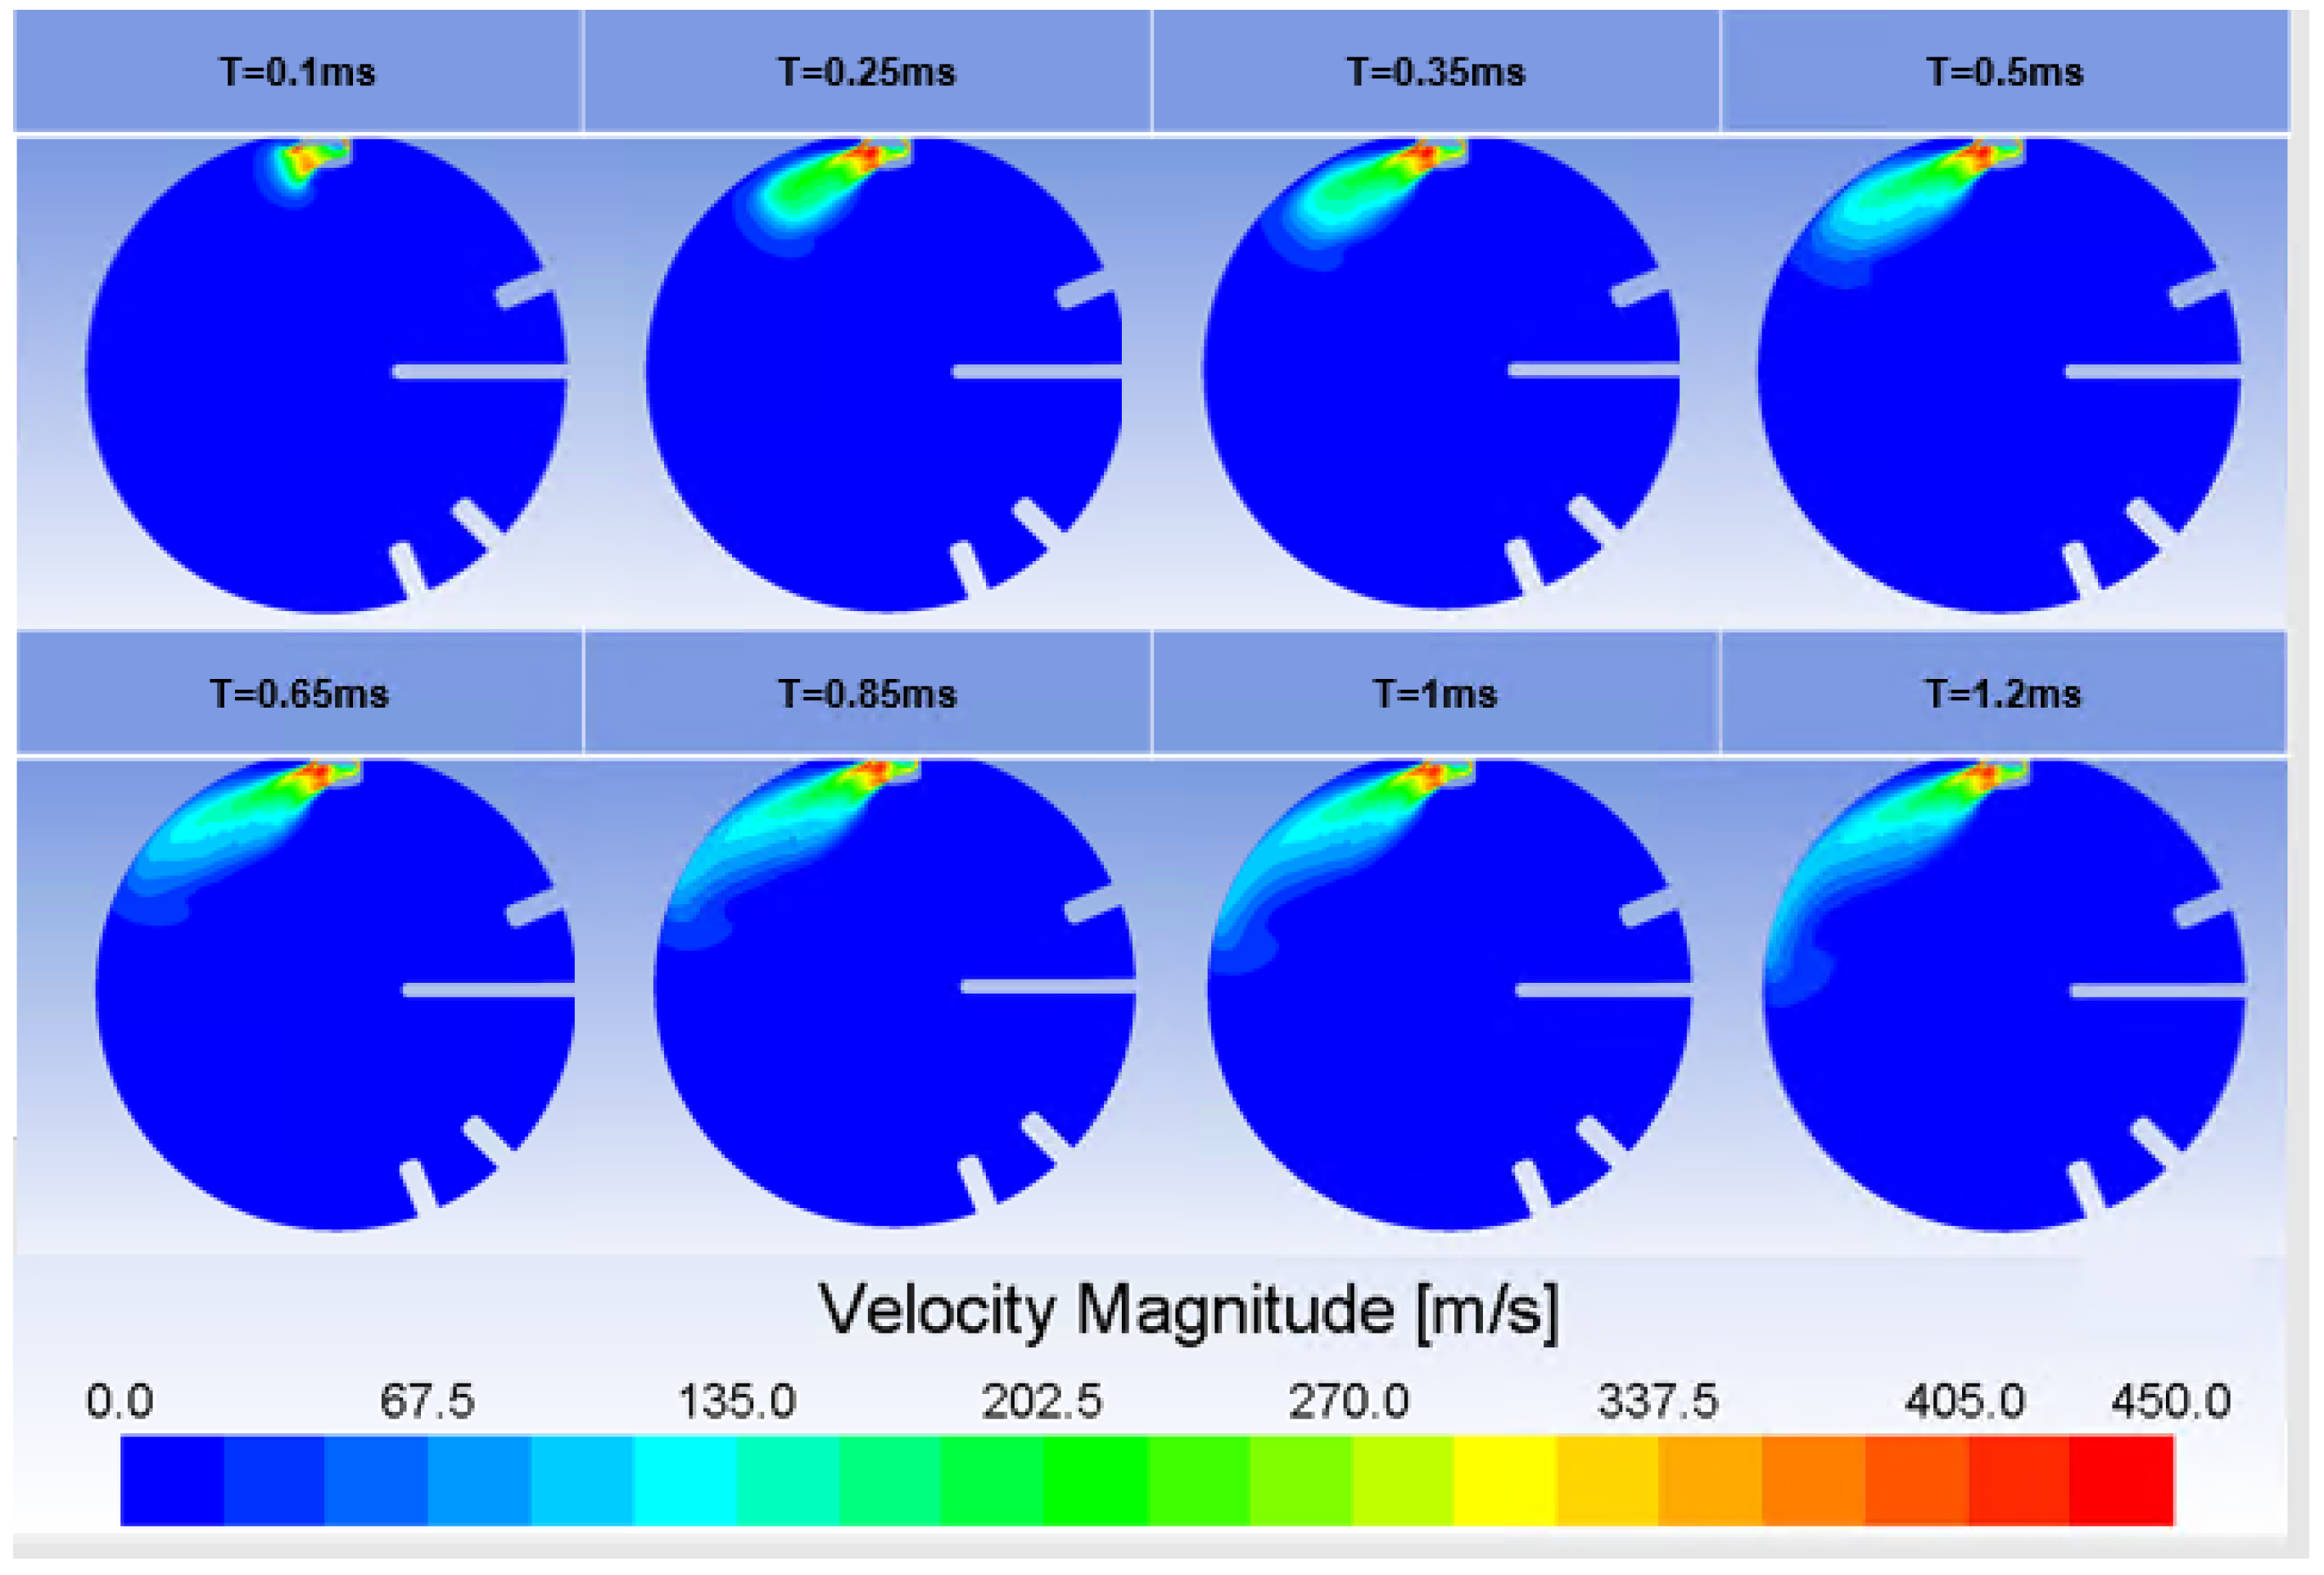
Figure 9 reports the contours of velocity magnitude with the same time scale adopted for the contours of hydrogen mass fraction depicted in
Figure 10.
At T = 0.25 ms downstream of the injector nozzle exit area, a high velocity region was located, although the velocity field could not be considered uniform along the nozzle cross-sectional area. In this particular configuration, giving a pressure ratio below the value of four, the jet was not under-expanded, and therefore, despite the strong expansion and acceleration expected downstream of the nozzle, no Mach discs structure or sonic regions were exhibited. Moreover, the jet-forming cap strongly influenced the issued jet in terms of redirection inside the dead volume of the cap, therefore promoting a non-symmetric velocity distribution of the issued jet.
As the jet approached the chamber wall at T = 0.65 ms, a decrease in velocity magnitude was registered and a small vortex was generated by the jet interacting with the chamber. The observed velocity decreased due to the jet redirection, and the wall friction was consistent with the first injection behavior. Additionally, in this case, the hydrogen–air mixing process taking place near the tip vortex was mainly due to the jet losing its momentum, with a subsequent enhancement of air entrainment, although the stronger counter pressure led to a weak mixing of air and hydrogen in a correspondent region.
Mixing effects related to the counter pressure inhibiting the air entrainment were also visible in
Figure 10, where the contours of total temperature are shown in a color scale ranging from 300 K to 830 K, the hydrogen temperature at injection timing and the in-chamber temperature after the spark-ignited combustion.
Towards the end of the injection, at T = 1.2 ms, due to the low mixing effect associated with the high counter pressure, thermal diffusivity was constrained to the end-region of the hydrogen plume where temperatures reached values between 650 K and 780 K. In the same region, contours of the hydrogen mass fraction, shown in
Figure 10, assumed values between 0.2 and 0.3, corresponding to the rich conditions achieved when the autoignition event occurred.
4. Discussion
In this work, a combined experimental/numerical activity was conducted, which included an experimental campaign in which the obtained results were numerically reproduced. In particular, in the first experimental campaign, the hydrogen mass injected by a heavy duty piezoelectric single-hole injector was estimated measuring the related pressure increase into the CVCC through the perfect gas state equation. In the second test rig, on the other hand, attention was focused on the autoignition process of hydrogen injection, specifically in achieving the boundary conditions at which the hydrogen spontaneously autoignited after the injection event. In order to achieve autoignition conditions, an initial combustion event of air and hydrogen mixture, in lean conditions, triggered by a spark plug was required. In this way, it was possible to perform a series of injections, with known mass rate obtained from the first experiment, synchronized with the first combustion process. It was observed that the introduced hydrogen, mixing with residual air from previous combustion events, autoignited near the injection point.
To better characterize the autoignition and combustion processes in terms of charge and temperature distribution, a numerical model was further defined using a 3D CFD approach. The jet behavior is well captured, such that the numerical results are in good agreement with the experimental data provided in terms of in-chamber boundary conditions before the spark ignited combustion and the subsequent autoignition. In the first injection simulation, an extensive mixing process was captured. The hydrogen mixture fraction evolution in time describes the strong wall–jet interaction, which leads to a recirculation zone formation. This phenomenon enhances air entrainment and determines the lean-homogeneous charge conditions described in the experimental results. On the other hand, in the second injection simulation, the effects of the high in-chamber backpressure inhibiting jet penetration and hydrogen diffusion highlight a stratified heated mixture near the injection area when autoignition occurs, in agreement with the optical experimental results.
