
The Green Effects of Industrial Policy—Evidence from China’s New Energy Vehicle Subsidies


Abstract
:1. Introduction
2. Background and Theoretical Hypothesis
2.1. Background
- In the early stages of industry development, major charging infrastructure companies aggressively staked their claims and operated independently, leading to an unreasonable layout of charging facilities. Issues like incompatible charging interfaces, communication protocols, and payment methods remain. Although the country has mandated standard interfaces and communication protocols, interoperability issues still exist between different charging stations and between charging stations and vehicles. New energy vehicle owners have to download and use multiple apps from different operators for charging, which is cumbersome and time-consuming.
- Installing charging stations in residential areas, especially in old communities within the older parts of cities, is a challenge. These areas often lack the necessary land and electrical capacity, leading some new energy vehicle owners to rely on makeshift wiring solutions, which are inefficient and pose significant safety risks.
- Charging infrastructure companies face difficulties in achieving profitability and have yet to find a suitable business model. Initial investments for infrastructure development are high, and the benefits extend beyond the operators (positive externalities). Currently, the main revenue for operators comes from charging service fees, which often do not cover costs.
- Building charging stations requires collaboration with various departments, such as land management, electricity providers, property management, and fire departments. Differing objectives and interests among these departments can slow down construction and require significant resources to navigate inter-departmental relations.
2.2. Theoretical Hypothesis
3. Materials and Methods
3.1. Data
3.2. Descriptive Statistics
3.3. Identification Strategies
3.4. Robustness
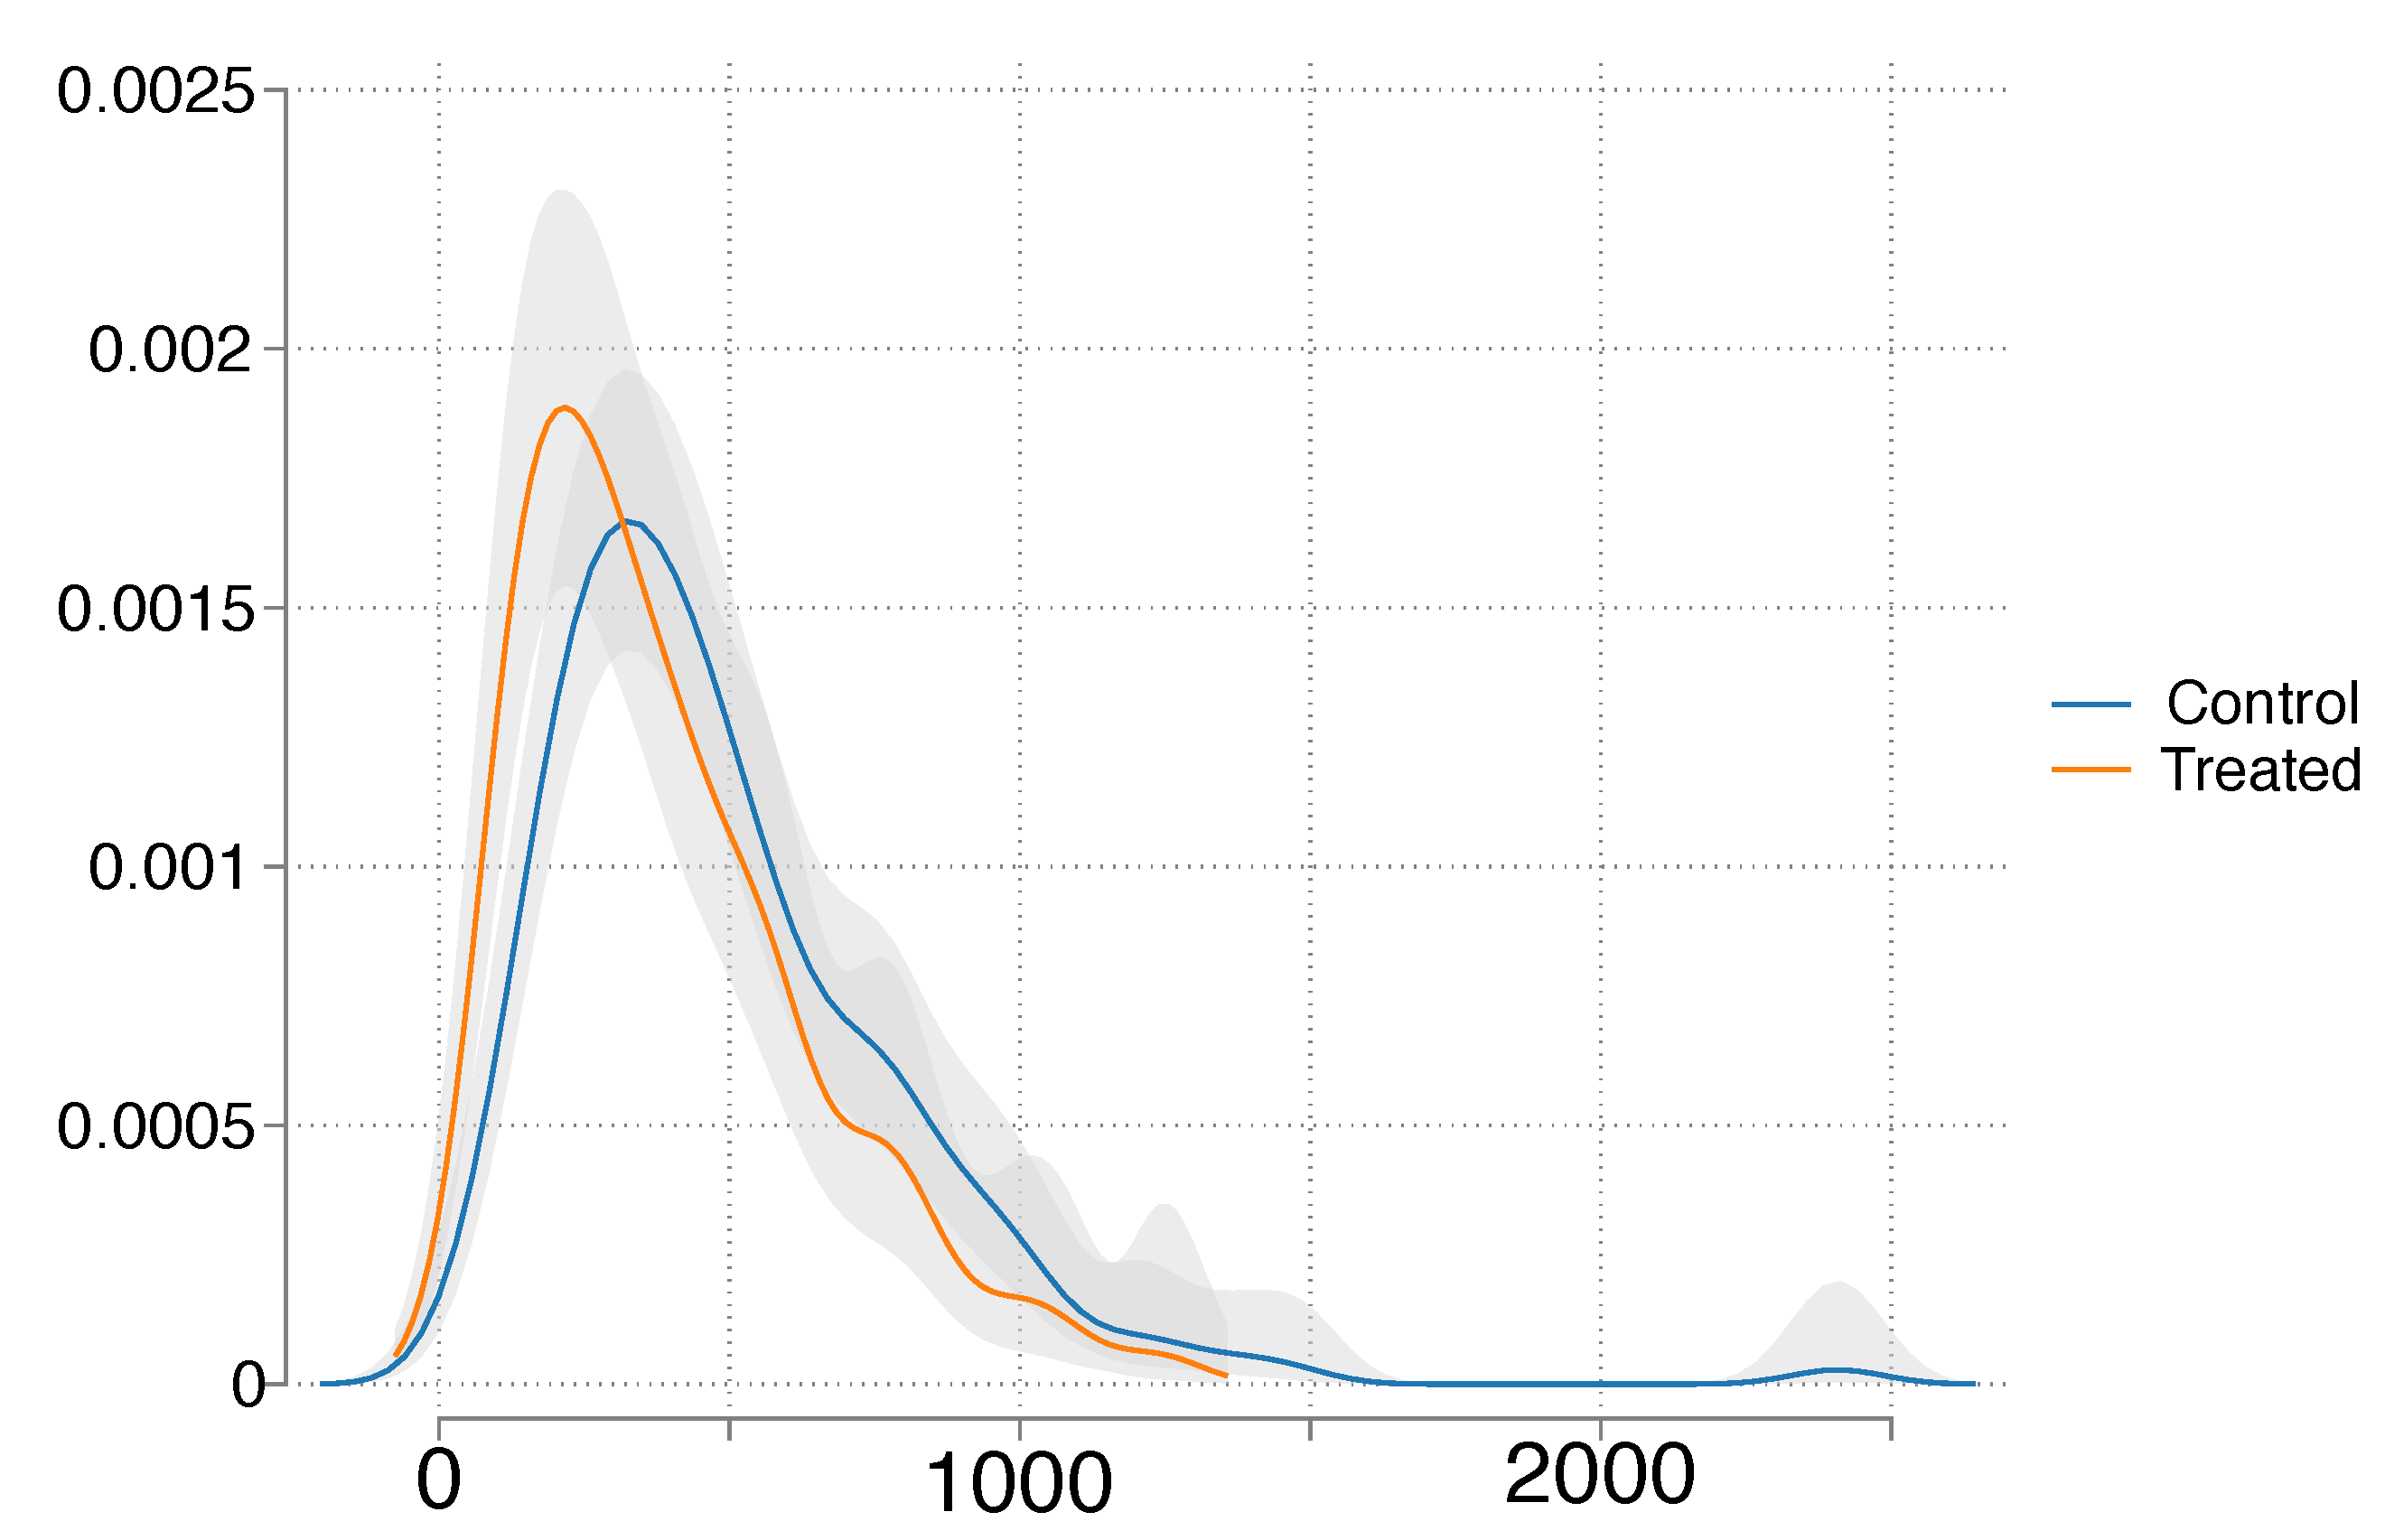
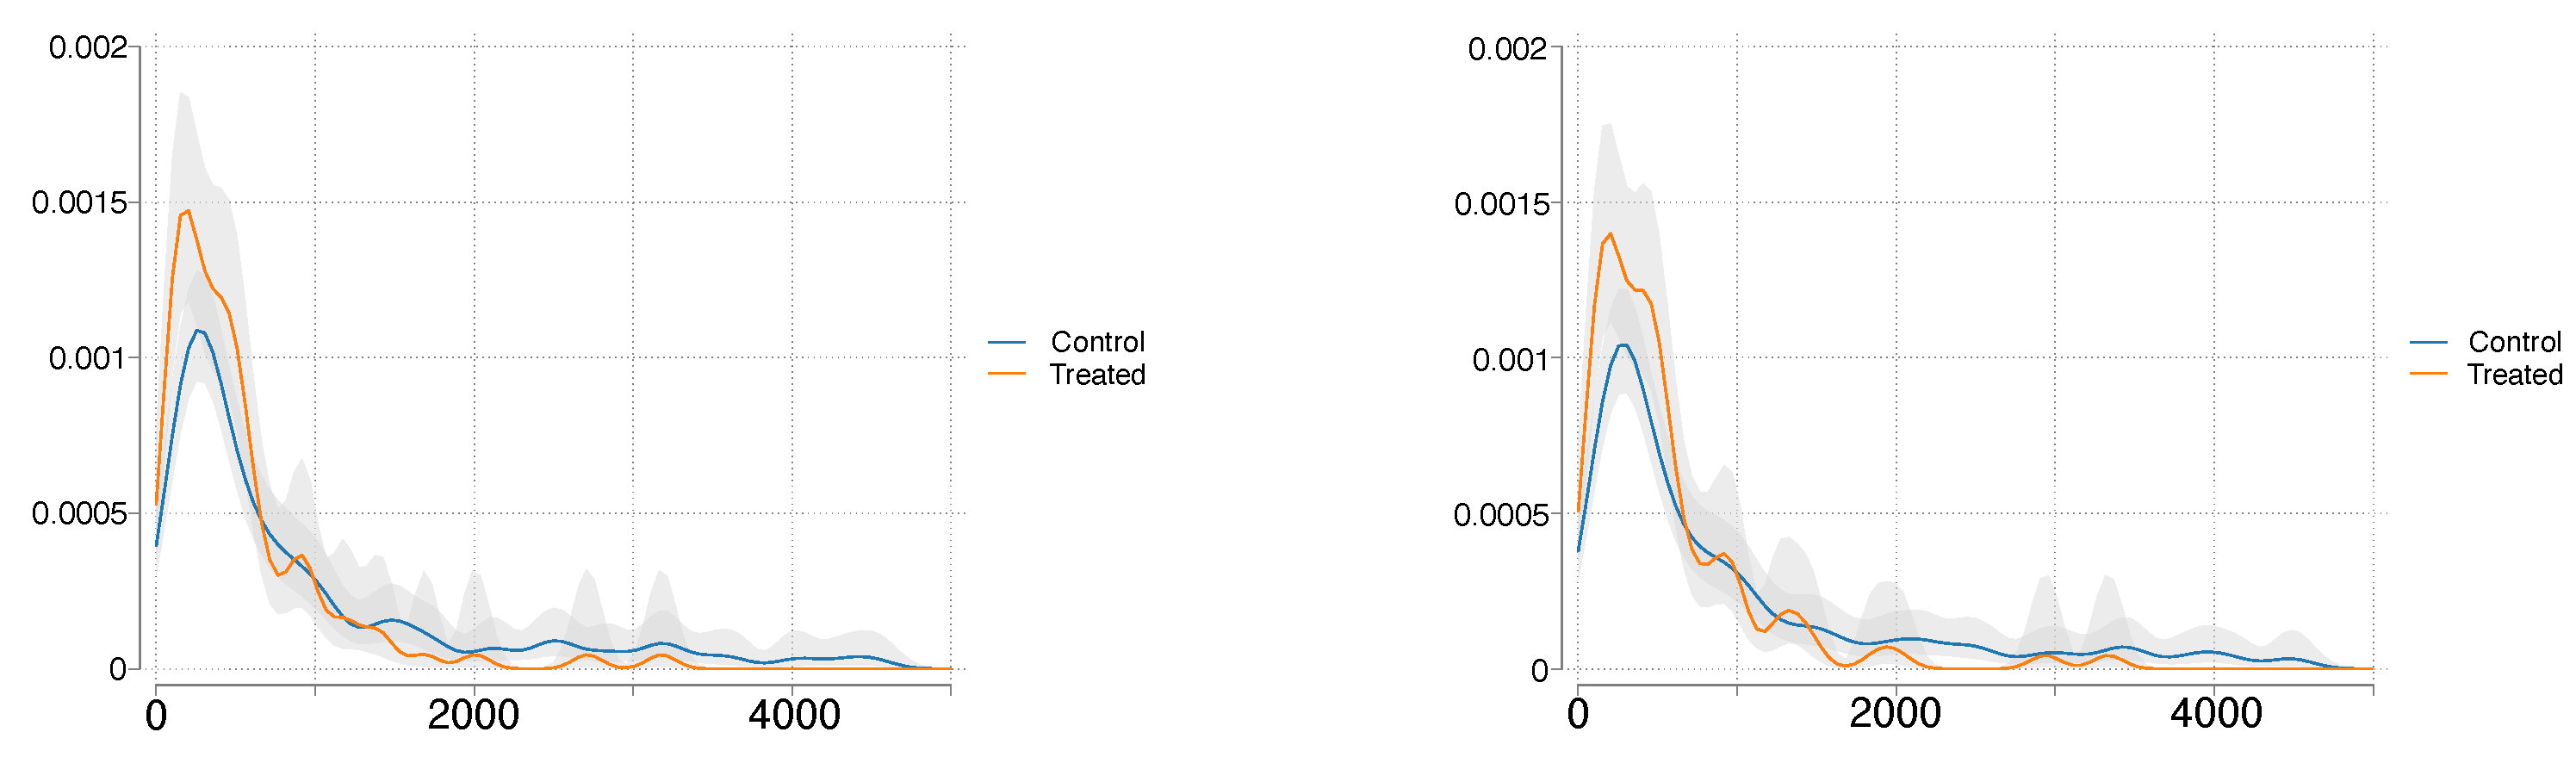
3.4.1. Alternative Treated and Control Groups
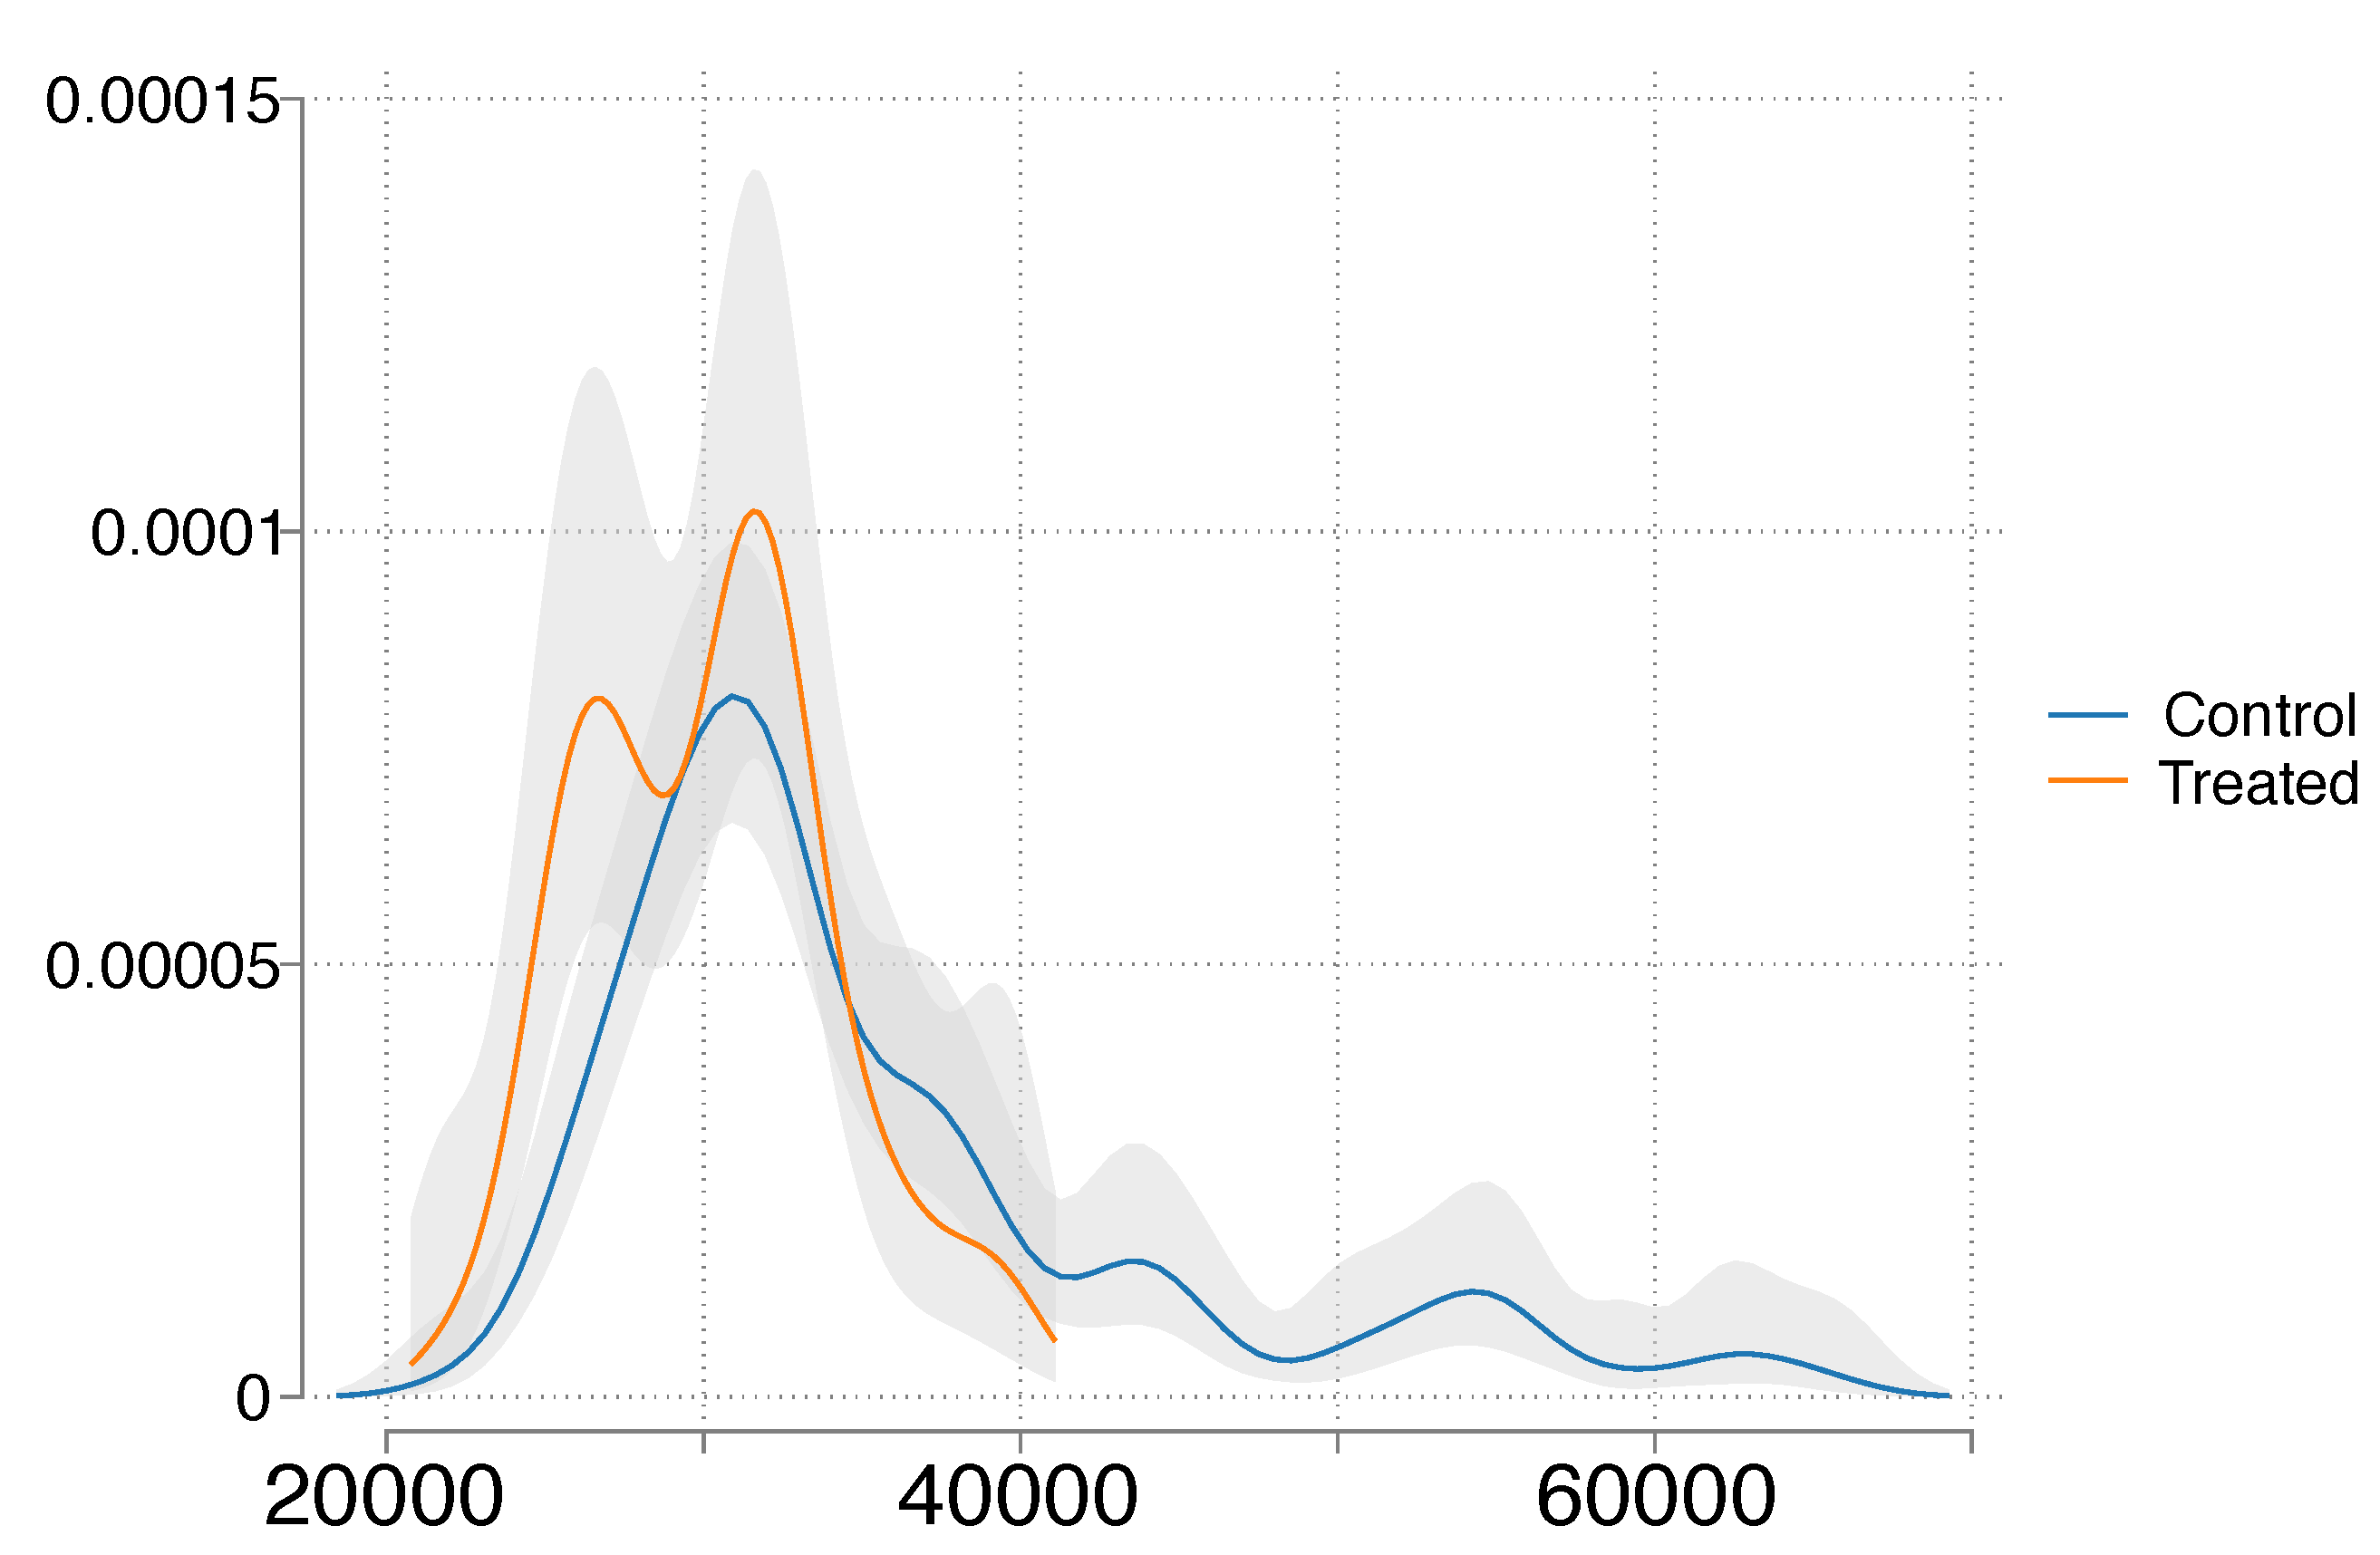
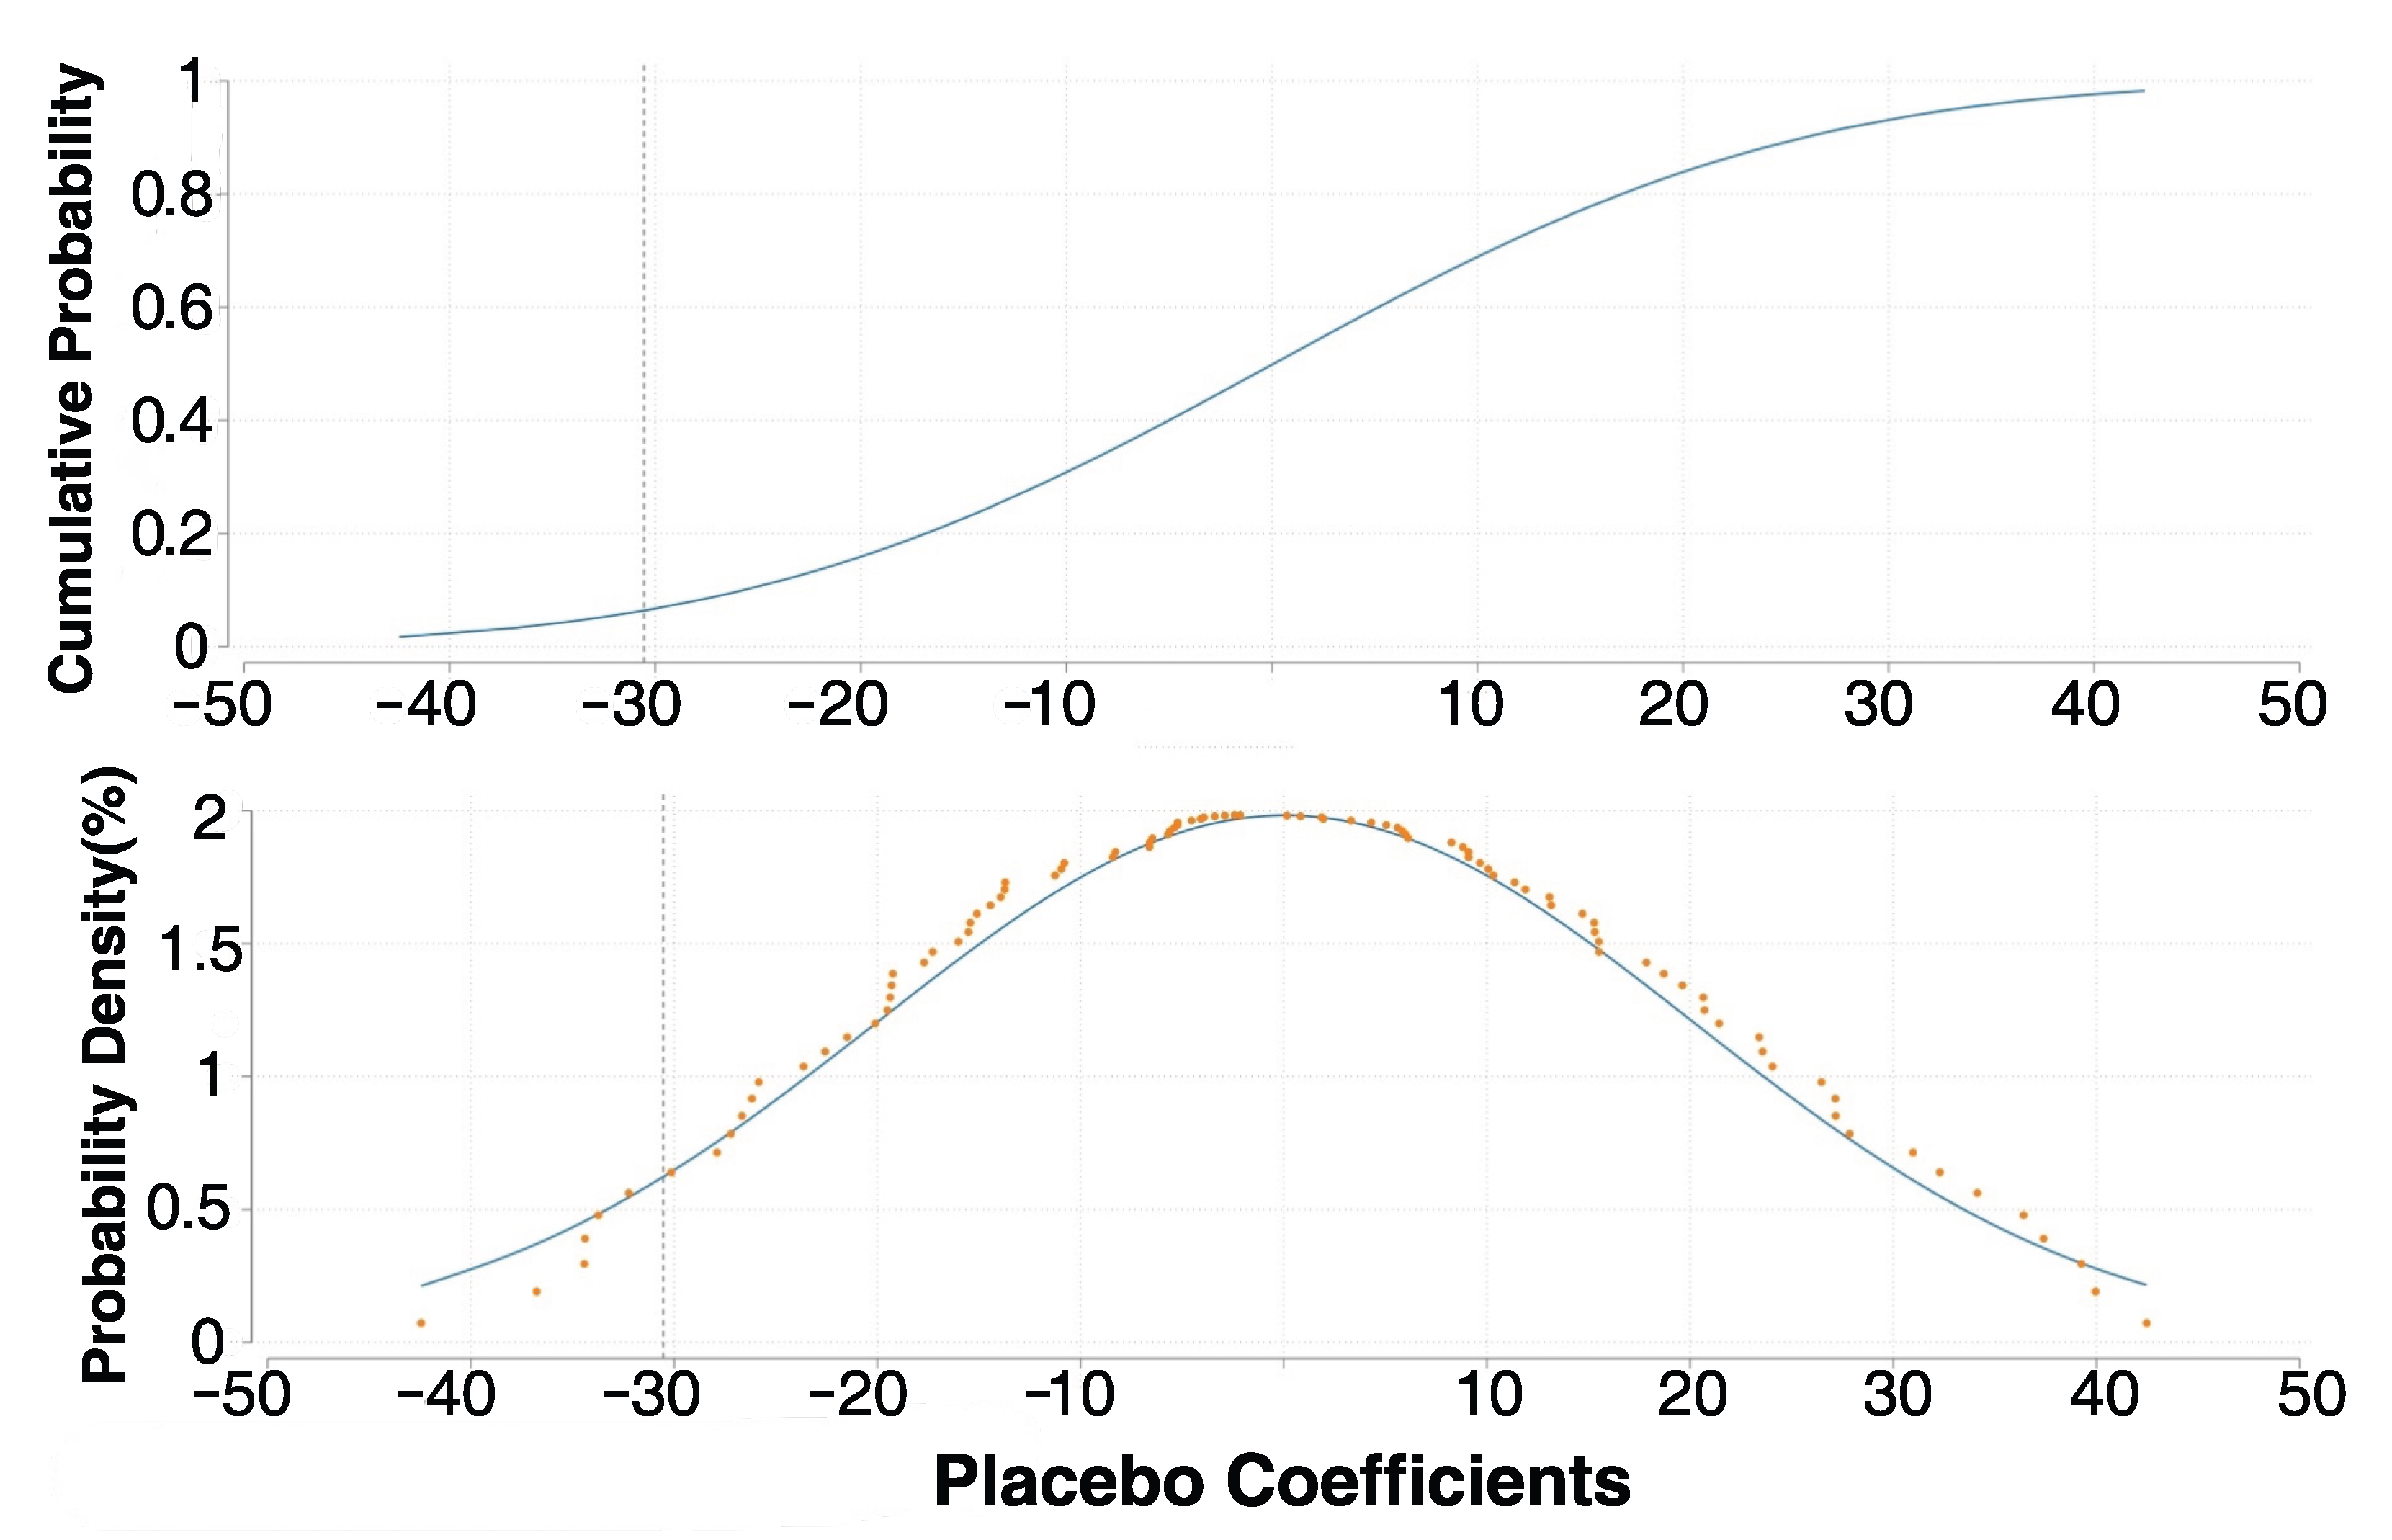
3.4.2. Placebo Test
3.5. Heterogeneity Analysis
4. Results
4.1. Baseline Results
4.2. Robustness
4.3. Heterogeneity Analysis
5. Conclusions and Discussion
Author Contributions
Funding
Institutional Review Board Statement
Informed Consent Statement
Data Availability Statement
Conflicts of Interest
References
- Stark, C.D.; Thompson, M.; Andrew, T.; Beasley, G.; Bellamy, O.; Budden, P.J.; Cole, C.; Darke, J.A.; Davies, E.; Feliciano, D.; et al. Net Zero: The UK’s Contribution to Stopping Global Warming; The Climate Change Committee: London, UK, 2019. [Google Scholar]
- Allwood, J.M.; Azevedo, J.M.C.; Clare, A.T.; Cleaver, C.J.; Cullen, J.M.; Dunant, C.F.; Fellin, T.; Hawkins, W.G.; Horrocks, I.; Horton, P.M.; et al. Absolute Zero: Delivering the UK’s Climate Change Commitment with Incremental Changes to Today’s Technologies; University of Cambridge: Cambridge, UK, 2019. [Google Scholar]
- Kayleigh, E.; Abdellatif, M.; Joseph, A.A.; Alquzweeni, S.S.; Hashim, K.S. Mitigating the impact of climate change on UK buildings through zero energy strategies. IOP Conf. Ser. Earth Environ. Sci. 2021, 877, 012018. [Google Scholar] [CrossRef]
- Zhou, M.; Hu, T. Analysis of carbon emission status under the carbon neutral target in China for Earth’s atmospheric balance. IOP Conf. Ser. Earth Environ. Sci. 2021, 804, 042082. [Google Scholar] [CrossRef]
- Marczak, H. Evaluation of ecological efficiency resulting from the application of modern buses in urban communications. J. Ecol. Eng. 2017, 18, 110–117. [Google Scholar] [CrossRef]
- Skrúcaný, T.; Semanová, S.; Milojević, S.; Asonja, A. New Technologies Improving Aerodynamic Properties of Freight Vehicles. Appl. Eng. Lett. J. Eng. Appl. Sci. 2019, 4, 48–54. [Google Scholar] [CrossRef]
- Phutane, C.S.; Katti, P.K.; Shinde, G.B. Analysis of Hybrid Energy Storage System for Electric Vehicles. In Proceedings of the 2022 IEEE 3rd Global Conference for Advancement in Technology (GCAT), Bangalore, India, 7–9 October 2022; pp. 1–6. [Google Scholar]
- Asef, P.; Milan, M.; Lapthorn, A.C.; Padmanaban, S. Future Trends and Aging Analysis of Battery Energy Storage Systems for Electric Vehicles. Sustainability 2021, 13, 13779. [Google Scholar] [CrossRef]
- Löbberding, H.; Wessel, S.; Offermanns, C.; Kehrer, M.; Rother, J.; Heimes, H.H.; Kampker, A. From Cell to Battery System in BEVs: Analysis of System Packing Efficiency and Cell Types. World Electr. Veh. J. 2020, 11, 77. [Google Scholar] [CrossRef]
- Notter, D.A.; Gauch, M.; Widmer, R.; Wäger, P.A.; Stamp, A.G.; Zah, R.; Althaus, H.J. Contribution of Li-ion batteries to the environmental impact of electric vehicles. Environ. Sci. Technol. 2010, 44 17, 6550–6556. [Google Scholar] [CrossRef]
- Chakraborty, P.; Parker, R.P.M.; Hoque, T.; Cruz, J.; Du, L.; Wang, S.; Bhunia, S. Addressing the range anxiety of battery electric vehicles with charging en route. Sci. Rep. 2022, 12, 5588. [Google Scholar] [CrossRef]
- Poschmann, J.; Bach, V.; Finkbeiner, M. Decarbonization Potentials for Automotive Supply Chains: Emission-Intensity Pathways of Carbon-Intensive Hotspots of Battery Electric Vehicles. Sustainability 2023, 15, 11795. [Google Scholar] [CrossRef]
- Byrom, S.; Bongers, G.D.; Boston, A.; Garnett, A. Future Roles for Natural Gas in Decarbonising the Australian Electricity Supply within the NEM: Total System Costs are Key. In Proceedings of the SPE Asia Pacific Oil & Gas Conference and Exhibition, Virtual, 17–19 November 2020. [Google Scholar]
- Lin, Y.; Cai, F.; Li, Z. On the Strategy of Comparative Superiority and Financial Crisi. J. Jiangxi Univ. Financ. Econ. 1999, 4, 3–6+80. [Google Scholar]
- Altmaier, P. National Industrial Strategy 2030: Strategic Guidelines for a German and European Industrial Policy; Federal Ministry for Economic Affairs and Energy: Berlin, Germany, 2019.
- Zhang, W. Yes and No of Industrial Policy. Bus. Obs. 2016, 11, 12–13. [Google Scholar]
- Feldstein, M.S. Rethinking the Role of Fiscal Policy. Am. Econ. Rev. 2009, 99, 556–559. [Google Scholar] [CrossRef]
- Goodhue, R.; Sexton, R.J. Agricultural Support Policies in Imperfectly Competitive Markets: Why Market Power Matters in Policy Design. ERN Natl. 2011, 93, 1328–1340. [Google Scholar]
- Pack, H.; Saggi, K. Is there a case for industrial policy? A critical survey. World Bank Res. Obs. 2006, 21, 267–297. [Google Scholar] [CrossRef]
- Zhou, Y.; Pan, Y. Financial Subsidies and Tax Exemptions: An Analysis of New Energy Vehicle Industry Policy from the Perspective of Transaction Costs. Manag. World 2019, 10, 133–149. [Google Scholar]
- Metcalf, G.E. Investment in Energy Infrastructure and the Tax Code. Tax Policy Econ. 2009, 24, 1–34. [Google Scholar]
- Joskow, P.L. Comparing the Costs of Intermittent and Dispatchable Electricity Generating Technologies. Am. Econ. Rev. 2011, 101, 238–241. [Google Scholar] [CrossRef]
- Murray, B.C.; Cropper, M.L.; de la Chesnaye, F.; Reilly, J.M. How Effective Are US Renewable Energy Subsidies in Cutting Greenhouse Gases. Am. Econ. Rev. 2014, 104, 569–574. [Google Scholar] [CrossRef]
- Reiche, D.; Bechberger, M. Policy differences in the promotion of renewable energies in the EU member states. Energy Policy 2004, 32, 843–849. [Google Scholar] [CrossRef]
- Kerr, S.A. Winds of change: The planning response to renewable energy in Scotland. Town Plan. Rev. 2006, 77, 375–402. [Google Scholar] [CrossRef]
- Fischlein, M.; Smith, T. Revisiting renewable portfolio standard effectiveness: Policy design and outcome specification matter. Policy Sci. 2013, 46, 277–310. [Google Scholar] [CrossRef]
- Zhou, Y.; Pu, Y.; Chen, S.; Fang, F. Government Support and Development of Energing Industries—A New Energy Industry Survey. Econ. Res. J. 2015, 50, 147–161. [Google Scholar]
- Chen, Z.; Xu, L.; Zhao, J.; Wang, S.; Wu, S.; Ma, W.; Liu, X.; Cai, B.; Liu, J.; Jia, X. Driving Forces of Carbon Dioxide Emission for China’s Cities: Empirical Analysis Based on Extended STIRPAT Model. China Popul. Resour. Environ. 2018, 28, 45–54. [Google Scholar]
- Xue, L.; Jiang, L. The Effect and Implication of Chinese Industrial Policies on the Pure Electric Passenger Vehicle. Forum Sci. Technol. China 2017, 10, 80–87. [Google Scholar]
- Jiang, F.; Li, X. Evolution and Development of China’s Industrial Policy in the 40 Years of Reform and Opening up: And on the Transformation of China’s Industrial Policy System. Manag. World 2018, 34, 73–85. [Google Scholar]
- Ruan, X. Research on Technical and Economic Comprehensive Evolution of New Energy Vehicle and Its Development Strategy. Ph.D. Thesis, Wuhan University of Technology, Wuhan, China, 2010. [Google Scholar]
- Wang, T. Micro-Regulation Theory Research: Based on the Critique of Orthodox Theory and the Understanding of the Market as a Process; China Social Sciences Press: Beijing, China, 2005. [Google Scholar]
- Zhang, H. Be Alert to the Risk of Overcapacity in New Energy Vehicles. Outlook 2018, 14, 2. [Google Scholar]
- Xiong, Y.; Xiong, Z.; Wu, J. Which Non-subsidy Policy is Better, in the Production or Consumption Links?—Based on the Promotion Effect of R&D Investment of NEV Enterprises. Stud. Sci. Sci. 2022, 40, 1181–1191. [Google Scholar]
- Diamond, D. The impact of government incentives for hybrid-electric vehicles: Evidence from US states. Energy Policy 2009, 37, 972–983. [Google Scholar] [CrossRef]
- Åhman, M. Government policy and the development of electric vehicles in Japan. Energy Policy 2006, 34, 433–443. [Google Scholar] [CrossRef]
- Engerer, H.; Horn, M.J. Natural gas vehicles: An option for Europe. Energy Policy 2010, 38, 1017–1029. [Google Scholar] [CrossRef]
- Leurent, F.; Windisch, E. Benefits and costs of electric vehicles for the public finances: An integrated valuation model based on input–output analysis, with application to France. Res. Transp. Econ. 2015, 50, 51–62. [Google Scholar] [CrossRef]
- Cao, G.; Yang, J. Research on Consumers Buying Behavior on New Energy Vehicles of Government Subsidies Incentive Base on Evolutionary Game Theory. Inq. Econ. Issues 2016, 10, 1–9. [Google Scholar]
- Xu, G.; Xu, F. Impact Factors of Purchase Decision of New Energy Automobile. China Popul. Resour. Environ. 2010, 20, 91–95. [Google Scholar]
- Zhong, T.; Du, R. A Research of Subsidies for New Energy vehicles Based on Game Theory. China Manag. Sci. Soc. 2015, 23, 817–822. [Google Scholar]
- Zhang, G.; Zhang, X.; Wang, Y.; Guo, D. Analysis of Optimal Boundary of Government Subsidies for Energy Conservation and Emission Reduction. J. Manag. Sci. China 2014, 17, 129–138. [Google Scholar]
- Miao, L.; Chen, J.; Fan, T.; Lv, Y. The Impact of Digital Economy Development on Carbon Emissions: Based on the Panel Data Analysis of 278 Prefecture-level Cities. South China Financ. 2022, 2, 45–57. [Google Scholar]
- Shan, Y.; Guan, D.; Zheng, H.; Ou, J.; Li, Y.; Meng, J.; Mi, Z.; Liu, Z.; Zhang, Q. China CO2 emission accounts 1997–2015. Sci. Data 2018, 5, 170201. [Google Scholar] [CrossRef]
- Campello, M.; Larrain, M. Enlarging the Contracting Space: Collateral Menus, Access to Credit, and Economic Activity. Commun. Rev. Financ. Stud. 2016, 29, 349–383. [Google Scholar] [CrossRef]


| 2017 | 2018 | 2019 | 2020 | |
|---|---|---|---|---|
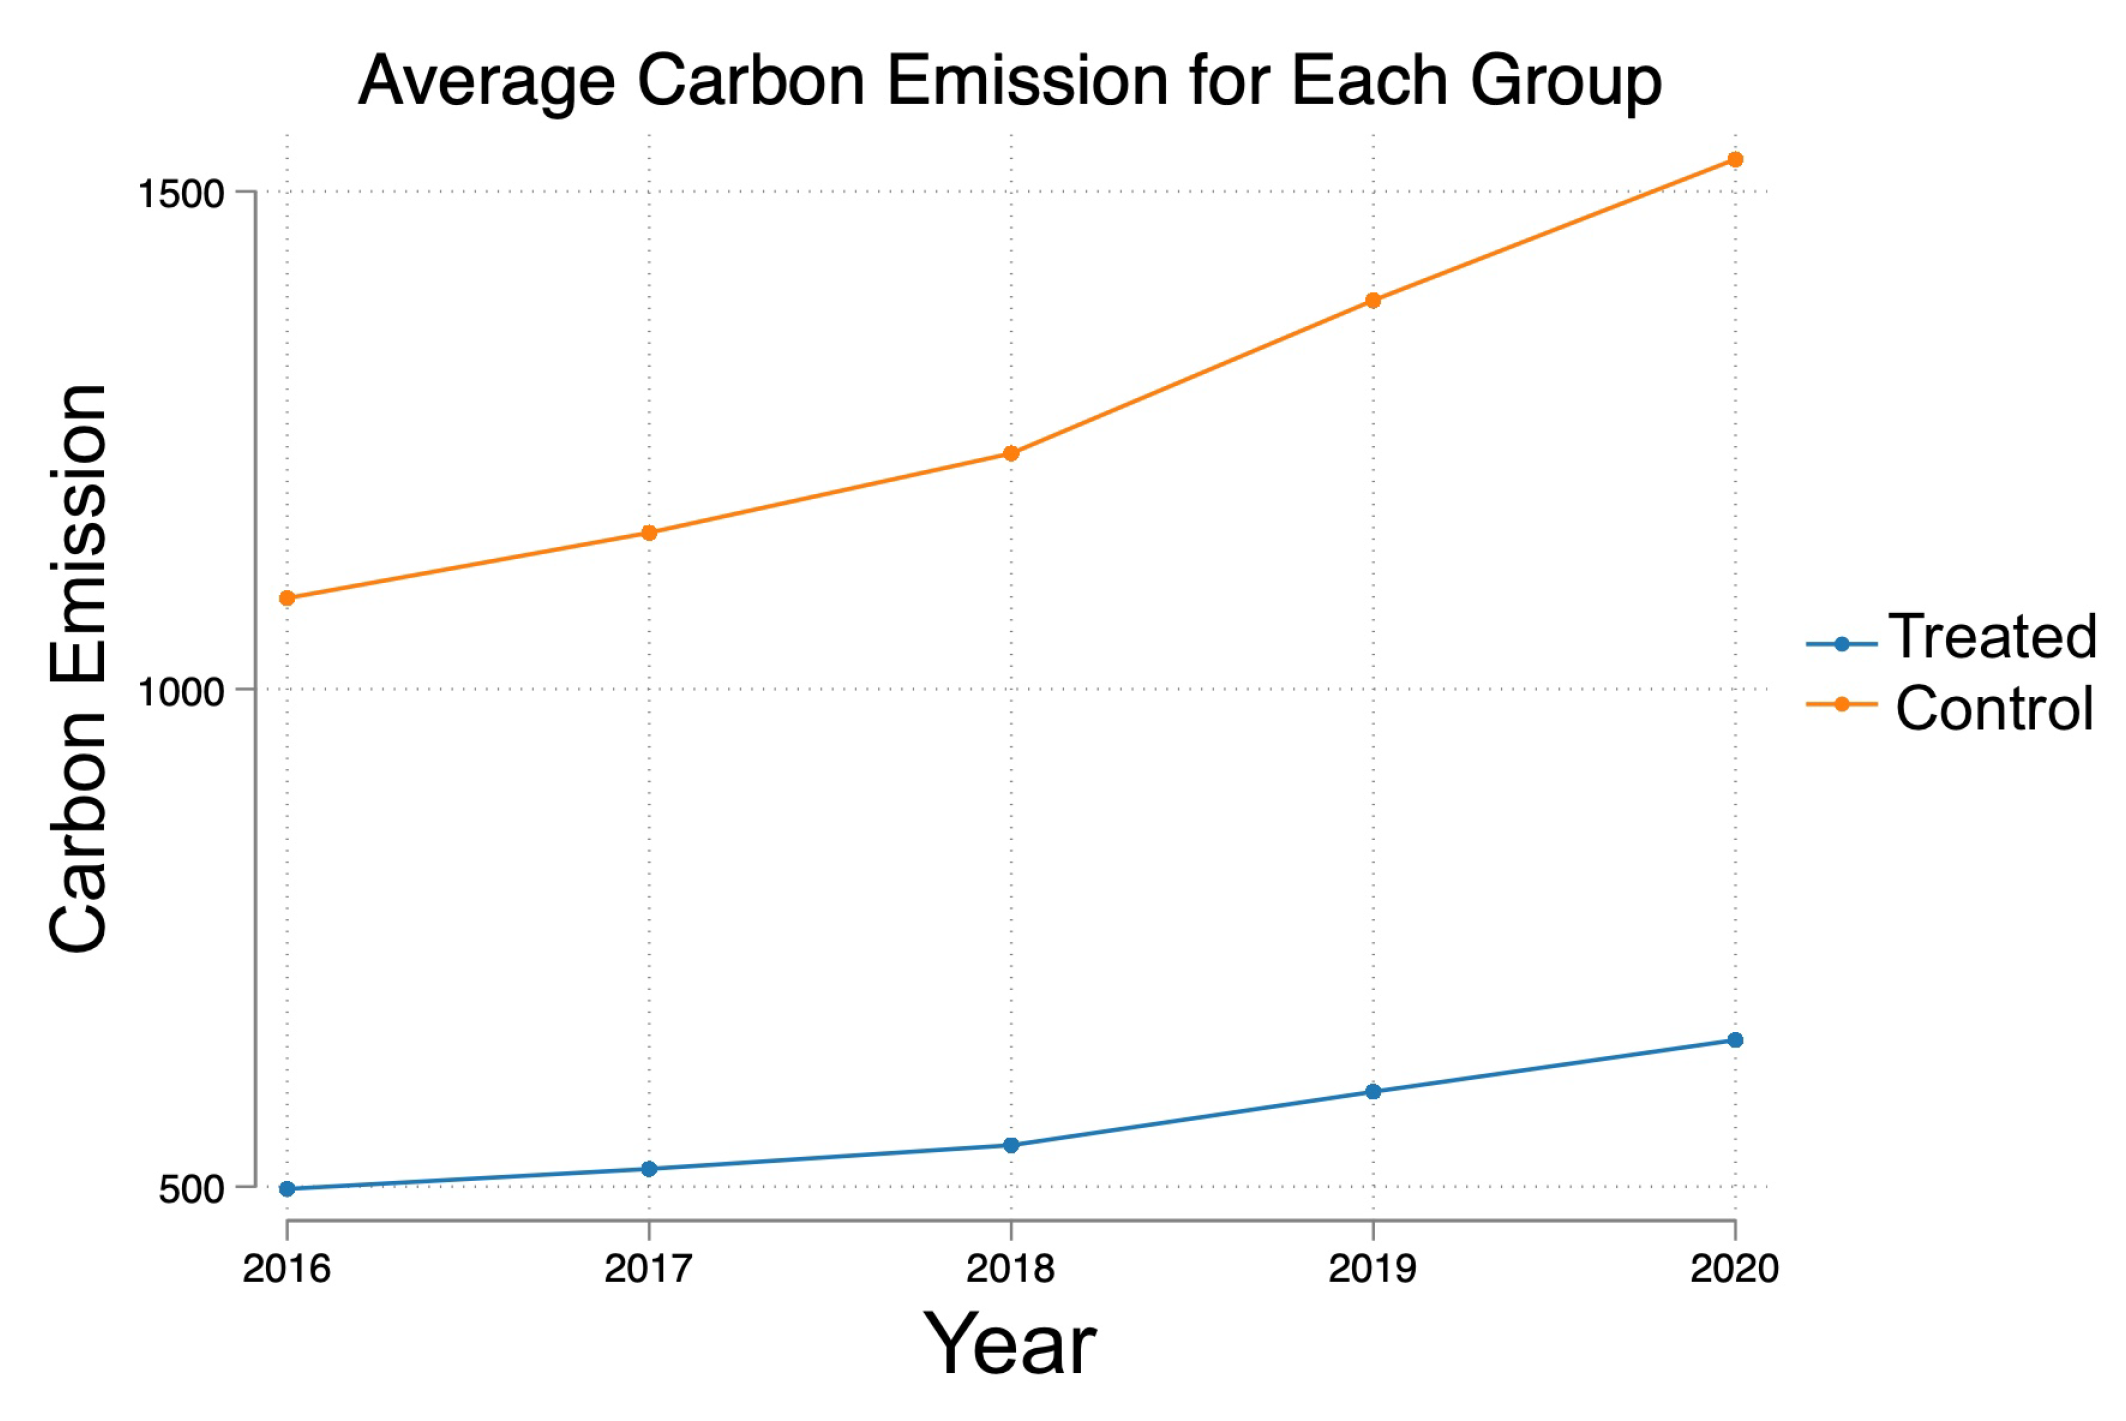
| Carbon | 937.21 (448.08) | 997.67 (462.28) | 1117.06 (518.46) | 1226.8 (551.15) |
| Car | 728.07 (129.00) | 5498.58 (905.50) | 10,293.60 (1777.50) | 13,737.55 (2695.50) |
| Station | 616.15 (67) | 930.38 (140.50) | 1643.01 (296.50) | 2405.07 (478.50) |
| Car/Station | 9.67 (1.50) | 13.01 (7.12) | 9.34 (6.39) | 7.54 (5.61) |
| Baseline | Parametric | Alternative | |
|---|---|---|---|
| −30.541 * | −42.20 *** | ||
| (9.967) | (7.618) | ||
| −10.15 | |||
| (4.998) | |||
| −18.97 ** | |||
| (5.438) | |||
| −30.56 *** | |||
| (6.264) |
| Baseline | By Region | |||
|---|---|---|---|---|
| −30.541 * | ||||
| (9.967) | ||||
| Northeast | −18.173 | |||
| (26.310) | ||||
| Northwest | 151.855 | |||
| (84.447) | ||||
| Northcentral | −31.410 *** | |||
| (6.377) | ||||
| Southeast | 0.000 | |||
| (.) | ||||
| Southwest | −68.599 | |||
| (25.964) | ||||
| Southcentral | −32.305 ** | |||
| (6.304) | ||||
| Central | −29.021 * | |||
| (7.279) | ||||
| West | −35.969 | |||
| (25.957) | ||||
| East | −16.944 | |||
| (25.837) | ||||
| South | −48.722 * | |||
| (14.525) | ||||
| North | −7.866 | |||
| (13.119) |
Disclaimer/Publisher’s Note: The statements, opinions and data contained in all publications are solely those of the individual author(s) and contributor(s) and not of MDPI and/or the editor(s). MDPI and/or the editor(s) disclaim responsibility for any injury to people or property resulting from any ideas, methods, instructions or products referred to in the content. |
© 2023 by the authors. Licensee MDPI, Basel, Switzerland. This article is an open access article distributed under the terms and conditions of the Creative Commons Attribution (CC BY) license (https://creativecommons.org/licenses/by/4.0/).
Share and Cite
Cai, Q.; Ji, Z.; Ma, F.; Liang, H. The Green Effects of Industrial Policy—Evidence from China’s New Energy Vehicle Subsidies. Energies 2023, 16, 6811. https://doi.org/10.3390/en16196811
Cai Q, Ji Z, Ma F, Liang H. The Green Effects of Industrial Policy—Evidence from China’s New Energy Vehicle Subsidies. Energies. 2023; 16(19):6811. https://doi.org/10.3390/en16196811
Chicago/Turabian StyleCai, Qian, Zheng Ji, Fuxun Ma, and Han Liang. 2023. "The Green Effects of Industrial Policy—Evidence from China’s New Energy Vehicle Subsidies" Energies 16, no. 19: 6811. https://doi.org/10.3390/en16196811
APA StyleCai, Q., Ji, Z., Ma, F., & Liang, H. (2023). The Green Effects of Industrial Policy—Evidence from China’s New Energy Vehicle Subsidies. Energies, 16(19), 6811. https://doi.org/10.3390/en16196811