Article

LCA of a Proton Exchange Membrane Fuel Cell Electric Vehicle Considering Different Power System Architectures

by
Gianmarco Gottardo
1,
Andrea Basso Peressut
1,*,
Silvia Colnago
2,
Saverio Latorrata
1,
Luigi Piegari
2 and
Giovanni Dotelli
1,*
1
Department of Chemistry, Materials and Chemical Engineering “Giulio Natta”, Politecnico di Milano, Piazza Leonardo da Vinci 32, 20133 Milano, Italy
2
Department of Electronics, Information and Bioengineering, Politecnico di Milano, Via Giuseppe Ponzio 34, 20133 Milano, Italy
*
Authors to whom correspondence should be addressed.
Energies 2023, 16(19), 6782; https://doi.org/10.3390/en16196782
Submission received: 14 July 2023 / Revised: 8 September 2023 / Accepted: 21 September 2023 / Published: 23 September 2023
(This article belongs to the Special Issue Research in Proton Exchange Membrane Fuel Cell)

Abstract

:
Fuel cell electric vehicles are a promising solution for reducing the environmental impacts of the automotive sector; however, there are still some key points to address in finding the most efficient and less impactful implementation of this technology. In this work, three electrical architectures of fuel cell electric vehicles were modeled and compared in terms of the environmental impacts of their manufacturing and use phases. The three architectures differ in terms of the number and position of the DC/DC converters connecting the battery and the fuel cell to the electric motor. The life cycle assessment methodology was employed to compute and compare the impacts of the three vehicles. A model of the production of the main components of vehicles and fuel cell stacks, as well as of the production of hydrogen fuel, was constructed, and the impacts were calculated using the program SimaPro. Eleven impact categories were considered when adopting the ReCiPe 2016 midpoint method, and the EF (adapted) method was exploited for a final comparison. The results highlighted the importance of the converters and their influence on fuel consumption, which was identified as the main factor in the comparison of the environmental impacts of the vehicle.

1. Introduction

One of the main issues the world is currently facing is climate change due to air pollution, greenhouse gases (GHG), and ozone depletion [1]. In Europe, the transportation sector has to be held accountable for almost 30% of the emitted GHG, more than 20% of which is due to road transport [2]. Transport emissions have been growing since 1990, making their reduction a key point in a transition towards a more sustainable future. The EU has set a goal to achieve climate neutrality by 2050, and cutting down 90% of emissions from vehicles by that year is a priority to reach this objective [2,3]. In order to achieve such a target and to lower the impact of road transportation, the car industry is moving away from traditional internal combustion engine vehicles (ICEV) powered by fossil fuels towards different solutions based on electric vehicles (EV) [4].
All road vehicles equipped with an electric propulsion system fall under the definition of EVs, and various types can be identified: “pure” battery electric vehicles (BEV), hybrid electric vehicles (HEV), and fuel cell electric vehicles (FCEV) [5]. Fuel cell vehicles can be one of the solutions to lower emissions since they are zero-emission propulsion vehicles and potentially a zero-emission well-to-wheel means of transportation when hydrogen is produced from renewable sources [6].
Hydrogen production is one of the key issues for the successful implementation of FCEV technology, considering that it can be obtained through several different procedures, each with a different environmental impact that heavily influences the overall impacts of FCEVs. At present, a consistent portion of employed hydrogen is produced from the steam reforming of natural gas (48%), while the remaining portion is obtained via petroleum fraction (30%), coal gasification (18%), and electrolysis (4%) [7]. Depending on the environmental impact these technologies have, hydrogen can be classified as grey (if produced from steam methane reforming (SMR)), blue (from SMR with carbon capture and storage), turquoise (from methane pyrolysis), and green (from water electrolysis) [8]. Production of hydrogen, transport, and storage still need development and pose an economical and technological barrier that slows down the growth of hydrogen mobility [9].
Considering all these factors, FCEVs are nowadays best seen as complementary to BEVs, the latter being more suitable for city routes and use, while fuel cell vehicles could fill what BEVs lack in range and flexibility [10]. Improving the driving range of BEVs requires an increase in the size of batteries, which would reach weights and sizes that are not economically favorable. On the other hand, FCEVs are able to reach longer ranges just by enlarging the tank while keeping the rest of the system the same size. Another advantageous point of FCEVs is that the fueling time is comparable to that of gasoline-based vehicles, while BEVs need at least 20–30 min to charge even with the most recent fast charging technologies [11].
Nevertheless, for FCEVs to become really competitive in the transportation market, a fundamental aspect to be addressed is whether they are truly advantageous from an environmental viewpoint. In this regard, several studies have been produced in the last few years in the literature. For instance, Evangelisti et al. used the LCA methodology to compare the production of FCEV vehicles to the production of more traditional BEV and ICEV [12] vehicles. This comparison was further studied by Candelaresi et al., who considered a wide range of vehicle typologies in their work [13]. Both authors concluded that FCEVs are a viable and promising technology in the decarbonization of the automotive sector, highlighting how the production of hydrogen is one of the key points to be addressed to improve the environmental footprint of FCEVs [12,13]. Numerous studies have focused on the influence of hydrogen production on the total emissions of FCEVs, comparing various methods as well as vehicle typologies. Das et al. investigated the Indian market and energy grid, assessing the viability and benefits of using renewable energy for the production of hydrogen [14]. Delpierre et al. focused on the production of hydrogen through wind-generated electricity in the Netherlands and its possible future developments [15]. The study conducted by Bartolozzi et al. highlights how wind-based energy is a promising technology for reducing the emissions of hydrogen production in Italy [9]. Another concerning point in the adoption of FCEV is the cost associated with the technology. Wulf et al. studied the cost of several hydrogen production methods, concluding that hydrogen from renewable sources, despite being the least impactful on the environment, also presents the highest costs [16]. Regarding the whole life cycle of an FCEV vehicle, a study by Miotti et al. analyzed the environmental impacts and cost of the FCEV technology compared to BEV and ICEV. The results showed how, while advantageous when considering the environmental impacts, fuel cell vehicles are still an expensive technology [17]. On the other hand, this economic gap between hydrogen fueled vehicles and traditional vehicles is getting thinner and thinner. Wang et al. conducted a study performing a life cycle cost assessment for the Chinese market, concluding that FCEVs could see a wider diffusion after 2025 and be competitive with their traditional counterparts in either 2030 (for heavy-duty vehicles) or 2035 for the passenger sector [18].
In this framework, the aim of this work is to focus on an aspect still scarcely investigated by the literature, i.e., the analysis and comparison of the environmental impacts of three fuel cell electric vehicles built with different architectures of the power system, considering their production and their use phase. For this purpose, the life cycle assessment (LCA) methodology was exploited. A model for the production of vehicle, hydrogen, and fuel cell stacks was used to create the inventory on which this study is based. The impacts of each manufacturing step and of the entire vehicle were studied and compared, analyzing the most significant impact categories. This allowed us to identify the key points of focus in the comparison of fuel-cell electric vehicles and find the overall least impactful configuration.

2. Fuel Cell Electric Vehicle Architectures

As stated in the name, an FCEV is a vehicle that has a fuel cell stack as its main power source. A fuel cell can be described as an electrochemical converter in which oxygen and hydrogen are exploited to produce electricity while generating heat and water as the sole reaction byproducts. While this device could appear similar to a battery at first sight, both having two electrodes separated by an electrolyte, there are some fundamental differences. In particular, while a battery is bound to charge-discharge cycles, a fuel cell keeps working as long as it is fed with a constant supply of fuel and oxidant gases; moreover, fuel cell electrodes do not undergo any chemical transformation during the reaction (apart from unavoidable degradation), while battery ones are consumed during charge and discharge phases [11,19,20].
The most common fuel cell system utilized in the automotive industry is the Proton Exchange Membrane Fuel Cell (PEMFC). These devices present various features that are looked for in automotive, such as a low operating temperature range (below 100 °C), high power density and efficiency, a short startup time, and a lack of pollution and noise [19,21].
As shown in Figure 1, the basic working principle of PEM fuel cells is fairly simple: hydrogen is injected into the anode side, and a catalyst splits it into protons and electrons. The electrolyte is designed to let the protons pass through the electrically insulating membrane toward the cathode while forcing electrons to flow into an external circuit, allowing their exploitation to produce useful electricity. Protons and electrons are then recombined together with oxygen on the cathodic catalyst, closing the redox process with the generation of water and the release of heat [19].
The fuel cell stack is the main source of power for an FCEV and the core of the technology. The battery acts as an auxiliary power source and can exploit regenerative braking, while the tank holds the reservoir of fuel. These two components are of critical importance for the functioning of the vehicle and from an environmental impact point of view. It has to be noted that an FCEV can be hybridized with either a battery or a capacitor, with the former being the preferred choice for the models on the actual market and the only one analyzed in this study [11].
The hybridization of the power system is aided by DC converters. Converters are an important focus of this study, and their fundamental function is to increase the voltage from the power sources to reach the high voltage requirements of the motor. Through these devices, it is possible to increase the voltage of the motor while reducing the number of cells in the FC stack and reducing the overall size and weight of the system [22]. Therefore, converters allow for optimization of the use and size of the FC stack and/or the battery, reducing their degradation [23,24,25]. There are four viable configurations to connect the fuel cell stack, the battery, and the DC bus, according to the literature, as shown in Figure 2 [11].
The converter connecting the FC stack to the DC bus needs to be unidirectional to avoid any possible damage due to current entering the stack, while the converter connecting the battery should be bidirectional to exploit regenerative braking.
Architecture A is the most utilized typology in FCEV [26]. It allows for high flexibility in the system by controlling both power flows, which also makes the requirements of the inverter more adaptable. Architecture B is less flexible, having only one converter, despite being cheaper than A. Architecture C is also cheaper than architecture A; however, the DC bus voltage depends on the fuel cell output voltage; therefore, it is strongly dependent on the power delivered by it. Power electronic losses are also higher due to the bi-directionality of the converter [11]. The last considered architecture, called D, is the cheapest one since it does not use any converter; however, this also makes the control of the power split harder. This architecture was never used for FCEV and was not analyzed in this study.

3. Life Cycle Assessment Methodology

To perform an analysis and quantify the impacts of the considered system, the life cycle assessment (LCA) approach was used. LCA is an established method for the evaluation of the environmental impacts of products and services, considering their whole production chain (starting from raw materials), use, end-of-life disposal, and eventual recycling. The LCA methodology is defined by ISO standards 14040 and 14044. LCA is useful to analyze the materials and energy used at every single stage of a product’s life, allowing us to identify the points in the system that present the highest environmental impacts so that they can be targeted and improved. LCA is also important to compare different technologies or products, focusing on their ecological impacts. Various impact categories can be analyzed to describe the impacts (e.g., global warming potential (GWP), ozone depletion, human toxicity). These features make LCA a useful and versatile tool to have a clear view of a product in its entirety, both in a general and a particular way, either considering the whole life cycle or a single stage or component, depending also on the specific impact category or categories that are being considered.
The program used in this study is SimaPro 9.3. To model the life cycle inventory, data from the Ecoinvent 3 database [27] was selected. To perform the life cycle impact assessment (LCIA), the ReCiPe midpoint method was adopted to analyze the impacts of each component of the inventory, while the EF (adapted) method was implemented to compute the total single score of each configuration and compare them. The analyzed environmental impact categories, besides the global warming potential category, were terrestrial acidification, freshwater and marine eutrophication, terrestrial ecotoxicity, freshwater ecotoxicity, and marine ecotoxicity, human carcinogenic and non-carcinogenic toxicity, and mineral and fossil resource scarcity, for a total of 11 categories.

3.1. Goal and Scope Definition

The goal of this work is to study the environmental impacts of an FCEV depending on powertrain architecture, considering its behavior in the Worldwide Harmonized Light Vehicle Test Procedure (WLTP). WLTP is a standardized test to determine the energy consumption of a vehicle, and it is based on a predetermined driving cycle, the Worldwide Light-Duty Test Cycle (WLTC). Since the studied vehicle is a Class 3 vehicle (power > 34 W/kg), the Class 3 WLTP cycle was used [28]. The car covers 23.3 km in a single cycle [11]. This study will consider the production of the vehicle in all its parts and the production of the hydrogen consumed during the test by each architecture. The experimental data are based on previous work reported in the literature [11], particularly those regarding FC, battery, and converter sizing, as well as the hydrogen consumption of each configuration. To keep the model as close as possible to the one built by Colnago et al. [11], the used parameters are mainly based on the same car type, i.e., the Toyota Mirai. This vehicle is one of the most popular FCEVs on the market [29], with a large literature dedicated [22,29,30,31,32] to it. The functional unit considered for this work is 1 km driven by one vehicle, to which a lifetime of 150,000 km is associated, according to the typical mileage adopted in the literature [12,17,33,34]. This study aims to analyze the environmental impacts of the vehicle depending on the number and type of converters implemented in the power system, their influence on the fuel cell stack, and hydrogen consumption. According to the existing literature [12,17], the manufacturing of gliders and auxiliaries are the main contributors to the overall impacts of the production phase of the vehicle. The fuel cell stack is usually the second most influential component in the manufacturing phase, while hydrogen production is the first contributor to the use phase. Since the architecture adopted for the powertrain influences both fuel cell stack parameters and hydrogen consumption, studying their relations and influences on the environmental impacts could give a clearer picture of the overall impacts of the FCEV technology.

3.2. System Characteristics

The main parameters of a Toyota Mirai (2015), considered in this study as a reference, are summarized in Table 1. The fuel cell stack is a proton-exchange membrane fuel cell. The characteristics of the stack change with the type of architecture. For architectures A and B (displayed in Figure 2), data from Toyota Mirai were considered since a unidirectional boost converter is present between the stack and the DC bus, which is the case of the real vehicle, while the stack of architecture C was modeled by Colnago et al. [11], who also selected a lithium manganese oxide (LMO) Li-ion battery instead of the Ni-MH battery mounted on the 2015 Mirai [30]. This choice was made because of the predominance of Li-ion batteries in the current market [35,36], a choice that proved to be farsighted since the new Toyota Mirai (2021) equips a Li-ion battery [37]. The rise of Li-ion batteries was fostered by their high specific energy and limited self-discharge, coupled with a good resistance to charge-discharge cycles and the lack of a memory effect [36].

3.3. Life Cycle Inventory

The life cycle inventory (LCI) of this work is mainly focused on the manufacturing phase of all the components of the vehicle and on hydrogen production, which concerns the use phase. The end-of-life stage will not be analyzed since it is beyond the aim of this study. Figure 3 shows the hierarchy of the main components modeled for the manufacturing phase.

3.3.1. Fuel Cell Stack

The inventory of the FC stack was mainly conducted by adapting the work of Evangelisti et al. [
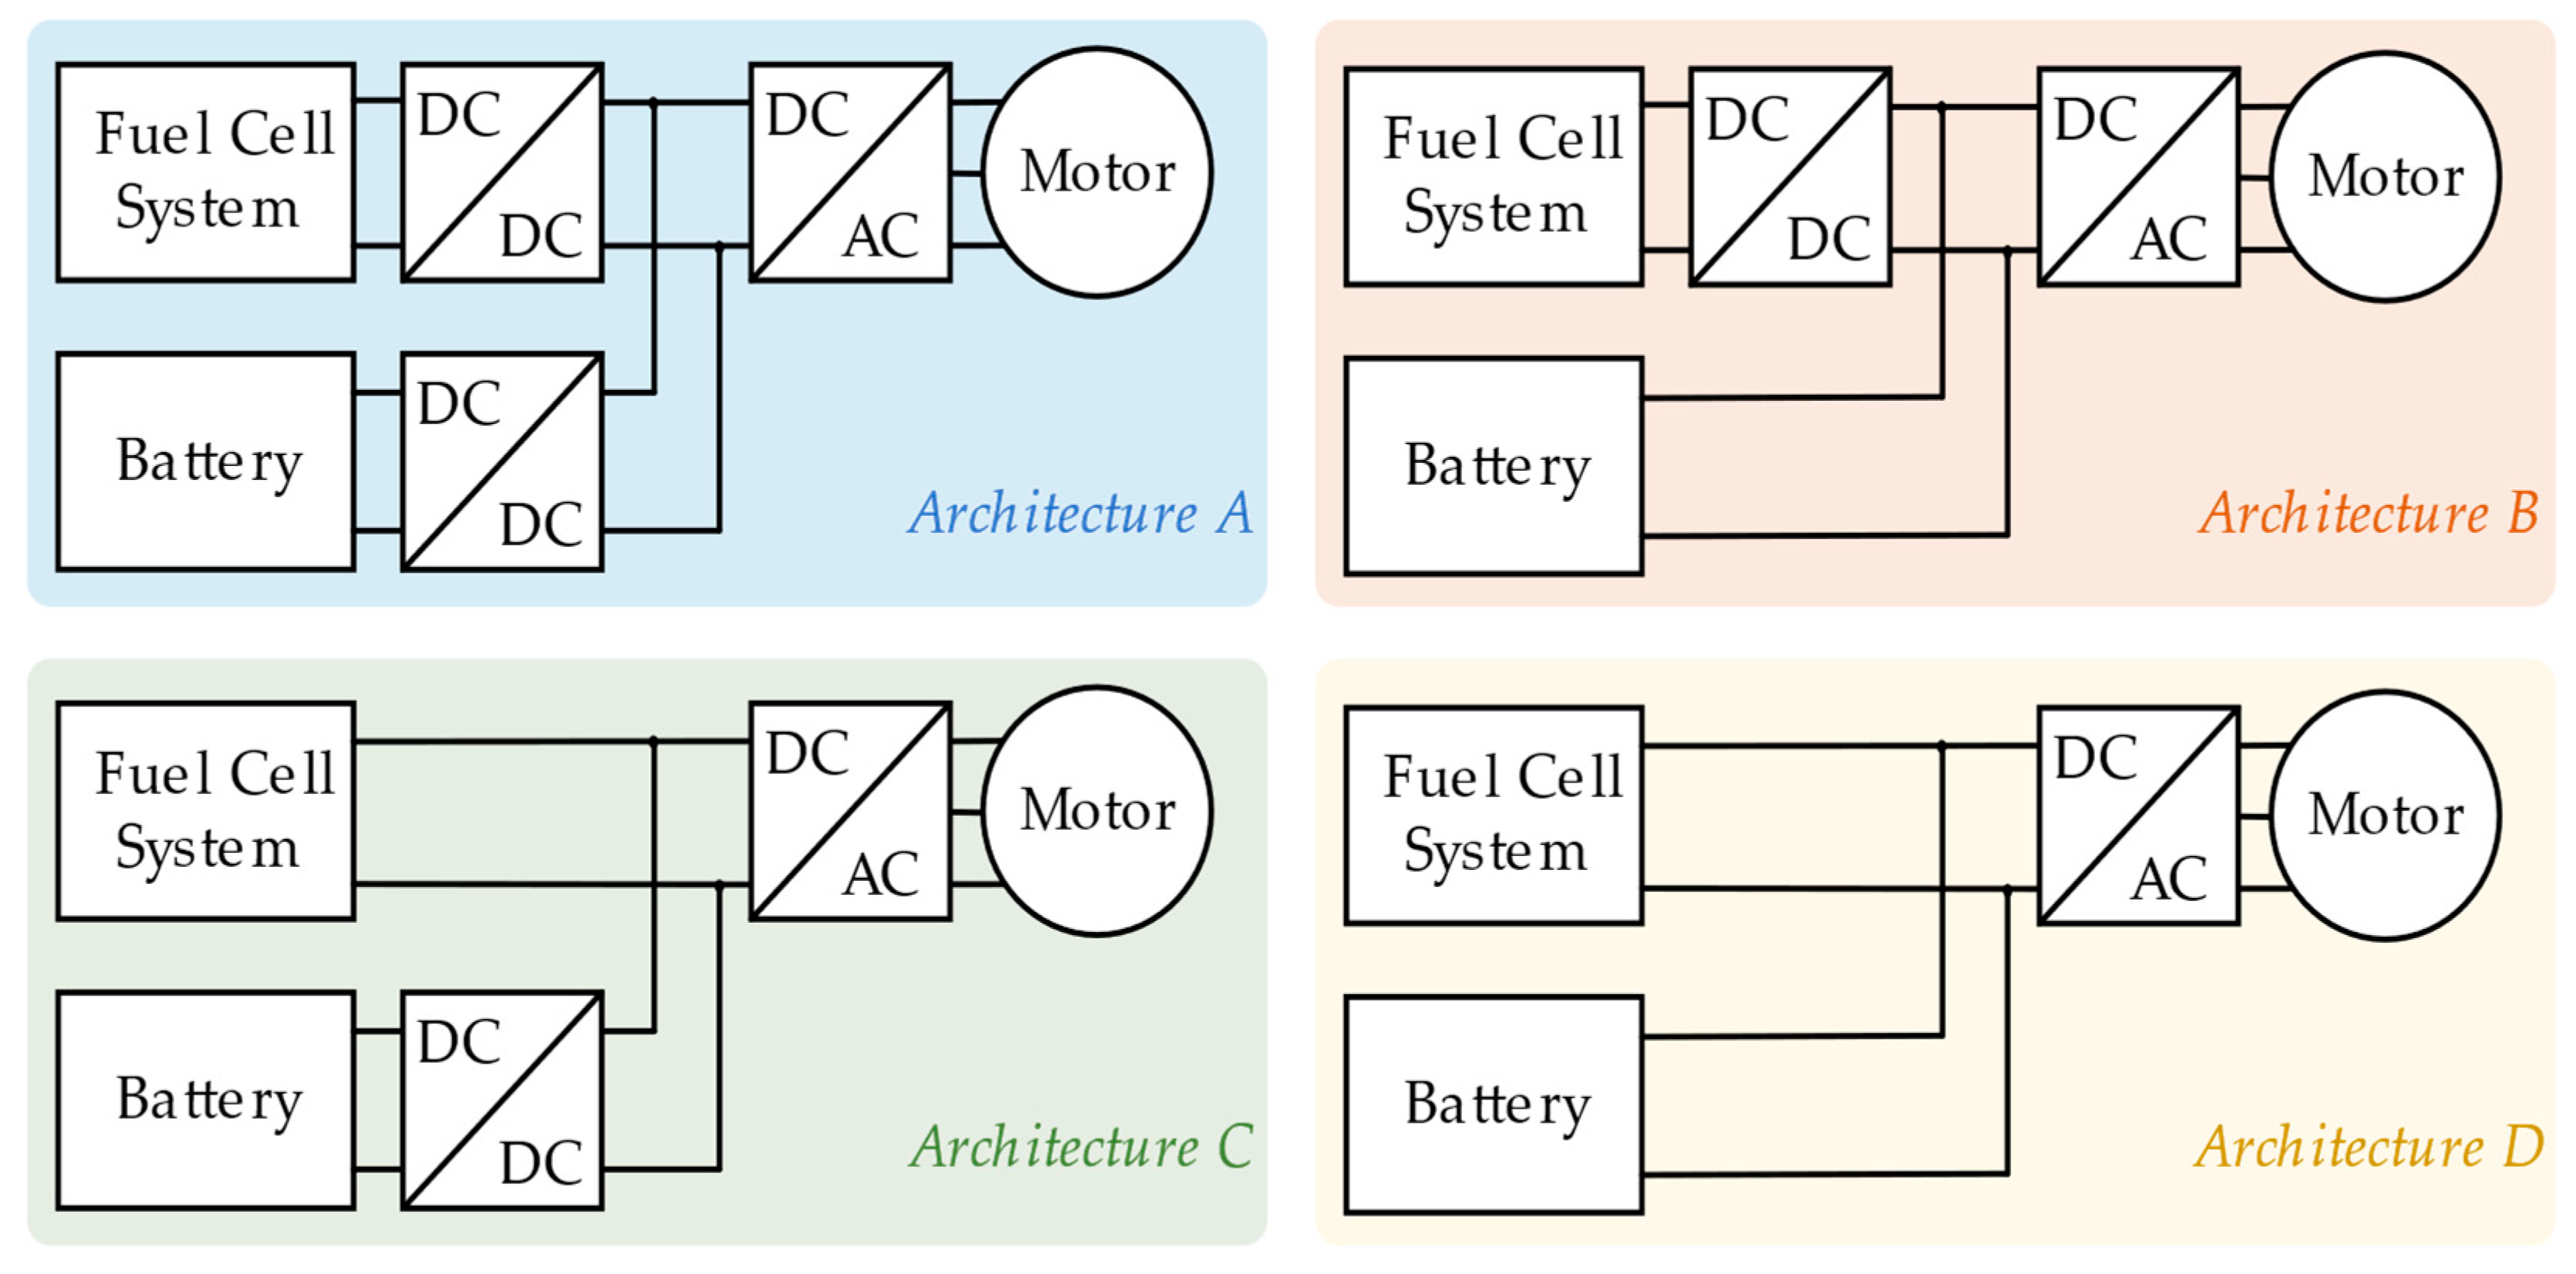
12] to the considered parameters. It was assumed that the FC stack is the same for architectures A and B (Figure 2), while a different stack was considered for architecture C since it had to be adjusted to the requests of power and voltage due to the lack of a converter to regulate its output. Table 2 reports the parameters assumed for the two stacks, while Table 3 and Table 4 report the inventory for the production of the fuel cell stacks for the different configurations.
Concerning the proton exchange membrane of the fuel cell, it must present a high proton conductivity, be chemically and mechanically stable in the fuel cell, and offer a barrier to the mixing of reactants. Perfluoro sulfonic acid (PFSA), in particular Nafion®, produced by Chemours, is the most used material [20]. Nafion® can be classified as a copolymer of tetrafluoroethylene (TFE) and unsaturated perfluoroalkyl sulfonyl fluoride, where the former supplies the required mechanical strength while the latter provides the hydrophilic proton-carrying sulfonic acid groups at the end of the side chains [19]. The membrane considered in this work is a dispersion-cast membrane, NRE-212, with a thickness of 50 µm [12]. Since there is no available LCA dataset for Nafion®, a proxy process was assumed, with 57.4 wt% of TFE and 42.6 wt% sulfuric acid for the PSFA. To account for the dispersion cast process, two proxy processes were used: a coil laminating process and a laminated foil process [12]. The inventory for the manufacture of the membrane is shown in Supplementary Materials, Table S1.
Moving to the outer part of the electrode, i.e., the Gas Diffusion Layer (GDL), the one considered in this study is composed of a carbon cloth material coated with 10 wt% polytetrafluoroethylene (PTFE) and 5 wt% carbon black for the microporous layer (MPL), assuming a carbon cloth made from carbon fibers [30,38]. Since there are no direct datasets in Ecoinvent 3.7 for carbon fibers and PTFE, their production was modeled following the processes considered by Evangelisti [12] and reported in the inventory. Then, the preparation of an MPL, consisting of a hydrophobic solution of PTFE and carbon powder (hydrophobic ink) with a solid content of 27 wt%, was considered, followed by its deposition on the GDL and the subsequent heat treatment [12]. The inventory for the thermoforming of the gas diffusion layer is reported in Table S2, while the inventory of PTFE and carbon fiber is described in Table S3.
The catalyst layer is the part of the cell where the reactions of hydrogen oxidation (HOR) and oxygen reduction (ORR) take place. The most commonly used catalyst for PEMFC is platinum (Pt), and even if other materials are proven to offer similar results, platinum is still preferred because of its stability, activity, and selectivity [12]. Platinum mining and refining generate large overall impacts when considering the manufacture of a PEMFC, and reducing the amount needed in the catalyst layer is one of the main focuses of recent studies aiming at lowering the cost and environmental impacts of fuel cell technology [39]. The Pt-loading considered in this work was the same as the one in the Toyota Mirai, i.e., 0.4 mg/cm2 [40], with carbon black being the support material, owing to its porous and conductive nature that allows surface area and contact with the membrane to be maximized. Before the deposition of the catalyst, carbon must undergo a pre-treatment. The entire process to manufacture 1 g of Pt/C was modeled based on the work by Evangelisti et al. [12].
The catalyst is usually prepared in the form of ink. The process model in this study is based on ball mill production with a wet catalyst solution composed of 6 wt% Pt/C, 9 wt% carbon black, 72 wt% Nafion® DE-521 solution (Nafion®, Wilmington, DE, USA), 6.5 wt% deionized water, and 6.5 wt% methanol, which ultimately corresponds to a dry catalyst composition of 48 wt% carbon black, 32 wt% Pt/C, and 20 wt% Nafion® [12]. The catalyst is assumed to be applied directly to the membrane using a spraying catalyst decaling method. This procedure is composed of two steps: the thinner anode layer is spray-coated directly on the hydrated membrane and dried, while the thicker cathode layer is spray-coated onto a transfer substrate, followed by drying. Then, the two catalyst layers are heated and roll pressed with the transfer substrate, usually made from polyester, which is subsequently peeled away from the deposited cathode layer [12]. Table S4 reports the inventory of the production of the catalyst layer. Additional information for the inventory of Nafion® DE-521 solution and the catalyst in carbon (Pt/C) can be found in Table S5.
The combination of two GDLs, the membrane, and two catalyst layers produces the membrane electrode assembly (MEA). The catalyzed membrane is hot-pressed between the two gas diffusion layers and die-cut to the final cell dimensions. Pressing of the membrane and GDL is performed at around 7 bar and 100 °C for 124 s to achieve the best contact possible [12]. The inventory of this process is reported in Table S6.
In addition, bipolar plates (BPP) are needed when assembling a multi-cell stack since their primary role is to electrically connect the anode of one cell to the cathode of the adjacent cell. They are typically made of graphite composite materials, flexible graphite foil, and stainless steel alloys. The material considered in this study is a compression-molded graphite composite, assumed to be composed of 70% graphite and 30% vinyl ester. To model the vinyl ester, a proxy based on vinyl acetate monomer was considered, while the ‘graphite, battery grade’ process was used for graphite [12]. The inventory of the production of the bipolar plates is reported in Table S7.
All the previous components are held together and sealed by gaskets, end plates, and tie-rods, preventing the leakage of the reactants and minimizing the contact resistance among the layers [20]. In this study, it was assumed that the gaskets are steel rule dies cut from a silicon roll. The outline of the gasket is laid out and cut into a board, and strip steel is embedded into the board at a uniform height and mounted on a small-stroke, fast-acting press. The bulk gasket material is fed into the press, and the material is cut. The process considered to manufacture the end plates is cellular manufacturing, involving an A465-cast aluminum block as the material. To model the material production, the ‘aluminum, production mix, cast alloy, at plant’ process in Ecoinvent 3.7 was used [12]. Table S8 reports the inventory model for the production of these components.

3.3.2. Balance of Plant

The fuel cell system is formed by other components besides the fuel cell stack, which are auxiliaries that have four main tasks: heat management, fuel management, air management, and water management [38].
The heat management system comprises high-temperature radiators and a high-temperature coolant pump. The air management system is composed of an air filtration system and a compressor expander module (CEM) for air supply. Since the air reaching the cathode comes from outside, it needs to be filtered; otherwise, there could be the possibility of poisoning the catalyst, which is sensitive to carbon monoxide and other particulates [30]. The water management system includes an enthalpy wheel humidifier for air and a membrane humidifier for hydrogen to keep the level of humidity homogeneous in the cell [12,30]. Finally, the fuel management system includes a hydrogen recirculation blower and ejectors [12]. Other auxiliaries of the FC system include the AC/DC inverter and the DC/DC converters. The inventory of the inverter was based on the work by Habermacher [41], while to model the materials and components of the balance of the plant, the work by Candelaresi et al. [13] was taken into account, adjusting the data for a 111 kW FC system. Table S9 reports the inventory for the production of the balance of the plant.

3.3.3. Converters

In the literature, complete and precise data are scarce regarding the modeling of DC/DC converters in LCA since they are usually considered part of the balance of the plant (BOP) or the power control unit. Although their role and influence on the performance of the vehicle were studied, the literature mostly focuses on their sizing, efficiency, and best configuration for the market [26,42,43]. However, little attention was given to their influence on the overall environmental impact of the vehicle and the materials used in its production. In this study, converters’ data were based on the work by Colnago et al. [11], as well as the materials and weights considered for their inventory.
The unidirectional DC/DC converter connected to the fuel cell is formed by parallel inductors, a capacitor, a transistor, and a diode to regulate the flux of current. The bidirectional converter connected to the battery is modeled by considering the same components of the fuel cell’s converter, with different parameters and without the diode. Inductors were modeled as being composed of sintered carbonyl iron and copper, and to model the carbonyl iron, the process ‘iron sinter, iron sinter production’ in Ecoinvent 3.7 was used. The parameters considered for the converters are reported in Table 5, while Table S10 displays the inventory for the production of the converters.

3.3.4. Hydrogen Tank

The hydrogen tank is a major contributor to the environmental impacts of the fuel cell system and also one of the key challenges for the whole FCEV industry [12]. According to various studies, the environmental impacts of the tank are comparable to the impacts of major components such as the glider or the fuel cell stack [33], with evidence that the tank alone could contribute even up to 50% to the overall impacts of the production phase when not considering the impacts of the glider itself [17]. Because of the low density presented by hydrogen, storage is one of the main issues in adopting and developing this technology, especially in the automotive field [33]. Hydrogen tanks must satisfy several parameters to provide optimal storage and safety, such as high volumetric and gravimetric energy densities, a good rate of fuel release, and being lightweight yet robust enough to ensure safety from flammability, explosions, or projections. Finally, the materials must not be toxic to human health. These characteristics are met by compressed gas tanks now available on the market, although their geometry requirements and positioning in the vehicle present some technological issues that are still being faced [44].
The main issue in modeling the hydrogen tank for LCA is the scarce availability of first-hand and freely available data about the production of carbon fiber, which is the main component of the tank [33]. The one considered in this study was modeled by taking into account the characteristics of the type IV tank of the Toyota Mirai. Type IV tanks present a multi-layered structure, with the first layer made of a polymeric material coated in aluminum, the second layer made mainly of carbon fiber, and finally a glass fiber layer combined with resin. The first layer is called the liner and blocks the passage of hydrogen completely; the second one provides mechanical resistance; and the final one is a protective layer [30]. The Mirai is equipped with two Type IV tanks with a total capacity of 122.4 L and approximately 5 kg of stored hydrogen, with a storage density of 5.7 wt% and an operating pressure of 700 bar [45]. For the sake of simplicity, a single tank with these characteristics was modeled for a total weight of 87.7 kg. Table S11 reports the considered inventory.

3.3.5. Battery

In FCEVs, the battery plays an important role in improving the efficiency of the vehicle and covers various tasks. It allows for the recovery of energy from regenerative braking and helps the fuel cell system deliver the required power [11,26]. The battery can increase the efficiency of the system but also reduce the size of the fuel cell stack and extend the maximum range [46].
As previously explained, the battery model in this work is a lithium manganese oxide lithium-ion battery (LMO Li-ion), referring to the study by Colnago et al. [11,35].
Because of the presence or absence of the converter linking the battery to the motor, the nominal voltage of the battery varies with the architecture considered. The ones having the battery converter (architectures A and C) use a battery pack with a nominal voltage of 325 V, while architecture B is equipped with a 650 V battery. This consideration does not influence the inventory of this study since the final weight and number of cells are the same for both types of batteries.
The battery pack was modeled following the study of Zhao et al. [47] for what concerns the composition of anode, cathode, and electrolyte, while it is based on the work by Ellingsen et al. [48] to model the cell, the auxiliaries, and the pack itself, adapting the data to the parameters considered by Colnago et al. [11], with a final weight of 42.24 kg. The whole inventory for the manufacturing of the battery pack can be seen in Tables S12–S17.

3.3.6. Glider and Electric Motor

The glider considered in this work includes the body of the vehicle, steering, braking, and suspension systems; tires; gearbox; cockpit equipment; fluids necessary for vehicle operation (brake fluid, transmission fluid, powertrain coolant, windscreen fluid, and adhesives); electronics nonrelated to the powertrain; and the hydrogen distribution system. The reference to model the gearbox, tires, fluids, and hydrogen distribution system was the work by Candelaresi et al. [13], while the rest of the components were described according to the model developed by Habermacher [41], adapted for a vehicle of 2130 kg (without battery), which is the weight assumed by Colnago et al. [11].
The electric motor was modeled with the powertrain, which also included the AC/DC inverter. The former was described according to Candelaresi et al. [13] and adapted for the considered power of 111 kW, while the inverter inventory was designed according to Habermacher [41] for a total weight of about 118 kg. The considered motor is common to all three configurations. The inventories for the glider, the motor, the inverter, and other auxiliaries are reported in the Supplementary Materials (Tables S18–S24).

3.3.7. Hydrogen Production

Finally, the production of hydrogen was modeled to account for its consumption during the use phase. For the purpose of this study, only the direct processes for the production of the fuel were considered, leaving upstream processes outside of the system boundaries.
The production of hydrogen as a fuel and the development of FCEV technology in the market are strictly connected, since, without the first, the second would not be competitive with the traditional means of transport. On the other hand, technologies for hydrogen production still have to overcome technical and economic issues, mainly concerning the infrastructure dedicated to hydrogen and the impacts of hydrogen policies on consumers [9].
Although the possibility of a renewable future for hydrogen production is present, its current state is still far from being environmentally neutral [8]. Currently, approximately 97% of the total hydrogen production is based on fossil primary energy, and only 3% is based on renewable energies [9].
For the purpose of this study, considering all these factors, the produced hydrogen was modeled as a mixture of hydrogen produced with the three most utilized production technologies, namely, steam methane reforming, coal gasification, and electrolysis [7], in proportions considered taking into account the study of Garbe et al. [49]: for each kilogram of hydrogen, hydrogen produced from SMR contributes 58%, while it accounts for 20% and 22%, respectively, from coal gasification and electrolysis.
The main feedstock of SMR is natural gas, consisting mostly of methane (CH4), with other heavier hydrocarbons and carbon dioxide [50,51]. Conversely, the gasification of coal exploits the natural abundance of coal as feedstock, as well as the high efficiency and reliability of the process [50,51]. Regarding water electrolysis, this study considered hydrogen as produced by an electrolytic cell based on a proton exchange membrane. The process of electrolysis can be considered environmentally friendly because no carbon feedstock is directly employed to produce hydrogen; however, there can still be impacts on climate change when considering upstream processes, such as the manufacturing of infrastructure and, more importantly, the source of electricity [8,51]. To account for the present situation of the production of electricity, the process utilized in the inventory was the production of electricity mix for Italy, as presented in Ecoinvent 3.7.
Tables S25–S27 report the inventory of hydrogen production from steam methane reforming, coal gasification, and electrolysis, respectively. The distribution phase was excluded from the system boundaries since it was not useful for the comparison of the different power systems considered.

3.4. Sensitivity Analysis

A sensitivity analysis was carried out to investigate how a completely green hydrogen production would influence the results among the three architectures. Even if a completely carbon-free hydrogen supply is unlikely to be achieved in a short time frame, it would be useful to take this scenario into consideration to study the performance of the architectures in a best-case scenario. In this regard, hydrogen would be entirely produced via electrolysis, using electricity from a renewable source, in particular offshore wind turbines [15]. The inventory considered for the sensitivity analysis is reported in Table S28.

4. Results

The inventories modeled in this study were implemented in SimaPro for the LCIA computation by exploiting the ReCiPe 2016 midpoint method and considering the categories summarized in Figure 4. This section reports only the most significant results, while the complete data are provided in the Supplementary Materials, in Tables S29–S37, and Figures S1 and S2. A Monte Carlo uncertainty analysis was also conducted, and its complete data are reported in Figures S5–S24.

4.1. Relative Contributions

The environmental impact contributions of each part of the inventory to the whole life cycle of architecture A are displayed in Figure 4, while those for architectures B and C are reported in Figures S1 and S2. Impacts of architecture A were chosen to display the overall contributions since both converters are present, allowing us to identify the categories in which their presence has more influence. The results show that the most impactful parts are the production of the glider and the production of hydrogen. These results are in line with those found in the literature [17,29]. When looking at the global warming potential, glider production contributes to 22% of total emissions, while hydrogen production makes up for almost 66% of them. When taking into consideration the other two configurations, the hydrogen production contribution rises to 67% in the case of architecture B and to 71% for architecture C (Tables S33 and S34). Other major contributors are the hydrogen tank, the powertrain, and the balance of the plant. These results highlight the categories where the influence of the converters has a larger impact, i.e., terrestrial ecotoxicity, human non-carcinogenic toxicity, and freshwater eutrophication.

4.2. Impacts of the Converters

Figure 5 shows in detail the contributions concerning the production of the fuel cell system, which is formed by the fuel cell stack, the battery, the balance of the plant, and the converters. The contribution of the “converter” entry for architectures B and C refers to either the fuel cell converter or the battery converter, respectively, while architecture A presents both. It should also be noted that the other components, except for the fuel cell stack, are considered to be the same. Regarding the FC stack, only the one used in architecture C is different. Even considering this dissimilarity, the main variability in the impacts is due to the converters, with architecture A showing the highest impacts in all categories. This result was expected since both converters are present. The fuel cell converter has a higher impact than the battery converter in the terrestrial ecotoxicity and human non-carcinogenic toxicity categories (Figure 5b,c), while the battery converter presents a higher contribution in the water eutrophication category (Figure 5a). Regarding the other categories considered, the direct impacts of the production of the converters have a negligible influence on the total environmental impacts of the vehicle (less than 4% of total impacts, as visible in Tables S32–S34).
On the other hand, the architecture of the power system influences the fuel consumption of the vehicle. This correlation has a heavy effect on the overall environmental impacts of the vehicle since the production of hydrogen is one of the most influential contributors to the total impacts for all the configurations.

4.3. Hydrogen Production Impacts

Production of hydrogen is a key factor in the development of hydrogen mobility and in diminishing the environmental impacts of fuel cell technology in automotive. In this work, the aim was to analyze and compare three different architectures of the power system, taking into consideration the present possibilities and technologies. For this reason, the model of hydrogen production was mainly based on fossil resources, resulting in high impacts and an overall large influence on the total environmental impacts of the vehicle. Figure 6 displays the three categories where hydrogen consumption has the highest variability among the configurations, i.e., global warming potential (Figure 6a), terrestrial acidification (Figure 6b), and fossil resource scarcity (Figure 6c).
The hydrogen consumption of the vehicle depends on the configuration used for its power system, with architecture A utilizing the least amount of hydrogen due to the better power control given by the presence of both converters and architecture C being the most fuel-consuming one [11].

5. Discussion

The results of this study highlight the main contributors to the environmental impacts of a fuel-cell electric vehicle. Concerning the manufacturing phase, the most impactful components of the global warming potential are the production of the glider, the fuel cell system (which is formed by the fuel cell stack, the battery, the balance of the plant, and the converters), and the hydrogen tank. This result is consistent with the majority of the considered categories, with the exception of terrestrial ecotoxicity and human non-carcinogenic toxicity, where the power train impacts are the second highest after glider production. The impacts of the converters are difficult to analyze. When considering the most meaningful categories (freshwater eutrophication, terrestrial ecotoxicity, and human non-carcinogenic toxicity), the differences among the three configurations can be significant in terms of converter-related impacts. Table 6 reports the data obtained from this study.
On the other hand, even when the contribution of these categories is visible, the influence on the total impacts is still low. Converters have the biggest impact in the terrestrial ecotoxicity category, where they contribute to 7.58% of the total impacts for configuration A, whereas for configuration B and configuration C, they contribute 4.46% and 3.22%, respectively. The remaining categories present even lower percentages, with the converters impacting 6.04% on the human non-carcinogenic toxicity for architecture A (architecture B: 3.25%, architecture C: 2.87%), and 4.35% on freshwater eutrophication (architecture B: 0.93%, architecture C: 3.42%). Their contribution becomes completely negligible in the other categories. Complete data on the total emissions and relative contributions for the three architectures is available in the Supplementary Materials, Tables S29–S34.
The indirect impacts of the converters are related to the use of a different fuel cell stack in the configuration that does not include the fuel cell converter and to the hydrogen consumption of the vehicle, depending on the considered architecture. The differences in the impacts for what concerns the fuel cell stacks are so minimal as to be negligible, while the differences in fuel consumption have a large influence on the total impacts.
When considering all these factors, it becomes clear that identifying the best architecture is not a trivial task. Figure 7 shows a radar graph summarizing all the impacts in each category for the three vehicles. The architecture presenting the smallest area in the graph is the one with the lowest overall impact. Architecture C is the most impactful configuration due to its higher hydrogen consumption. Considering the other two architectures, the results are much closer, with architecture A showing clearly lower impacts only in three categories (GWP, terrestrial acidification, and fossil resource scarcity), while architecture B shows slightly better impacts in the others. The categories where architecture B presents better impacts are those where the influence of the converters has a non-negligible role.
Since the results obtained from these LCIA are not enough to identify the best solution, another computation was conducted using the EF (adapted) method in SimaPro, with the aim of calculating total single score values for each configuration. These data summarize the impacts of each category in a single value, making possible the comparison of the three vehicles in their entirety. The results show that architecture A produces the lowest impacts, with a total single score of 446 µPt. Architecture B is about 3% more impactful, with a single score of 460 µPt, and finally, architecture C presents the highest impact, with a single score of 525 µPt, almost 18% higher than architecture A. The complete results of the analysis with the EF method are reported in Tables S35–S37.

6. Sensitivity Analysis Results

The sensitivity analysis conducted in this work explores the possibility of a best-case scenario in which hydrogen is completely produced by means of electrolysis powered by renewable sources and how this would influence the comparison among the architectures. The results highlight lower overall emissions and a considerable shift in the relative contributions of the components of the inventory for each impact category, as can be seen in Figure 8 for architecture A and in Figures S3 and S4 for architectures B and C.
The differences in the total global warming potential and the GWP due to the production of hydrogen for the base case and the best-case scenario are reported in Table 7.
It can be noted that the contribution to the emissions of fuel production decreases drastically, with total emissions following the same behavior. This is expected since hydrogen production is one of the top contributors to emissions in most impact categories. The results show how, with the decrease in total emissions, the difference among the three architectures is even thinner than in the base scenario previously considered. This can be noted in Figure 9, where the total emissions for the global warming potential category and the two categories where green hydrogen production has the highest contributions, i.e., freshwater and marine ecotoxicities, are reported. Architecture C still presents the highest emissions, with a larger gap with the other two architectures for the categories of freshwater ecotoxicity and marine ecotoxicity (Figure 9b,c); however, the differences among the three architectures are basically negligible in this scenario, as can be easily noted from Figure 9a.
A second computation was performed using the EF (adapted) method to obtain a final single score for each architecture. The computed scores confirm the results of the previous computation: the overall emissions are sensibly lower; however, the differences among the three architectures are negligible. With this new computation, architecture A seems to be performing slightly worse than the others (165.07 µPt against 164.83 µPt of architecture B, and 164.88 µPt scored by architecture C). This behavior is due to the presence of both converters in architecture A, whose emissions could have a heavier influence considering the reduced impacts of fuel production. The computed values, on the other hand, are too similar to each other to draw a certain conclusion on which architecture would perform better in a best-case scenario with a completely green production of hydrogen.
The complete results obtained in the sensitivity analysis are reported in the Supplementary Materials (Tables S38–S46 and Figures S3 and S4).

7. Conclusions

This work aims at analyzing and studying the environmental impacts of different architectures of the power system of an FCEV. These architectures present three different configurations in which the fuel cell stack and the battery are linked to the electric motor using a converter. The first configuration, i.e., architecture A, possesses two converters, with both the fuel cell stack and the battery linked to the electric motor. Architecture B, on the other hand, is only characterized by the converter connecting the fuel cell stack to the motor, while architecture C presents only the converter linking the battery to the powertrain.
The results show how the presence of the converters in the system does not only modify the impacts in the production phase but also, more importantly, those in the use phase. Hydrogen consumption is one of the most impactful processes in all the impact categories considered and the most important contributor to the global warming potential of the vehicle. Since architecture C has the highest hydrogen consumption among the three (0.02 kg/km), the produced impacts are larger than the other two architectures, producing a total of 285 g CO2 eq for each kilometer driven, compared to 241 g CO2 eq of architecture A and 249 g CO2 eq of architecture B. When researching the better architecture between A and B, the role of the converters becomes more important. Architecture A shows better GWP impacts due to the lower fuel consumption, but looking at the other environmental impact categories, it performs worse than architecture B. The largest differences are shown in the categories where the presence of the converters matters the most. The freshwater eutrophication impacts of architecture A are 5 mg P eq/km, while architecture B impacts 4.7 mg P eq/km. When considering the human non-carcinogenic toxicity, architecture A shows the highest impacts (53.3 g 1,4-DCB/km), higher than the impacts of architecture B (52.07 g 1,4-DCB/km), and even more than architecture C (53.22 g 1,4-DCB/km).
Since the data obtained from the midpoint study did not yield a clear result, the scores obtained from the endpoint LCIA computation were crucial to identifying the best architecture among the three. The final scores were rather similar for all the architectures; however, architecture C was identified as the most impactful overall (single score 525 µPt/km), and architecture A presented the lowest impacts (446 µPt/km), with architecture B showing total impacts only 3% larger (460 µPt/km).
The importance of the production of hydrogen was confirmed by the results obtained from a sensitivity analysis, where the fuel was considered to be produced with a completely green process, adopting electrolysis powered by renewable sources. This analysis showed how the impacts of the entire life of the vehicle decrease drastically (the final score of the three architectures is about 165 µPt in this case, against 446 µPt of the best performing architecture in the base scenario); however, the emissions of the three architectures are similar to each other. These results highlighted how, when the emissions of the use phase are reduced to their minimum, the differences in the manufacturing of the vehicle can be considered negligible, and so the three architectures could be considered equivalent from an environmental point of view. It has to be noted that the fuel consumption of each vehicle does not change; therefore, the overall fuel costs would still be lower for architecture A (the least consuming); however, at the same time, architecture A is still the most expensive due to the presence of both converters. In conclusion, as long as the production of hydrogen will depend on non-renewable sources, the most important factor when comparing the environmental impacts of different architectures of the power system in an FCEV is the hydrogen consumption of the vehicle during its use phase, followed by the impacts of the manufacturing of the converters.

Supplementary Materials

The following supporting information can be downloaded at: https://www.mdpi.com/article/10.3390/en16196782/s1. Section S1 Manufacturing of Proton Exchange Membrane Fuel Cell: Tables S1–S8; Section S2 Manufacturing of balance of plant, converters, and hydrogen tank: Tables S9–S11; Section S3 Manufacturing of battery pack: Tables S12–S17; Section S4 Manufacturing of glider, electric motor, and auxiliaries: Tables S18–S24; Section S5 Hydrogen production: Tables S25–S28; Section S6 Total environmental impacts (ReCiPe midpoint): Tables S29–S34, Figures S1 and S2; Section S7 Total environmental impacts (EF adapted): Tables S35–S37; Section S8 Sensitivity analysis results: Tables S38–S46, Figures S3 and S4; Section S9 Monte Carlo analysis: Figures S5–S24.

Author Contributions

Conceptualization, S.C., S.L., L.P. and G.D.; methodology, G.G., S.C. and G.D.; software, G.D.; validation, S.L., L.P. and G.D.; formal analysis, G.G., A.B.P. and S.C.; investigation, G.G., A.B.P. and S.C.; resources, L.P. and G.D.; data curation, G.G. and A.B.P.; writing—original draft preparation, G.G. and A.B.P.; writing—review and editing, S.C., S.L., L.P. and G.D.; visualization, G.G. and A.B.P.; supervision, S.L., L.P. and G.D. All authors have read and agreed to the published version of the manuscript.

Funding

This research received no external funding.

Institutional Review Board Statement

Not applicable.

Informed Consent Statement

Not applicable.

Data Availability Statement

The data presented in this study are available on request from the corresponding authors.

Conflicts of Interest

The authors declare no conflict of interest.

References

  1. Calvin, K.; Dasgupta, D.; Krinner, G.; Mukherji, A.; Thorne, P.W.; Trisos, C.; Romero, J.; Aldunce, P.; Barrett, K.; Blanco, G.; et al. IPCC, 2023: Climate Change 2023: Synthesis Report. Contribution of Working Groups I, II and III to the Sixth Assessment Report of the Intergovernmental Panel on Climate Change; Core Writing Team, Lee, H., Romero, J., Eds.; IPCC: Geneva, Switzerland, 2023. [CrossRef]
  2. European Commission. Make Transport Greener; European Commission: Brussels, Belgium, 2021; ISBN 978-92-76-39643-7.
  3. Amendment of the Regulation Setting CO2 Emission Standards for Cars and Vans | European Commission. Available online: https://commission.europa.eu/document/795ef764-4652-487e-bc36-1de43f1cdcef_en (accessed on 14 July 2023).
  4. Tong, F.; Azevedo, I.M.L. What Are the Best Combinations of Fuel-Vehicle Technologies to Mitigate Climate Change and Air Pollution Effects across the United States? Environ. Res. Lett. 2020, 15, 074046. [Google Scholar] [CrossRef]
  5. Meaza, I.; Zarrabeitia, E.; Rio-Belver, R.; Garechana, G. Fuel-Cell Electric Vehicles: Plotting a Scientific and Technological Knowledge Map. Sustainability 2020, 12, 2334. [Google Scholar] [CrossRef]
  6. Tazelaar, E.; Shen, Y.; Veenhuizen, P.A.; Hofman, T.; van den Bosch, P.P.J. Sizing Stack and Battery of a Fuel Cell Hybrid Distribution Truck. Oil Gas Sci. Technol. 2012, 67, 563–573. [Google Scholar] [CrossRef]
  7. Joshi, A.; Sharma, R.; Baral, B. Comparative Life Cycle Assessment of Conventional Combustion Engine Vehicle, Battery Electric Vehicle and Fuel Cell Electric Vehicle in Nepal. J. Clean. Prod. 2022, 379, 134407. [Google Scholar] [CrossRef]
  8. Hermesmann, M.; Müller, T.E. Green, Turquoise, Blue, or Grey? Environmentally Friendly Hydrogen Production in Transforming Energy Systems. Prog. Energy Combust. Sci. 2022, 90, 100996. [Google Scholar] [CrossRef]
  9. Bartolozzi, I.; Rizzi, F.; Frey, M. Comparison between Hydrogen and Electric Vehicles by Life Cycle Assessment: A Case Study in Tuscany, Italy. Appl. Energy 2013, 101, 103–111. [Google Scholar] [CrossRef]
  10. Olindo, R.; Schmitt, N.; Vogtländer, J. Life Cycle Assessments on Battery Electric Vehicles and Electrolytic Hydrogen: The Need for Calculation Rules and Better Databases on Electricity. Sustainability 2021, 13, 5250. [Google Scholar] [CrossRef]
  11. Colnago, S.; Mauri, M.; Carmeli, S.; Piegari, L. Cost and Efficiency Analysis of Different Powertrain Architectures for Fuel Cell Electric Vehicles. In Proceedings of the 2020 International Symposium on Power Electronics, Electrical Drives, Automation and Motion (SPEEDAM), Sorrento, Italy, 24–26 June 2020; pp. 275–280. [Google Scholar] [CrossRef]
  12. Evangelisti, S.; Tagliaferri, C.; Brett, D.J.L.; Lettieri, P. Life Cycle Assessment of a Polymer Electrolyte Membrane Fuel Cell System for Passenger Vehicles. J. Clean. Prod. 2017, 142, 4339–4355. [Google Scholar] [CrossRef]
  13. Candelaresi, D.; Valente, A.; Iribarren, D.; Dufour, J.; Spazzafumo, G. Comparative Life Cycle Assessment of Hydrogen-Fuelled Passenger Cars. Int. J. Hydrogen Energy 2021, 46, 35961–35973. [Google Scholar] [CrossRef]
  14. Das, J. Life Cycle Analysis of Hydrogen Production and Fuel Cell Electric Vehicle in Indian Conditions. In Proceedings of the 2022 IEEE 19th India Council International Conference (INDICON), Kochi, India, 24–26 November 2022; pp. 1–5. [Google Scholar] [CrossRef]
  15. Delpierre, M.; Quist, J.; Mertens, J.; Prieur-Vernat, A.; Cucurachi, S. Assessing the Environmental Impacts of Wind-Based Hydrogen Production in the Netherlands Using Ex-Ante LCA and Scenarios Analysis. J. Clean. Prod. 2021, 299, 126866. [Google Scholar] [CrossRef]
  16. Wulf, C.; Kaltschmitt, M. Hydrogen Supply Chains for Mobility—Environmental and Economic Assessment. Sustainability 2018, 10, 1699. [Google Scholar] [CrossRef]
  17. Miotti, M.; Hofer, J.; Bauer, C. Integrated Environmental and Economic Assessment of Current and Future Fuel Cell Vehicles. Int. J. Life Cycle Assess 2017, 22, 94–110. [Google Scholar] [CrossRef]
  18. Wang, B.; Li, Z.; Zhou, J.; Cong, Y.; Li, Z. Technological-Economic Assessment and Optimization of Hydrogen-Based Transportation Systems in China: A Life Cycle Perspective. Int. J. Hydrogen Energy 2023, 48, 12155–12167. [Google Scholar] [CrossRef]
  19. Wang, Y.; Pang, Y.; Xu, H.; Martinez, A.; Chen, K.S. PEM Fuel Cell and Electrolysis Cell Technologies and Hydrogen Infrastructure Development—A Review. Energy Environ. Sci. 2022, 15, 2288–2328. [Google Scholar] [CrossRef]
  20. Barbir, F. PEM Fuel Cells: Theory and Practice; Academic Press: Cambridge, MA, USA, 2012; ISBN 978-0-12-387710-9. [Google Scholar]
  21. Sun, S.; Su, Y.; Yin, C.; Jermsittiparsert, K. Optimal Parameters Estimation of PEMFCs Model Using Converged Moth Search Algorithm. Energy Rep. 2020, 6, 1501–1509. [Google Scholar] [CrossRef]
  22. Hasuka, Y.; Sekine, H.; Katano, K.; Nonobe, Y. Development of Boost Converter for MIRAI. In Proceedings of the SAE 2015 World Congress & Exhibition, Detroit, MI, USA, 21–23 April 2015; pp. 1–6. [Google Scholar] [CrossRef]
  23. Sakka, M.A.; Mierlo, J.V.; Gualous, H.; Sakka, M.A.; Mierlo, J.V.; Gualous, H. DC/DC Converters for Electric Vehicles. In Electric Vehicles—Modelling and Simulations; IntechOpen: London, UK, 2011; ISBN 978-953-307-477-1. [Google Scholar]
  24. Maroti, P.K.; Padmanaban, S.; Bhaskar, M.S.; Ramachandaramurthy, V.K.; Blaabjerg, F. The State-of-the-Art of Power Electronics Converters Configurations in Electric Vehicle Technologies. Power Electron. Devices Compon. 2022, 1, 100001. [Google Scholar] [CrossRef]
  25. Das, V.; Padmanaban, S.; Venkitusamy, K.; Selvamuthukumaran, R.; Blaabjerg, F.; Siano, P. Recent Advances and Challenges of Fuel Cell Based Power System Architectures and Control—A Review. Renew. Sustain. Energy Rev. 2017, 73, 10–18. [Google Scholar] [CrossRef]
  26. Pathak, P.; Yadav, A.; Padmanaban, S.; Alvi, P.A.; Kamwa, I. Fuel Cell-Based Topologies and Multi-Input DC-DC Power Converters for Hybrid Electric Vehicles: A Comprehensive Review. IET Gener. Transm. Distrib. 2022, 16, 2111–2139. [Google Scholar] [CrossRef]
  27. Ecoinvent Database. Available online: https://ecoinvent.org/the-ecoinvent-database/ (accessed on 14 July 2023).
  28. Proposal for Amendments to Global Technical Regulation No. 15 on Worldwide Harmonized Light Vehicles Test Procedure (WLTP). Available online: https://unece.org/fileadmin/DAM/trans/doc/2016/wp29grpe/ECE-TRANS-WP29-GRPE-2016-03e_clean.pdf (accessed on 14 July 2023).
  29. Chen, Y.; Hu, X.; Liu, J. Life Cycle Assessment of Fuel Cell Vehicles Considering the Detailed Vehicle Components: Comparison and Scenario Analysis in China Based on Different Hydrogen Production Schemes. Energies 2019, 12, 3031. [Google Scholar] [CrossRef]
  30. Bethoux, O. Hydrogen Fuel Cell Road Vehicles: State of the Art and Perspectives. Energies 2020, 13, 5843. [Google Scholar] [CrossRef]
  31. Wong, E.Y.C.; Ho, D.C.K.; So, S.; Tsang, C.-W.; Chan, E.M.H. Life Cycle Assessment of Electric Vehicles and Hydrogen Fuel Cell Vehicles Using the GREET Model—A Comparative Study. Sustainability 2021, 13, 4872. [Google Scholar] [CrossRef]
  32. Yumiya, H.; Kizaki, M.; Asai, H. Toyota Fuel Cell System (TFCS). World Electr. Veh. J. 2015, 7, 85–92. [Google Scholar] [CrossRef]
  33. Benitez, A.; Wulf, C.; de Palmenaer, A.; Lengersdorf, M.; Röding, T.; Grube, T.; Robinius, M.; Stolten, D.; Kuckshinrichs, W. Ecological Assessment of Fuel Cell Electric Vehicles with Special Focus on Type IV Carbon Fiber Hydrogen Tank. J. Clean. Prod. 2021, 278, 123277. [Google Scholar] [CrossRef]
  34. Arrigoni, A.; Arosio, V.; Basso Peressut, A.; Latorrata, S.; Dotelli, G. Greenhouse Gas Implications of Extending the Service Life of PEM Fuel Cells for Automotive Applications: A Life Cycle Assessment. Clean Technol. 2022, 4, 132–148. [Google Scholar] [CrossRef]
  35. Ding, Y.; Cano, Z.P.; Yu, A.; Lu, J.; Chen, Z. Automotive Li-Ion Batteries: Current Status and Future Perspectives. Electrochem. Energy Rev. 2019, 2, 1–28. [Google Scholar] [CrossRef]
  36. Sun, J.; Ye, L.; Zhao, X.; Zhang, P.; Yang, J. Electronic Modulation and Structural Engineering of Carbon-Based Anodes for Low-Temperature Lithium-Ion Batteries: A Review. Molecules 2023, 28, 2108. [Google Scholar] [CrossRef] [PubMed]
  37. 2023 Toyota Mirai Features and Specs. Available online: https://www.toyota.com/mirai/features/ (accessed on 14 July 2023).
  38. Usai, L.; Hung, C.; Vásquez, F.; Windsheimer, M.; Burheim, O.; Strømman, A. Life Cycle Assessment of Fuel Cell Systems for Light Duty Vehicles, Current State-of-the-Art and Future Impacts. J. Clean. Prod. 2020, 280, 125086. [Google Scholar] [CrossRef]
  39. Notter, D.A.; Kouravelou, K.; Karachalios, T.; Daletou, M.K.; Haberland, N.T. Life Cycle Assessment of PEM FC Applications: Electric Mobility and μ-CHP. Energy Environ. Sci. 2015, 8, 1969–1985. [Google Scholar] [CrossRef]
  40. Cullen, D.A.; Neyerlin, K.C.; Ahluwalia, R.K.; Mukundan, R.; More, K.L.; Borup, R.L.; Weber, A.Z.; Myers, D.J.; Kusoglu, A. New Roads and Challenges for Fuel Cells in Heavy-Duty Transportation. Nat. Energy 2021, 6, 462–474. [Google Scholar] [CrossRef]
  41. Habermacher, F. Modeling Material Inventories and Environmental Impacts of Electric Passenger Cars. Master’s Thesis, Department of Enviropnmental Science, ETH Zurich, Zurich, Switzerland, 2011. [Google Scholar]
  42. Kabalo, M.; Blunier, B.; Bouquain, D.; Miraoui, A. State-of-the-Art of DC-DC Converters for Fuel Cell Vehicles. In Proceedings of the 2010 IEEE Vehicle Power and Propulsion Conference, Lille, France, 1–3 September 2010; pp. 1–6. [Google Scholar] [CrossRef]
  43. Kolli, A.; Gaillard, A.; De Bernardinis, A.; Bethoux, O.; Hissel, D.; Khatir, Z. A Review on DC/DC Converter Architectures for Power Fuel Cell Applications. Energy Convers. Manag. 2015, 105, 716–730. [Google Scholar] [CrossRef]
  44. Rivard, E.; Trudeau, M.; Zaghib, K. Hydrogen Storage for Mobility: A Review. Materials 2019, 12, 1973. [Google Scholar] [CrossRef]
  45. Toyota Mirai FCV, Outline. Available online: https://www.inae.it/files/Toyota-Mirai-FCV_Posters_LR_tcm-20-564265.pdf (accessed on 30 March 2023).
  46. Offer, G.J.; Howey, D.; Contestabile, M.; Clague, R.; Brandon, N.P. Comparative Analysis of Battery Electric, Hydrogen Fuel Cell and Hybrid Vehicles in a Future Sustainable Road Transport System. Energy Policy 2010, 38, 24–29. [Google Scholar] [CrossRef]
  47. Zhao, S.; You, F. Comparative Life-Cycle Assessment of Li-Ion Batteries through Process-Based and Integrated Hybrid Approaches. ACS Sustain. Chem. Eng. 2019, 7, 5082–5094. [Google Scholar] [CrossRef]
  48. Ellingsen, L.A.-W.; Majeau-Bettez, G.; Singh, B.; Srivastava, A.K.; Valøen, L.O.; Strømman, A.H. Life Cycle Assessment of a Lithium-Ion Battery Vehicle Pack. J. Ind. Ecol. 2014, 18, 113–124. [Google Scholar] [CrossRef]
  49. Garbe, S.; Andres, J. Life Cycle Assessment of PEM Fuel Cell Vehicles. Master’s Thesis, Institut für Werkzeugmaschinen und Fertigungstechnik, Technische Universität Braunschweig, Braunschweig, Germany, 2020. [Google Scholar]
  50. Mehmeti, A.; Angelis-Dimakis, A.; Arampatzis, G.; McPhail, S.J.; Ulgiati, S. Life Cycle Assessment and Water Footprint of Hydrogen Production Methods: From Conventional to Emerging Technologies. Environments 2018, 5, 24. [Google Scholar] [CrossRef]
  51. Simons, A.; Bauer, C. Life Cycle Assessment of Hydrogen Production. In Transition to Hydrogen: Pathways toward Clean Transportation; Wokaun, A., Wilhelm, E., Eds.; Cambridge University Press: Cambridge, UK, 2011; pp. 13–57. ISBN 978-1-139-01803-6. [Google Scholar]
Figure 1. Depiction of the structure, working principle, and reactions of a proton exchange membrane fuel cell are shown in the figure: GDL—gas diffusion layer; MPL—microporous layer; CL—catalyst layer. Adapted with permission from the work by Wang et al. [19].
Energies 16 06782 g001
Figure 2. Architectures of the PEMFCEV power system.
Energies 16 06782 g002
Figure 3. FCEV component scheme.
Energies 16 06782 g003
Figure 4. Relative contributions to the whole life cycle of architecture A.
Energies 16 06782 g004
Figure 5. Fuel cell system production impacts depending on the architecture type (A, B, or C). The considered impact categories are: (a) freshwater eutrophication; (b) terrestrial ecotoxicity; (c) human non-carcinogenic toxicity.
Energies 16 06782 g005
Figure 6. The impacts of the vehicle depending on its architecture (A, B, or C). The considered impact categories are: (a) global warming potential; (b) terrestrial acidification; (c) fossil resource scarcity.
Energies 16 06782 g006
Figure 7. Comparison of the three architectures for each category considered.
Energies 16 06782 g007
Figure 8. The relative contributions of each component considering a completely green hydrogen production.
Energies 16 06782 g008
Figure 9. The impacts of the vehicle depending on the architecture (A, B, or C), when completely green hydrogen production is considered. The reported impact categories are: (a) global warming potential; (b) freshwater ecotoxicity; (c) marine ecotoxicity.
Energies 16 06782 g009
Table 1. Main parameters of a Toyota Mirai (2015).
ParameterDataUnits
Total mass (no battery)2130kg
Max power output111kW
Driving range500km
Fuel cell system (PEM)111.2kW
Battery (LMO Li-ion)26.6kW
Table 2. Parameters of the PEMFC stack, depending on the configuration.
Fuel CellStack A and BStack C
ParametersDataUnitDataUnit
Power density2.00kW/kg2.00kW/kg
Cell current density (max power)2.11A/cm22.11A/cm2
Cell voltage maximum power0.60V0.60V
Number of cells370 783
Active area237cm2110cm2
Current at max power500.07A/cm2232.10A/cm2
Voltage at max power222V469.80V
Maximum power111.02kW109.04kW
Total mass55.51kg54.52kg
Table 3. Inventory for the production of the fuel cell stack of architectures A and B. The data reported in the table were adapted from the work by Evangelisti et al. [12].
Fuel Cell Stacks A and B
Inputsamountunitremarks
Bipolar plates38.3kgBased on 1.266 W/cm2 of active area and 0.0237 m2 active area per cell
Coolant gaskets1.67kg
MEA6.11kg
End plates and tie-rods9.43kg
Outputamountunitremarks
Fuel cell stack A and B55.51kgFinal product
Table 4. Inventory for the production of the fuel cell stack of architecture C. The data reported in the table were adapted from the work by Evangelisti et al. [12].
Fuel Cell Stack C
Inputsamountunitremarks
Bipolar plates37.62kgBased on 1.266 W/cm2 of active area and 0.011 m2 active area per cell
Coolant gaskets1.64kg
MEA6.00kg
End plates and tie-rods9.27kg
Outputamountunitremarks
Fuel cell stack C54.52kgFinal product
Table 5. Sizing parameters of DC/DC converters.
ParameterFC ConverterBattery Converter
Switching frequency10 [kHz]10 [kHz]
Inductance L65 [µH]650 [µH]
Capacitance C76 [µF]20 [µF]
Weight16.98 [kg]8.036 [kg]
Table 6. The impacts of converters in the most significant impact categories, depending on the architecture type.
Impact CategoryUnitArchitecture AArchitecture BArchitecture C
Freshwater eutrophicationg P eq2.14×10−44.44×10−51.70×10−4
Terrestrial ecotoxicityg 1,4-DCB67.738.928.8
Human non-carcinogenic toxicityg 1,4-DCB3.221.691.53
Table 7. Comparison of the emissions for the base and best-case scenarios.
Base ScenarioBest-Case Scenario
Impact CategoryUnitTotalHydrogen ProductionTotalGreen Hydrogen Production
AGlobal warmingkg CO2 eq0.24120.15880.09600.0136
BGlobal warmingkg CO2 eq0.24900.16700.09630.0143
CGlobal warmingkg CO2 eq0.28530.20370.09910.0174
Disclaimer/Publisher’s Note: The statements, opinions and data contained in all publications are solely those of the individual author(s) and contributor(s) and not of MDPI and/or the editor(s). MDPI and/or the editor(s) disclaim responsibility for any injury to people or property resulting from any ideas, methods, instructions or products referred to in the content.

