

Does Solar-Powered Irrigation System Usage Increase the Technical Efficiency of Crop Production? New Insights from Rural Areas


Abstract
:1. Introduction
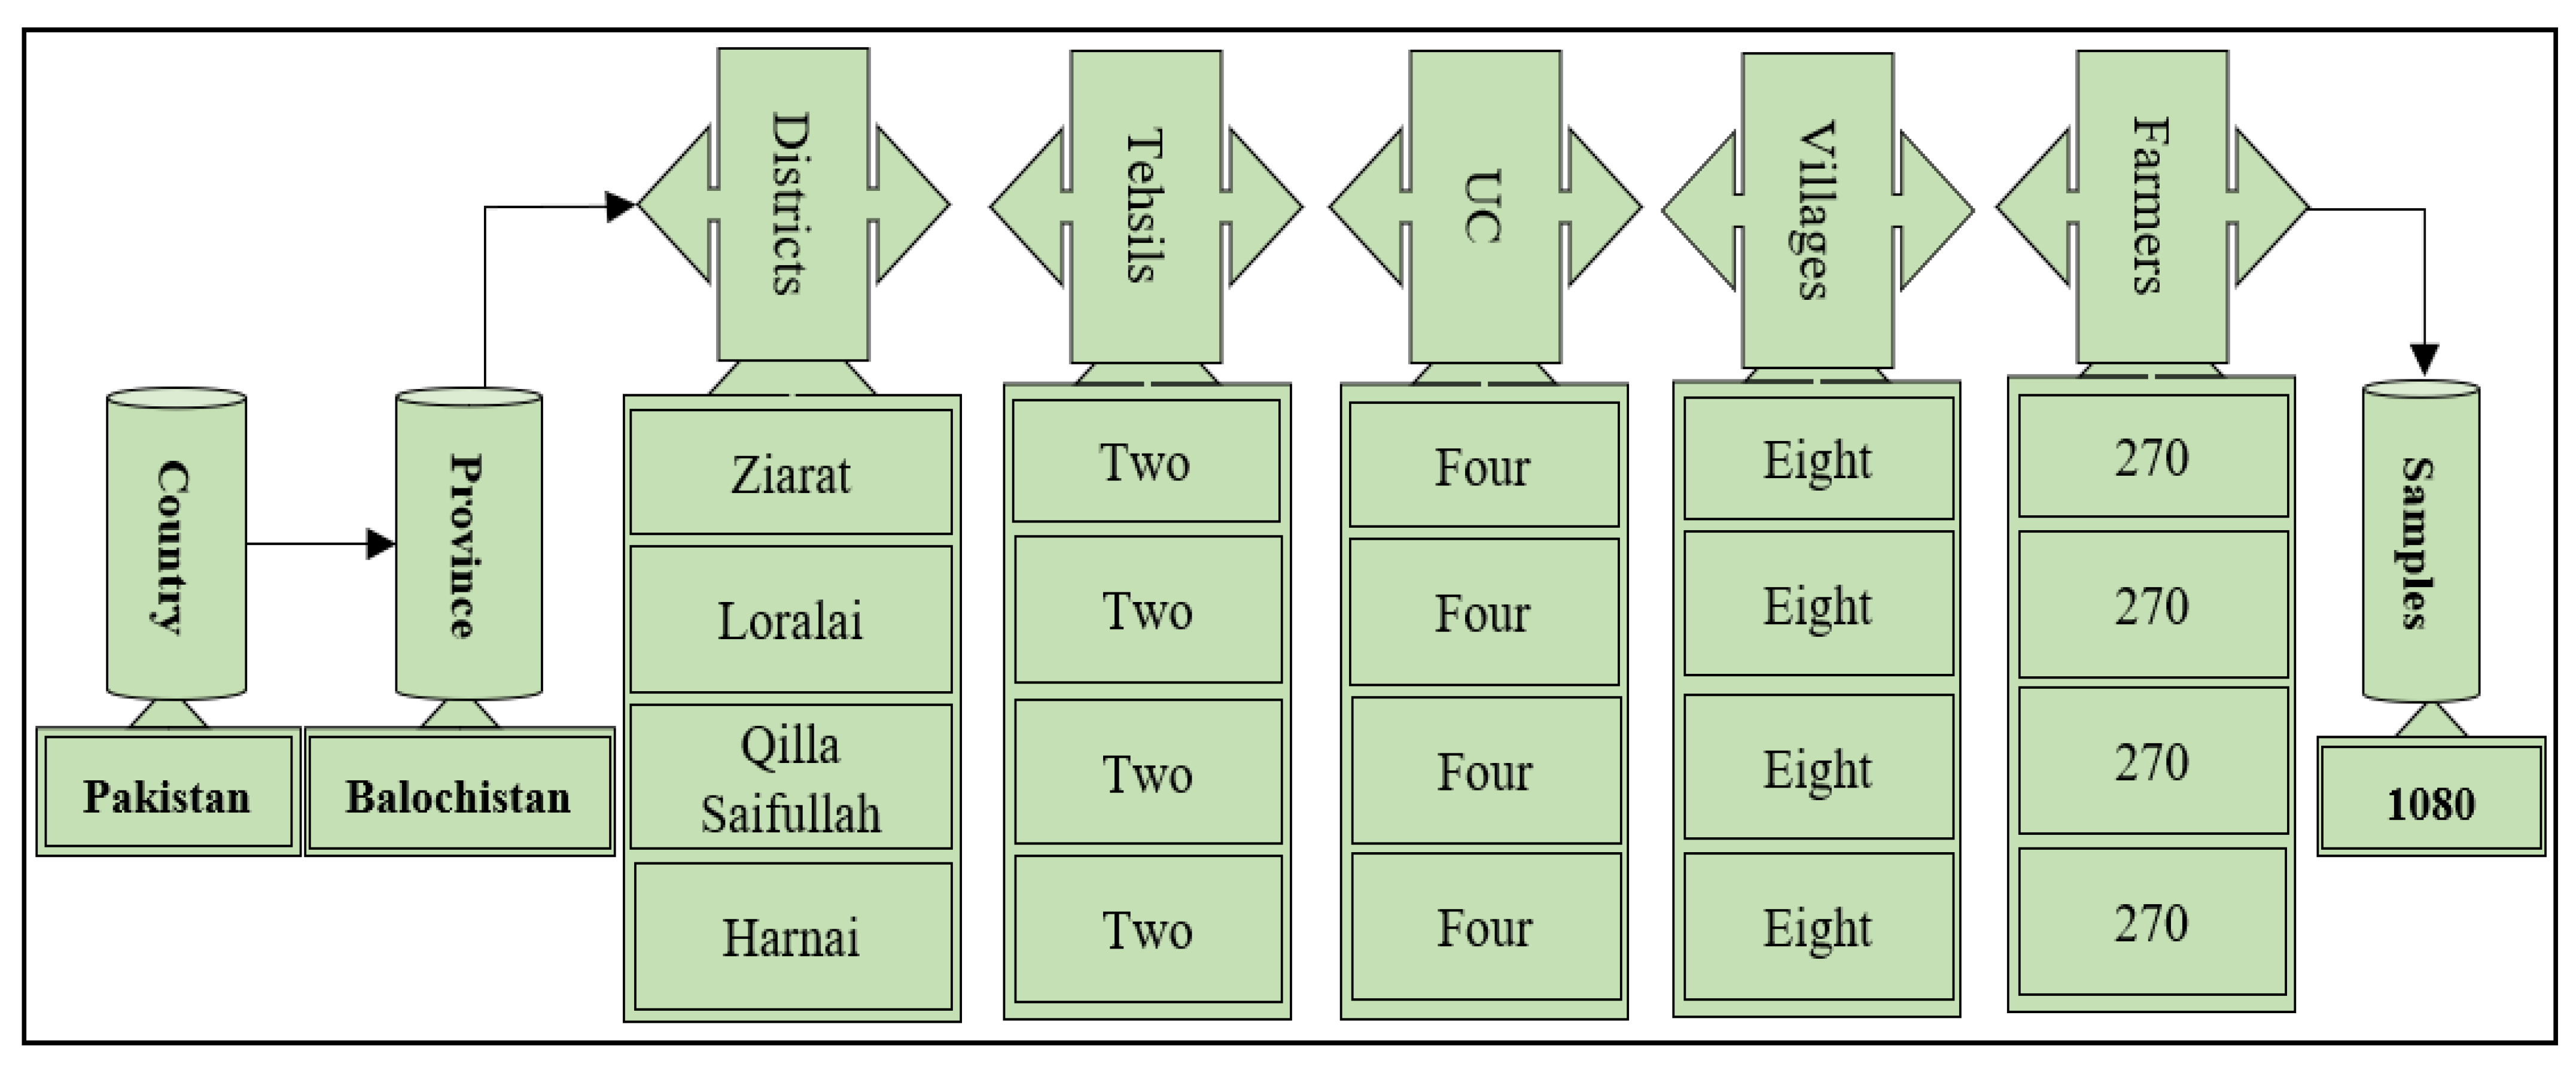
2. Study Area
3. Methodology
3.1. Data Collection
3.2. Empirical Methods
3.2.1. The SFPF Model
3.2.2. The ESR Model
4. Empirical Results
4.1. Descriptive Statistics of the Model Variables
4.2. Technical Efficiency Estimation
4.3. Determinants of Using SPISs
4.4. Impacts of SPIS Usage for Irrigation and Other Variables on TE
4.5. Robustness Check
4.6. Investigation of Heterogeneity
5. Discussion
6. Conclusion, Policy Implications, Limitations, and Future Directions
6.1. Conclusions
6.2. Policy Implications
6.3. Limitations and Future Directions
Author Contributions
Funding
Institutional Review Board Statement
Informed Consent Statement
Data Availability Statement
Conflicts of Interest
References
- Sunny, F.A.; Islam, M.A.; Karimanzira, T.T.P.; Lan, J.; Rahman, M.S.; Zuhui, H. Adoption impact of solar based irrigation facility by water-scarce northwestern areas farmers in Bangladesh: Evidence from panel data analysis. Front. Energy Res. 2023, 10, 2039. [Google Scholar] [CrossRef]
- Ben Hassen, T.; El Bilali, H. Impacts of the Russia-Ukraine war on global food security: Towards more sustainable and resilient food systems? Foods 2022, 11, 2301. [Google Scholar] [CrossRef] [PubMed]
- Ali, A.; Behera, B. Factors influencing farmers’ adoption of energy-based water pumps and impacts on crop productivity and household income in Pakistan. Renew. Sustain. Energy Rev. 2016, 54, 48–57. [Google Scholar] [CrossRef]
- Mukherji, A.; Shah, T. Groundwater socio-ecology and governance: A review of institutions and policies in selected countries. Hydrogeol. J. 2005, 13, 328–345. [Google Scholar] [CrossRef]
- Shahid, S.; Alamgir, M.; Wang, X.-j.; Eslamian, S. Climate change impacts on and adaptation to groundwater. In Handbook of Drought and Water Scarcity; CRC Press: Boca Raton, FL, USA, 2017; pp. 107–124. [Google Scholar]
- Hussain, F.; Maeng, S.-J.; Cheema, M.J.M.; Anjum, M.N.; Afzal, A.; Azam, M.; Wu, R.-S.; Noor, R.S.; Umair, M.; Iqbal, T.J.W. Solar Irrigation Potential, Key Issues and Challenges in Pakistan. Water 2023, 15, 1727. [Google Scholar] [CrossRef]
- Pandey, R. Groundwater Irrigation in Punjab: Some Issues and a Way Forward; Springer: Berlin/Heidelberg, Germany, 2016; pp. 97–117. [Google Scholar]
- Jahangiri, M.; Nematollahi, O.; Heidari Sooreshjani, E.; Heidari Sooreshjani, A. Investigating the current state of solar energy use in countries with strong radiation potential in asia using GIS software, a review. J. Sol. Energy Res. 2020, 5, 477–497. [Google Scholar]
- Salimi, M.; Hosseinpour, M.; Borhani, N.T. Analysis of Solar Energy Development Strategies for a Successful Energy Transition in the UAE. Processes 2022, 10, 1338. [Google Scholar] [CrossRef]
- Rafique, M.M.; Rehman, S.; Alhems, L.M. Assessment of solar energy potential and its deployment for cleaner production in Pakistan. J. Mech. Sci. Technol. 2020, 34, 3437–3443. [Google Scholar] [CrossRef]
- Shah, S.; Solangi, Y.; Ikram, M. Analysis of barriers to the adoption of cleaner energy technologies in Pakistan using Modified Delphi and Fuzzy Analytical Hierarchy Process. J. Clean. Prod. 2019, 235, 1037–1050. [Google Scholar] [CrossRef]
- Tahir, Z.; Asim, M.J.R.; Reviews, S.E. Surface measured solar radiation data and solar energy resource assessment of Pakistan: A review. Renew. Sustain. Energy Rev. 2018, 81, 2839–2861. [Google Scholar] [CrossRef]
- Hassan, M.; Afridi, M.K.; Khan, M.I. An overview of alternative and renewable energy governance, barriers, and opportunities in Pakistan. Energy Environ. 2018, 29, 184–203. [Google Scholar]
- Asif, M. Energy Crisis in Pakistan: Origins, Challenges, and Sustainable Solutions; OUP Catalogue; Oxford University Press: Oxford, UK, 2012. [Google Scholar]
- Sandilah, M.N.; Yasin, H.M. Economic growth and regional convergence: The case of Pakistan. Pak. Dev. Rev. 2011, 50, 333–353. [Google Scholar] [CrossRef]
- Rafique, M.M.; Rehman, S. National energy scenario of Pakistan–Current status, future alternatives, and institutional infrastructure: An overview. Renew. Sustain. Energy Rev. 2017, 69, 156–167. [Google Scholar] [CrossRef]
- Finance, M.O. Pakistan Economic Survey, 2020-21; Finance Division, Government of Pakistan Islamabad: Islamabad, Pakistan, 2021. [Google Scholar]
- Ali, S.; Liu, Y.; Ishaq, M.; Shah, T.; Ilyas, A.; Din, I.U. Climate change and its impact on the yield of major food crops: Evidence from Pakistan. Foods 2017, 6, 39. [Google Scholar] [CrossRef]
- Bhutto, A.W.; Bazmi, A.A.; Zahedi, G. Greener energy: Issues and challenges for Pakistan—Solar energy prospective. Renew. Sustain. Energy Rev. 2012, 16, 2762–2780. [Google Scholar]
- Abbas, T.; Ali, G.; Adil, S.A.; Bashir, M.K.; Kamran, M.A. Economic analysis of biogas adoption technology by rural farmers: The case of Faisalabad district in Pakistan. Renew. Energy 2017, 107, 431–439. [Google Scholar] [CrossRef]
- Arab, A.H.; Chenlo, F.; Mukadam, K.; Balenzategui, J. Performance of PV water pumping systems. Renew. Energy 1999, 18, 191–204. [Google Scholar] [CrossRef]
- Raza, F.; Tamoor, M.; Miran, S.; Arif, W.; Kiren, T.; Amjad, W.; Hussain, M.I.; Lee, G.-H. The socio-economic impact of using Photovoltaic (PV) energy for high-efficiency irrigation systems: A case study. Energies 2022, 15, 1198. [Google Scholar] [CrossRef]
- Belaud, G.; Mateos, L.; Aliod, R.; Buisson, M.C.; Faci, E.; Gendre, S.; Ghinassi, G.; Gonzales Perea, R.; Lejars, C.; Maruejols, F. Irrigation and energy: Issues and challenges. Irrig. Drain. 2020, 69, 177–185. [Google Scholar] [CrossRef]
- Aziz, M.F.; Abdulaziz, N. Prospects and challenges of renewable energy in Pakistan. In Proceedings of the 2010 IEEE International Energy Conference, Manama, Bahrain, 18–22 December 2010; pp. 161–165. [Google Scholar]
- Tariq, G.H.; Ashraf, M.; Hasnain, U.S. Solar Technology in Agriculture. In Technology in Agriculture; IntechOpen: London, UK, 2021; p. 387. [Google Scholar]
- Purohit, P. Financial evaluation of renewable energy technologies for irrigation water pumping in India. Energy Policy 2007, 35, 3134–3144. [Google Scholar] [CrossRef]
- Shinde, V.; Wandre, S. Solar photovoltaic water pumping system for irrigation: A review. Afr. J. Agric. Res. 2015, 10, 2267–2273. [Google Scholar]
- Wong, S. Decentralised, off-grid solar pump irrigation systems in developing countries—Are they pro-poor, pro-environment and pro-women? In Climate Change-Resilient Agriculture and Agroforestry: Ecosystem Services and Sustainability; Springer: Berlin/Heidelberg, Germany, 2019; pp. 367–382. [Google Scholar]
- McCarthy, B.; Anex, R.; Wang, Y.; Kendall, A.D.; Anctil, A.; Haacker, E.M.; Hyndman, D.W. Trends in water use, energy consumption, and carbon emissions from irrigation: Role of shifting technologies and energy sources. Environ. Sci. Technol. 2020, 54, 15329–15337. [Google Scholar] [CrossRef] [PubMed]
- Kwofie, E.; Ngadi, M. A review of rice parboiling systems, energy supply, and consumption. Renew. Sustain. Energy Rev. 2017, 72, 465–472. [Google Scholar] [CrossRef]
- Guno, C.S.; Agaton, C.B. Socio-economic and environmental analyses of solar irrigation systems for sustainable agricultural production. Sustainability 2022, 14, 6834. [Google Scholar] [CrossRef]
- Hilarydoss, S. Suitability, sizing, economics, environmental impacts and limitations of solar photovoltaic water pumping system for groundwater irrigation—A brief review. Environ. Sci. Pollut. Res. 2021, 30, 71491–71510. [Google Scholar]
- Chowdhury, B.H.; Ula, S.; Stokes, K. Photovoltaic-powered water pumping-design, and implementation: Case studies in Wyoming. IEEE Trans. Energy Convers. 1993, 8, 646–652. [Google Scholar] [CrossRef]
- García, A.M.; Gallagher, J.; McNabola, A.; Poyato, E.C.; Barrios, P.M.; Díaz, J.R. Comparing the environmental and economic impacts of on-or off-grid solar photovoltaics with traditional energy sources for rural irrigation systems. Renew. Energy 2019, 140, 895–904. [Google Scholar]
- Sowby, R.B.; Dicataldo, E. The energy footprint of US irrigation: A first estimate from open data. Energy Nexus 2022, 6, 100066. [Google Scholar] [CrossRef]
- Alaofè, H.; Burney, J.; Naylor, R.; Taren, D. Solar-powered drip irrigation impacts on crops production diversity and dietary diversity in Northern Benin. Food Nutr. Bull. 2016, 37, 164–175. [Google Scholar] [CrossRef]
- Ceballos-Escalera, A.; Molognoni, D.; Bosch-Jimenez, P.; Shahparasti, M.; Bouchakour, S.; Luna, A.; Guisasola, A.; Borràs, E.; Della Pirriera, M. Bioelectrochemical systems for energy storage: A scaled-up power-to-gas approach. Appl. Energy 2020, 260, 114138. [Google Scholar] [CrossRef]
- Gangwar, A.; Singh, A.K.; Kumari, N.; Rai, A.; Kumar, M. Solar Based Irrigation Pump for AgriculturalCrop Production. Indian Farmer 2020, 7, 515–518. [Google Scholar]
- Lefore, N.; Closas, A.; Schmitter, P. Solar for all: A framework to deliver inclusive and environmentally sustainable solar irrigation for smallholder agriculture. Energy Policy 2021, 154, 112313. [Google Scholar] [CrossRef]
- Agrawal, S.; Jain, A. Sustainable deployment of solar irrigation pumps: Key determinants and strategies. Wiley Interdiscip. Rev. Energy Environ. 2019, 8, e325. [Google Scholar]
- Islam, M.; Hossain, M. Economic Feasibility of Solar Irrigation Pumps: A Study of Northern Bangladesh. Int. J. Renew. Energy Dev. 2022, 11, 1–11. [Google Scholar] [CrossRef]
- Sunny, F.A.; Fu, L.; Rahman, M.S.; Huang, Z. Determinants and impact of solar irrigation facility (SIF) adoption: A case study in Northern Bangladesh. Energies 2022, 15, 2460. [Google Scholar] [CrossRef]
- Rana, J.; Kamruzzaman, M.; Oliver, M.H.; Akhi, K. Financial and factors demand analysis of solar powered irrigation system in Boro rice production: A case study in Meherpur district of Bangladesh. Renew. Energy 2021, 167, 433–439. [Google Scholar] [CrossRef]
- Shami, S.H.; Ahmad, J.; Zafar, R.; Haris, M.; Bashir, S. Evaluating wind energy potential in Pakistan’s three provinces, with proposal for integration into national power grid. Renew. Sustain. Energy Rev. 2016, 53, 408–421. [Google Scholar] [CrossRef]
- Abdullah, R.; Ahmed, N. Political Status of Balochistan from 1971 to 1988. Pak. Study Cent. 2018, 8, 325–334. [Google Scholar]
- Ashraf, M.; Routray, J.K. Perception and understanding of drought and coping strategies of farming households in north-west Balochistan. Int. J. Disaster Risk Reduct. 2013, 5, 49–60. [Google Scholar] [CrossRef]
- Di Falco, S.; Veronesi, M.; Yesuf, M. Does adaptation to climate change provide food security? A micro-perspective from Ethiopia. Am. J. Agric. Econ. 2011, 93, 829–846. [Google Scholar] [CrossRef]
- Asfaw, S.; McCarthy, N.; Lipper, L.; Arslan, A.; Cattaneo, A. What determines farmers’ adaptive capacity? Empirical evidence from Malawi. Food Sec. 2016, 8, 643–664. [Google Scholar] [CrossRef]
- Huang, J.; Wang, Y.; Wang, J. Farmers’ adaptation to extreme weather events through farm management and its impacts on the mean and risk of rice yield in China. Am. J. Agric. Econ. 2015, 97, 602–617. [Google Scholar] [CrossRef]
- Zhang, C.; Sun, Y.; Hu, R.; Yang, F.; Shen, X. The impact of rural-urban migration experience on fertilizer use: Evidence from rice production in China. J. Clean. Prod. 2021, 280, 124429. [Google Scholar] [CrossRef]


| Variables | Explanation of Variables | Mean (S.D.) |
|---|---|---|
| SPIS | 1 = if farmer uses SPIS, 0 = No | 0.137 (0.49) |
| Wheat yield | Wheat yield (kg/ha) | 1995.5 (290.5) |
| Gender | 1 = If the household head is male, 0 = No | 0.828 (0.377) |
| Age | Farmers’ age (years) | 57.00 (9.680) |
| Education | Farmers’ education (years) | 6.622 (3.281) |
| Poverty | 1 = if the farmer is below the poverty line; 0 = No | 0.481 (0551) |
| Tube well | 1 = if farmer has a tube well; 0 = No | 0.292 (0.660) |
| Electricity | 1 = if the farmers’ energy source is electricity; 0 = No | 0.633 (0.521) |
| Load shedding | Load shedding during a day (hours) | 10.57 (7.53) |
| Diesel | 1 = if the farmers’ energy source is diesel; 0 = No | 0.38 (0.63) |
| Farm size | The area under production (ha) | 1.944 (10.95) |
| Labor | Labor (1000 h/ha) | 0.442 (0.410) |
| Direct seeding | 1 = if grower adopt direct seeding; 0 = No | 0.470 (0.498) |
| Hybrid | 1 = if grower adopt hybrid variety; 0 = No | 0.486 (0.499) |
| Agri-Extension | 1 = if extension services available; 0 = No | 0.270 (0.383) |
| Organic | Organic fertilizer (kg/ha) | 0.637 (3.880) |
| Chemical | Chemical fertilizer (kg/ha) | 0.520 (0.349) |
| Pesticide | Pesticide (kg/ha) | 16.43 (18.40) |
| Variables Name | SPIS Users (n = 300) | SPIS Non-Users (n = 780) | Differences | ||
|---|---|---|---|---|---|
| Mean | S.D | Mean | S.D | ||
| Wheat yield | 8.430 | 1.651 | 7.942 | 1.703 | 0.488 *** |
| Gender | 0.902 | 0.298 | 0.904 | 0.295 | 0.002 |
| Age | 49.445 | 9.132 | 57.160 | 9.220 | −7.715 *** |
| Education | 9.065 | 2.520 | 6.140 | 3.221 | 2.925 *** |
| Poverty | 21.94 | 7.59 | 24.22 | 7.88 | −2.28 *** |
| Tube well | 10.51 | 4.45 | 10.41 | 4.40 | 0.09 |
| Electricity | 11.10 | 2.17 | 10.11 | 2.07 | 0.98 *** |
| Load shedding | 0.59 | 0.29 | 0.51 | 0.24 | 0.08 *** |
| Diesel | 0.27 | 0.45 | 0.20 | 0.40 | 0.07 * |
| Farm size | 7.747 | 28.333 | 1.021 | 3.800 | 6.7726 *** |
| Labor | 0.286 | 0.307 | 0.466 | 0.419 | −0.181 *** |
| Direct seeding | 0.411 | 0.489 | 0.480 | 0.511 | −0.10 |
| Hybrid | 0.421 | 0.489 | 0.488 | 0.501 | 0.067 |
| Agri-Extension | 0.20 | 0.40 | 0.08 | 0.29 | 0.12 *** |
| Organic | 0.715 | 5.550 | 0.624 | 3.556 | 0.091 |
| Pesticide | 11.807 | 12.085 | 17.165 | 19.121 | −5.356 *** |
| Chemical | 0.496 | 0.299 | 0.526 | 0.358 | −0.029 |
| Variables Name | Coeff. (S.E.) |
|---|---|
| SFPF model | |
| LnLabor | −0.015 * (0.009) |
| LnOrganic | 0.006 ** (0.002) |
| LnPesticide | −0.001 (0.005) |
| LnChemical | 0.017 *** (0.005) |
| Hybrid | 0.058 *** (0.076) |
| District affects | Yes |
| CONS | 9.105 *** (0.074) |
| Equation of efficiency | |
| SPIS | −0.181 (0.169) |
| Gender | −0.204 (0.185) |
| Age | −0.007 (0.006) |
| Education | −0.040 ** (0.018) |
| Poverty | 0.087 (0.065) |
| Tube well | 0.218 *** (0.077) |
| Electricity | 0.018 (0.022) |
| Load shedding | − 0.005 (0.075) |
| Diesel | 0.119 (0.081) |
| Ln(Farm size | −0.044 (0.047) |
| Direct seeding | 0.481 *** (0.131) |
| Hybrid | 0.005 (0.0201) |
| Agri-Extension | 0.121 *** (0.045) |
| District effects | Yes |
| CONS | −1.069 ** (0.464) |
| Log-likelihood | 214.243 (Prob > χ2 = 0.579) |
| Sample numbers | 1080 |
| Group | Mean (S.D) |
|---|---|
| Total | 81.191 (11.255) |
| Farmers use SPISs | 83.656 (10.027) |
| Farmers do not use SPISs | 80.801 (11.393) |
| Differences | 2.855 *** |
| Variables Name | SPIS | TE | ||||
|---|---|---|---|---|---|---|
| Farmers Use SPISs for Irrigation | Farmers Do Not Use SPISs for Irrigation | |||||
| Gender | −0.305 | 0.202 | 6.952 *** | 2.332 | 1.085 | 1.365 |
| Age | −0.035 *** | 0.007 | 0.032 | 0.086 | 0.078 * | 0.041 |
| Education | 0.121 *** | 0.021 | 0.660 ** | 0.342 | 0.264 ** | 0.113 |
| Poverty | 10.46 | 4.42 | 10.51 | 4.45 | 10.41 | 4.40 |
| Tube well | 0.50 | 0.50 | 0.49 | 0.50 | 0.51 | 0.50 |
| Electric | 0.14 | 0.34 | 0.19 | 0.39 | 0.08 | 0.27 |
| Load shedding | 0.36 | 0.48 | 0.40 | 0.49 | 0.31 | 0.46 |
| Diesel | 52.05 | 7.62 | 49.07 | 6.95 | 55.34 | 6.96 |
| LnFarm size | 0.195 *** | 0.038 | 0.660 | 0.457 | −0.384 | 0.300 |
| Direct seeding | −0.204 | 0.132 | −3.054 | 1.988 | −4.290 *** | 0.815 |
| Hybrid | −0.161 | 0.167 | 0.687 | 3.344 | −0.577 | 0.969 |
| Agri-Extension | 0.55 | 0.27 | 0.59 | 0.29 | 0.51 | 0.24 |
| District effects | Yes | Yes | Yes | Yes | Yes | Yes |
| IV | 0.611 *** | 0.199 | ||||
| Constant | −0.220 | 0.455 | 58.22 *** | 7.444 | 66.059 *** | 3.040 |
| ρωυ1 | 0.211 ** | 0.096 | ||||
| ρωυ0 | −0.269 *** | 0.070 | ||||
| Indep. eqs. (χ2) | 18.539 *** | |||||
| Sample numbers | 1080 | 300 | 780 | |||
| Variables Name | SPIS | TE | ||
|---|---|---|---|---|
| IV | 0.452 *** | 0.199 | 1.139 | 0.772 |
| Gender | −0.309 | 0.199 | 0.882 | 1.358 |
| Age | −0.033 *** | 0.008 | 0.054 | 0.042 |
| Education | 0.123 *** | 0.022 | 0.330 *** | 0.115 |
| Poverty | 0.117 ** | 0.047 | 0.130 ** | 0.046 |
| Tube well | 0.110 *** | 0.039 | 0.094 ** | 0.046 |
| Electric | 0.099 | 0.244 | 0.040 | 0.153 |
| Load shedding | 0.040 | 0.029 | 0.095 ** | 0.044 |
| Diesel | 0.077 | 0.043 | 0.132 | 0.045 |
| LnFarm size | 0.197 *** | 0.040 | −0.240 | 0.296 |
| Direct seeding | −0.205 | 0.135 | −4.511 *** | 0.821 |
| Hybrid | −0.300 * | 0.159 | −0.739 | 0.960 |
| Agri-Extension | 0.031 | 0.076 | −0.045 | 0.063 |
| District effects | Yes | Yes | ||
| Constant | −0.109 | 0.451 | 67.436 *** | 3.030 |
| Samples numbers | 1080 | 1080 | ||
| Group | TE (%) | ATT | |
|---|---|---|---|
| SPIS Use | SPIS Non-Use | ||
| Farmers obtain irrigation from SPISs | 82.670 | 74.005 | 8.665 *** |
| Variables Name | SPIS | TE | ||
|---|---|---|---|---|
| SPIS | 0.328 | 0.155 | 6.250 *** | 2.117 |
| Gender | −0.283 | 0.204 | 2.046 | 1.272 |
| Age | −0.035 *** | 0.008 | 0.086 ** | 0.040 |
| Education | 0.124 *** | 0.022 | 0.265 ** | 0.111 |
| Poverty | 0.009 | 0.008 | 0.008 | 0.008 |
| Tube well | 0.062 *** | 0.019 | 0.056 *** | 0.020 |
| Electric | 0.096 | 0.145 | 0.077 | 0.146 |
| Load shedding | 0.577 ** | 0.270 | 0.457 | 0.287 |
| Diesel | 0.034 | 0.025 | 0.034 | 0.026 |
| LnFarm size | 0.199 *** | 0.040 | −0.210 | 0.364 |
| Direct seeding | −0.191 | 0.134 | −4.090 | 0.749 |
| Hybrid | −0.249 | 0.169 | −0.284 * | 0.935 |
| Agri-Extension | 0.429 *** | 0.120 | 0.390 *** | 0.120 |
| District effects | Yes | Yes | ||
| IV | 0.540 *** | 0.200 | ||
| Constant | −0.205 | 0.456 | 64.720 *** | 2.950 |
| ρωυ | −0.250 *** | 0.093 | ||
| Indep. eqs. (χ2) | 6.700 *** | |||
| Sample numbers | 1080 | 1080 | ||
| Farmers Use SPISs for Irrigation | TE (%) | ATT | |
|---|---|---|---|
| Usage of SPISs | Non-Usage of SPISs | ||
| Farming experience (years) | |||
| >35 | 83.055 | 75.478 | 7.577 *** |
| ≤35 | 81.265 | 70.819 | 10.446 *** |
| Farm size (ha) | |||
| >1 | 84.123 | 73.878 | 10.245 *** |
| ≤1 | 81.578 | 77.299 | 4.279 *** |
| Across districts | |||
| Ziarat and Loralai | 84.558 | 81.150 | 3.408 *** |
| Qilla Saifullah and Harnai | 80.400 | 70.140 | 10.26 *** |
Disclaimer/Publisher’s Note: The statements, opinions and data contained in all publications are solely those of the individual author(s) and contributor(s) and not of MDPI and/or the editor(s). MDPI and/or the editor(s) disclaim responsibility for any injury to people or property resulting from any ideas, methods, instructions or products referred to in the content. |
© 2023 by the authors. Licensee MDPI, Basel, Switzerland. This article is an open access article distributed under the terms and conditions of the Creative Commons Attribution (CC BY) license (https://creativecommons.org/licenses/by/4.0/).
Share and Cite
Ullah, I.; Khan, N.; Dai, Y.; Hamza, A. Does Solar-Powered Irrigation System Usage Increase the Technical Efficiency of Crop Production? New Insights from Rural Areas. Energies 2023, 16, 6641. https://doi.org/10.3390/en16186641
Ullah I, Khan N, Dai Y, Hamza A. Does Solar-Powered Irrigation System Usage Increase the Technical Efficiency of Crop Production? New Insights from Rural Areas. Energies. 2023; 16(18):6641. https://doi.org/10.3390/en16186641
Chicago/Turabian StyleUllah, Ihsan, Nawab Khan, Yonghong Dai, and Amir Hamza. 2023. "Does Solar-Powered Irrigation System Usage Increase the Technical Efficiency of Crop Production? New Insights from Rural Areas" Energies 16, no. 18: 6641. https://doi.org/10.3390/en16186641
APA StyleUllah, I., Khan, N., Dai, Y., & Hamza, A. (2023). Does Solar-Powered Irrigation System Usage Increase the Technical Efficiency of Crop Production? New Insights from Rural Areas. Energies, 16(18), 6641. https://doi.org/10.3390/en16186641