1. Introduction
Demand response (DR) is a mechanism that enables electricity customers to adjust their consumption in response to changes in the price of electricity or to signals from the electricity grid operator. The goal of this adjustment is to ensure the balance between supply and demand on the electricity grid, which can then help to reduce the need for expensive and polluting peaking power plants and improve the reliability and efficiency of the electricity system [
1].
DR programs can be divided into two main categories: economic and reliability programs. Economic DR programs, in most cases, provide incentives to customers to reduce their electricity consumption during periods of high demand and high prices. Reliability DR programs, in most cases, provide incentives to customers to reduce their consumption or shift it to a different time to prevent blackouts [
2]. In rare cases, there is a need to increase consumption to prevent frequency or voltage imbalance in low demand periods.
The importance of DR in the electricity market has increased with the growth of distributed energy resources such as solar and wind power, which can be highly variable and difficult to predict. The integration of these resources into the grid requires new methods of balancing supply and demand in real time, and DR can play a critical role in this process. Additionally, with the increasing focus on decarbonization, DR can be an important tool to reduce greenhouse gas emissions by reducing the need for fossil-fueled power plants.
DR can be implemented by electricity customers acting alone, but increasingly it is being implemented by aggregators. Aggregators can also provide value in terms of energy efficiency, energy storage, and renewable energy [
3].
In this paper, we will focus on the possible roles of aggregators in the European electricity markets and analyze the most advanced countries in Europe and their markets/prices. The paper will provide an overview of prices in electricity markets in which DR aggregators can participate, and in the end, it will provide recommendations for aggregators in terms of which markets to focus on. Currently, aggregators cannot participate in all electricity market mechanisms due to technical or regulatory barriers.
The European electricity market is a complex and dynamic system that is undergoing significant changes, driven by factors such as the integration of renewable energy, the liberalization of the market, and the increasing need for balancing supply and demand. The market is composed of national and regional markets, each with its own regulatory framework, market design, and pricing mechanisms.
The liberalization of the European electricity market began in the late 1990s with the goal of creating a single market for electricity across the European Union. This process involved the separation of electricity generation, transmission, and distribution, and the introduction of competition in the generation and supply of electricity. The market is now composed of different market segments, such as the day-ahead, intraday, balancing, and capacity markets, each with its own rules, prices, and participants.
The role of aggregators in the European electricity market is to act as intermediaries between electricity customers and the market. They do this by aggregating the load of large industrial customers or many small customers, such as households and small businesses, which are the main focus of this paper, and participating in various market segments on their behalf. By doing so, aggregators can help customers reduce their electricity costs and increase their participation in the market [
4,
5]. They are expected to play an important role in the integration of renewable energy into the grid, by providing flexibility and balancing services, and in the decarbonization of the electricity sector.
From the renewable energy perspective, DR aggregators play an important role by helping to balance the supply and demand of electricity. As more renewable energy sources such as wind and solar are integrated into the grid, the variability of their output can make it difficult to maintain grid stability and meet demand. DR aggregators work by coordinating and incentivizing consumers to reduce their electricity consumption during periods of high demand or when the supply of renewable energy is low. By reducing consumption, they can help to reduce the strain on the grid and prevent the need for fossil fuel-based power plants to be brought online to meet demand [
6,
7].
However, the regulatory framework for aggregators is still evolving in Europe, and there are significant differences between countries in terms of the rules and incentives for aggregators. This can create challenges for aggregators, as they need to navigate different market designs, regulatory frameworks, and pricing mechanisms in order to provide services to their customers. This is certainly creating barriers for aggregators looking to become active in several member states [
8].
Therefore, the main objective of this paper is to provide an overview of prices in markets in which aggregators can participate and to identify markets on which aggregators should focus. Specifically, the paper aims to:
- (1)
Analyze different types of markets in which aggregators can participate in the European electricity market, including day-ahead, intraday, capacity, and balancing markets.
- (2)
Survey market prices in European countries that are considered advanced in DR and the electricity market.
- (3)
Evaluate the challenges and opportunities for aggregators in the European electricity market, considering the different regulatory frameworks, market designs, and pricing mechanisms.
- (4)
Provide recommendations for aggregators on which markets to focus on in order to maximize profits and minimize risks.
In order to achieve these objectives, the paper will use a combination of literature review and data analysis. The end result of this paper is to provide a comprehensive review of the prices in markets in which aggregators can participate in the European market and recommendations for aggregators concerning which markets to focus on.
3. Literature Review of Types of Markets in Which Aggregators Can Participate
The so-called Electricity Directive [
9] requires “the fair participation of aggregators in all electricity markets and that transmission and distribution system operators treat aggregators equally with other market participants”. Each of the electricity markets has its own rules, prices, and participants, and can offer different opportunities and challenges for aggregators.
The literature about aggregators is extensive and covers a broad area, from describing the value of aggregators for the electricity system [
10,
11] and consumers [
12], to aggregator profit maximization through optimal scheduling [
13,
14], to aggregator behavior in the electricity markets [
15,
16,
17,
18,
19,
20,
21]. The literature on DR and aggregator participation in electricity markets has shown that DR can be an effective tool for balancing supply and demand on the grid and that aggregators can play an important role in providing flexibility and balancing services [
22,
23,
24,
25,
26]. Aggregators’ business models have been thoroughly researched [
27,
28,
29,
30,
31,
32]. However, there are still gaps in our understanding of the opportunities and challenges for aggregators in different European markets, and how these markets are behaving in terms of prices [
33,
34,
35].
One gap in the literature is the lack of a comprehensive analysis of the prices in different market segments in which aggregators can participate. While some studies have examined the prices in specific markets, such as the day-ahead or balancing markets, there is a need for a more comprehensive analysis of the prices in different market segments, and how these prices are affecting the opportunities and challenges for aggregators. Another gap in the literature is the lack of a comprehensive analysis of different market segments from the aggregators’ perspective.
3.1. Day-Ahead Market
To participate in the day-ahead market, a demand-response aggregator would first analyze its end users’ energy usage patterns to identify periods of high and low demand when it is able to reduce or increase consumption without causing any negative impacts on operations. Based on this analysis, the aggregator would then determine how much energy it is able to curtail or shift during each hour of the following day. Next, the aggregator would submit bids to the market operator for each hour of the following day, indicating the amount of energy it is willing to reduce or increase consumption by and the price it is willing to accept for providing this service. The market operator evaluates all the bids it receives from all market participants, to determine the optimal mix of resources needed to meet expected demand for each hour of the following day [
36].
Based on this evaluation, the market operator sets a clearing price for each hour of the following day. This is the price that all market participants will receive if their bids are accepted. If the aggregator’s bid is accepted, it is notified of the clearing price for each hour and the amount of energy it is expected to curtail or shift during each hour.
The aggregator then uses its resources in a way to activate the necessary energy adjustment measures. For example, it may temporarily adjust thermostats or turn off non-essential equipment during the designated time periods, taking the comfort factor into account.
At the end of the trading day, the aggregator reports back to the market operator on the actual amount of energy it was able to curtail or shift. If it meets its commitment, it receives payment at the clearing price for each hour.
Overall, participating in the day-ahead market allows demand-response aggregators to monetize the flexibility of their end users’ energy consumption while also helping to balance the overall electricity grid and prevent blackouts or other disruptions. By reducing the need for expensive peaking power plants, demand response can help to lower electricity prices and reduce greenhouse gas emissions.
3.2. Intraday Market
Intraday markets allow market participants, including demand-response aggregators, to adjust their energy commitments on a more short-term basis. For example, if unexpected changes in weather or other factors lead to higher-than-expected demand for electricity, the market operator may need to call upon additional resources to balance the grid.
To participate in the intraday market, a demand-response aggregator would first need to establish a connection to the market operator’s systems, typically through a third-party provider. This connection would allow the aggregator to receive real-time information about market conditions and submit bids to adjust its energy commitments accordingly.
When the aggregator identifies an opportunity to curtail, shift, or increase energy usage in response to changing market conditions, it would submit an offer to the market operator indicating the amount of energy it is willing to reduce or increase consumption by and the price it is willing to accept for providing this service. The market operator evaluates all of the offers it receives from demand-response aggregators and other market participants to determine the optimal mix of resources needed to balance the grid in real time [
6].
If the aggregator’s offer is accepted, it is notified of the clearing price for the current hour and the amount of energy it is expected to curtail or shift during that hour. The aggregator then uses its resources in a way to activate the necessary energy adjustment measures.
At the end of the hour, the aggregator reports back to the market operator on the actual amount of energy it was able to curtail or shift. If it meets its commitment, it receives payment at the clearing price for that hour.
Overall, participating in the intraday market allows demand-response aggregators to adjust their energy commitments on a more short-term basis in response to changing market conditions and maximize their profit.
3.3. Balancing Market
The balancing market (BM) is a mechanism that the TSO uses to balance the supply and demand of electricity in real time. It provides a mechanism for the TSO to procure energy or capacity from market participants who have not been able to balance their generation and schedule in the IDM or have sudden outages. The balancing market is typically used as a last resort to maintain the balance of the system and avoid grid instability.
The main difference between providing balancing services to a grid operator through the IDM and the BM lies in the timing and duration of the service provision. In the IDM, balancing services are provided to the grid operator to help maintain the balance between electricity supply and demand in real time, as changes in electricity consumption and production can occur quickly and unexpectedly. These services are typically provided on a short-term basis, with the aim of addressing any imbalances that may arise in the electricity system.
On the other hand, the BM is a longer-term market where balancing services are procured by the grid operator for a longer duration, typically several days or weeks in advance. In the BM, the grid operator procures a portfolio of services to cover different types of imbalances that may occur over a longer period of time. In the BM, on the day of delivery, individual imbalances of Balance Responsible Parties (BRPs) are calculated. A BRP is a market participant that is responsible for ensuring that the energy it generates or consumes is in balance with its energy schedule. Participants in BRPs are aggregators, energy suppliers, generators, or large consumers, who have contracted to deliver or consume a certain amount of electricity within a given timeframe. Negative and positive individual imbalances occur when BRPs are over or under the contracted value. BRPs are financially responsible for their individual imbalances, and the imbalances are settled through the calculated imbalance prices. A price that is paid for negative imbalances is called a “negative imbalance price”, and a price that is paid for positive imbalances is called a “positive imbalance price”. The net sum of all individual imbalances of each BRP is called the system imbalance.
When it is not equal to zero, the system imbalance leads to a deviation from the nominal system frequency (50 Hz in Europe). The TSO is responsible for eliminating the imbalance in the system and restoring the system frequency to its nominal value. To do so, the TSO activates reserve power in cases of system imbalance. If there is a shortfall in the system (negative system imbalance), the up-reserve is activated, i.e., an increase in production or a decrease in consumption. Likewise, if there is a surplus in the system (positive system imbalance), the down-reserve is activated, i.e., a decrease in production or an increase in consumption.
Specifically, in most countries in Europe, there are three types of reserves that contribute to balancing frequency: frequency containment reserve, automatic frequency restoration reserve, and manual frequency restoration reserve.
The frequency containment reserve (FCR) is known as the primary reserve. It is the first type of reserve activated by the TSO. It is used to stabilize the system frequency and restrict greater frequency deviations.
The automatic frequency restoration reserve (aFRR) is known as the secondary reserve, automatically activated to bring the system frequency back to its nominal value.
The manual frequency restoration reserve (mFRR) is known as the tertiary reserve, used for significant imbalances that last for a long time and to take over the role of automated reserves in order to be ready for new imbalances. The TSO manually activates the mFRR if the available capacity of the aFRR drops below a certain threshold.
Balancing energy can be activated by increasing/decreasing production or consumption. Capacity and balancing energy markets in most European countries are separated. The capacity market results in a capacity reservation price (payment for reservation), while the balance energy market determines the balance energy price (payment for activation).
Aggregators can offer reserves of power to the transmission system operators (TSOs) to help eliminate imbalances in the system in exchange for payment for reservations and/or activation by the TSO. Aggregated portfolio management creates an opportunity to make offers in the FCR, aFRR, or mFRR markets. The activation of the reserves of power must be quite rapid, even as quickly as 30 s. The secondary reserve is usually activated within five minutes according to the table, while the tertiary must be activated within 15 min. The market is transparent, and its price sets the reference price for the calculation of imbalances that occur days after the delivery of energy.
In the case of DR, the aggregator offers the amount of energy/power that can be increased or reduced, and the TSO decides whether to accept the offer or not [
37].
3.4. Capacity Market
Capacity markets are designed to provide incentives for market participants, including demand-response aggregators, to invest in new or existing resources that can provide capacity to the grid during periods of peak demand. In a capacity market, market participants are paid for their ability to provide a certain amount of capacity over a specified period of time.
To participate in a capacity market, a demand-response aggregator would first need to submit an offer indicating the amount of capacity it is able to provide over the specified period of time, typically in the form of a commitment to reduce or increase energy consumption during peak high or low demand periods. For example, the aggregator may commit to reducing energy consumption by 1 MW during the peak high demand period from 2–3 pm every weekday for the next three years. Based on these offers, the market operator determines the total amount of capacity needed to meet expected demand during the specified period of time and sets a clearing price for this capacity. If the aggregator’s offer is accepted, it is notified of the clearing price and the amount of capacity it is expected to provide over the specified period of time.
The aggregator should then communicate with its end-users to implement the necessary energy adjustment measures to provide the committed capacity during peak demand periods. At the end of the specified period of time, the aggregator reports back to the market operator on the actual amount of capacity it provided. If it meets its commitment, it receives payment at the clearing price for the capacity it provided.
Overall, participating in a capacity market provides DR aggregators with a long-term revenue stream and incentives to invest in new or existing resources that can provide capacity to the grid during periods of peak demand. However, some studies still show that the capacity remuneration schemes currently implemented provide inadequate incentives to DR operators—for example, [
38].
4. Market Data Collection and Analysis
The following chapter contains tables and graphs showing various features of electricity markets in more advanced European countries in terms of DR and market mechanisms, namely Austria, Belgium, Finland, France, Germany, and the Netherlands [
39,
40,
41,
42,
43,
44,
45,
46,
47,
48,
49]. The goal of the European electricity market is to have the lowest possible barrier to participation in the energy markets and to have the shortest possible trading and readout periods. The long-term EU goal is to establish the integrated market-oriented procurement of the mFRR, FRR, FCR, and RR reserve mechanisms [
50,
51]. As opposed to the balancing and reserve mechanisms, DAMs and IDMs across Europe are well-coupled [
52,
53]. In the following sections, market characteristics for each country have been analyzed and compared according to:
To decide whether to participate in DAMs, IDMs, or ancillary services, the demand-response aggregator should consider several factors. Firstly, the aggregator should analyze the price signals in the DAMs/IDMs and the ancillary services market to determine which market offers the best opportunities for their flexibility assets. Secondly, the aggregator should assess the flexibility of their assets, the size and duration of their bids, and the level of risk they are willing to take. Thirdly, the aggregator should consider operational and technical requirements for participating in each market segment, such as the minimum and maximum bid sizes, the time for submitting bids, and the ramp rate of their assets. Finally, the aggregator should evaluate the potential benefits and costs of participating in each market segment, such as the revenue earned from the market, the cost of balancing their assets, and any regulatory requirements for participating in each segment. By considering these factors, the aggregator can make an informed decision on which market segment to participate in and optimize their revenue streams.
In electricity markets, there are two types of prices: average and marginal prices. Average prices are calculated based on the total amount of energy traded in a given time period, divided by the total cost of that energy. These prices provide an overall picture of market trends and can be used for long-term planning purposes. On the other hand, marginal prices are calculated based on the cost of the last unit of energy traded in the market, which sets the price for all units of energy traded at that time. Marginal prices are crucial for short-term trading and balancing purposes, as they reflect the actual cost of supplying energy at a given moment. While both average and marginal prices provide valuable insights into electricity market mechanisms, it is important to consider both when making informed decisions about participating in the market. In this paper, average prices are mostly used in the analysis of ancillary services, and marginal prices are used for wholesale markets.
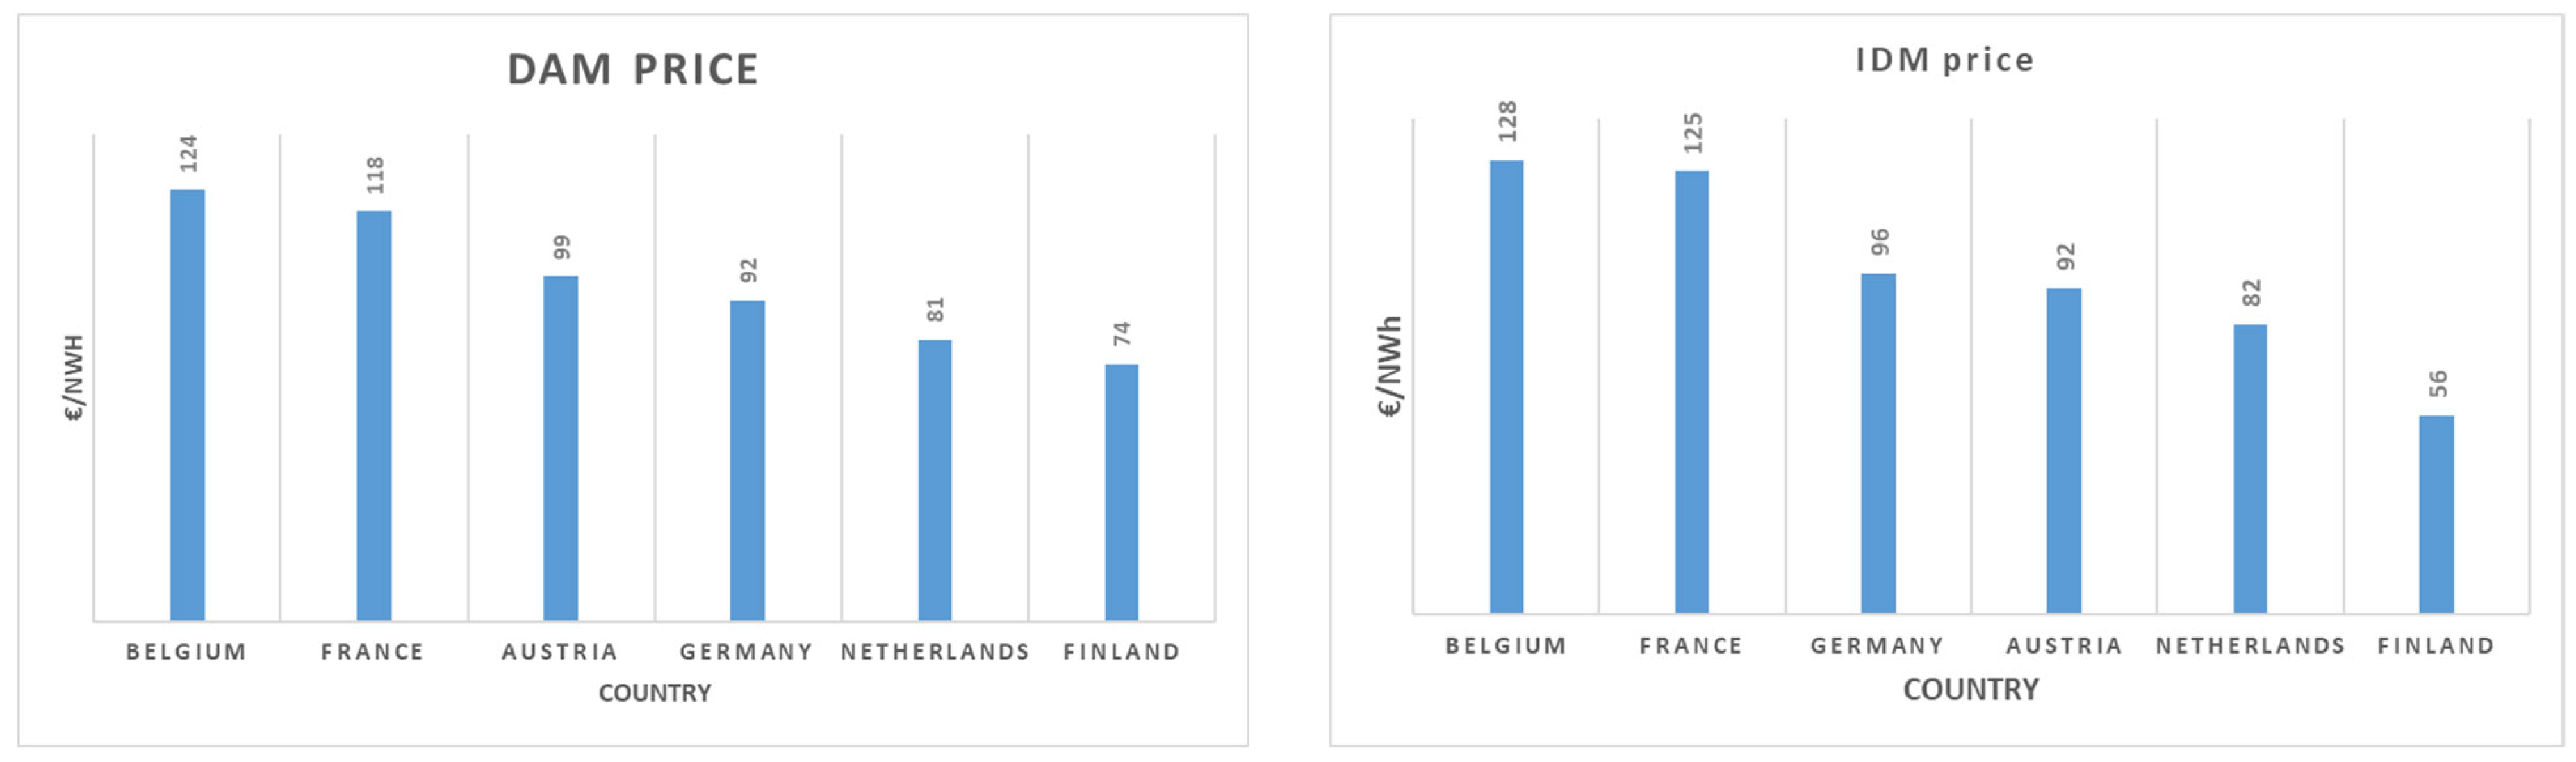
For the cross-country comparison of DAM and IDM prices, publicly available data have been used [
39,
40]. DAM and IDM prices on a regular day are shown in
Figure 1 (for 26 March 2023).
The graph showing DAM prices in March 2023 for Austria, Belgium, Finland, France, Germany, and the Netherlands indicates that prices differed across countries. While Belgium and France had the highest prices at 124 EUR/MWh and 118 EUR/MWh, respectively, Finland had the lowest at 74 EUR/MWh. These differences can be attributed to various factors, such as differences in fuel prices, the availability of renewable energy sources, transmission constraints, and demand–supply imbalances. While removing cross-border constraints can help to reduce price differences between countries, there are still other remaining factors that affect electricity prices. It is unlikely that prices will be exactly the same in every country. However, despite these differences, the prices in the IDM are not significantly different from those in the DAM. This is because the IDM primarily serves as a balancing mechanism for the DAM, and any significant differences in the underlying fundamentals driving the prices are reflected in the DAM.
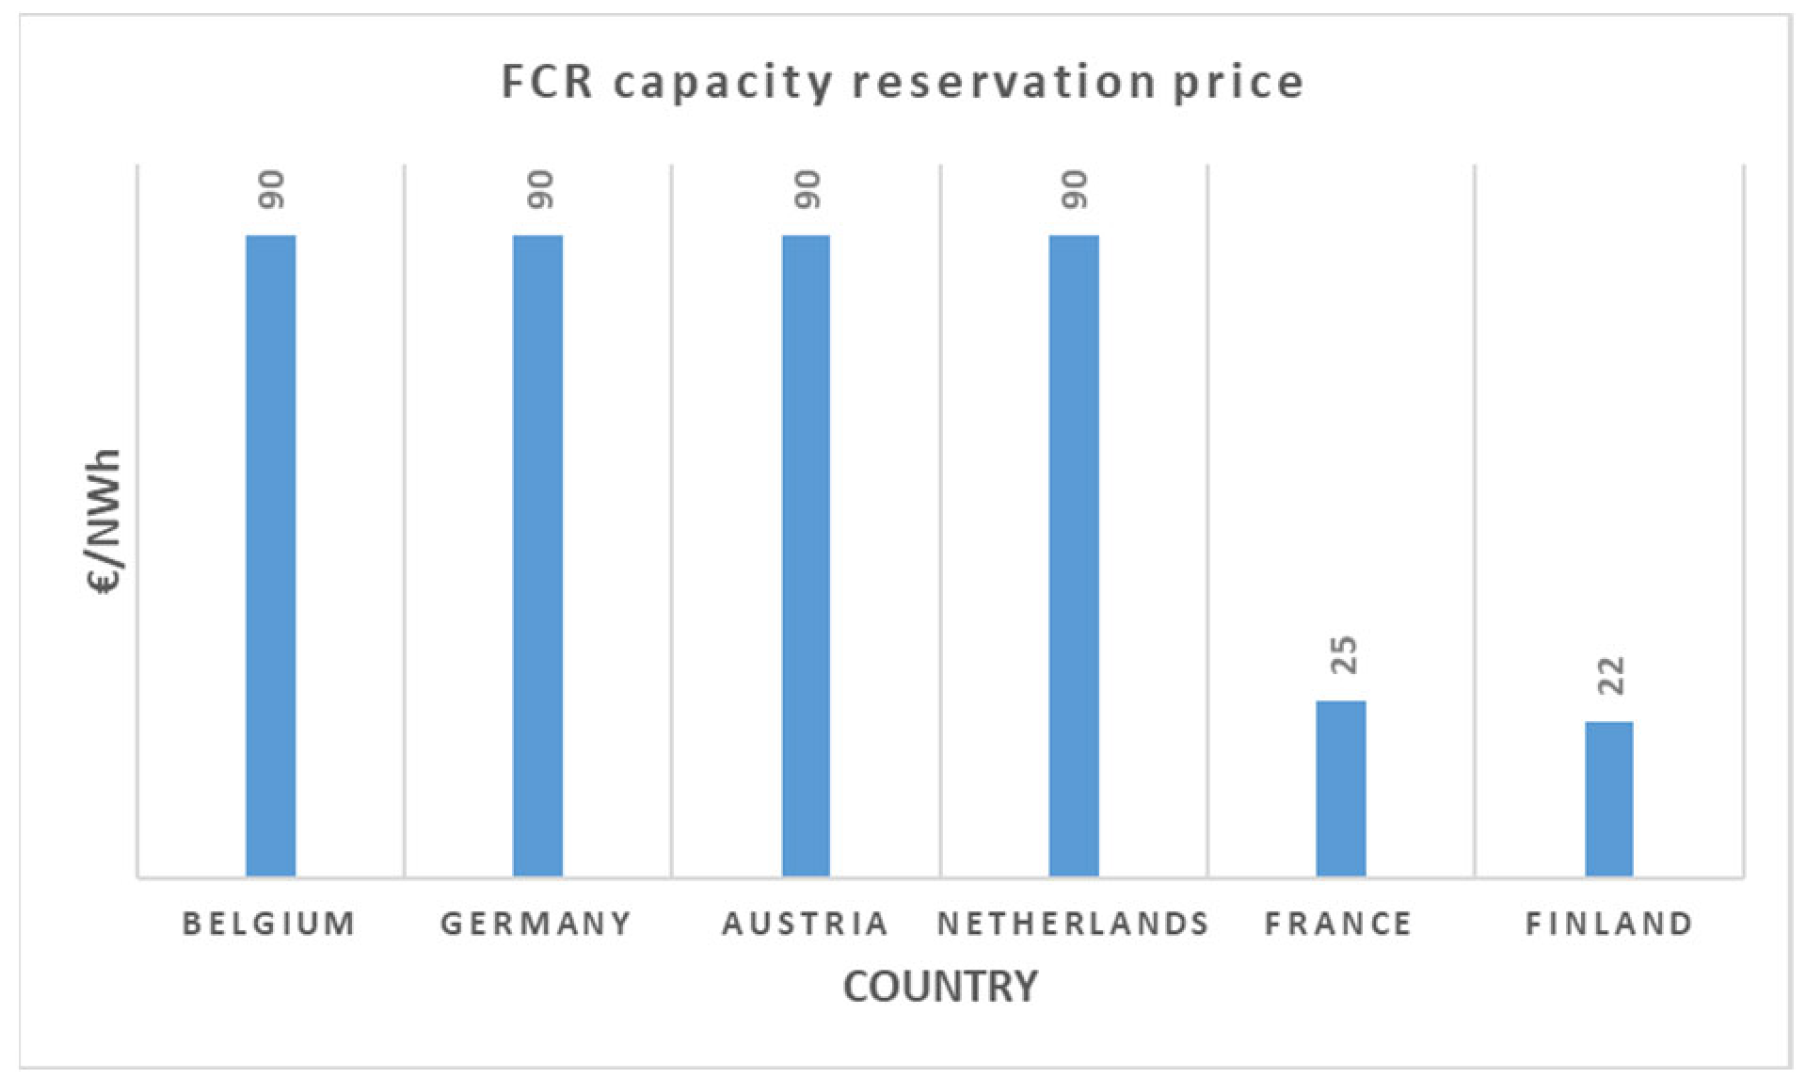
Figure 2 presents FCR capacity reservation marginal prices in the analyzed countries in March 2023. As countries trade on the power exchange, they also maintain yearly, weekly, and daily auctions/tenders for auxiliary services such as primary, secondary, and tertiary reserves.
The German TSOs procure all control reserves (balancing capacity and balancing energy) commonly across their control areas and partly in cooperation with neighboring countries (Austria, Belgium, Czech Republic, Denmark, France, the Netherlands, Slovenia, and Switzerland) [
49].
The tendering is open, transparent, and free from discrimination, according to the guidelines of the Federal Cartel Office (Bundeskartellamt—BKartA), the national regulatory authority (Bundesnetzagentur), and EU Guidelines.
“Precondition for providing balancing services is the pre-qualification procedure of each balancing service provider (BSP) at the connecting TSO. The possibility of pooling/aggregation enables small technical units as well as loads to deliver balancing services. The terms and conditions for BSPs contain the market rules from qualification to settlement for all market participants” [
54].
In order to secure FCRs for Finland, Fingrid procures them from various sources such as domestic yearly and hourly markets, as well as HVDC links with Estonia and other Nordic countries. Providers of reserves can offer capacity located in Finland that meets the reserve requirements for trading in the yearly and/or hourly market. Both markets have identical technical requirements and separately trade FCRs up and down [
55].
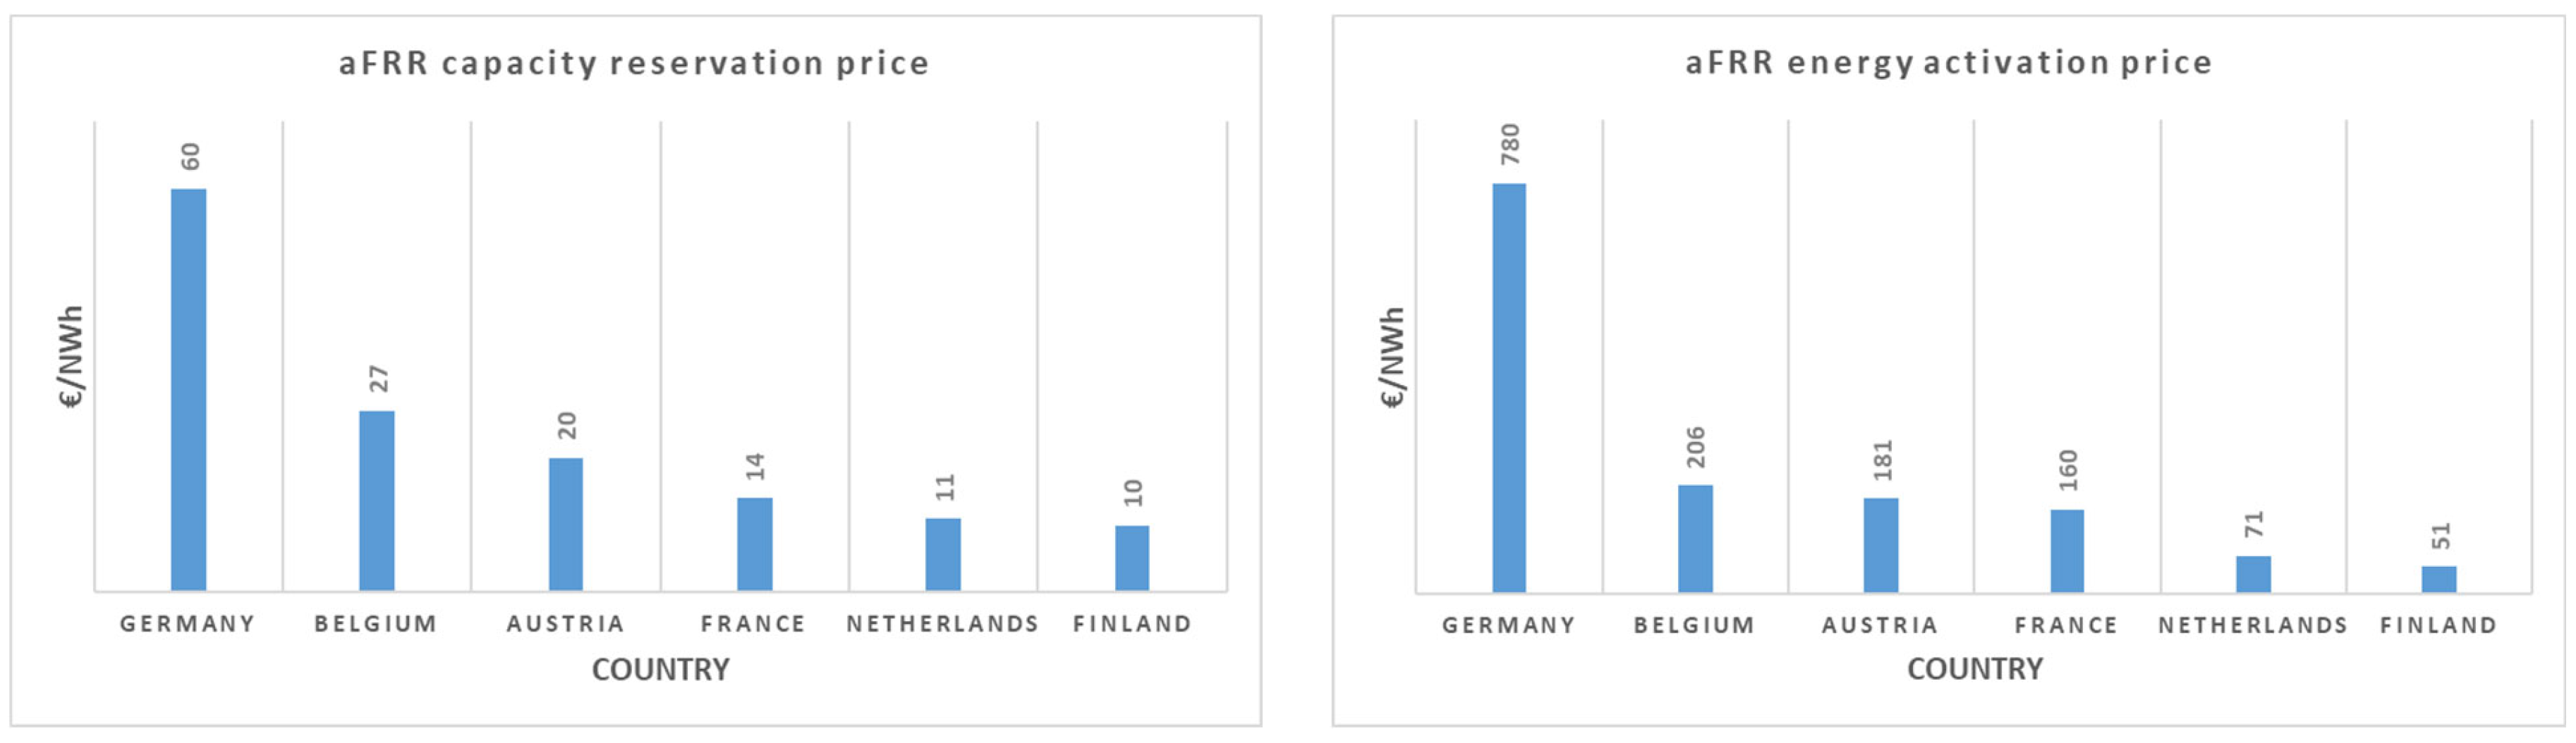
Figure 3 and
Figure 4 present the aFRR and mFRR average capacity reservation and activation prices on 26 March 2023.
The graphs show that the prices for different services such as the mFRR, aFRR, and FCR vary significantly between countries. For example, the prices for the aFRR and mFRR in Germany are generally higher than in Finland. The differences in the balancing energy marginal price between Germany and Finland can be attributed to several factors, including the countries’ energy mix, demand patterns, and market structure. One significant factor is the energy mix of the countries. Germany has a higher share of renewable energy sources, particularly wind and solar, which are subject to fluctuations due to weather conditions [
56]. These fluctuations can cause imbalances between electricity supply and demand, leading to a higher demand for balancing energy. In contrast, Finland has a higher share of nuclear and hydroelectric power, which is generally more stable and less subject to fluctuations. Another factor is the demand pattern in the countries. Germany has a larger population and a more significant industrial sector, which creates a higher demand for electricity and increases the likelihood of imbalances that require balancing energy. Finland, on the other hand, has a smaller population and a less energy-intensive economy, which reduces the demand for total energy and for balancing energy. The market structure can also play a role in the differences in balancing energy prices. Germany has a more complex market structure with more energy exchanges, which can lead to more price volatility and higher balancing energy prices.
The up-regulating price is the price of the most expensive up-regulating energy bid used; however, it is at least the price in the Finnish price area in the Nord Pool. Everyone whom Fingrid has ordered to up-regulate during the hour receives payment for the energy agreed upon based on the up-regulating energy price. The down-regulating price is the price of the cheapest down-regulating energy bid used; however, it is no more than the price in the Finnish price area in the Nord Pool [
57].
An analysis of market mechanisms across various countries has revealed notable differences in gate closure times. For instance, in France, the gate closure time for the FCR is 8:00 h in the day-ahead market, followed by 9:00 h for the aFRR in the day-ahead market, 10:00 h for the mFRR in the day-ahead market, and 12:00 h for the wholesale DAM. These variations in gate closure times among different market mechanisms and countries underscore the diverse approaches taken by market operators in managing electricity supply and demand. Understanding these differences is essential for ensuring effective grid management and promoting cross-border electricity trading.
Table 1 shows that the minimum offer on the wholesale market in selected countries ranges from 0.1 MW to 1 MW. Lower values are favorable for demand-response aggregators while higher values create market barriers for aggregators’ participation in the market.
Table 2 shows that the FCR and mFRR have standard unit activation periods (30 s FCR and 15 min mFRR) in contrast to the aFRR, which varies between countries (2–7.5 min). Austria, Belgium, Germany, and the Netherlands have implemented 15 min offers and readings in most of the market mechanisms, which significantly contributes to the portfolio and position optimization of every participant.
5. Discussion
The results of the data analysis show that the prices in the different market segments vary significantly between countries.
Many countries currently have a trading time resolution of one hour, which is considered too long for the aggregated resources of a large number of flexible small consumers. The implementation of shorter trading time resolutions allows for more accurate pricing signals and a more efficient matching of supply and demand, which can lead to improved market liquidity and reduced volatility in electricity prices.
For flexible resource aggregators, shorter trading time resolutions enable more precise forecasting and the management of aggregated resources, allowing them to adjust usage in real time to respond to price signals.
For producers and energy traders, shorter trading time resolutions enable more detailed forecasts about supply and demand imbalances, allowing for more accurate forecasting and improved risk management. This can lead to better portfolio and position optimization and improved efficiency in electricity trading.
Most countries have different prices in the electricity market, but these would otherwise be almost equal if there was no congestion in cross-border flows [
58]. The prices of ancillary services differ for both the reservation and activated energy because the TSO is the only buyer and sets the rules for purchasing reserves.
Currently, the most common source of revenue for aggregators as market participants are ancillary services (primary, secondary, and tertiary reserves). The response from the consumer is usually quickly activated, thus making it suitable for the primary reserve, which has an activation time of less than 30 s. In this way, the aggregator gains a constant income as the TSO is obligated to reserve the capacity. When the reserved capacity is activated, the aggregator gains an additional income at a price higher than the electricity market price. The capacity reservation price tends to decrease over a long-term period. The main reason for the reservation price decrease is an increase in market liquidity. New platforms for the cross-border procurement of ancillary services are being developed, contributing to market liquidity, which tends to lower and, in the future, may possibly even remove the need for unit reservation [
59].
Due to technical and regulatory challenges in each country combined with the nature of DAMs, aggregators find it challenging to participate in such markets. DR participation in DAMs is significant in the Netherlands (700 MW from industry) [
60].
6. Conclusions and Further Work
DR programs have the potential to provide significant benefits to both customers and the electricity grid in Europe. However, there are several regulatory challenges and barriers that can make it difficult for DR providers to offer their services effectively. One of the most significant challenges is the lack of harmonized legislation across Europe. Each country has its own policies, programs, and by-laws for DR, which can make it challenging for providers to operate across borders. This inconsistency can limit the potential benefits of DR programs and make it difficult to achieve scale. Another barrier to DR adoption is the inconsistent incentives provided to DR programs in different countries. Some countries offer robust support and incentives for DR programs, while others do not. This lack of consistency can make it difficult for DR providers to offer their services effectively and maximize the benefits of DR. The complexity of electricity market design is another challenge for DR providers. Different market designs in each country can create barriers to entry for new DR providers and limit the potential benefits of DR. The lack of interoperability between different DR technologies is also a challenge for providers. Access to data is essential for DR providers to offer their services effectively. However, there are challenges related to data privacy, which can hinder the development of DR programs. Additionally, in some countries, a small number of large utilities dominate the market, making it difficult for new DR providers to enter the market and compete on a level playing field. Finally, regulatory uncertainty is a significant challenge for DR providers. The regulatory environment for DR is constantly changing, which can create uncertainty for providers and limit the potential benefits of DR programs. However, it should be noted that there are ongoing efforts to address these issues, such as the development of a more harmonized regulatory framework and the promotion of interoperability between different DR technologies [
61].
DR aggregators face significant challenges when participating in electricity markets. One of the most significant challenges is the inherent uncertainty associated with aggregated DR resources, which cannot be scheduled with the same level of certainty as traditional generators. Instead, DR aggregators rely on the actions of end users, making it challenging to accurately forecast their output. Additionally, factors beyond the aggregator’s control, such as weather conditions or changes in consumer behavior, can impact their availability, making it difficult to provide firm commitments to deliver or consume energy. Consumer behavior becomes less of a problem as number of consumers increase over time.
Despite these challenges, DR aggregators can play a crucial role in balancing the grid, and their participation in ancillary services markets can be recommended based on the previous analysis. Ancillary services markets often have shorter activation times than DAMs, which can make it easier for DR aggregators to participate. Moreover, these markets usually offer higher prices, making them more financially attractive.
This paper offers an extensive exploration of the potential roles that aggregators can play within a variety of electricity markets. It also provides a comparative analysis of essential market characteristics within six EU nations, serving as a guide for those interested in participating in aggregation. Future work will investigate aggregators’ performance across multiple markets and pay further attention to the impacts of the chosen business model on the profitability of the aggregator’s operations by conducting a simulation with different price signals.


