

Assessing the Influence of Fracture Networks on Gas-Based Enhanced Oil Recovery Methods


Abstract
:1. Introduction
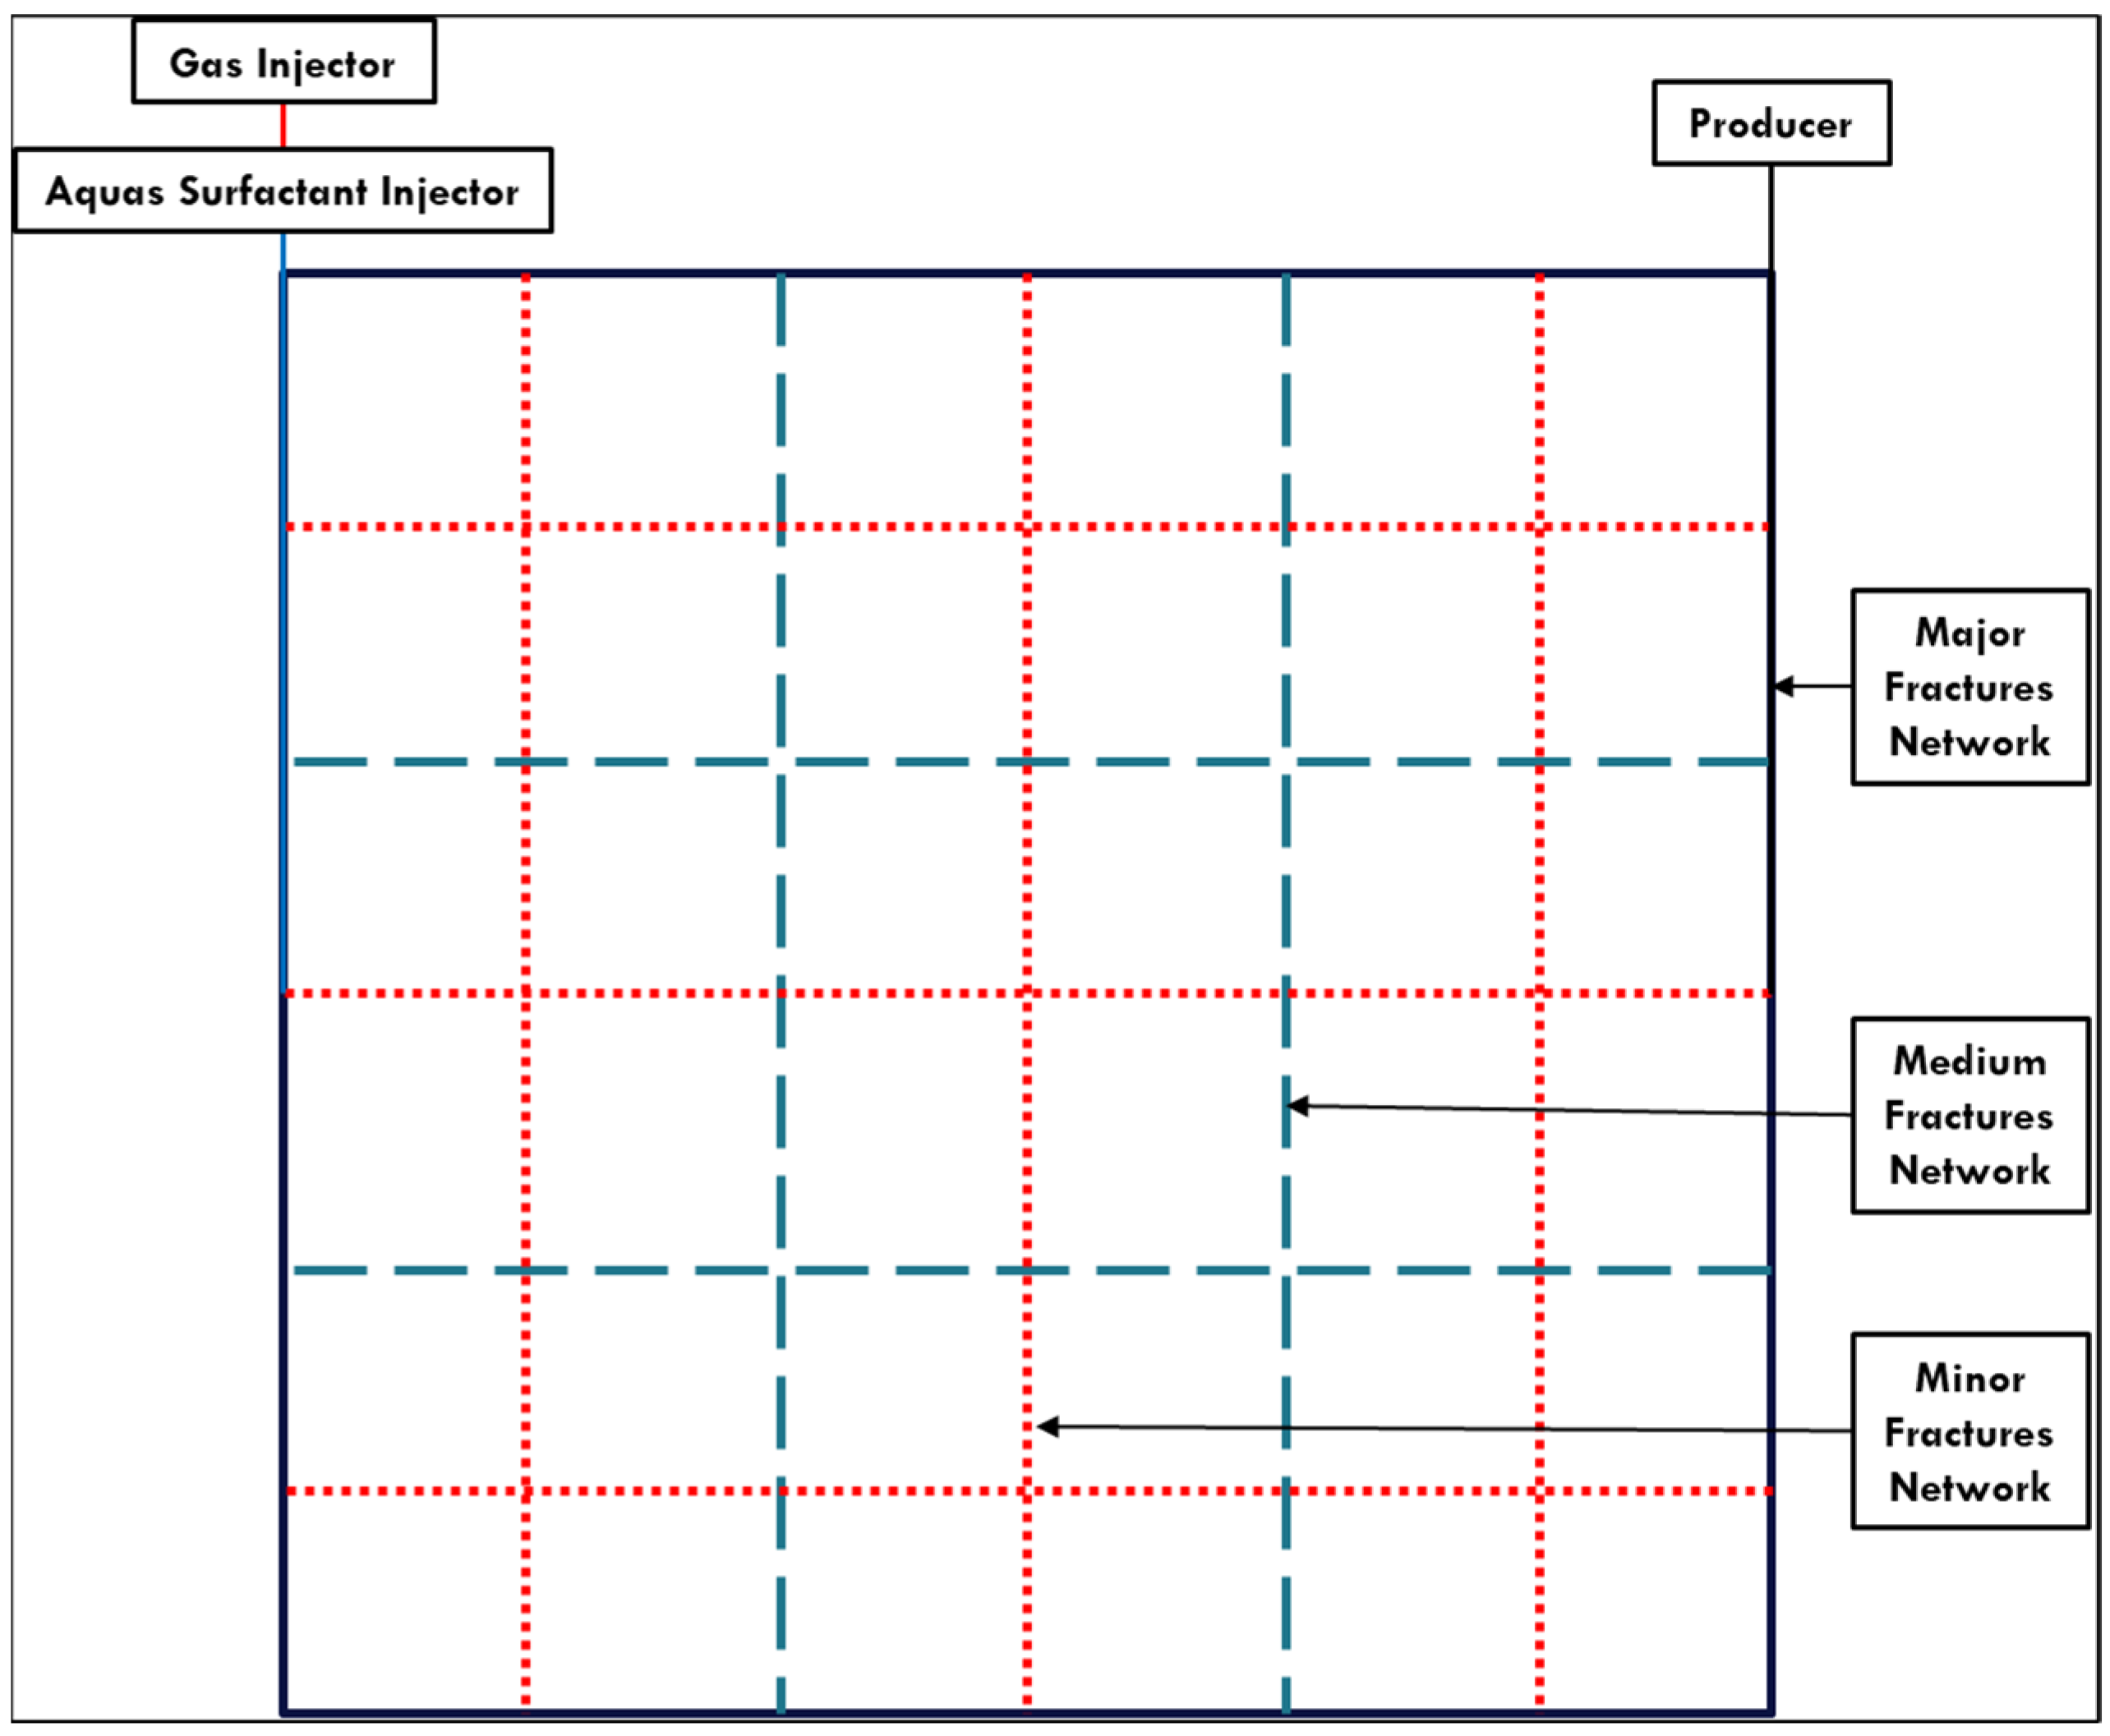
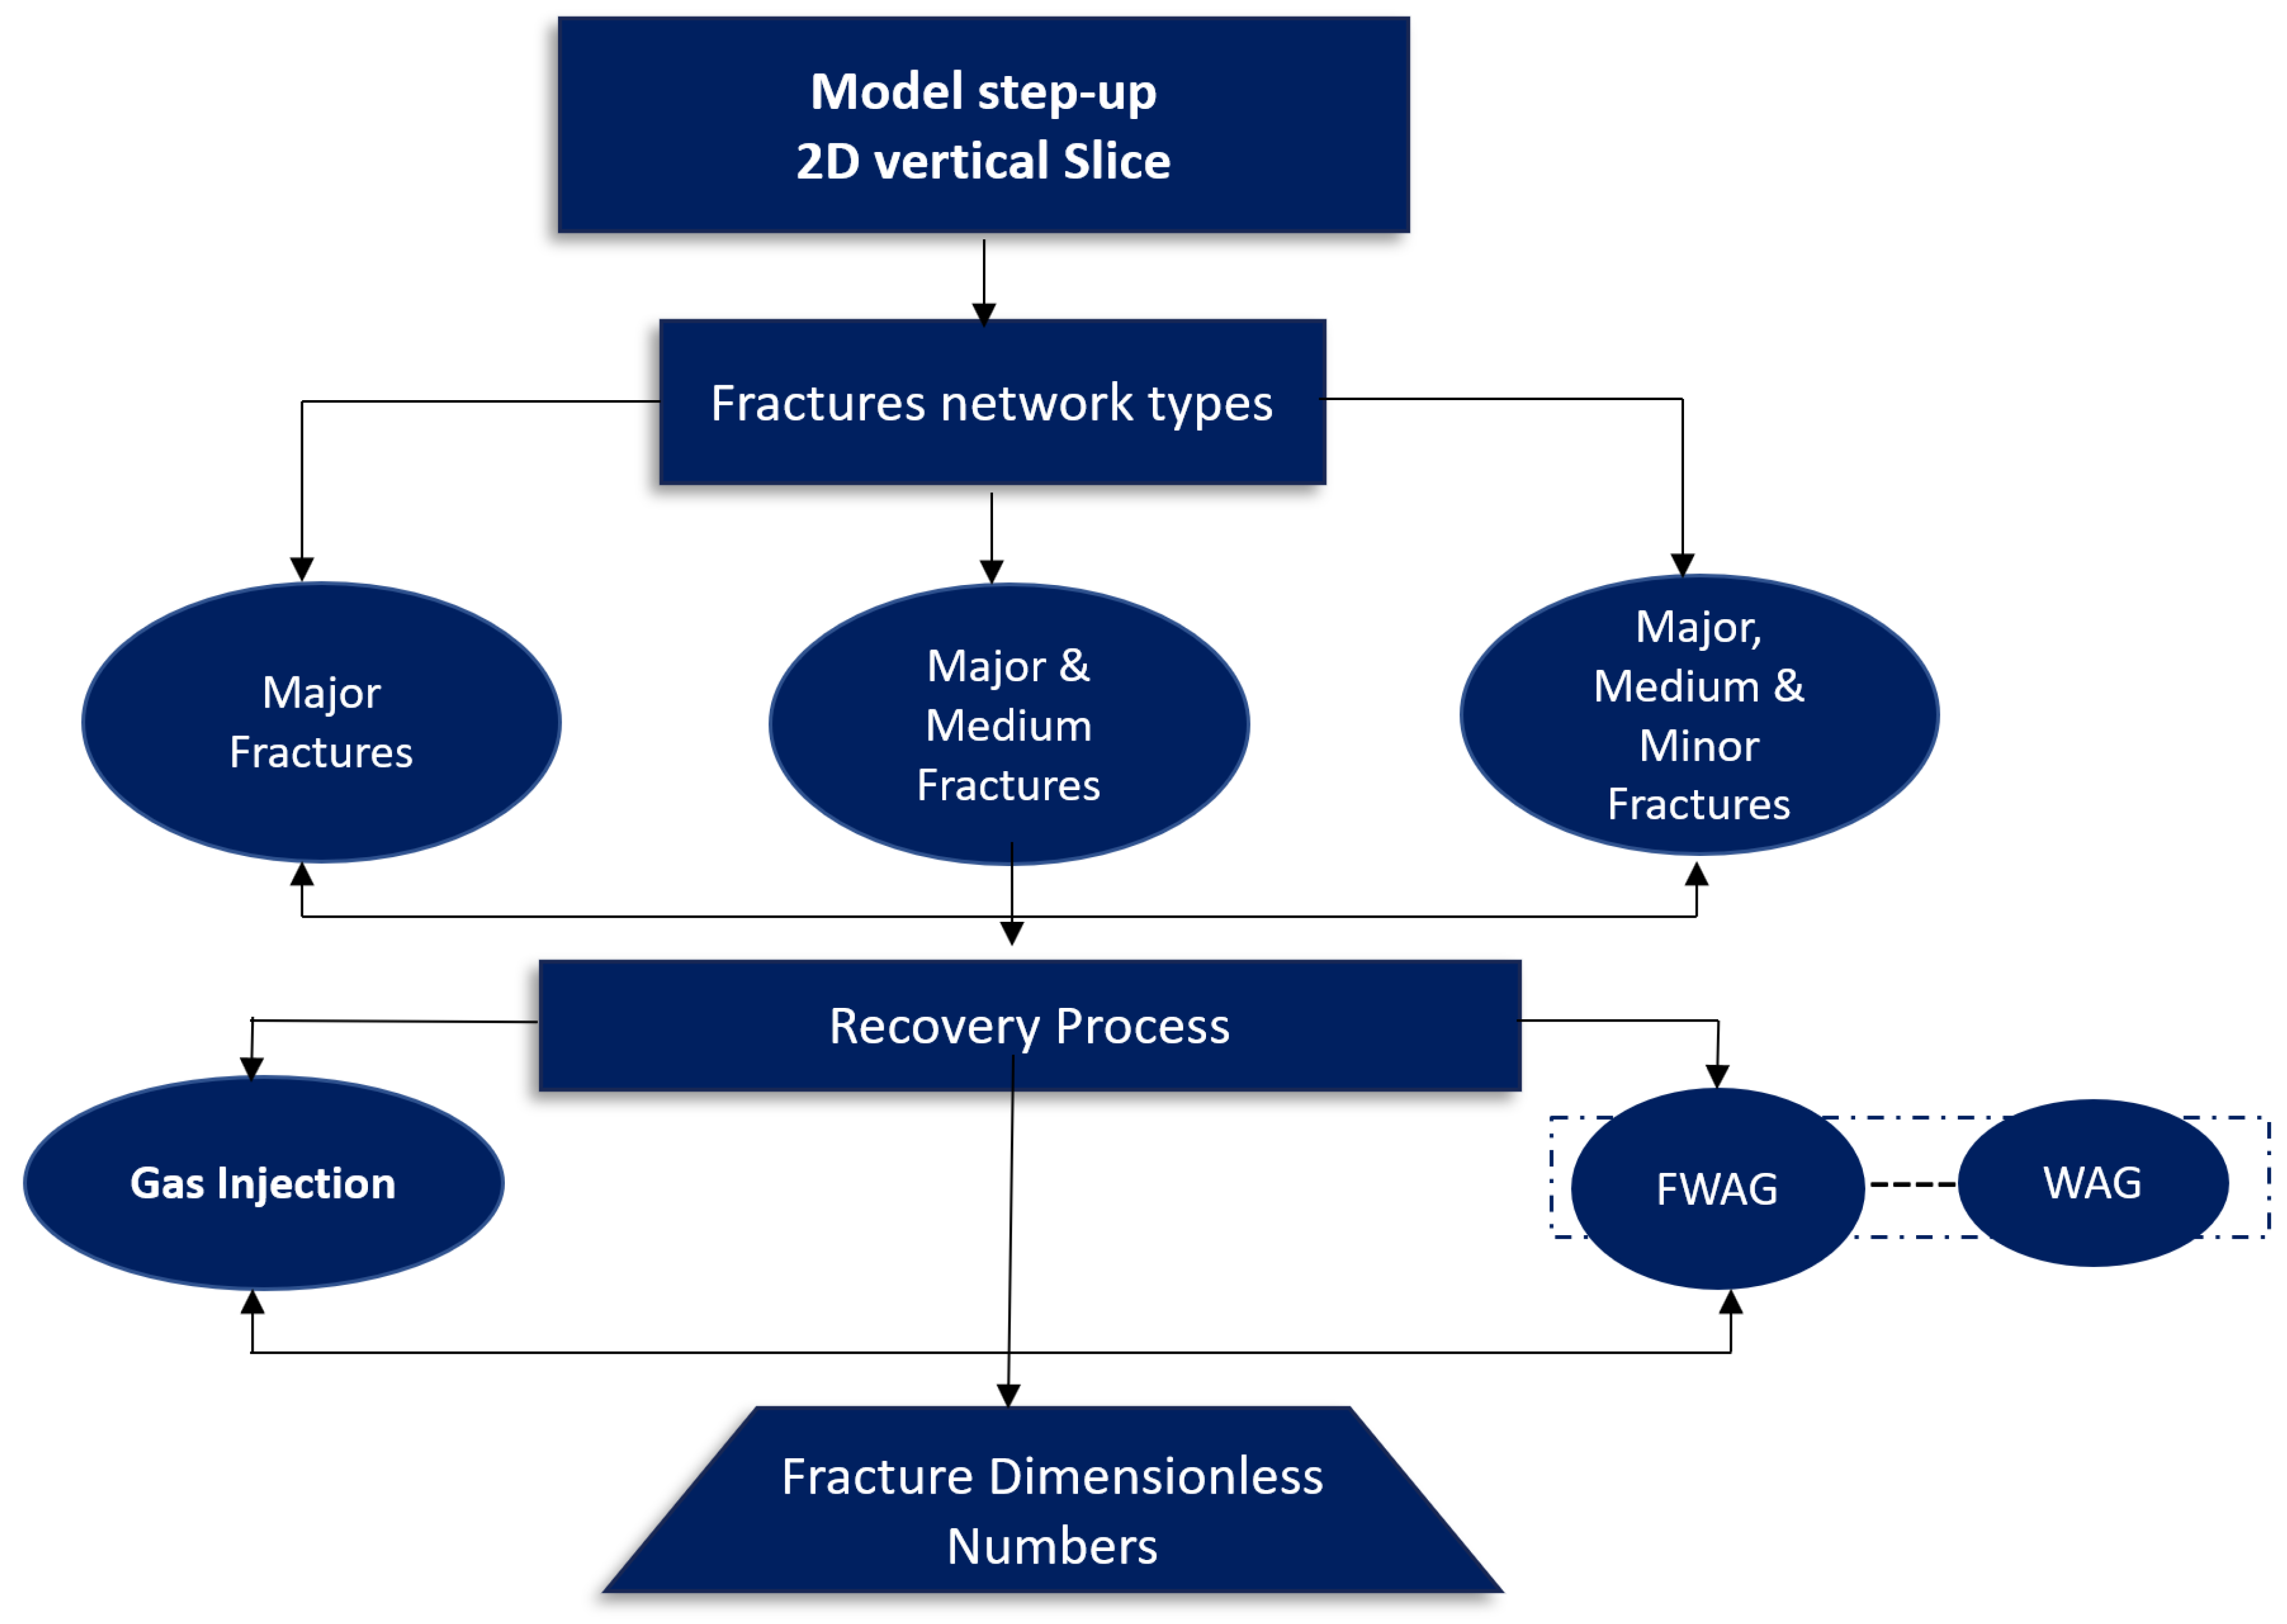
2. Methodology
3. Results and Discussion
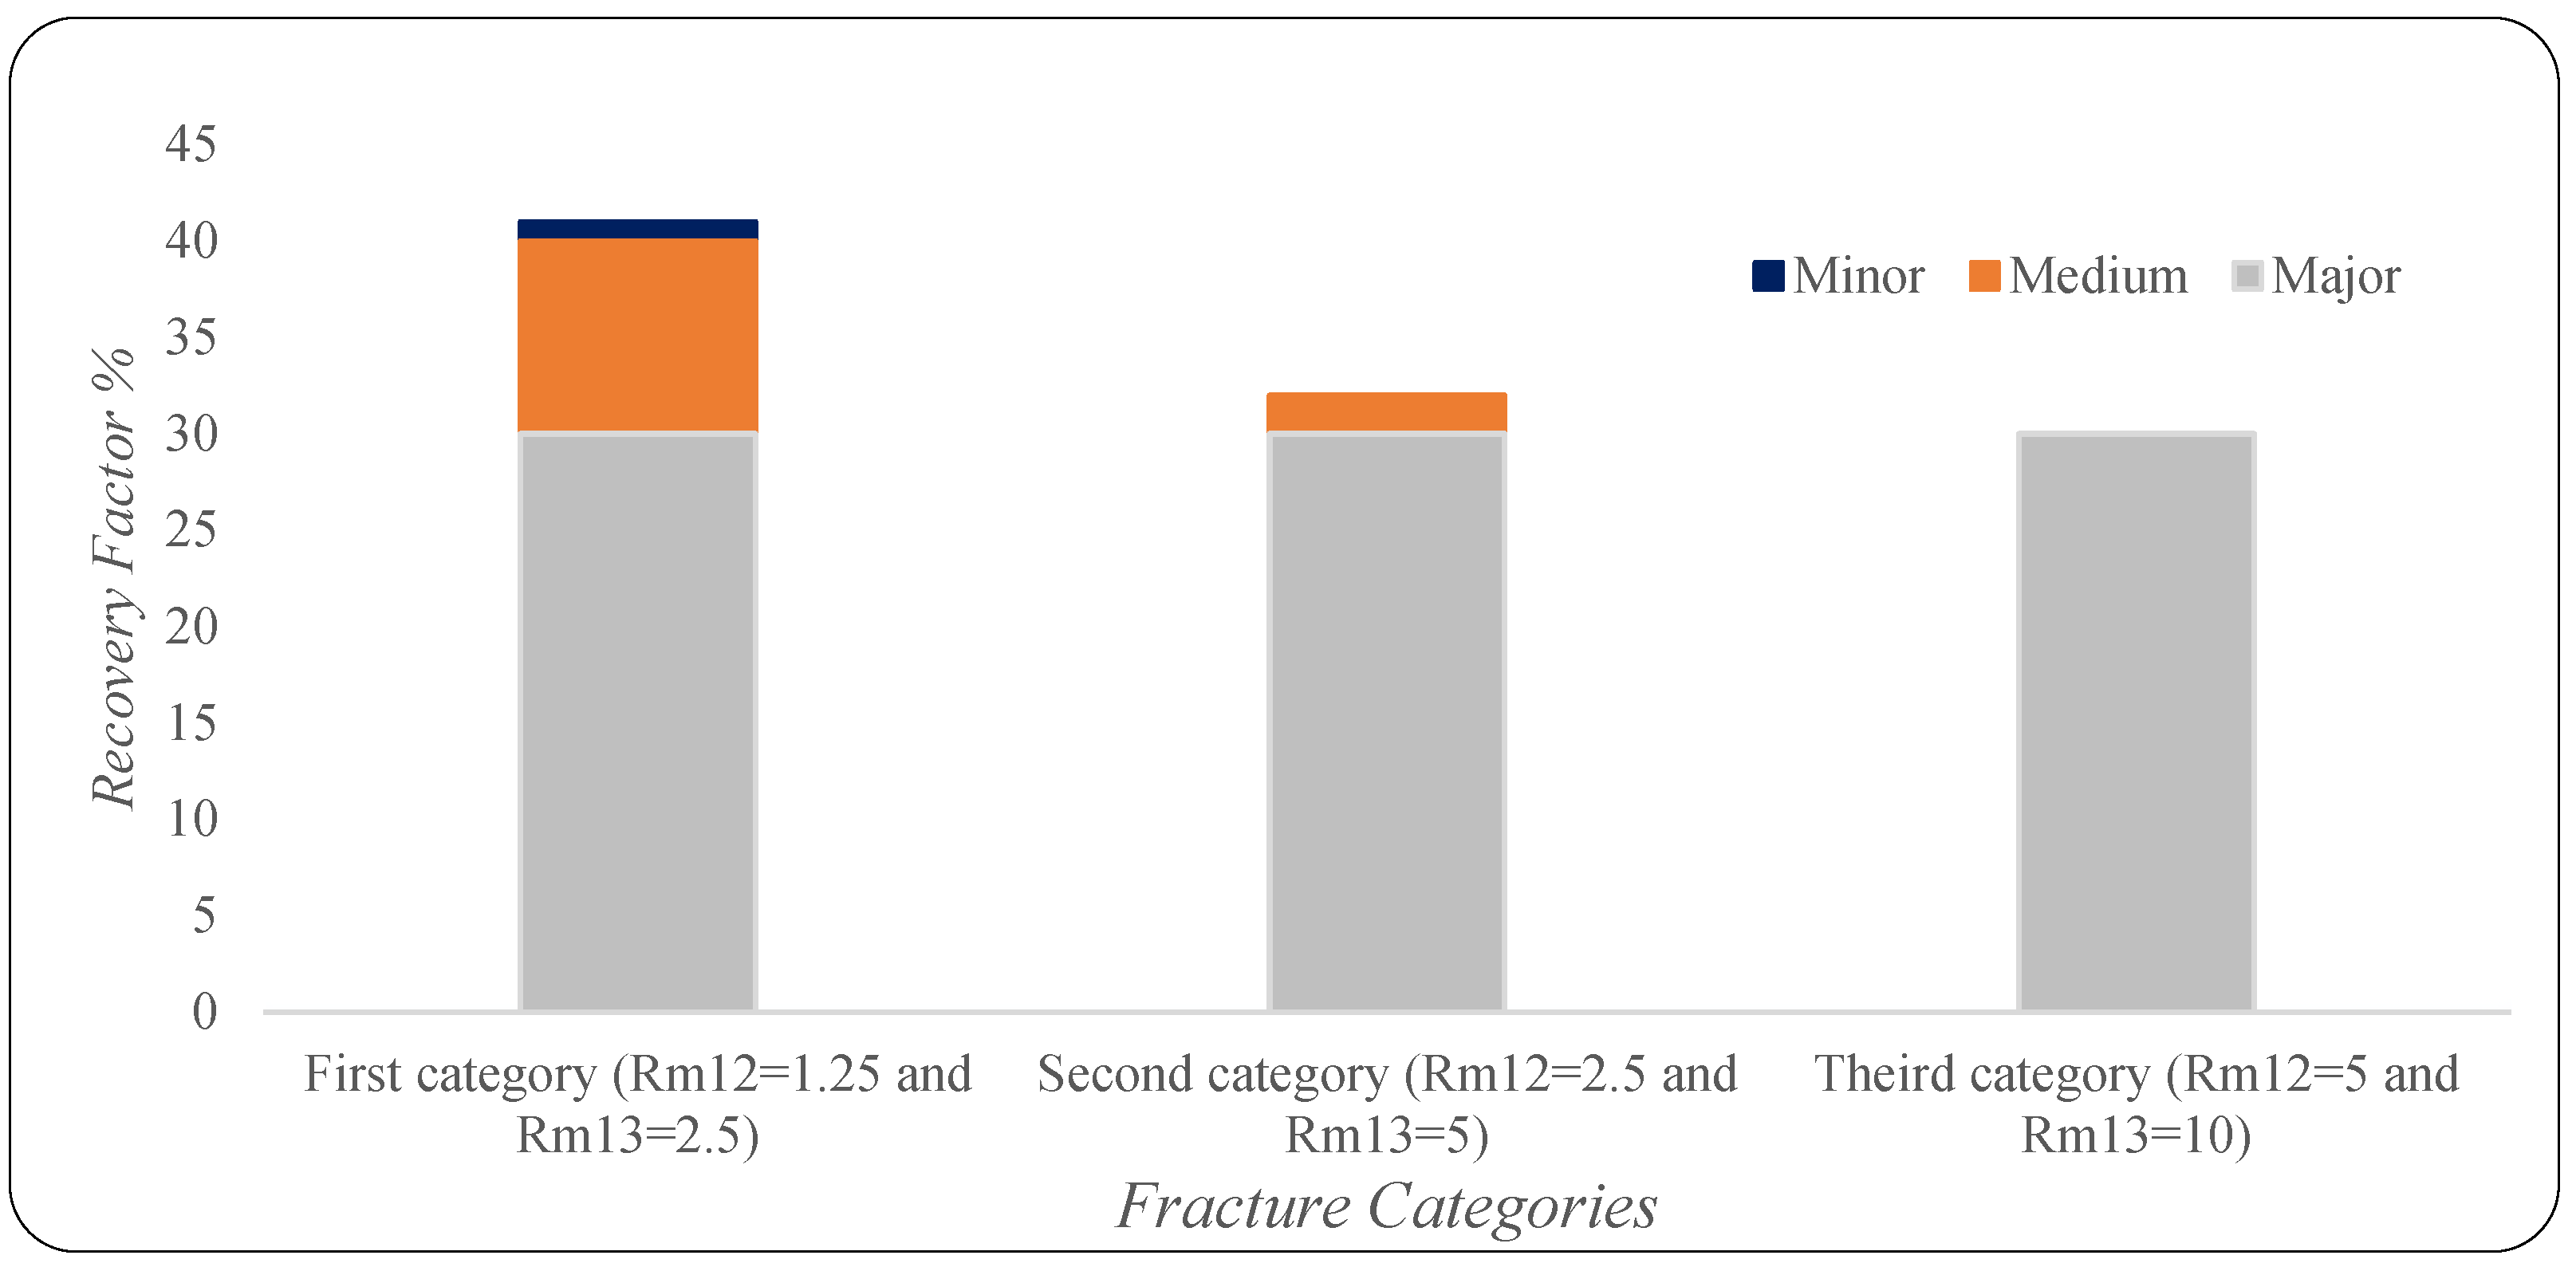
3.1. Gas Injection
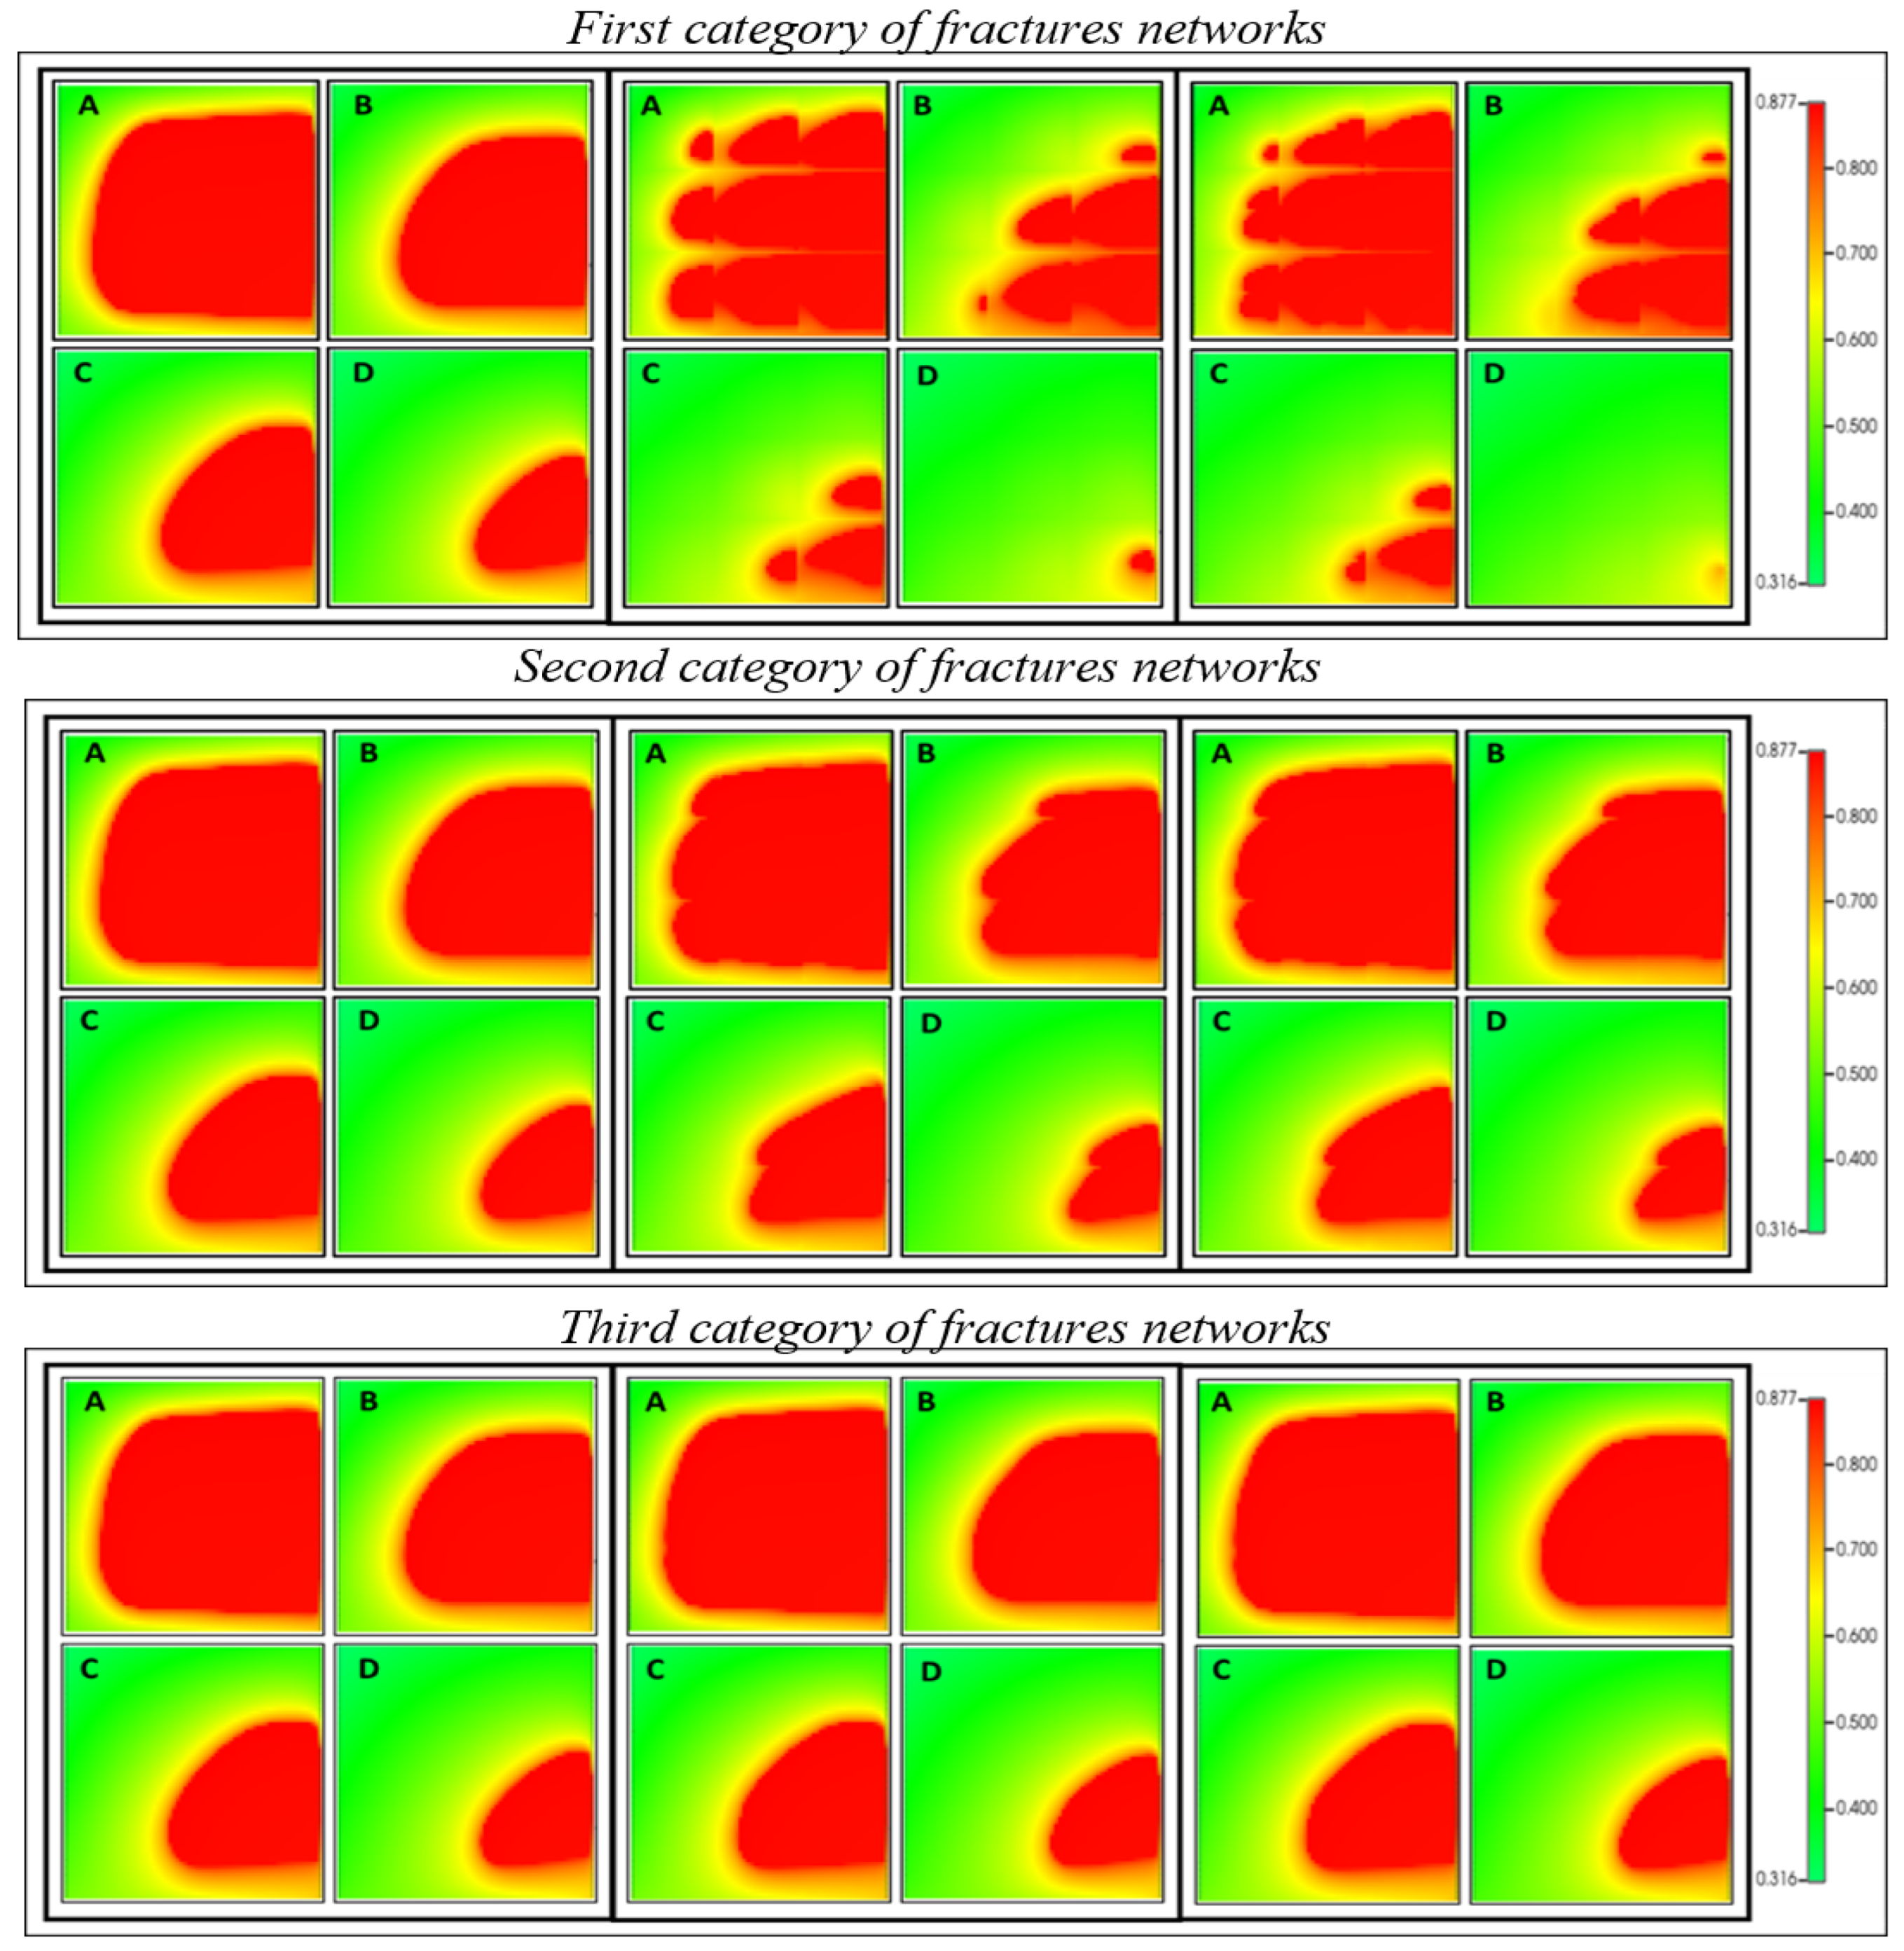
3.1.1. Horizontal Displacement Mode
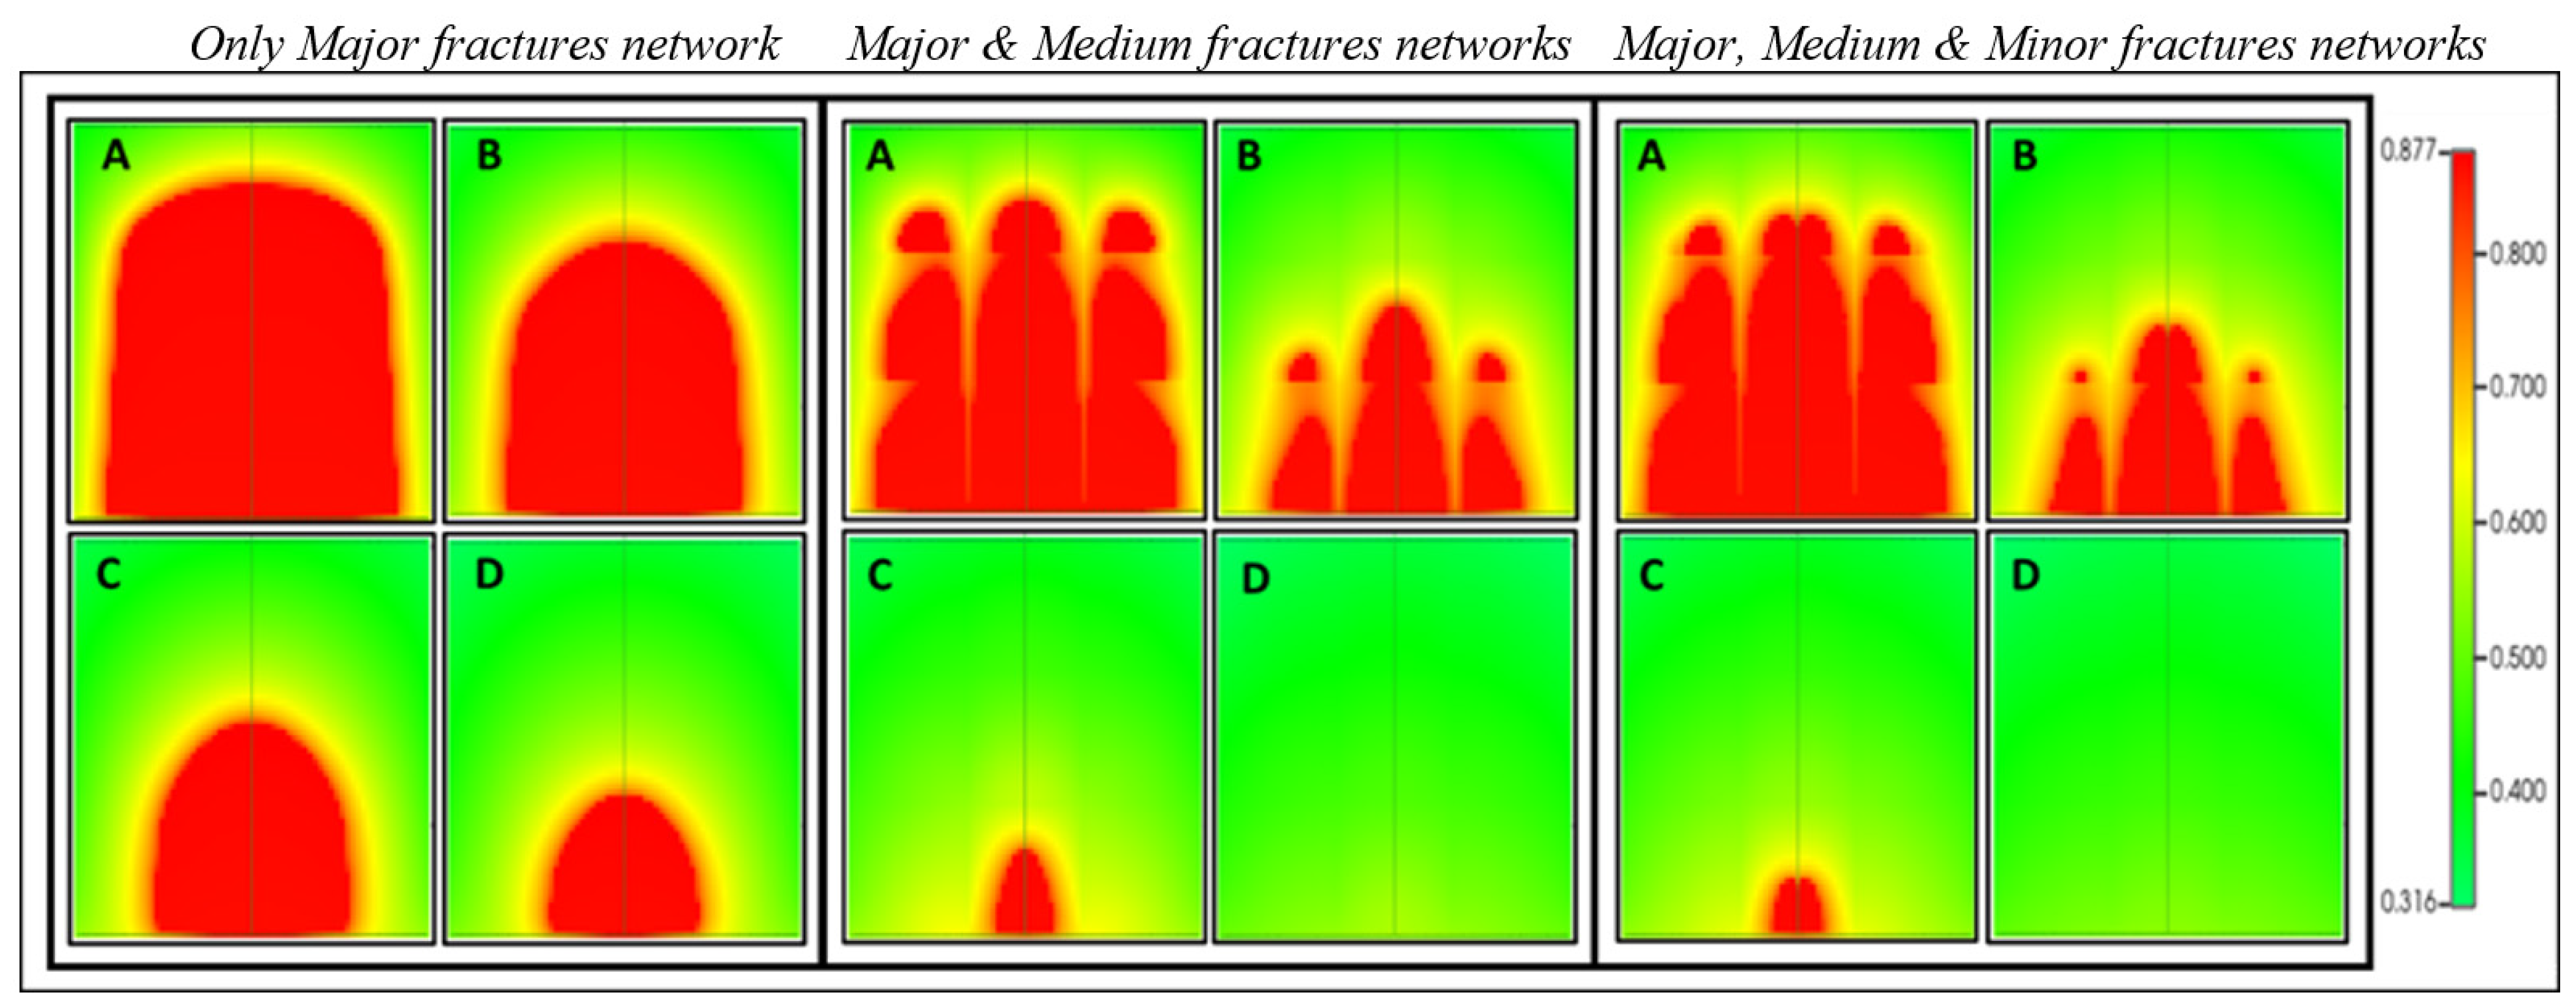
3.1.2. Assisted Gravity Drainage Model
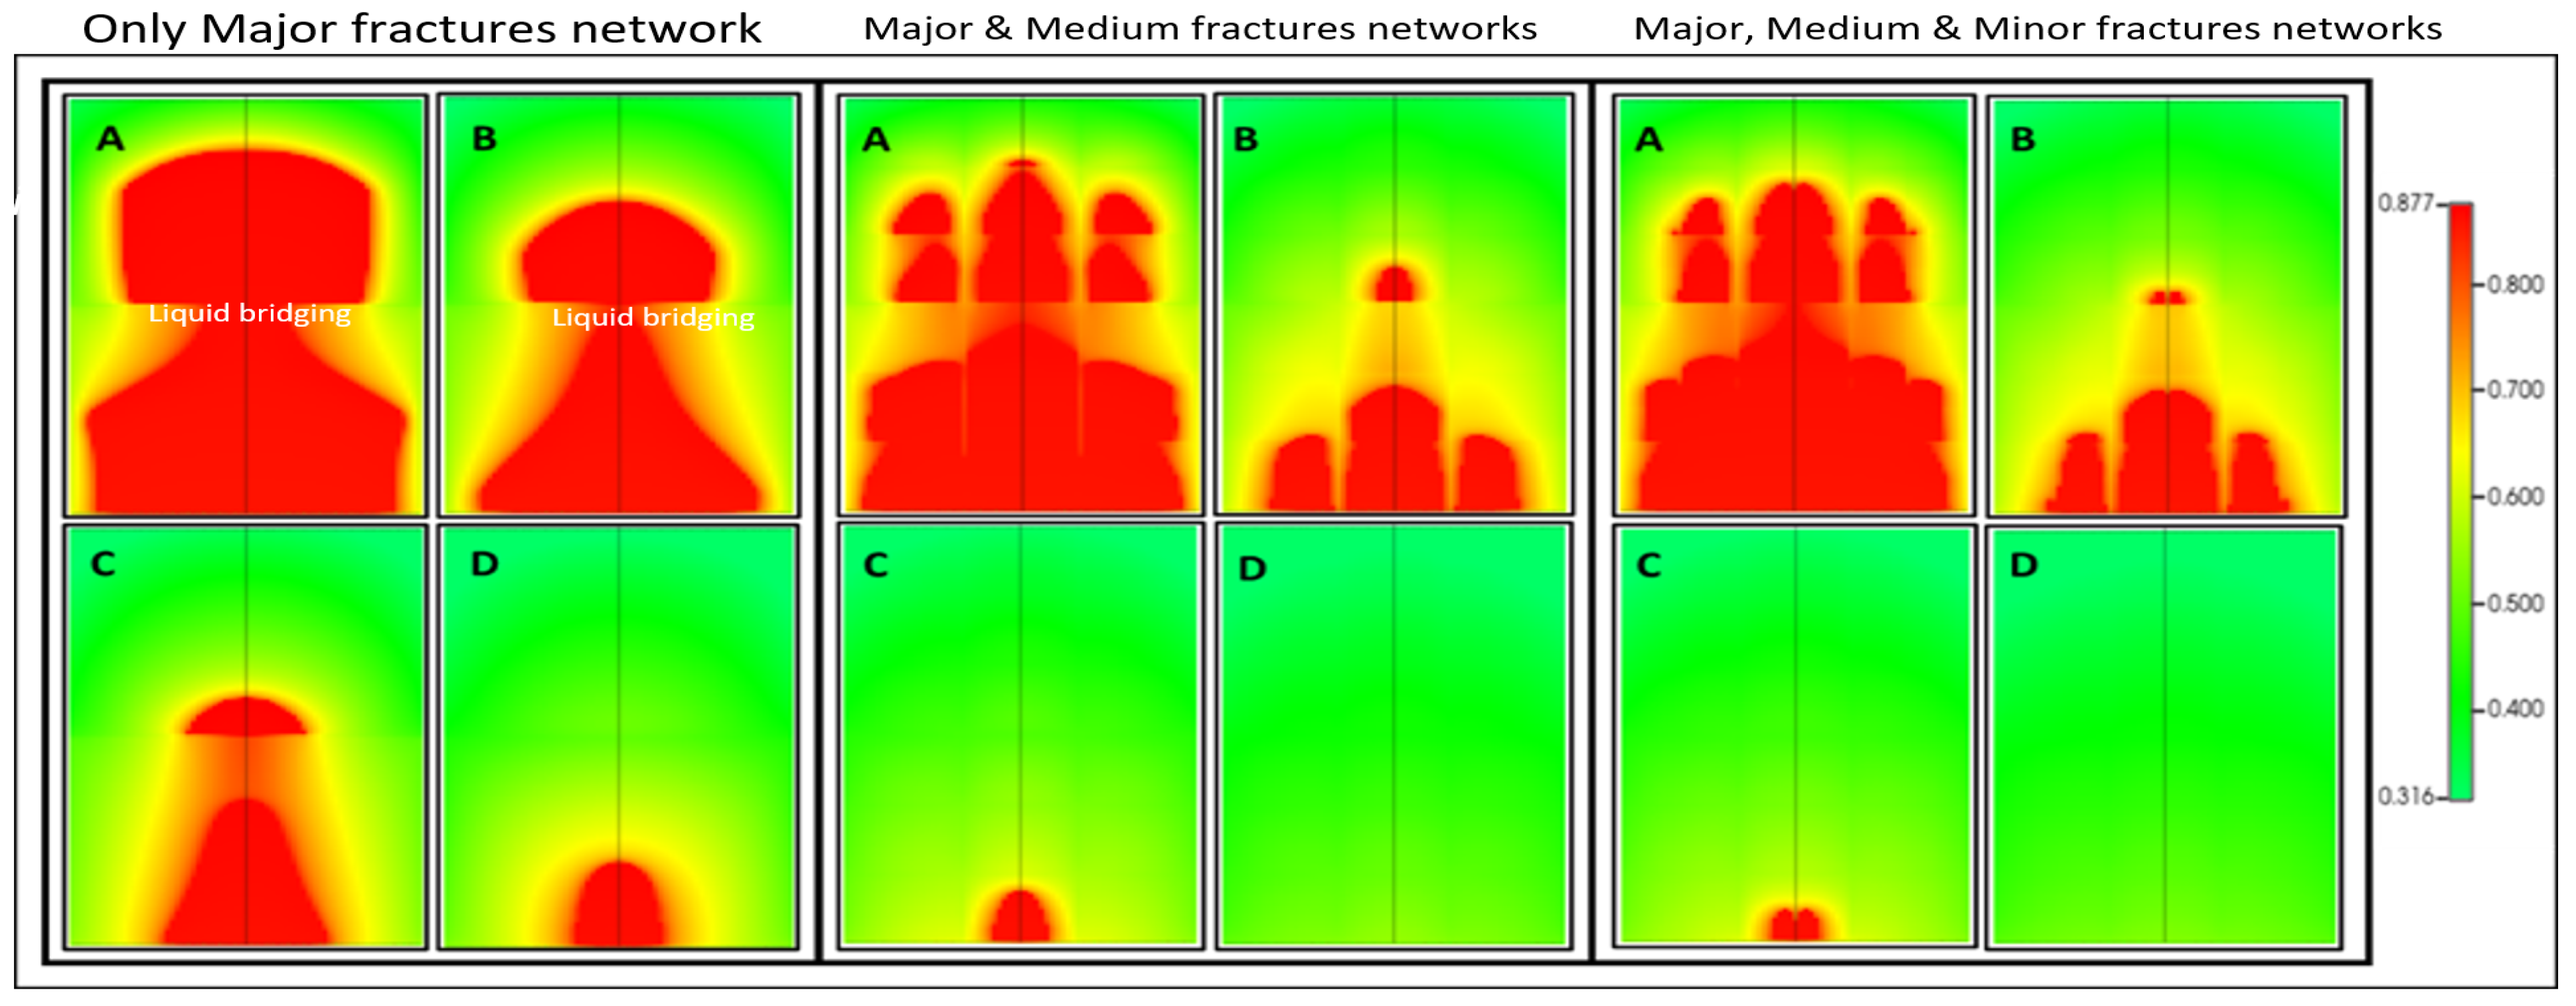
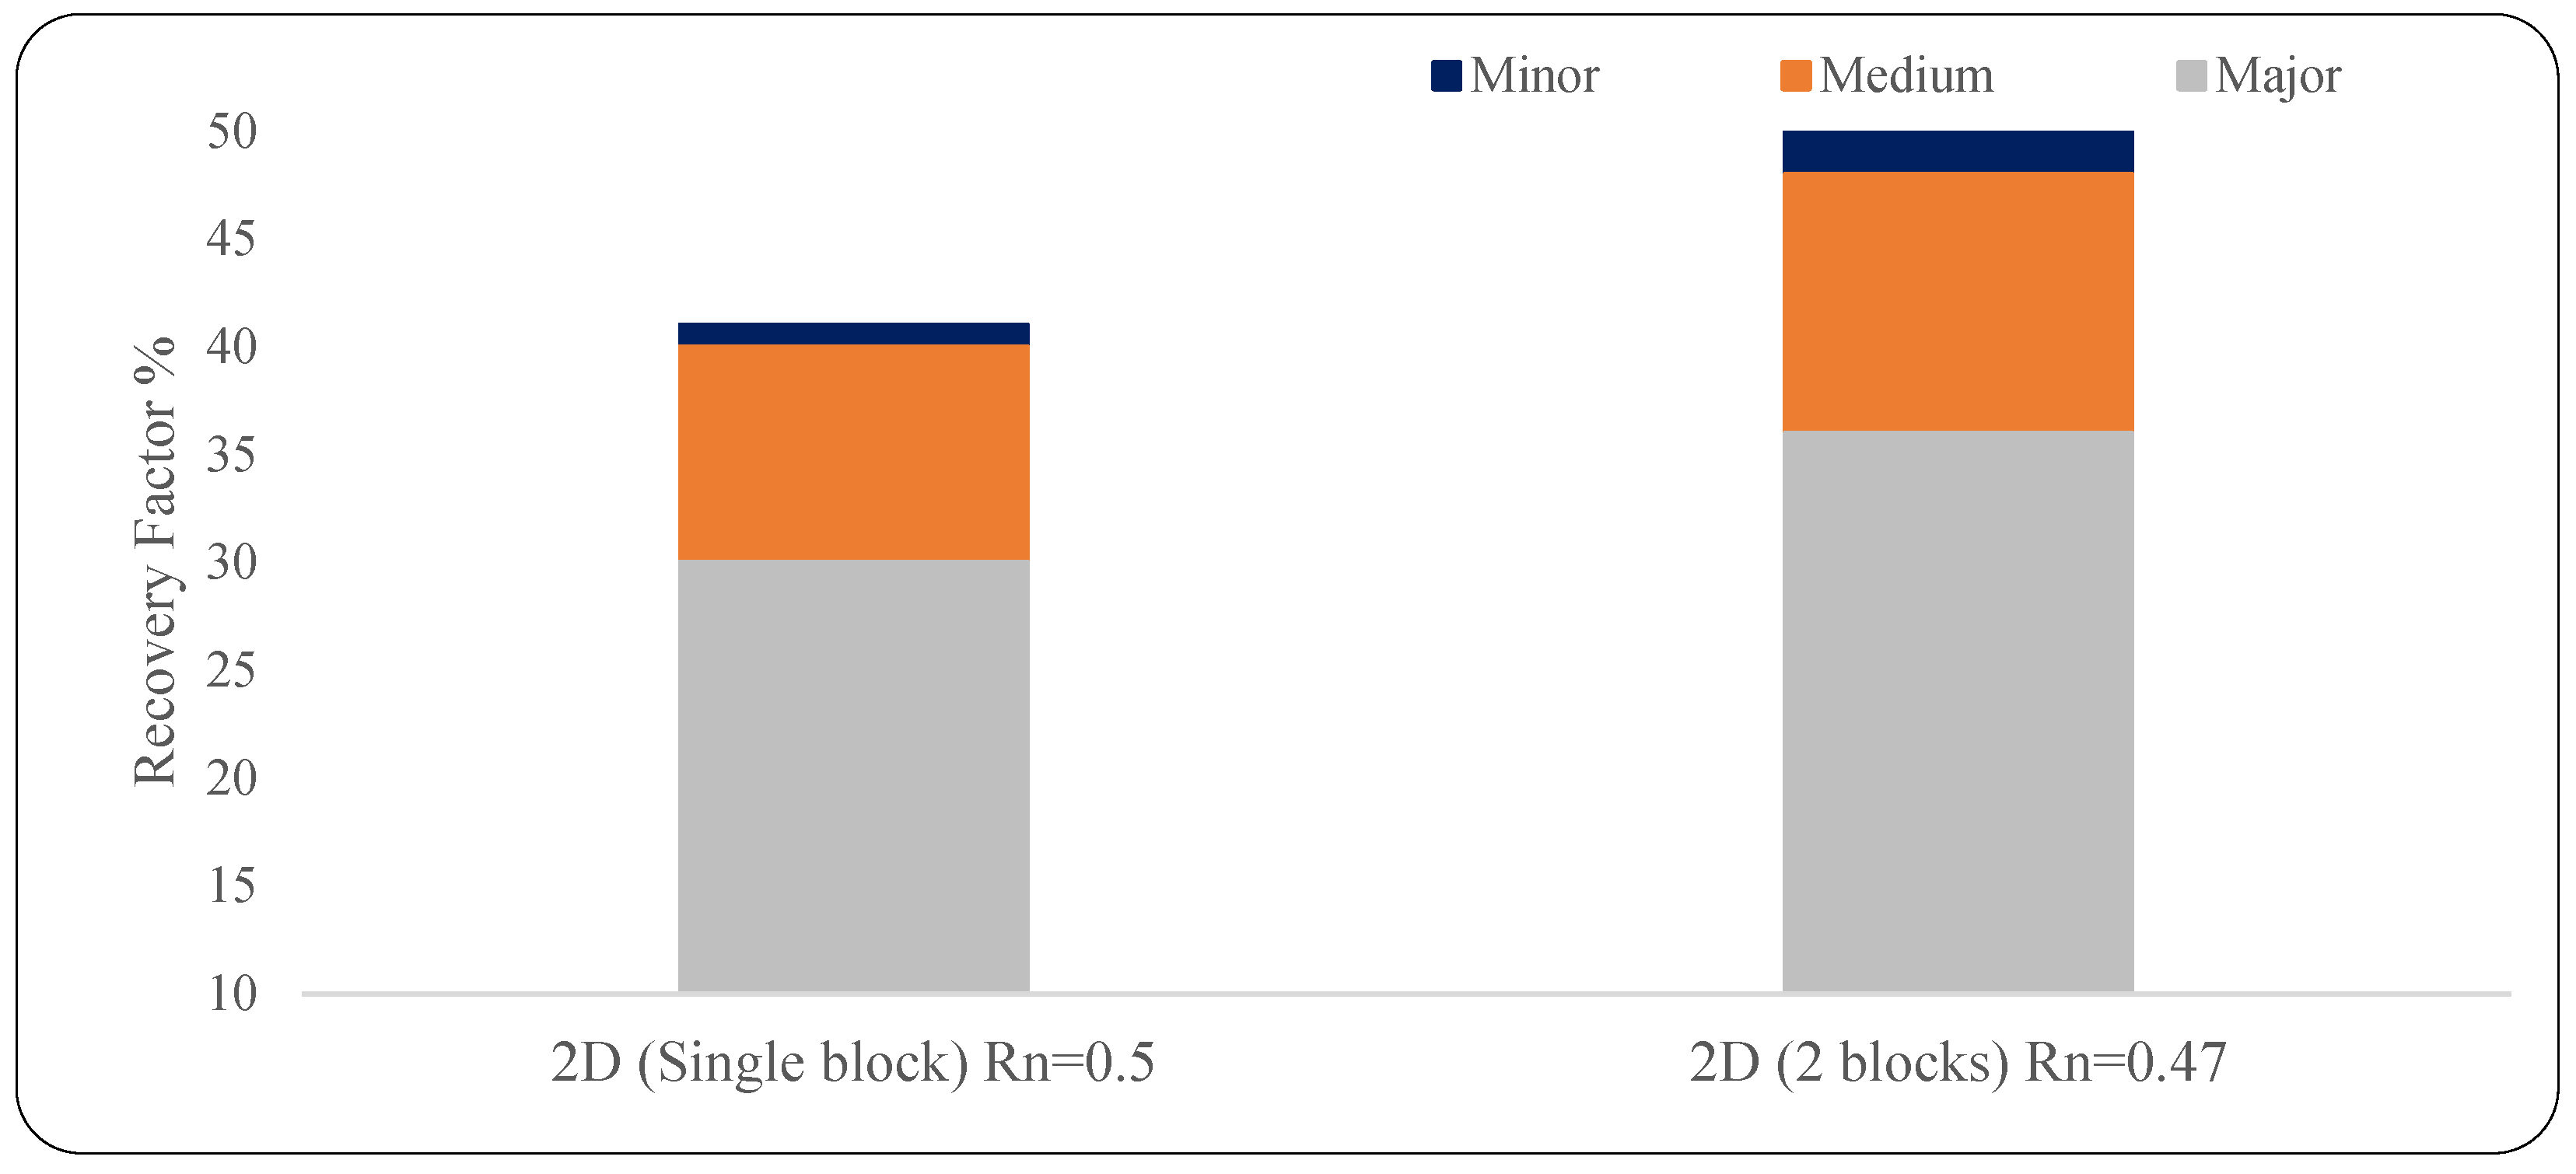
3.1.3. Extended 2D Vertical Slice
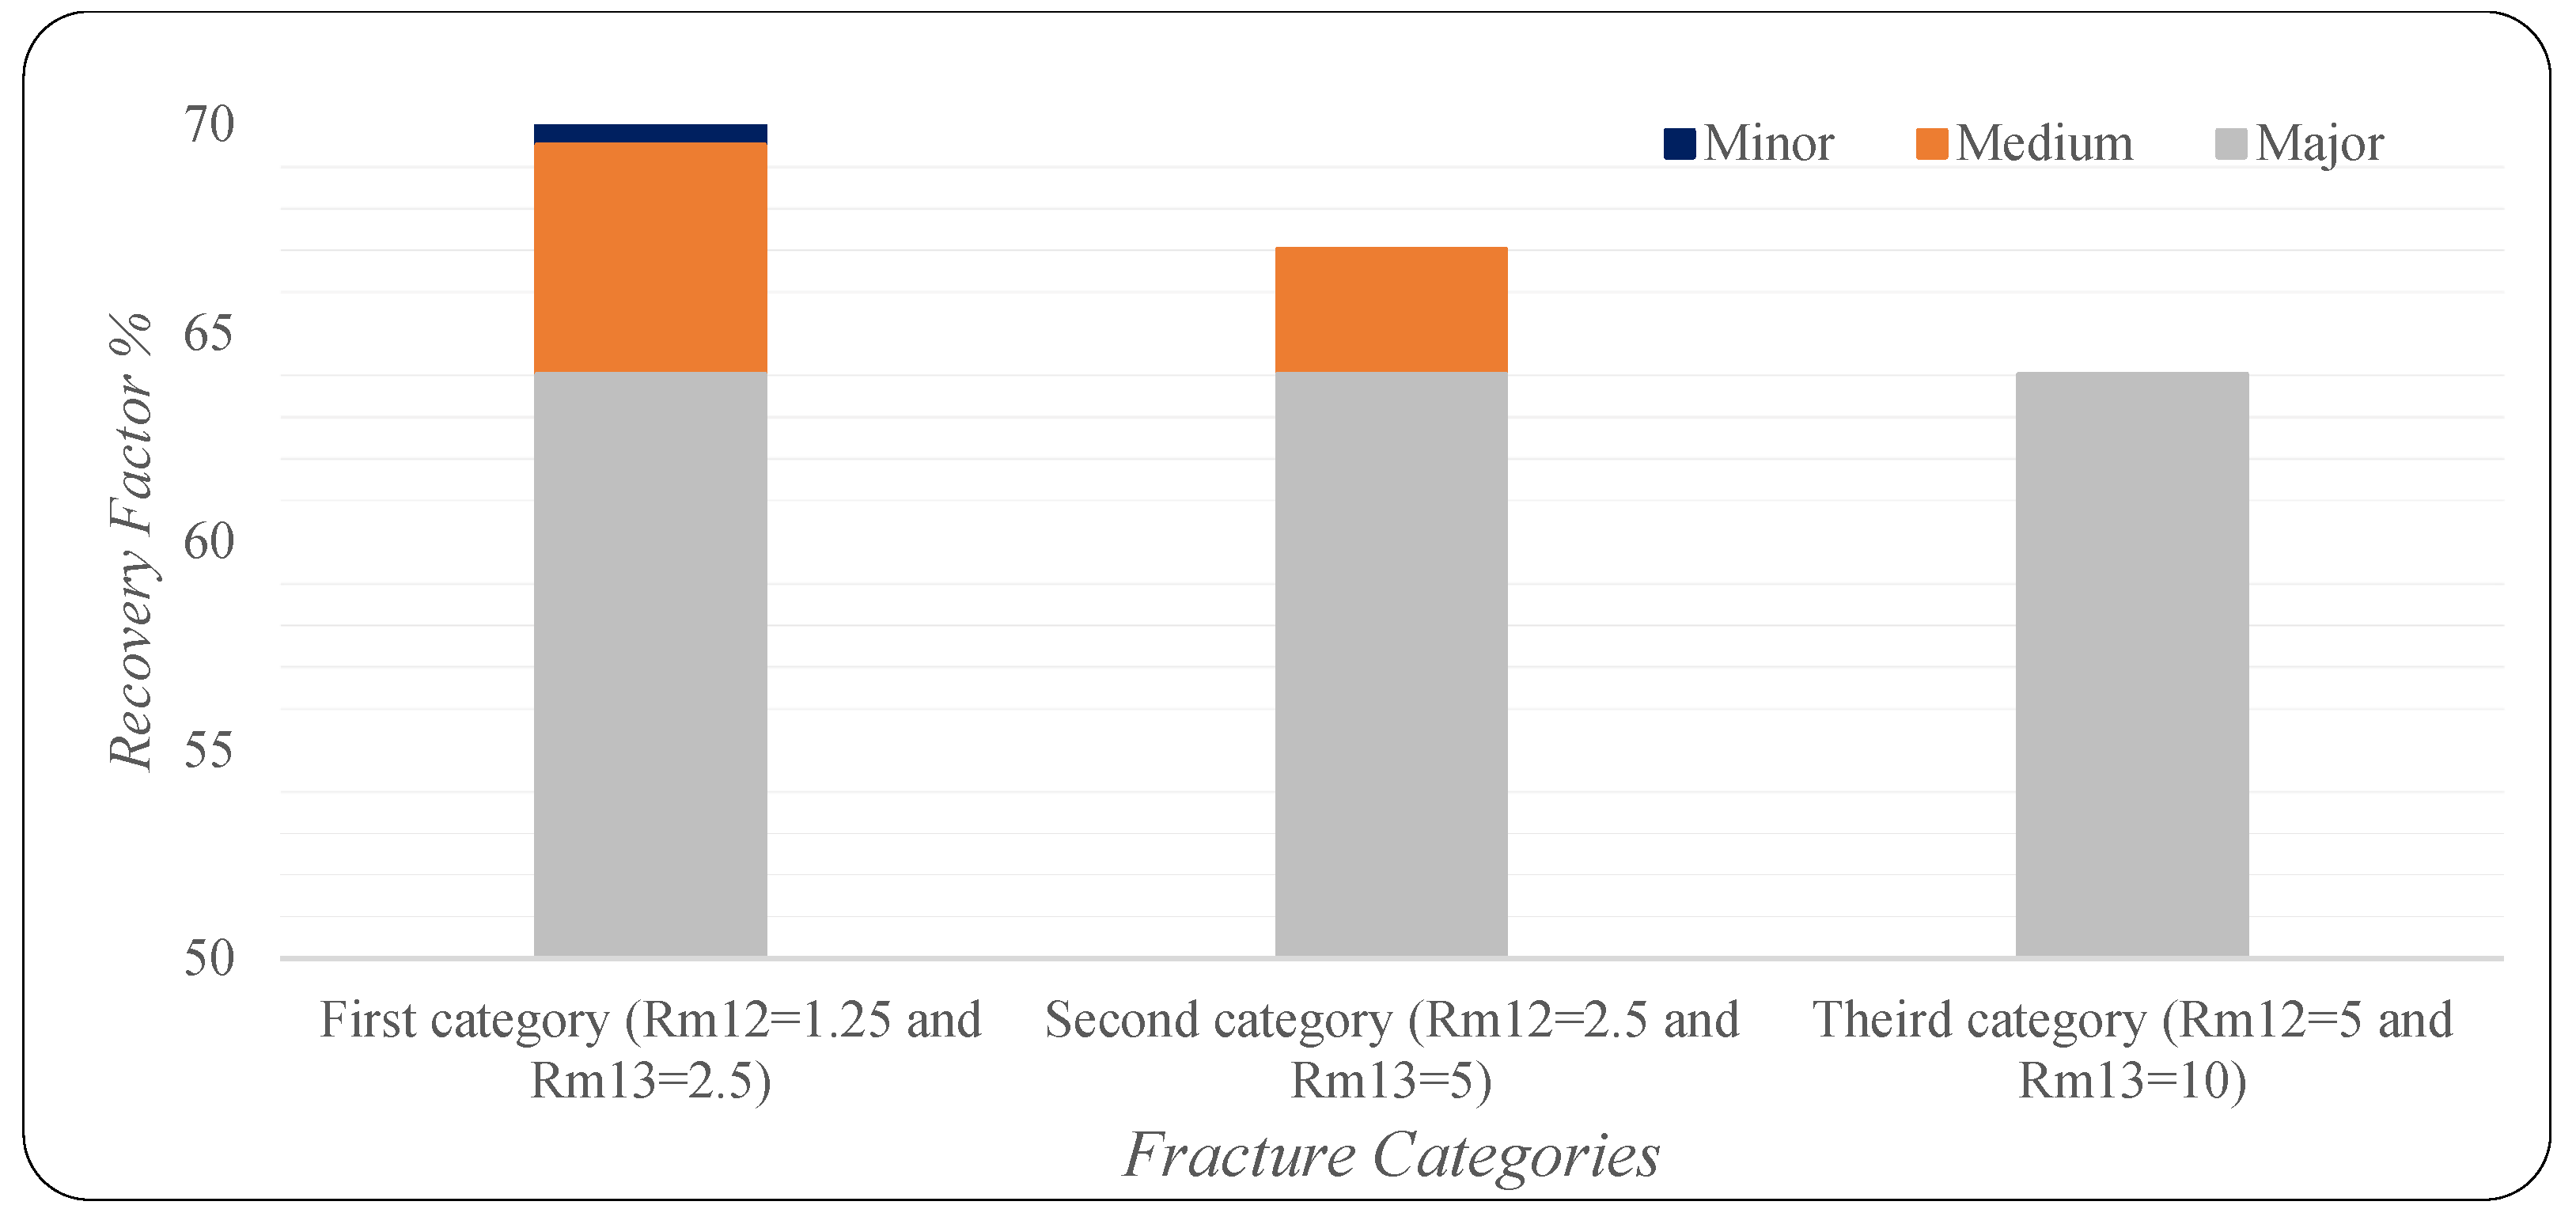
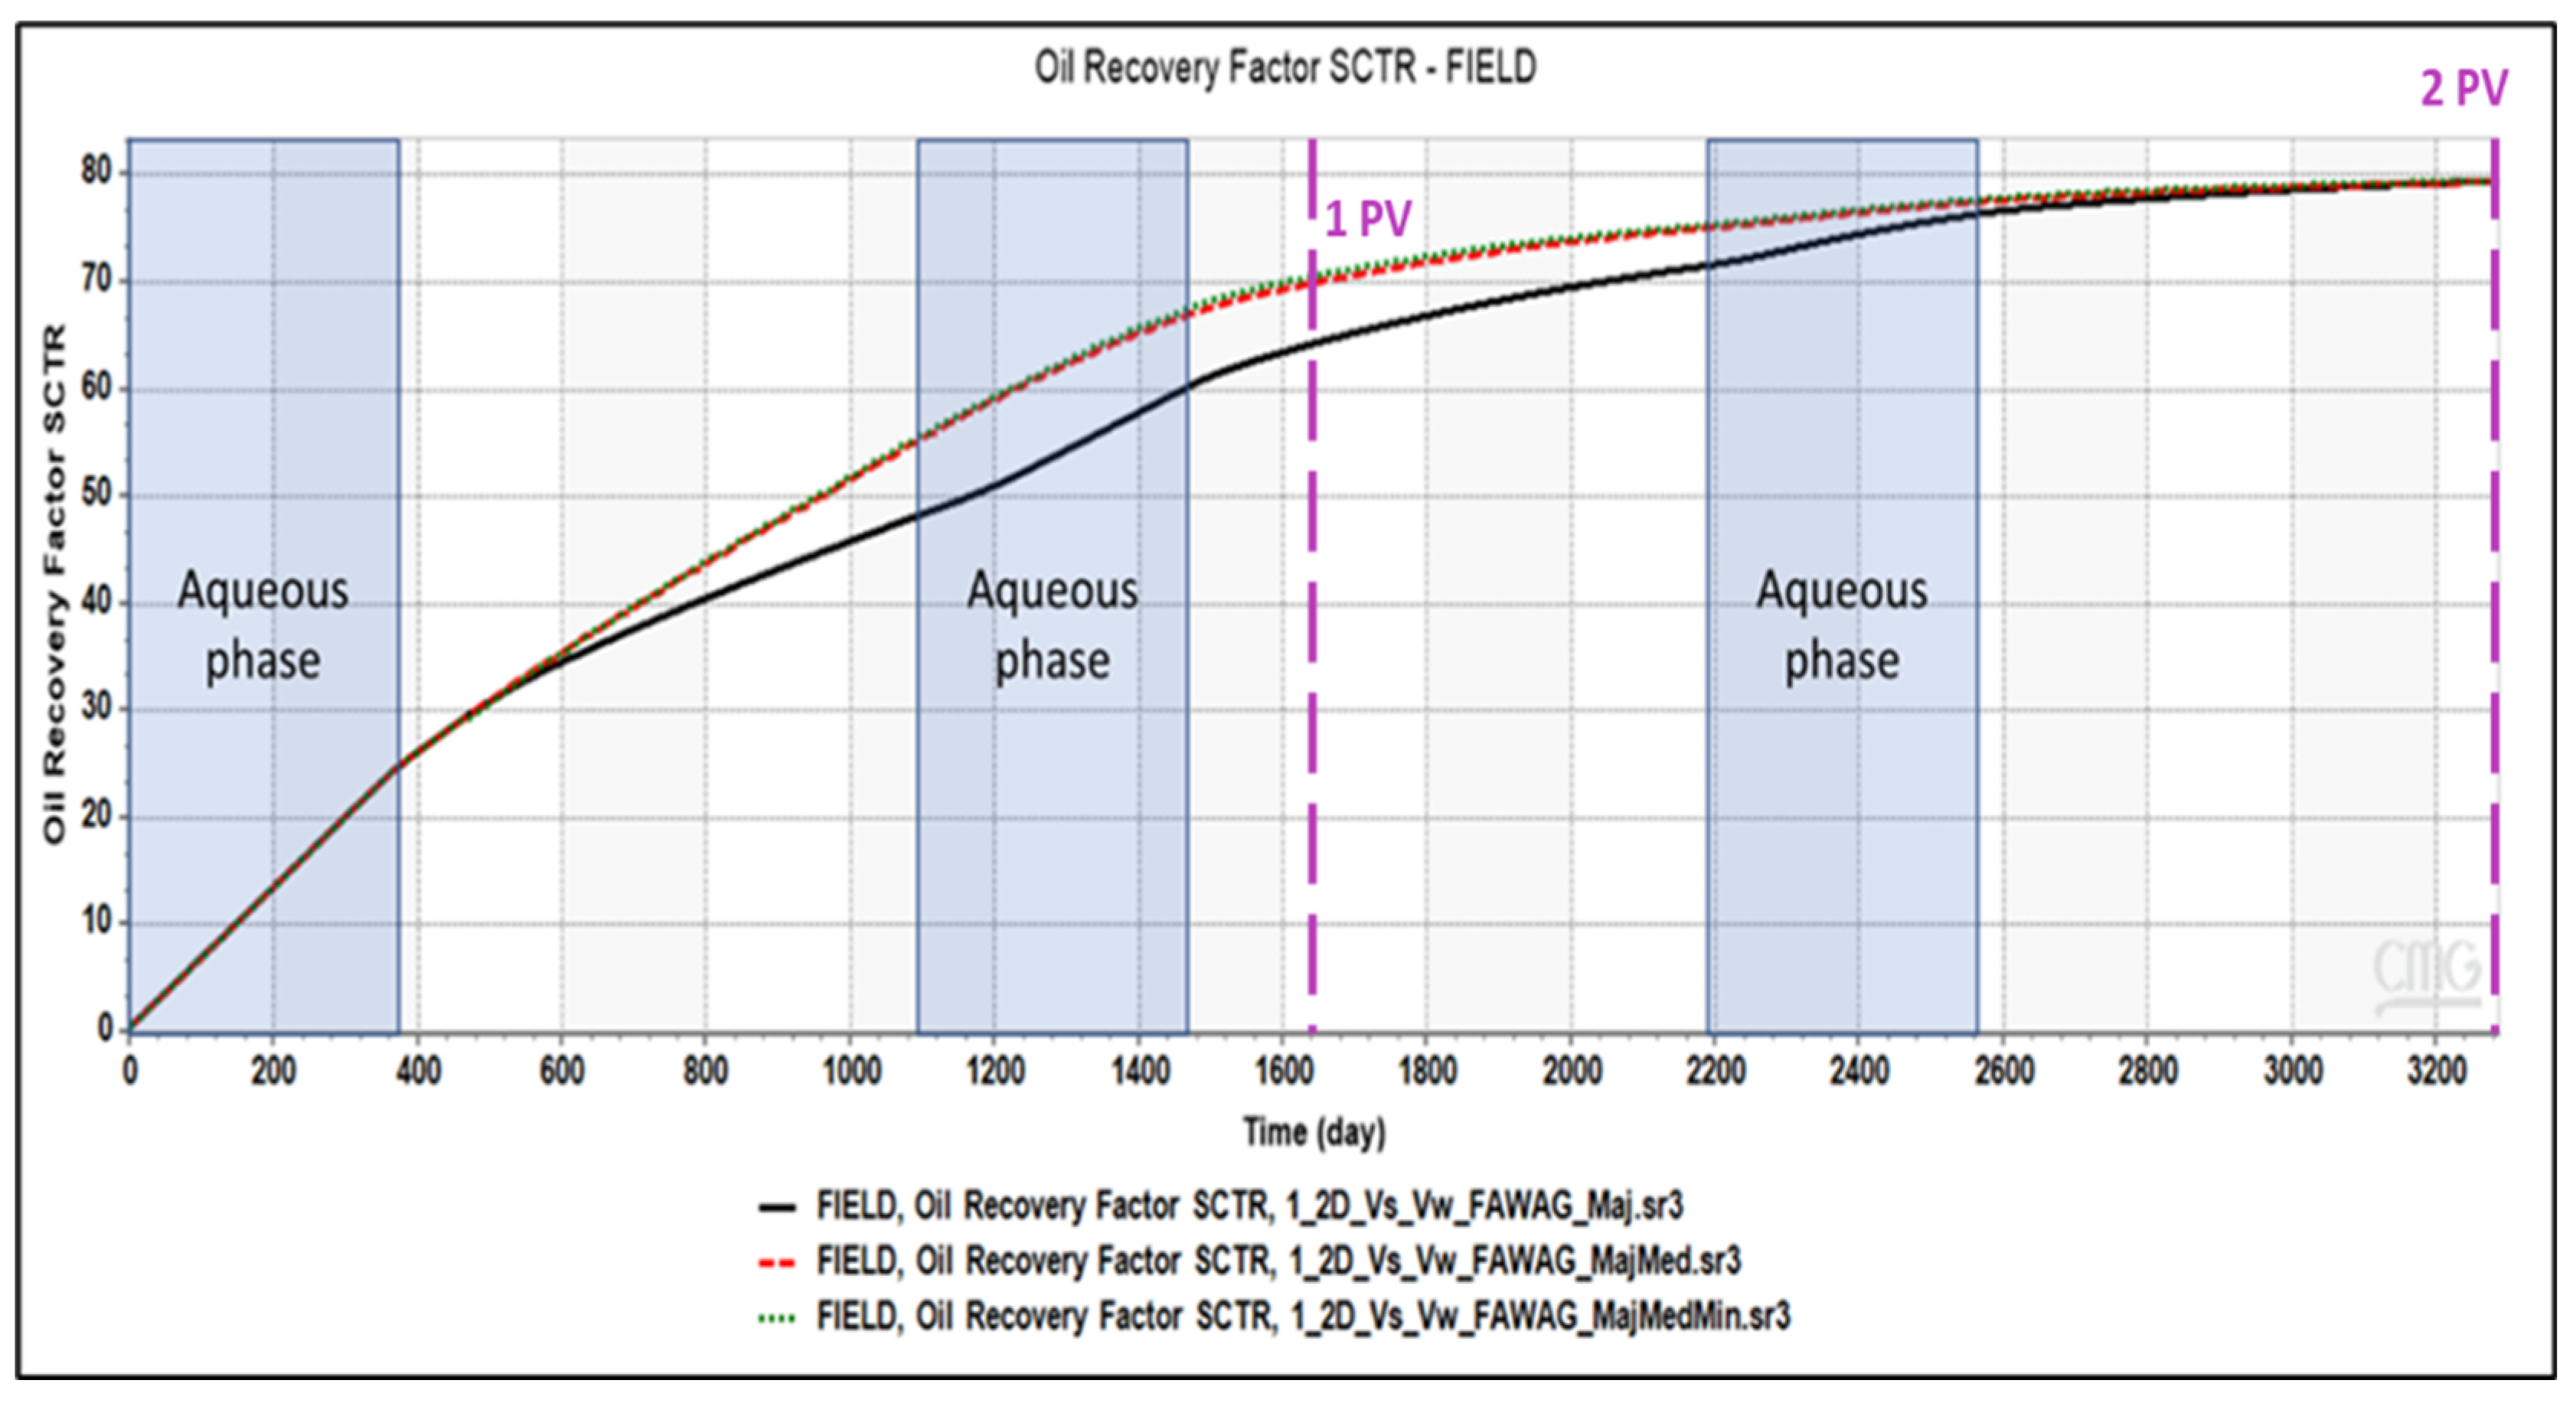
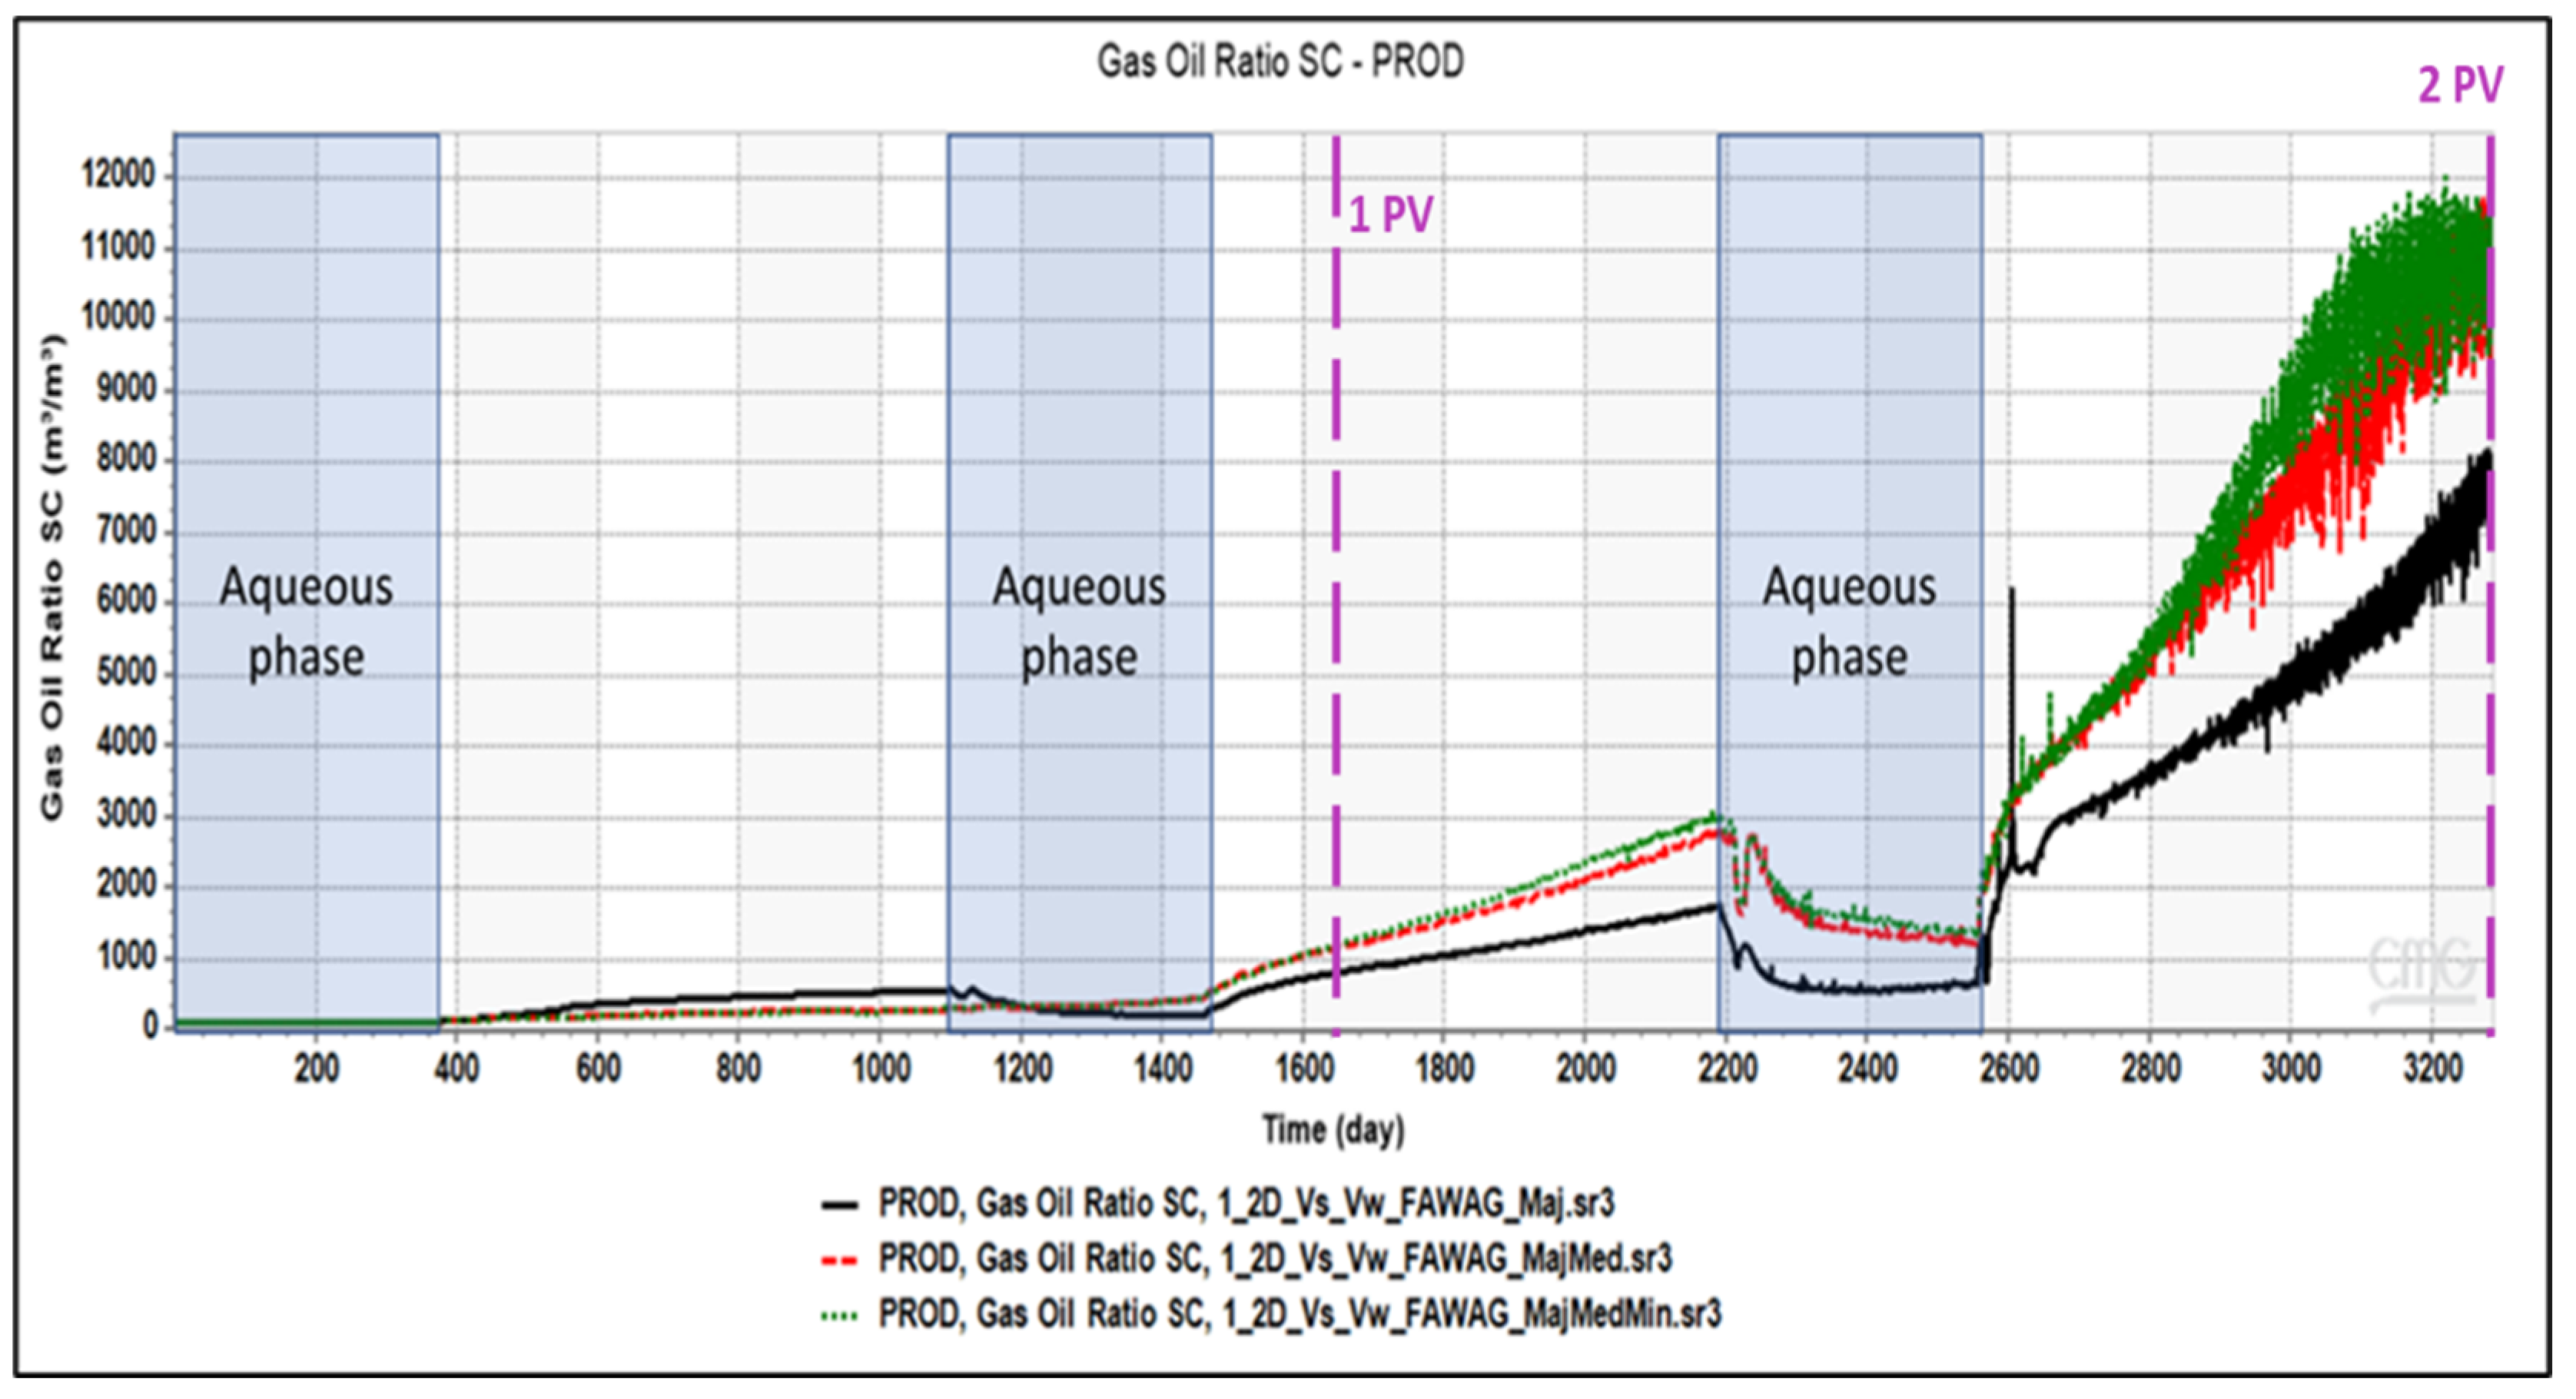
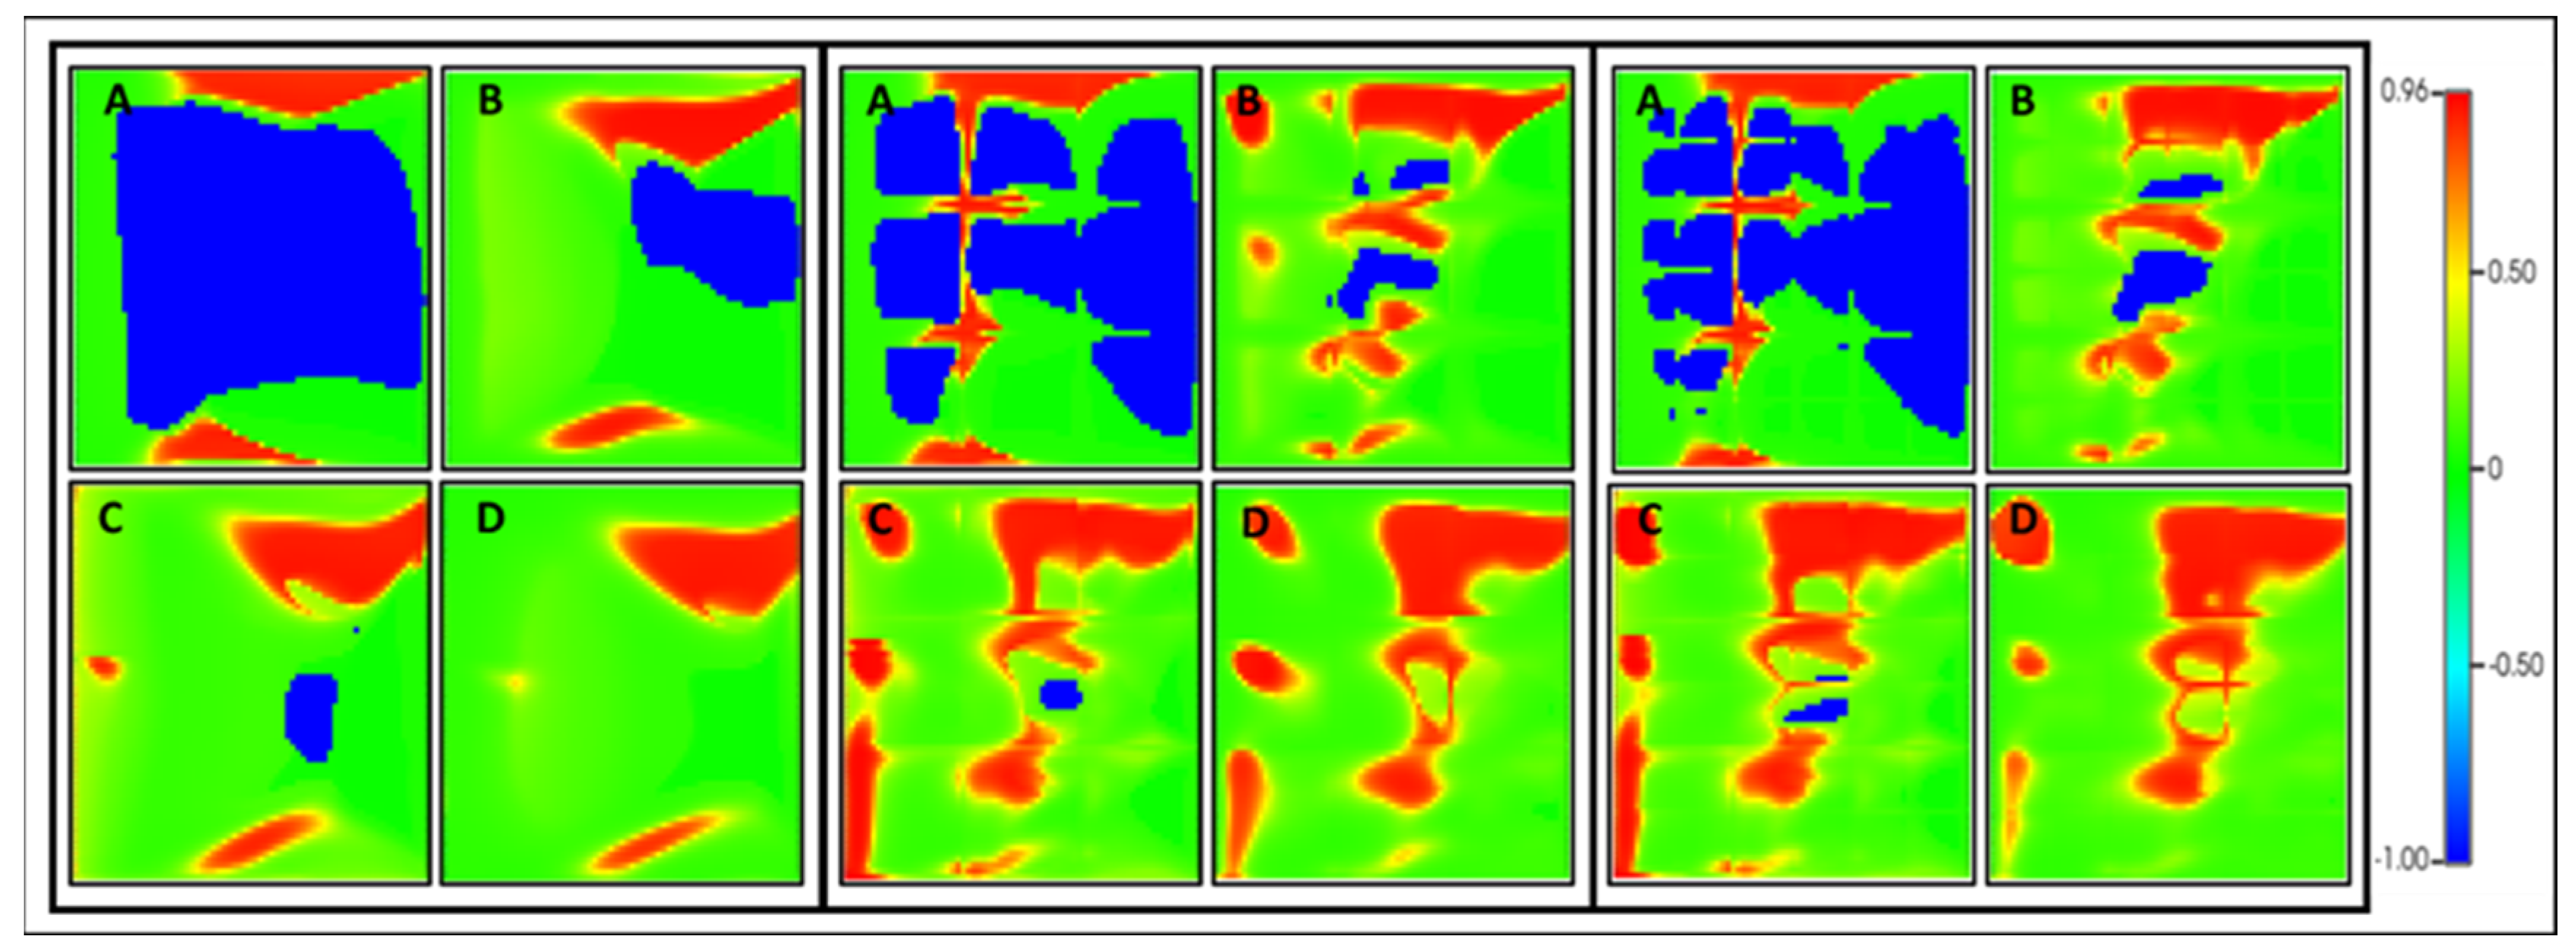
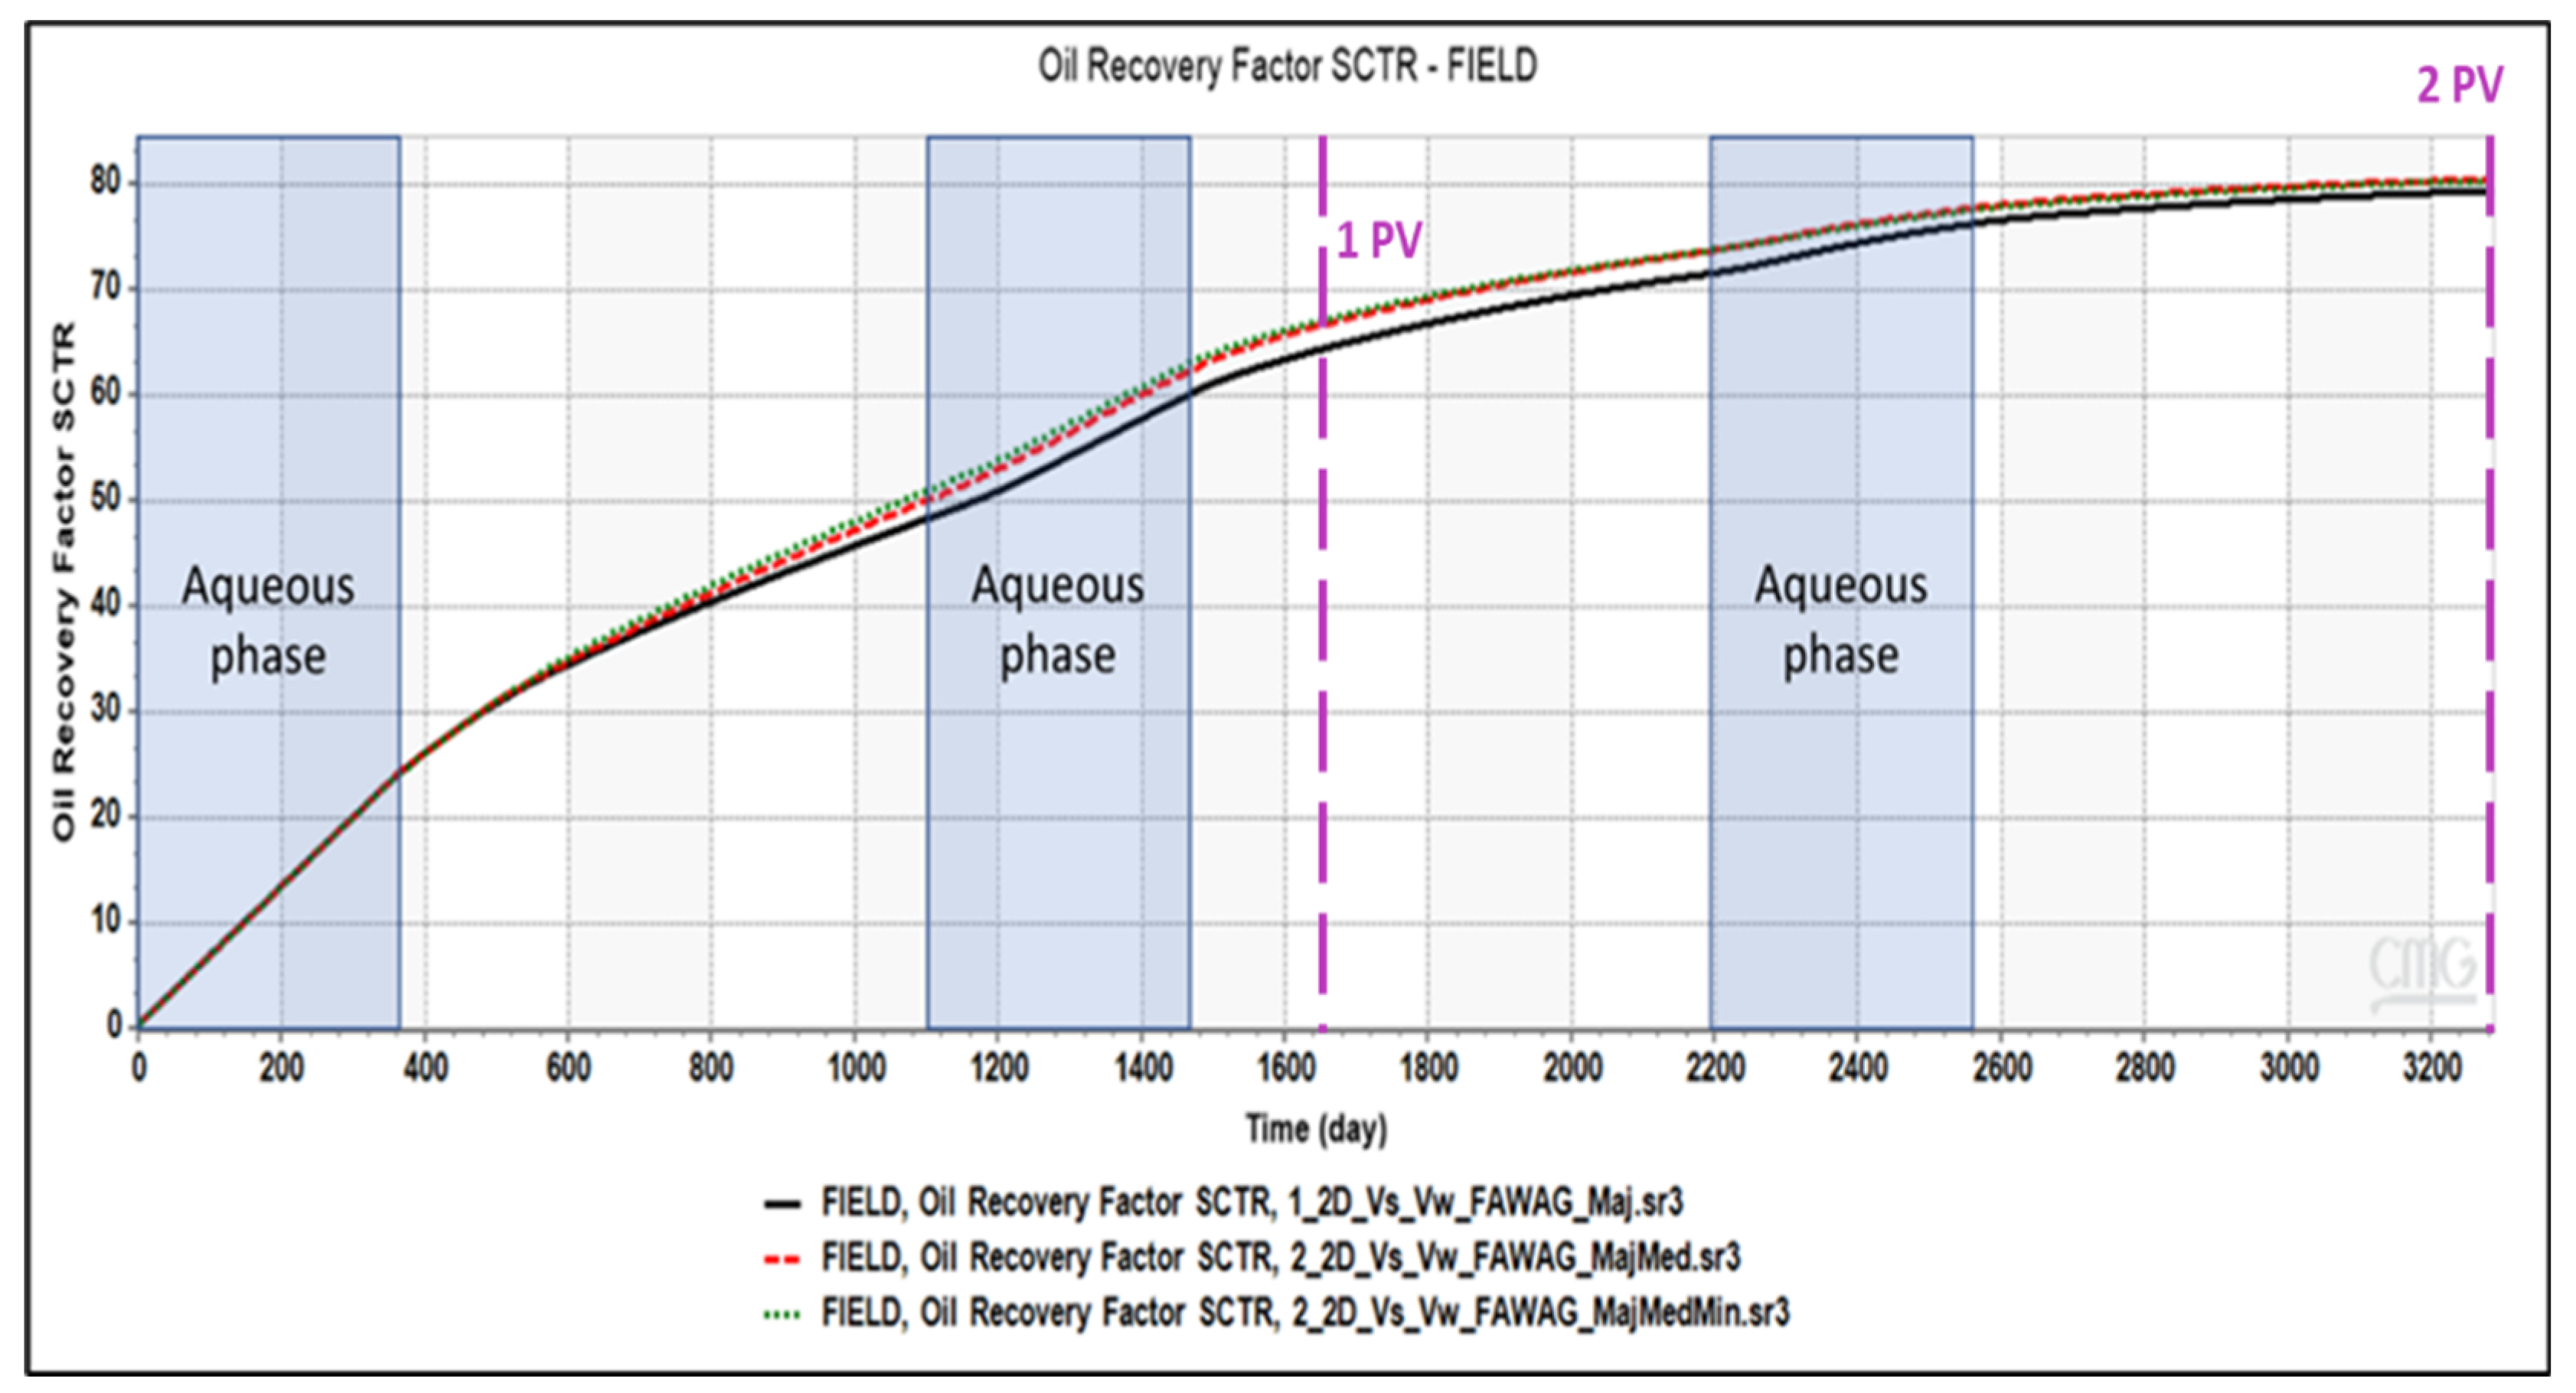
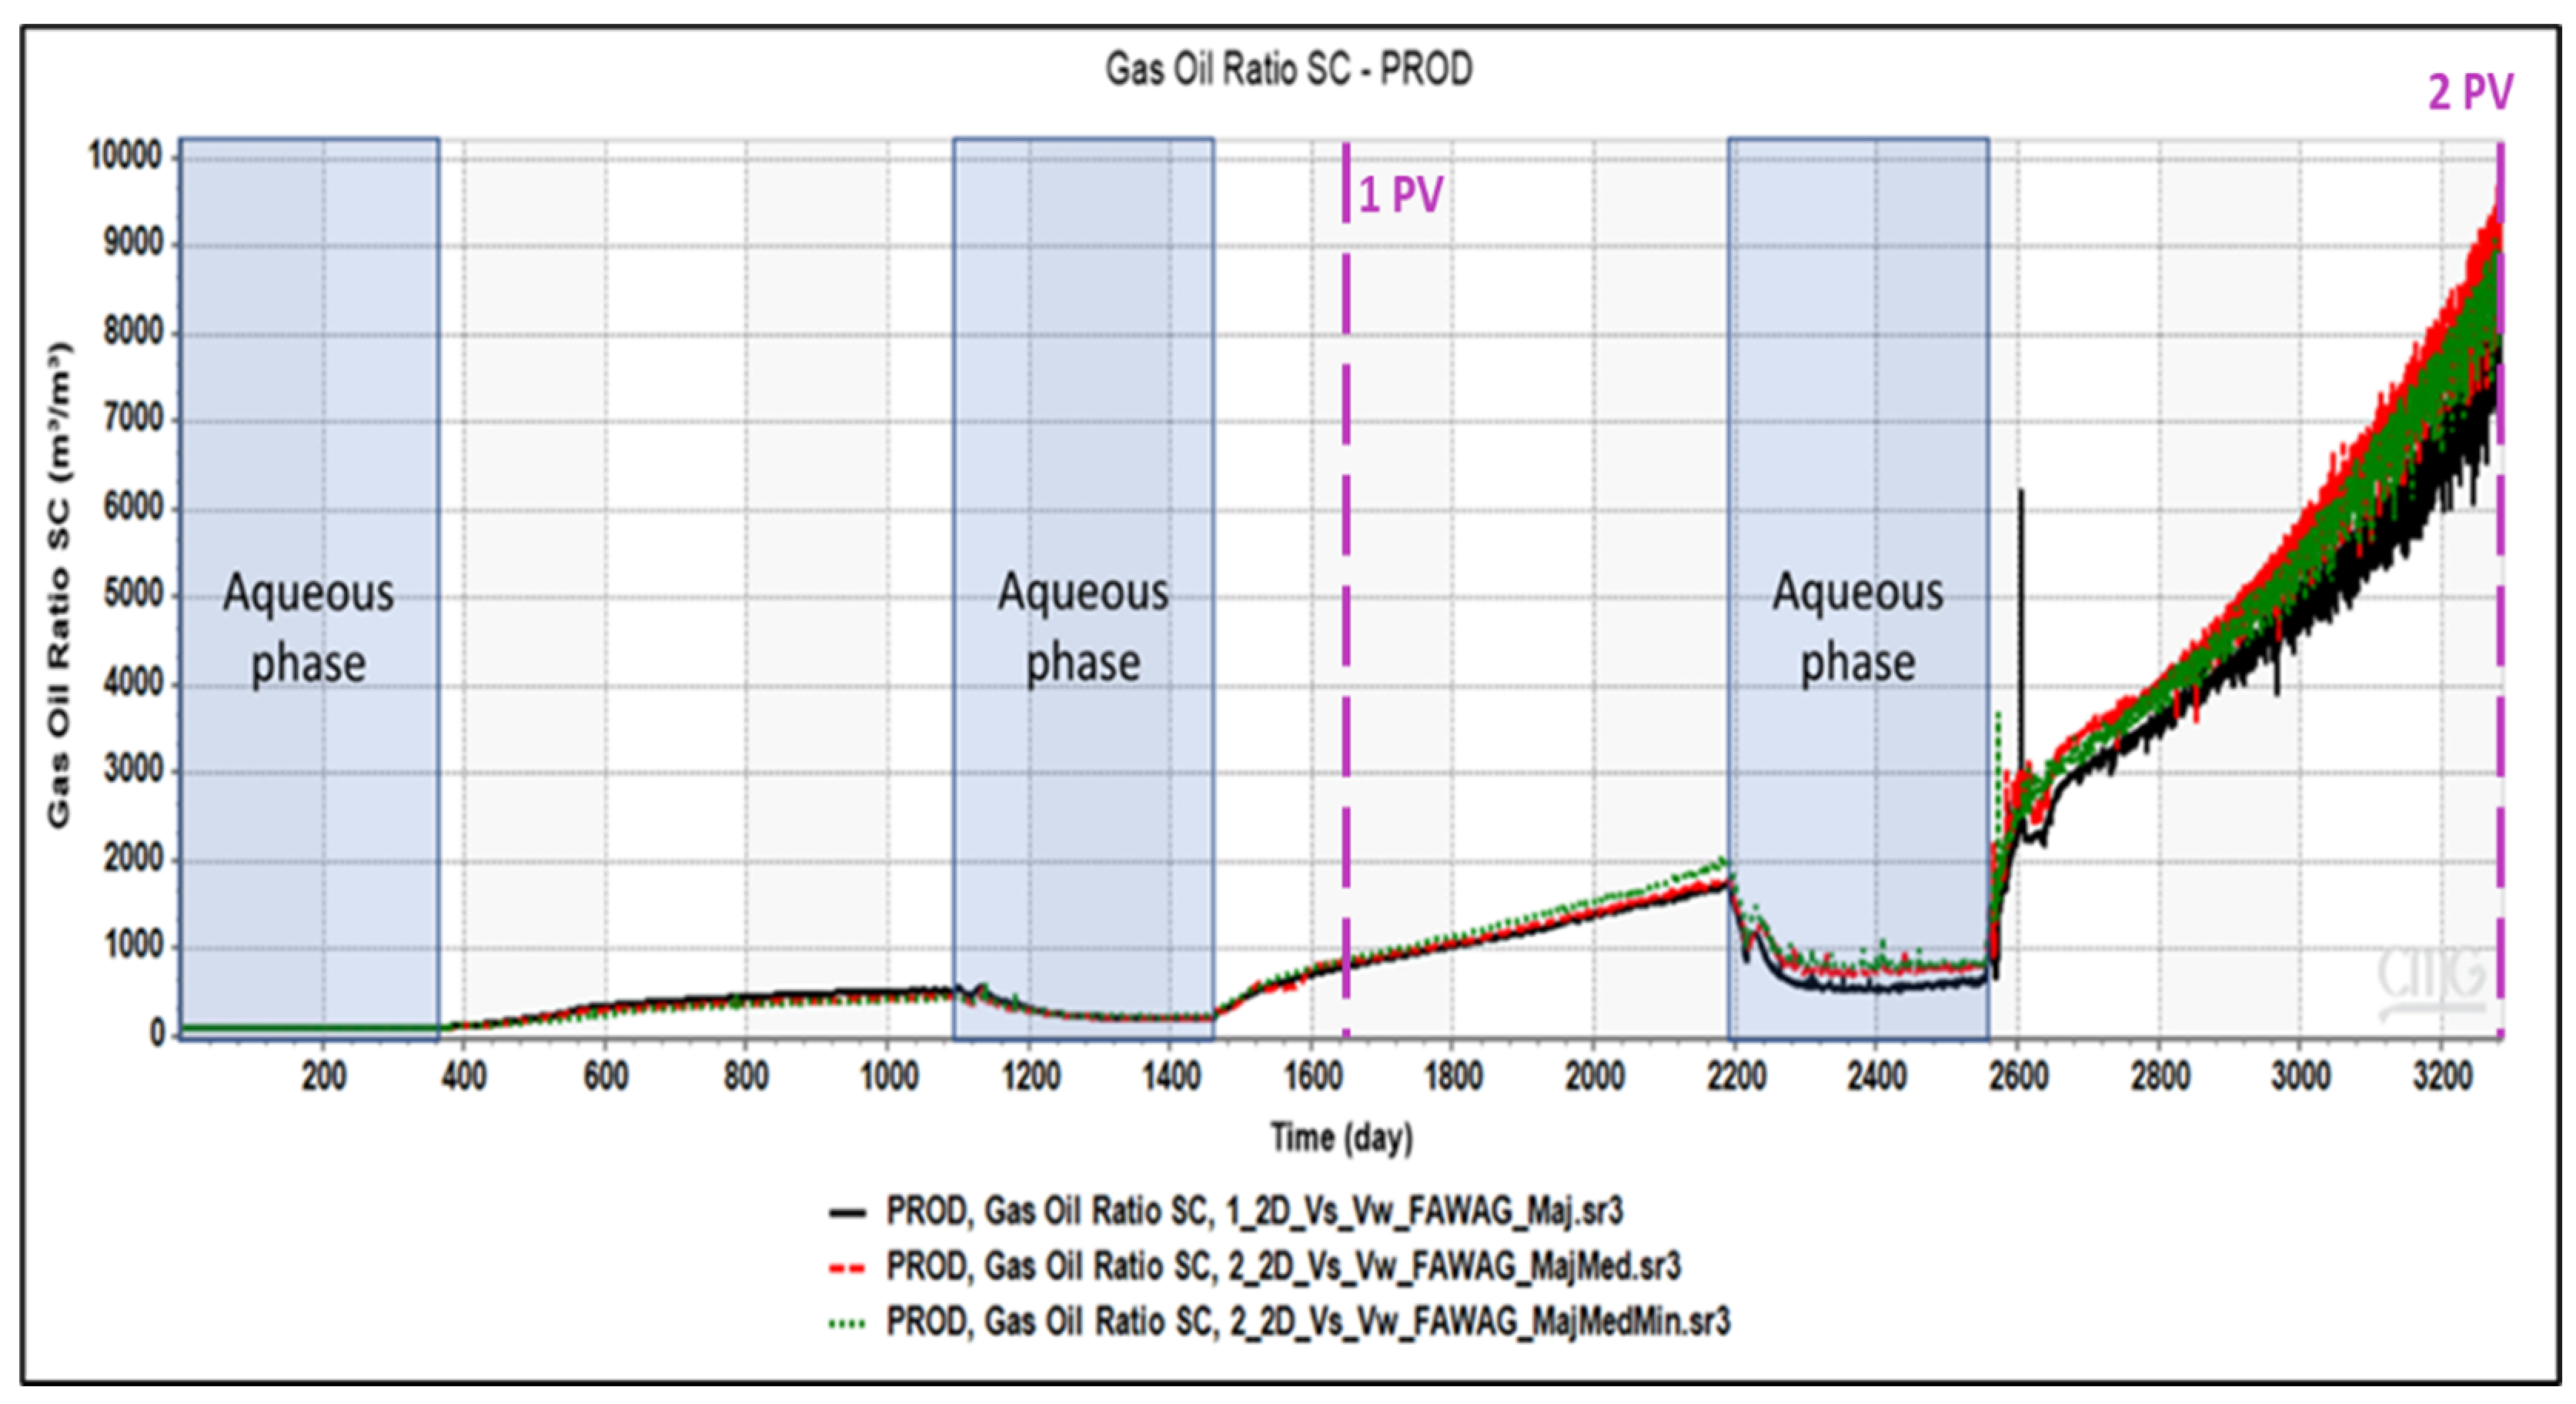
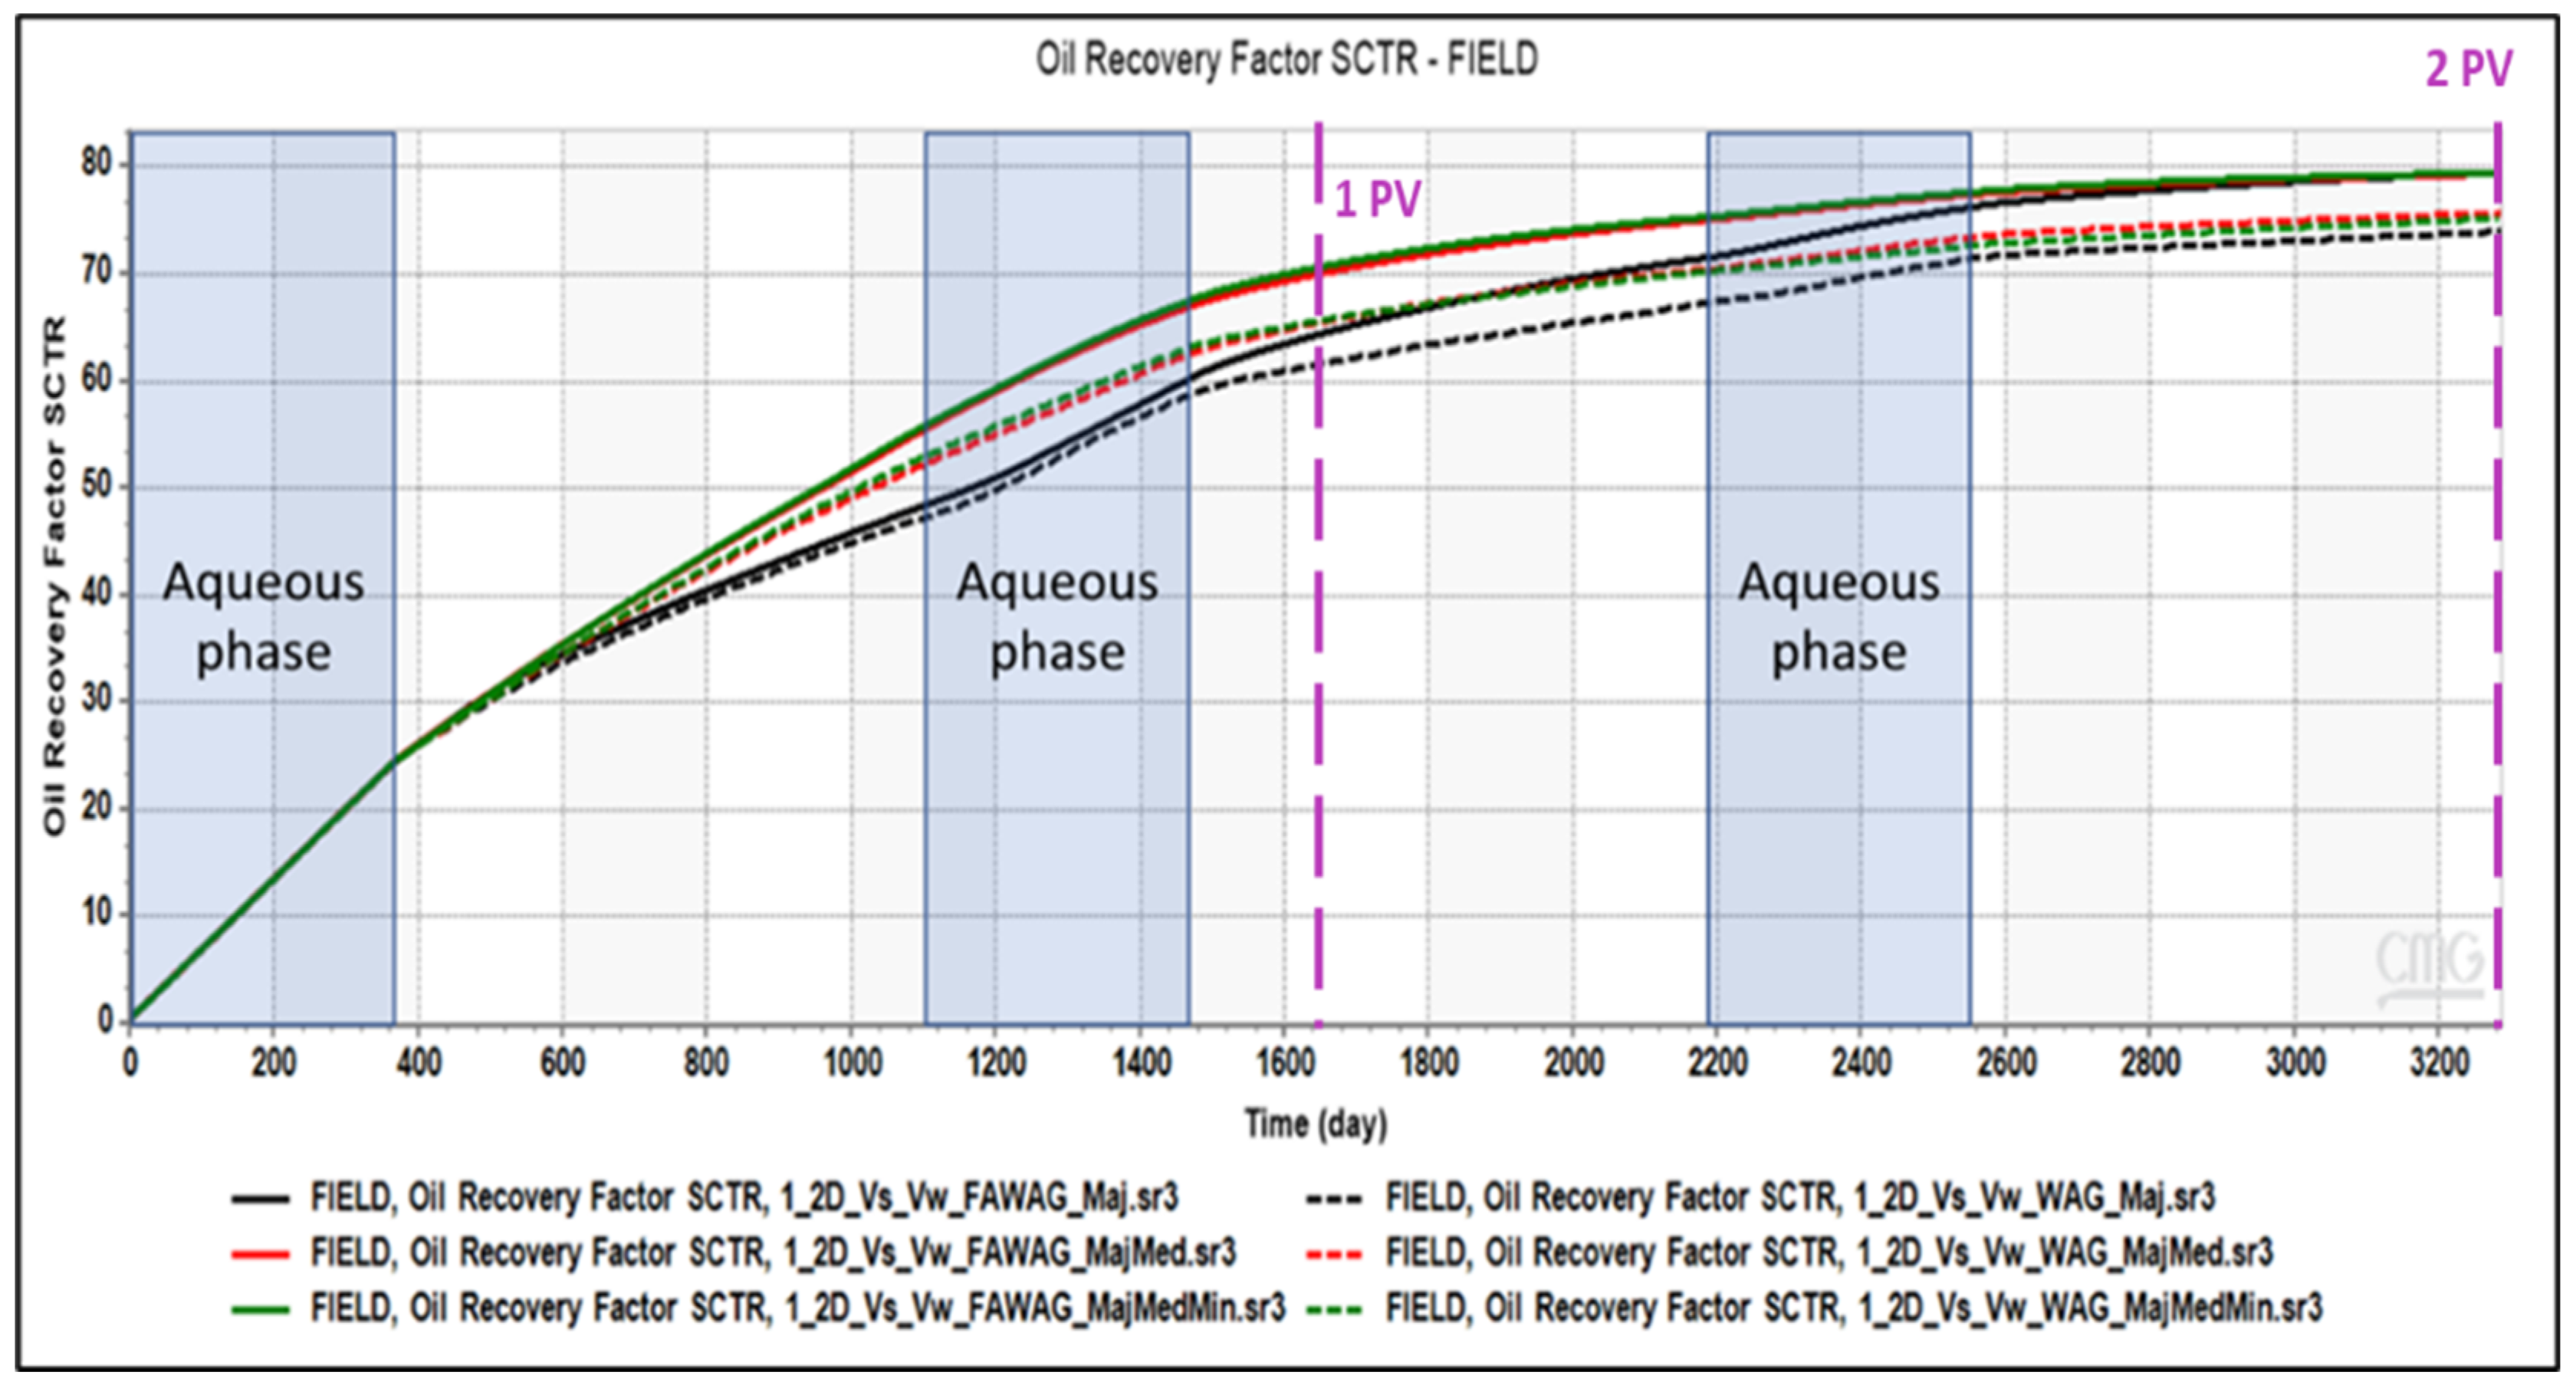
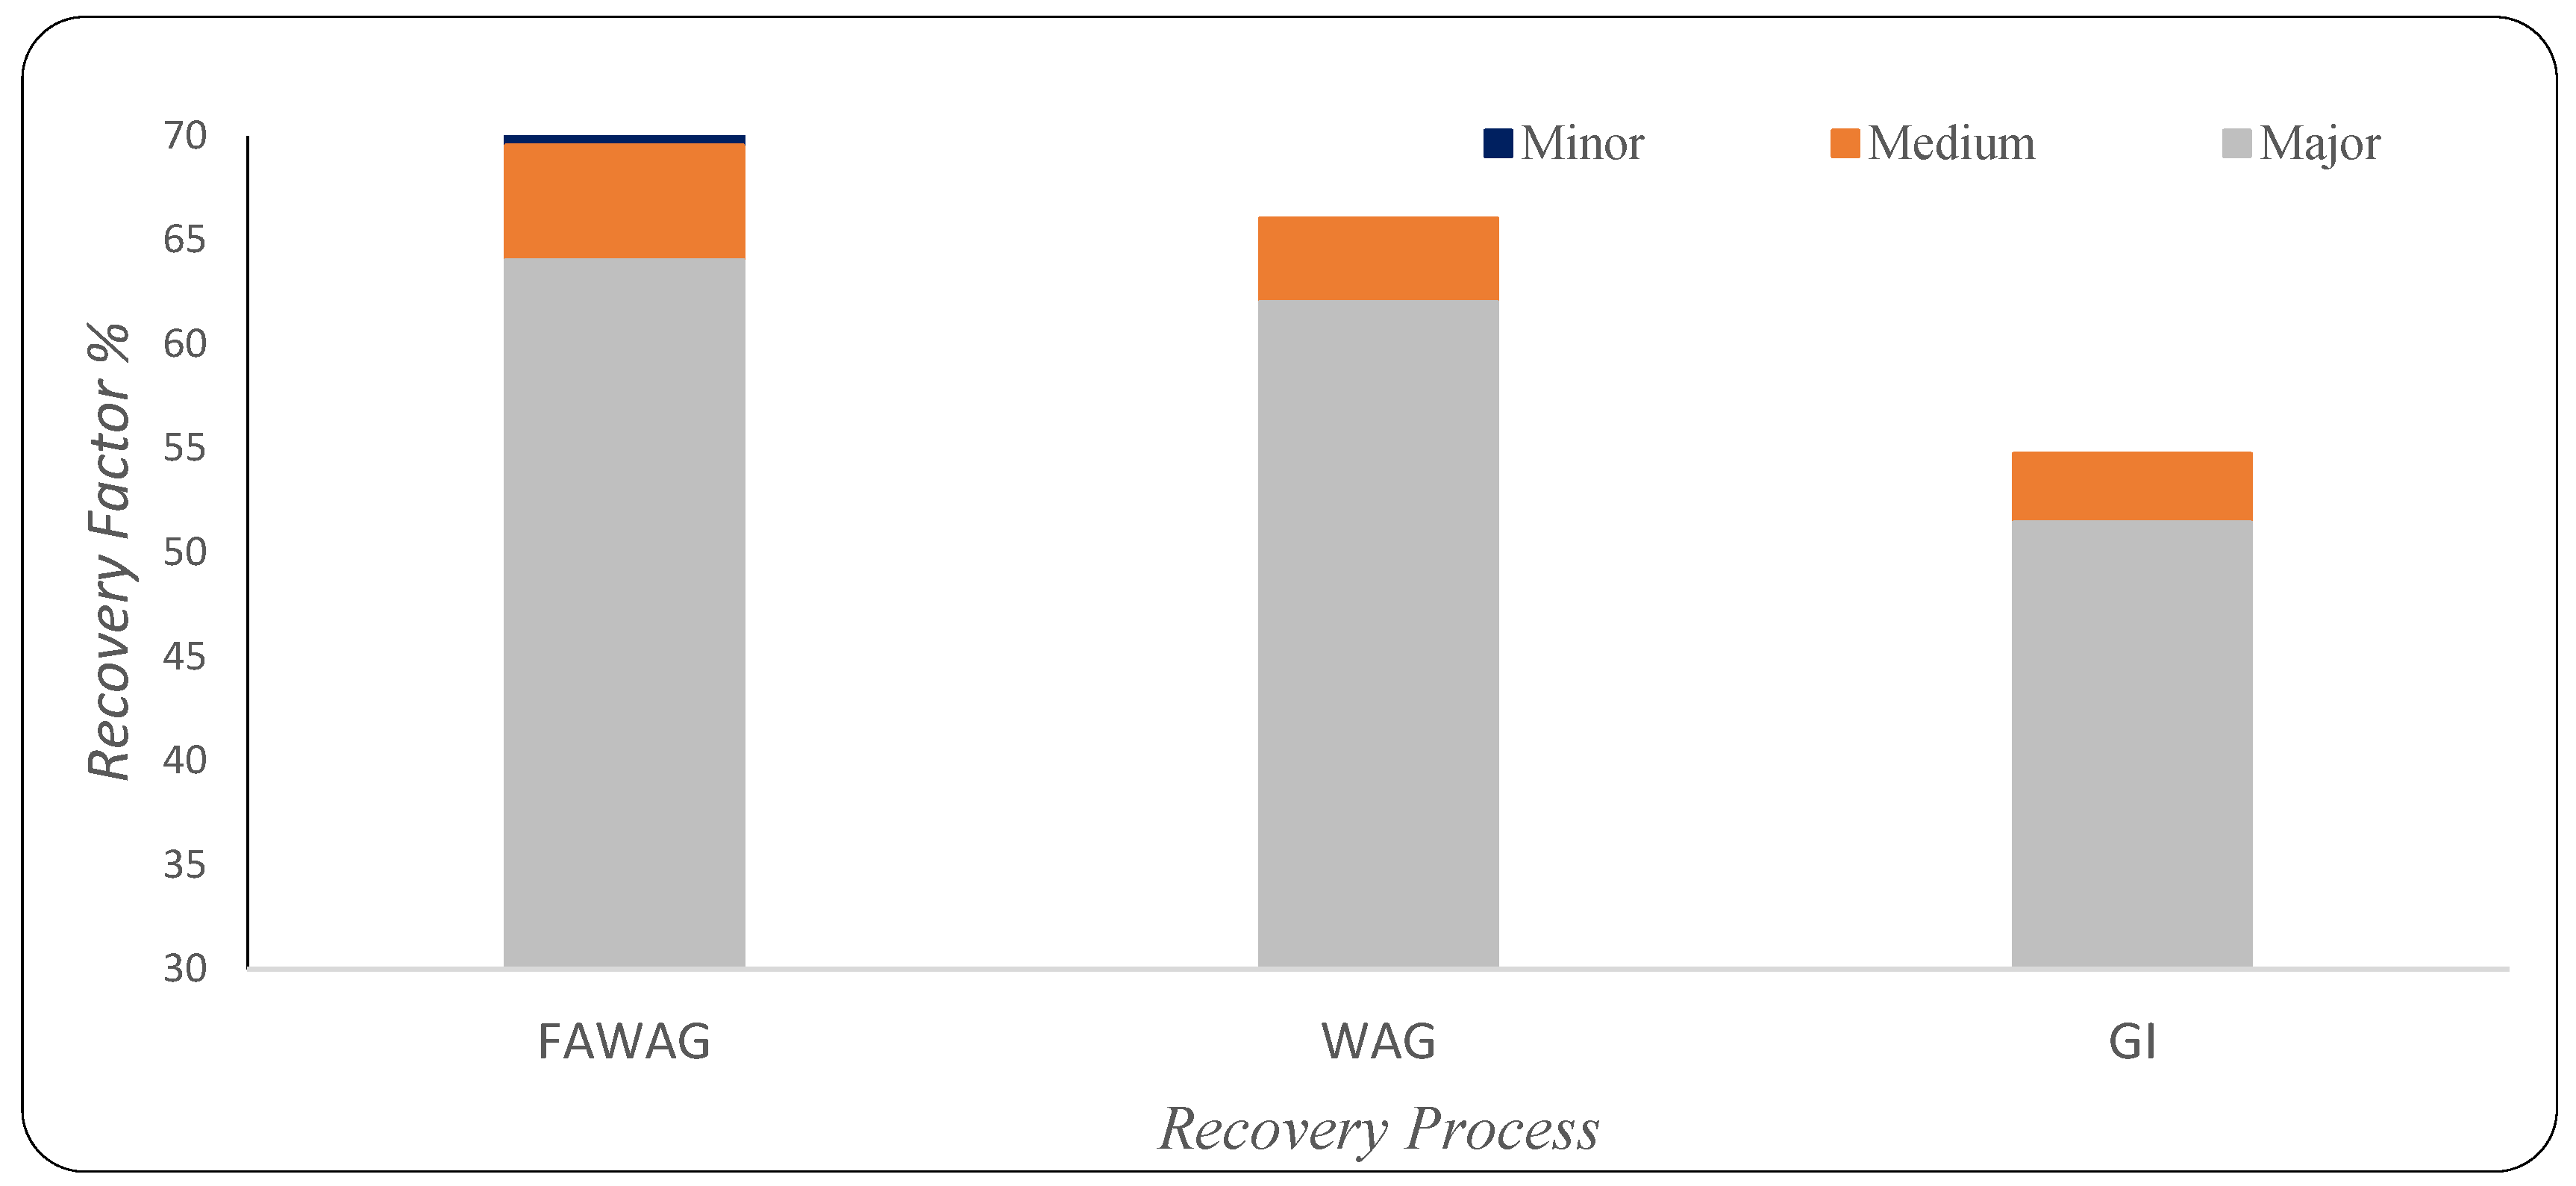
3.2. Foam-Assisted WAG
3.3. WAG Process
4. Summary and Conclusions
Author Contributions
Funding
Data Availability Statement
Acknowledgments
Conflicts of Interest
References
- Saidi, A.M. Reservoir Engineering of Fractured Reservoirs: Fundamental and Practical Aspects; Total: Paris, France, 1987. [Google Scholar]
- Van Golf-Racht, T. Developments in Petroleum Science. In Fundamentals of Fractured Reservoir Engineering; Elsevier Scientific Publishing Company: Amsterdam, The Netherlands, 1982. [Google Scholar]
- Allan, J.; Sun, S.Q. Controls on Recovery Factor in Fractured Reservoirs: Lessons Learned from 100 Fractured Fields. In Proceedings of the SPE Annual Technical Conference and Exhibition, Denver, CO, USA, 5–8 October 2003; Volume 18. [Google Scholar]
- Kharrat, R.; Mahdavi, S.; Ghorbani, D. A Comprehensive EOR Study of a Highly Fractured matured field-Case Study. In Proceedings of the 74th EAGE Conference and Exhibition incorporating EUROPEC 2012, Copenhagen, Denmark, 4–7 June 2012; Volume 153311. [Google Scholar]
- Agada, S.; Geiger, S.; Doster, F. Wettability, hysteresis, and fracture–matrix interaction during CO2 EOR and storage in fractured carbonate reservoirs. Int. J. Greenh. Gas Control 2016, 46, 57–75. [Google Scholar] [CrossRef]
- Aljuboori, F.A.; Lee, J.H.; Elraies, K.A.; Stephen, K.D. Effect of fracture characteristics on history matching in the Qamchuqa reservoir: A case study from Iraq. Carbonates Evaporites 2020, 35, 87. [Google Scholar] [CrossRef]
- Luo, H.; Mohanty, K.K. Modeling Near-Miscible Gas Foam Injection in Fractured Tight Rocks and Its Challenges. Energies 2021, 14, 1998. [Google Scholar] [CrossRef]
- Kharrat, R.; Ott, H. A Comprehensive Review of Fracture Characterization and Its Impact on Oil Production in Naturally Fractured Reservoirs. Energies 2023, 16, 3437. [Google Scholar] [CrossRef]
- Xu, Z.-X.; Li, S.-Y.; Li, B.-F.; Chen, D.-Q.; Liu, Z.-Y.; Li, Z.-M. A review of development methods and EOR technologies for carbonate reservoirs. Pet. Sci. 2020, 17, 990–1013. [Google Scholar] [CrossRef]
- Kharrat, R.; Zallaghi, M.; Ott, H. Performance quantification of Enhanced Oil Recovery Methods in fractured reservoirs. Energies 2021, 14, 4739. [Google Scholar] [CrossRef]
- Guerriero, V.; Mazzoli, S.; Iannace, A.; Vitale, S.; Carravetta, A.; Strauss, C. A permeability model for naturally fractured carbonate reservoirs. Mar. Pet. Geol. 2013, 40, 115–134. [Google Scholar] [CrossRef]
- Pejic, M.; Kharrat, R.; Kadkhodaaie, A.; Azizmohammadi, S.; Ott, H. Impact of fracture types on the oil recovery in naturally fractured reservoirs. Energies 2022, 5, 7321. [Google Scholar] [CrossRef]
- Gong, J.; Rossen, W.R. Modeling flow in naturally fractured reservoirs: Effect of fracture aperture distribution on dominant sub-network for flow. Pet. Sci. 2017, 14, 138–154. [Google Scholar] [CrossRef]
- Gong, J.; Rossen, W.R. Characteristic fracture spacing in primary and secondary recovery for naturally fractured reservoirs. Fuel 2018, 223, 470–485. [Google Scholar] [CrossRef]
- Gugl, R.; Kharrat, R.; Shariat, A.; Ott, H. Evaluation of Gas-based EOR Methods in Gas Invaded Zones of Fractured Carbonate Reservoir. Energies 2022, 15, 4921. [Google Scholar] [CrossRef]
- Elfeel, M.A.; Al-Dhahli Geiger, S.; van Dijke, M.I.J. Fracture-matrix interactions during immiscible three-phase flow. J. Pet. Sci. Eng. 2016, 143, 171–186. [Google Scholar] [CrossRef]
- Al Karfy, L.; Kharrat, R.; Ott, H. Mechanistic study of the carbonated smart water in carbonate reservoirs. Greenh. Gases Sci. Technol. 2021, 11, 661–681. [Google Scholar] [CrossRef]
- Mogensen, K.; Masalmeh, S. A review of EOR techniques for carbonate reservoirs in challenging geological settings. J. Pet. Sci. Eng. 2020, 195, 107889. [Google Scholar] [CrossRef]
- Silva, R.R.; Maini, B. Evaluation of Gas-Assisted Gravity Drainage GAGD in Naturally Fractured Reservoirs NFR. In Proceedings of the SPE Improved Oil Recovery Conference, Tulsa, OK, USA, 11–13 April 2016. [Google Scholar]
- Heeremans, J.; Esmaiel, T.; Kruijsdijk, C.V. Feasibility Study of WAG Injection in Naturally Fractured Reservoirs. In Proceedings of the SPE/DOE Symposium on Improved Oil Recovery, Tulsa, OK, USA, 22–26 April 2006; Volume 100034, p. 10. [Google Scholar]
- Gbadamosi, A.O.; Kiwalabye, J.; Juni, R.; Augustine, A. A review of gas enhanced oil recovery schemes used in the North Sea. J. Pet. Explor. Prod. Technol. 2018, 8, 1373–1387. [Google Scholar] [CrossRef]
- Ayoub, M.; Saaid, I.B.; Shabib-asl, A. Comprehensive Review of Foam Application during Foam Assisted Water Alternating Gas (FAWAG) Method. Res. J. Appl. Sci. Eng. Technol. 2014, 8, 1896–1904. [Google Scholar]
- Alalim, N. Impact of Fractures Networks on Gas-Based EOR Methods. Ph.D. Thesis, University of Leoben, Leoben, Austria, 1 July 2022. [Google Scholar]
- Bourbiaux, B. Fractured Reservoir Simulation: A Challenging and Rewarding Issue. Oil Gas Sci. Technol.-Rev. De L’Institut Français Du Pétrole 2010, 65, 227–238. [Google Scholar] [CrossRef]
- Kasiri, N. Status of Dual-Continuum Models for Naturally Fractured Reservoir Simulation. Pet. Sci. Technol. 2011, 29, 1236–1248. [Google Scholar] [CrossRef]
- Lei, Q.; Latham, J.-P.; Tsang, C.-F. The use of discrete fracture networks for modeling coupled geomechanical and hydrological behavior of fractured rocks. Comput. Geotech. 2017, 85, 151–176. [Google Scholar] [CrossRef]
- Bosma, S.; Hajibeygi, H.; Tene, M.; Tchelepi, H.A. Multiscale finite volume method for discrete fracture modeling on unstructured grids (MS-DFM). J. Comput. Phys. 2017, 351, 145–164. [Google Scholar] [CrossRef]
- CMG. GEM 2020.11 User Guide; Computer Modelling Group Ltd.: Calgary, AB, Canada, 2020. [Google Scholar]
- Wong DL, Y.; Doster, F.; Geiger, S.; Francot, E.; Gouth, F. Fluid Flow Characterization Framework for Naturally Fractured Reservoirs Using Small-Scale Fully Explicit Models. Transp. Porous Media 2020, 134, 399–434. [Google Scholar] [CrossRef]
- Ma, K.; Ren, G.; Mateen, K.; Morel, D.; Cordelier, P. Modeling Techniques for Foam Flow in Porous Media. SPE J. 2015, 20, 453–470. [Google Scholar] [CrossRef]
- Harimi, B.; Masihi, M.; Ghazanfari, M.H. Characterization of Liquid Bridge in Gas/Oil Gravity Drainage in Fractured Reservoirs. Iran. J. Oil Gas Sci. Technol. 2019, 8, 73–91. [Google Scholar]
- Kovscek, A.R.; Tretheway, D.C.; Persoff, P.; Radke, C.J. Foam flow through a transparent rough-walled rock fracture. J. Pet. Sci. Eng. 1995, 13, 75–86. [Google Scholar] [CrossRef]
- Haugen, A.; Fernø, M.A.; Graue, A. Experimental Study of Foam Flow in Fractured Oil-Wet Limestone for Enhanced Oil Recovery. SPE Reserv. Eval. Eng. 2012, 15, 218–228. [Google Scholar] [CrossRef]
- Wenli, Y.; Sharifzadeh, M.; Yang, Z.; Xu, G.; Fang, Z. Assessment of fracture characteristics controlling fluid flow performance in discrete fracture networks (DFN). J. Pet. Sci. Eng. 2019, 178, 1104–1111. [Google Scholar] [CrossRef]
- Xu, Y.; Sepehrnoori, K. Development of an Embedded Discrete Fracture Model for Field-Scale Reservoir Simulation With Complex Corner-Point Grids. SPE J. 2019, 24, 1552–1575. [Google Scholar] [CrossRef]
- Yan, X.; Huang, Z.; Yao, J.; Li, Y.; Fan, D. An efficient embedded discrete fracture model based on mimetic finite difference method. J. Pet. Sci. Eng. 2016, 145, 11–21. [Google Scholar] [CrossRef]
- Shojaei, J.M.; de Castro, A.R.; Meheust, Y.; Shokri, N. Dynamics of foam flow in a rock fracture: Effects of aperture variation on apparent shear viscosity and bubble morphology. J. Colloid Interface Sci. 2019, 552, 464–475. [Google Scholar] [CrossRef]
- Osei-Bonsu, K.; Shokri, N.; Grassia, P. Fundamental investigation of foam flow in a liquid-filled Hele-Shaw cell. J. Colloid Interface Sci. 2016, 462, 288–296. [Google Scholar] [CrossRef]


| Model Name | Dimensions | Grids Number in Each Direction | Porosity | Permeability | ||||||
|---|---|---|---|---|---|---|---|---|---|---|
| Meter | % | mD | ||||||||
| X | Y | Z | X | Y | Z | - | X | Y | Z | |
| 2D vertical slice | 15 | 1 | 15 | 67 | 1 | 67 | 0.2 | 1 | 1 | 1 |
| Extended 2D vertical slice | 15 | 1 | 30 | 67 | 1 | 134 | 0.2 | 1 | 1 | 1 |
| Properties | Fractures Aperture | Dimensionless Numbers | Fractures Permeability | |||||
|---|---|---|---|---|---|---|---|---|
| mm | Darcy | |||||||
| Category | Major | Medium | Minor | Rm12 | Rm13 | Major | Medium | Minor |
| 1 | 2.00 | 1.60 | 0.80 | 1.25 | 2.50 | 4.00 | 2.56 | 0.64 |
| 2 | 2.00 | 0.80 | 0.40 | 2.50 | 5.00 | 4.00 | 0.64 | 0.16 |
| 3 | 2.00 | 0.40 | 0.20 | 5.00 | 10.00 | 4.00 | 0.16 | 0.04 |
| Gas Injection Fluid Model | Foam Model CMG | |||
|---|---|---|---|---|
| Parameter | Value | Unit | Component | Mole |
| GOR | 155 | m3/m3 | C1 | 0.50 |
| Pb | 362.6 | psi | C3 | 0.03 |
| Bg | 0.0043 | m3/sm3 | C6 | 0.07 |
| Bo | 1.42 | m3/sm3 | C10 | 0.20 |
| µg | 0.042 | cp | C15 | 0.15 |
| µo | 0.76 | cp | C20 | 0.05 |
Disclaimer/Publisher’s Note: The statements, opinions and data contained in all publications are solely those of the individual author(s) and contributor(s) and not of MDPI and/or the editor(s). MDPI and/or the editor(s) disclaim responsibility for any injury to people or property resulting from any ideas, methods, instructions or products referred to in the content. |
© 2023 by the authors. Licensee MDPI, Basel, Switzerland. This article is an open access article distributed under the terms and conditions of the Creative Commons Attribution (CC BY) license (https://creativecommons.org/licenses/by/4.0/).
Share and Cite
Kharrat, R.; Alalim, N.; Ott, H. Assessing the Influence of Fracture Networks on Gas-Based Enhanced Oil Recovery Methods. Energies 2023, 16, 6364. https://doi.org/10.3390/en16176364
Kharrat R, Alalim N, Ott H. Assessing the Influence of Fracture Networks on Gas-Based Enhanced Oil Recovery Methods. Energies. 2023; 16(17):6364. https://doi.org/10.3390/en16176364
Chicago/Turabian StyleKharrat, Riyaz, Nouri Alalim, and Holger Ott. 2023. "Assessing the Influence of Fracture Networks on Gas-Based Enhanced Oil Recovery Methods" Energies 16, no. 17: 6364. https://doi.org/10.3390/en16176364
APA StyleKharrat, R., Alalim, N., & Ott, H. (2023). Assessing the Influence of Fracture Networks on Gas-Based Enhanced Oil Recovery Methods. Energies, 16(17), 6364. https://doi.org/10.3390/en16176364