Abstract
The converter valve is the core equipment of flexible DC transmission, but it has been severely damaged in previous earthquakes. Therefore, the seismic performance of its structure has a significant impact on the safety and reliability of power transmission. To study the seismic performance of ±500 kV flexible DC converter valves and identify weak links in the supporting valve tower, this article first established a refined finite-element model of a valve tower based on its physical structure; then modal analysis on the valve tower was conducted; finally, time-domain analysis of the valve tower under three seismic excitations, namely Wenchuan, EI Centro, and artificial, was conducted, and the equivalent stress and directional displacement cloud maps of the key parts of the valve tower were obtained. The research results indicate that the dynamic characteristics of the valve tower are relatively complex, with low fundamental frequency and diverse natural vibration modes. Under earthquake action, the predominant frequency of EI Centro waves is close to the fundamental frequency of the valve tower, which is prone to resonance and causes significant damage to the valve structure. The improved design of the valve tower meets the seismic strength requirements of level 8 seismic intensity.
1. Introduction
Flexible DC transmission is an important way to build a smart grid. Compared with traditional DC transmission methods, flexible DC transmission has strong technical advantages in island power supply, urban distribution network capacity expansion and transformation, AC system interconnection, large-scale wind farm integration, and other aspects. It is a strategic choice to change the development pattern of the large power grid. With the development of power electronics technology, HVDC transmission technology based on a voltage source converter proposed by Boon-Teck Ooi and other scholars in Canada has been widely used in converter stations of transmission systems in recent years [1,2]. In a converter station, the converter valve is the key equipment in the flexible DC transmission project; the power system interruption caused by its function failure will lead to direct or indirect significant economic losses, which also puts forward higher reliability requirements for the converter valve [3,4,5].
Currently, earthquakes are being intensively studied all over the world using conventional geological and geophysical methods [6]. Xue et al. [7] counted 3579 time courses of ground shaking and investigated the effect of site category on the amplitude–frequency characteristics of ground shaking under strong earthquakes from the perspective of peak acceleration amplitude characteristics of bedrock and soil layers. Dong et al. [8] analyzed the effects of site, magnitude, and epicentral distance on the variation curves of principal frequency by using a linear function model and an exponential function model. After studying the seismic characteristics based on the above methods, some researchers have investigated the structural dynamic characteristics and seismic performance of converter valves. Zhang et al. [9] proposed a calculation method and analysis steps for the seismic calculation of high-voltage electrical facilities and verified its feasibility by examples. Li et al. [10] conducted on-site dynamic characterization tests on the converter valve to more comprehensively understand the self-oscillating frequency characteristics and the change rule of the damping ratio, and studied the effect of the interaction between the valve hall structure and the suspended valve tower under the effect of earthquakes. Maison et al. [11] carried out seismic simulation based on response spectrum analysis for ABB’s converter valve structure and tried the idea of reducing seismic response through dampers. Zhang et al. [12] used modal analysis to study the seismic performance and limiting measures of the suspension converter valve. Liu et al. [13] firstly established the ideal and improved valve structures and then calculated the dynamic characteristics of the two valve structures to study their structural response under horizontal and vertical excitation. Lan et al. [14,15] propose a simplified calculation model for the platform and converter valve to evaluate the impact of platform mass and stiffness on the dynamic response of the converter valve under wave and earthquake actions. Sun Z.-Z. et al. [16] conducted physical model testing to study the dynamic characteristics of a 10,000 ton offshore substation under seismic loads. Jing et al. [17] established a finite-element model of the 800 kV thyristor valve and its corresponding hall building to evaluate the seismic response of the valve. The above methods have obvious comparisons and real-time performance, but there are still some limitations, such as the fact that a large number of studies are based on suspended valve towers; it is necessary to consider the mass, stiffness, and dynamic characteristics of large valve hall structures, which, in turn, increases the amount of calculations and implementation difficulties; and the existence of coupled structures cannot accurately calculate the seismic response of the valve tower structure alone.
In order to independently analyze the dynamic characteristics and seismic performance of the valve tower, supporting a flexible DC converter valve model is a new idea. Huang et al. [18] performed seismic calculations for frame braced steel structures and analyzed the lateral deformation of the structure under seismic action and the internal force response of the frame as a function of excitation. Hu et al. [19] used damping devices to achieve vibration damping and seismic function of equipment operation for a new generation of flexible DC converter valves in the Zhangbei flexible DC transmission project. Wei Lv et al. [20] conducted a random vibration analysis of an offshore flexible DC converter valve. Zhu et al. [21] analyzed the seismic performance of the flexible straight converter valve by the reaction spectrum method and verified that the valve tower structure is safe and reliable under the seismic reaction spectrum with a seismic protection intensity of 8 degrees and a peak acceleration of 0.2 g. Lu et al. [22] took the valve tower of an extra-high voltage converter station as the research object, established a 1:3 scaling model based on the scaling theory, and carried out seismic table vibration tests. Enblom et al. [4] carried out extensive seismic numerical calculations and experimental studies on DC converter valve structures. Some researchers have performed a lot of work in the DC converter valve structure seismic design [3,23,24,25], but the specific valve body flexible seismic structure technology is not open, and there is no DC converter valve structure seismic numerical analysis and research work. In summary, the above studies have carried out a lot of shaker tests or response spectrum analysis on the supported converter valve structure under a single set of conditions, resulting in a monotonous response, lack of diversity, and insufficient comparison of the results. In order to improve the diversity and accuracy of the resultant responses, therefore, the vibration conditions are added, and the time-domain method of analysis is used to calculate the response of the structure under multiple seismic waves and multiple moments.
In response to the above issues, this paper takes the ±500 kV flexible DC supported converter valve as the research object and uses the finite-element analysis software ANSYS Workbench 19.2 to conduct modal analysis and time-domain analysis on the valve tower, providing reference for the structural optimization and seismic design of this type of a flexible DC converter valve.
2. Flexible DC Converter Valve
2.1. Valve Tower Structure
In this paper, the flexible DC supported converter valve is designed according to the converter valve used in the ±500 kV/3000 MW high-voltage DC power grid project. The structure is shown in Figure 1a. The valve base support height of the valve tower is 4300 mm, the valve top support height is 5800 mm, and the overall outline size of the valve tower is 8800 mm × 4000 mm × 11,900 mm. The whole valve tower adopts a supported structure, which is mainly composed of a pillar insulator, fixed base, bus bar, tray, valve assembly, and other components, while the valve assembly is composed of a large number of thyristors and heat dissipating pipes in series. The 3D model of the valve tower is shown in Figure 1b.
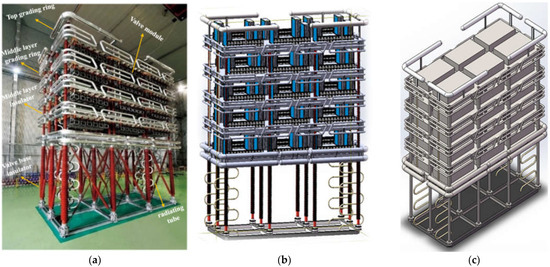
Figure 1.
Flexible DC converter valve structure. (a) True structure of valve tower. (b) Valve tower 3D model. (c) Simplified 3D model of converter valve.
The material properties applied in the 3D model of the valve tower are shown in Table 1. According to the requirements of “Technical Specification for Seismic Design and Installation and Maintenance of Shock Absorber for UHV Porcelain Insulated Electrical Equipment” (Q/GDW 1132-2013) [26], the allowable stress is calculated by dividing the damage stress of the material by 1.67, and the relationship between the two is shown in Figure 2.

Table 1.
Mechanical properties constant of structural material of valve tower.
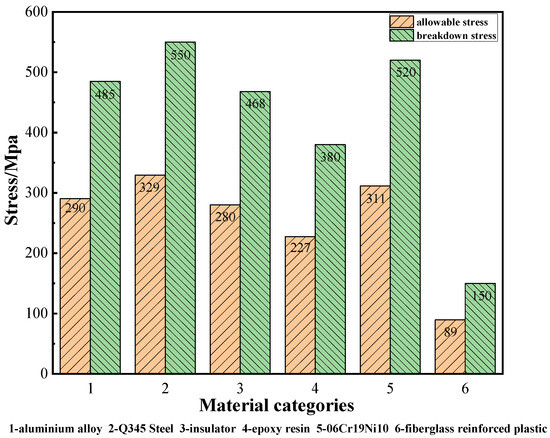
Figure 2.
Destructive and permissible stresses in materials.
2.2. Valve Tower Partial Details
Basic information of valve tower modeling: beam unit modeling is used for heat dissipation pipe, valve side sleeve, and pillar insulator; solid unit modeling is used for base frame and high-rise tray; shell unit modeling is used for pressure equalizing bus system; and some components of the valve tower are shown in Figure 3.
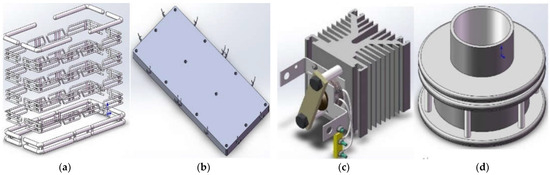
Figure 3.
Valve tower component model. (a) Busbar systems. (b) Load-bearing pallets. (c) Thyristor. (d) Fixed round base.
2.3. Model Simplification
In order to obtain more real and accurate simulation results, it is necessary to divide the model into grids. However, due to the complex composition of the original model, it is not conducive to direct operation, so the whole model is simplified. First, the whole is divided into two parts of the support frame and the carrier, then the support insulator with thread is simplified into a smooth cylinder, and finally the shell unit assembling the radiator and thyristor is simplified into a solid cuboid.
The 3D model of the valve tower after a simplification is shown in Figure 1c. Quadratic simplification will appear in the modal analysis. For the larger internal dimensions of the valve tower, the mesh was set slightly coarser (30 mm), and the mesh model was dissected using tetrahedral cells.
3. Modal Analysis
Modal analysis is a numerical technique for calculating structural vibration characteristics, and it is a common method for analyzing structural dynamic characteristics. Modal analysis is a prerequisite for seismic research; for example, response spectrum analysis, time-domain analysis, harmonic response analysis, etc. need to be carried out on the basis of modal analysis.
The software ANSYS Workbench was used to carry out a modal analysis of the structure of the supported valve tower and to solve for its first eight orders of self-oscillation frequencies and periods as shown in Table 2, and the characteristics of the vibration changes occurring in the valve tower are shown in Table 3. Further simplification of the valve tower model reveals that because of the obvious change in self-oscillation in the first 3 orders, Figure 4 only shows the first 3 orders of modal vibration of the tower after the second simplification, where the colored solid part is the tower after the change in vibration offset, and the light transparent shaded part is the valve tower before the vibration. Figure 5 shows the first 3 vibration modes of the valve tower for one-way observation, and the scale on the left of the figure is the displacement value of the valve tower vibration mode, which is only a measure of the relative value of the valve tower displacement, but not the real value of the valve tower displacement. In fact, the primary and secondary simplified model of the valve tower has little effect on the modal calculation and is only simplified to observe the modal change more clearly.
Table 2.
First 8 natural frequencies.
Table 3.
Valve tower vibration characteristics.
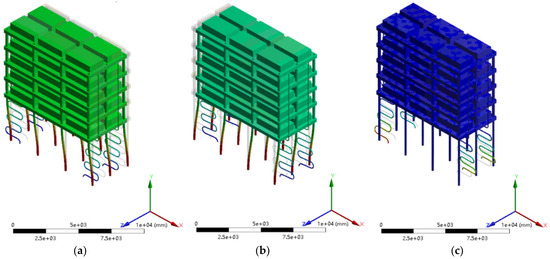
Figure 4.
Three-order vibration pattern before the valve tower. (a) First order. (b) Second order. (c) Third order.
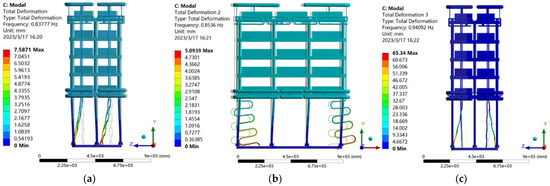
Figure 5.
One-way observation valve tower front three-order vibration pattern. (a) First order. (b) Second order. (c) Third order.
In summary, the valve tower is a bidirectional symmetrical structure, and most of the deformation occurs at the pillar insulator; moreover, the coupling between the pillar insulator and the penetrating vertical heat dissipation tube often slightly changes. The natural vibration frequency of the valve tower slightly increases with the increase in the order, and the fundamental frequency is close to 1 Hz. However, due to the existence of the upper level equalizing the ring bus structure, compared with the composite pillar insulator equipment, it has more obvious characteristics of high flexibility structure. Structures are more prone to resonance phenomenon under the action of seismic waves with abundant low-frequency components, which is easy to cause damage and collapse of structures, leading to further amplification of seismic response, and attention should be paid to seismic calculation.
4. Time-Domain Analysis
As a common method in seismic analysis of high-voltage electrical equipment, the time-domain analysis method is also often referred to as the “dynamic design” in seismic design. The basic equations of motion of the structure are input into the time-course acceleration for integral solution, and the acceleration, velocity, and displacement of the time-course wave over the entire time course and the internal stresses of the local components are calculated by the dynamic method, reflecting the influence of the characteristics, direction, and duration of the excitation. The results of the time-domain analysis method are superior to those of the reaction spectrum method in terms of accuracy and are, therefore, often used as a supplement to the results of the reaction spectrum method after the static analysis of the structure [27].
4.1. Seismic Wave Selection
Data conditions: seismic intensity 8; input peak acceleration 0.4 g horizontal seismic wave along the Z-direction; characteristic period of 0.35 s; using a standard damping ratio of 5% for the structure; and the maximum seismic impact factor αmax is 1. The input seismic excitation must be selected in strict accordance with the “Code for seismic design of electrical installations” (GB50260-2013) [28], with a minimum of three input seismic acceleration time curves. Because the total duration of a single seismic wave time curve is not less than 30 s and the strong shaking time is not less than 6 s, Wenchuan seismic waves (2008, N-S, 0–30 s data) and EI-Centro seismic waves (1940, N-S, 0–30 s data, referred to as “EI” in this paper) and the artificially synthesized seismic waves (2021, N-S, 0–30 s data) were used as the three excitation inputs of the time-domain analysis; the three seismic wave peaks were adjusted to 4.0 m/s2 at last. Figure 6a–c shows the acceleration time profiles of Wenchuan, EI-Centro, and synthetic seismic waves, respectively, while Figure 7 shows the acceleration frequency response spectra of the three seismic waves at nine frequency points. The characteristic parameters of ground motion are calculated according to the seismic wave time curve and seismic influence coefficient curve, as shown in Table 4.

Figure 6.
Acceleration time-course curve of seismic wave. (a) Wenchuan seismic wave. (b) EI-Centro seismic wave. (c) Synthetic seismic waves.
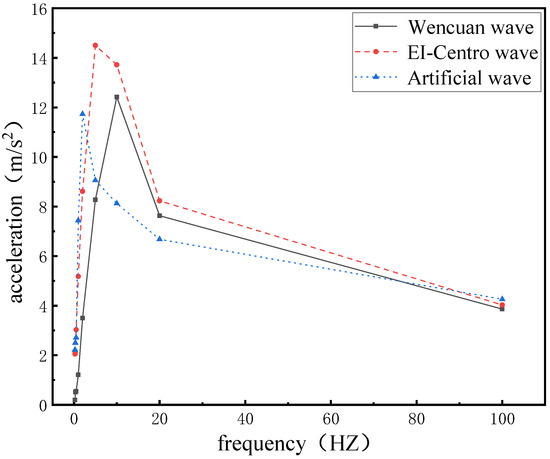
Figure 7.
Frequency response spectrum of seismic acceleration.
Table 4.
Earthquake parameters.
4.2. Seismic Displacement Response Analysis
A time-course analysis of the flexible DC converter valve focuses on whether the maximum stresses applied to the weak points of the supported structure can meet the safety strength criteria for structural design. These two sections focus on the temporal variation in displacements and stresses under three types of seismic wave excitation and the reliability of the seismic performance of the valve tower.
According to the principle of maximum selection of deformation, then the node connecting the valve base insulator and the second layer insulator is set as the observation point. Figure 8 shows the displacement timescale of this measurement point under the action of three kinds of earthquakes. Through comparative analysis, it is found that the maximum displacement values under the action of EI seismic waves at each moment are about 2–3 times higher than those under the action of Wenchuan and artificial waves, and the average displacement values are about twice as high as theirs, which indicates that the excursion of the valve tower under the action of the EI wave is large, and the subsequent stress analysis should focus on the stress response values under the action of the EI.
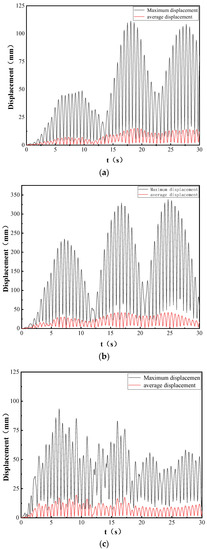
Figure 8.
Observe the node displacement time-course curve. (a) Wenchuan. (b) EI-Centro. (c) Artificial.
The data conditions indicate that the input excitation is a seismic wave along the z-direction. The maximum deformation area of the base body was selected for displacement observation. Calculated three waves of seismic action under the valve tower base along the XYZ direction displacement time course as shown in Figure 9 found that the valve tower base Z direction displacement is much larger than the XY direction displacement, followed by the valve tower base in the Z direction; EI action under the displacement is still Wenchuan and artificial action of 2–3 times. Then the results show that (1) the input along the Z direction of the horizontal seismic wave, that is, the Z direction, is the largest degree of vibration, in line with the actual earthquake impact law; and (2) as the valve tower is prone to low-frequency resonance phenomenon, resulting in the displacement value under the action of the lowest frequency, the EI wave in the three waves is much larger than the other waves.

Figure 9.
Time displacement of valve tower in XYZ direction under earthquake action. (a) X-direction. (b) Y-direction. (c) Z-direction.
4.3. Seismic Stress Response Analysis
This is an in-depth comparative analysis of the seismic stress response under the same site characteristics. In the following figures, (a), (b), and (c) show the seismic action of Wenchuan, EI, and artificial waves, respectively, while Figure 10, Figure 11 and Figure 12 show the stress time variation, maximum stress response, and maximum displacement response distribution of the valve tower in turn.
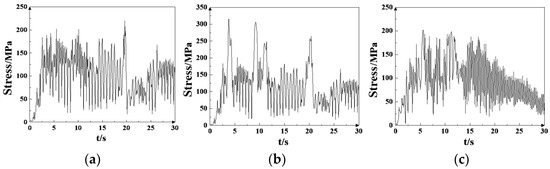
Figure 10.
The stress value of valve tower structure changes with time under earthquake. (a) Wenchuan. (b) EI-Centro. (c) Artificial.
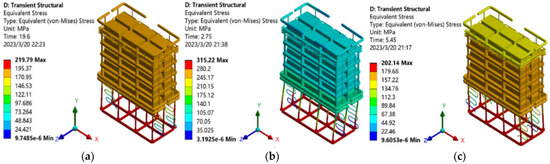
Figure 11.
Distribution of maximum stress values under three types of seismic wave excitation. (a) Wenchuan. (b) EI-Centro. (c) Artificial.
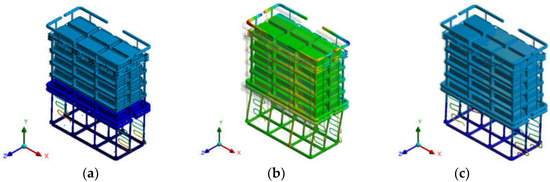
Figure 12.
The distribution of the maximum total displacement under the excitation of three seismic waves. (a) Wenchuan. (b) EI-Centro. (c) Artificial.
According to Figure 10 and Figure 11, the maximum stress on the bottom pillar insulator of the valve tower under Wenchuan wave excitation at 19.6 s is 219.79 MPa. The maximum stress on the bottom pillar insulator of the valve tower under EI seismic wave excitation at 2.75 s is 315.22 MPa. The maximum stress on the bottom pillar insulator of the valve tower under artificial wave excitation at 5.45 s is 202.14 MPa. Under different wave excitation, the maximum stress time and the maximum stress value of the valve tower are different, but they all occur at the bottom pillar insulator of the tower, indicating that, in practice, load-bearing pillar insulators are more affected by earthquakes and that the bottom pillar insulator of the structure should be mainly reinforced, i.e., the valve-based insulator.
According to the simulation results of the time analysis, it can be seen that the maximum stress value of 315.22 MPa occurring under the EI wave excitation is much larger than the maximum stress value under the Wenchuan and artificial wave effects. The reasons for this are as follows: from Table 4, it can be seen that the excellent frequencies of the three seismic waves are 3.88 Hz, 1.78 Hz, and 5.56 Hz, respectively, while the excellent frequencies are different; the possibility of resonance is also different. From Table 2, it can be seen that the valve tower fundamental frequency is close to 1 Hz, the excellent frequency of the EI wave is closer to the valve tower fundamental frequency of 1 Hz compared with the Wenchuan and artificial waves, and the EI wave is more likely to resonate with the valve tower, thus making the simulation results. The calculated stress value of the valve tower under the action of the EI wave is much larger than the calculated stress value of the Wenchuan and artificial waves.
The stress response and material composition of the main components of the valve tower under the action of the three seismic waves are shown in Table 5. The formula for calculating the safety factor with reference to the Code for Seismic Design of Electrical Installations is the ratio of the allowable stress to the calculated stress max, shown in formula (1). Under the action of seismic waves, except for the calculation of the insulator at the bottom of the valve tower, the calculated stress of other components is less than its allowable stress, and the calculated safety factor is more than 1, which meets the seismic design safety standard.
Table 5.
Maximum stress analysis of major components under seismic wave action.
In the actual simulation, the calculated stress of 315.2 MPa in the bottom pillar insulator of the valve tower under EI-Centro wave excitation is already greater than the allowable material stress of 230.7 MPa, and the permissible safety factor is 0.73, which is less than 1. Inelastic and irreversible deformation occurs at the bottom pillar insulator of the valve tower, Z-axis excursion of the valve tower as a whole, deformation causing damage to the valve tower, and tilting in the Z-negative direction, as shown in Figure 11b and Figure 12b. It indicates that when the valve tower is subjected to EI-Centro seismic waves, the column insulators at the bottom of the tower can be damaged and cause the whole tower to tilt and deform. It therefore does not fully meet the seismic design safety standard.
5. Simulation of Improved Design of Flexible DC Converter Valve
5.1. Improved Design Solutions
This involves the improved resistance of the bottom insulator to earthquakes of intensity 8 without changing the size of the original structure of the valve tower. Therefore, an attempt was made to replace the material of the bottom and inter-layer insulator from FRP to Q345 steel, the permissible stress of the insulator will be accordingly increased, and the safety factor will be increased to achieve the improvement.
5.2. Improved Design Simulation Results
First of all, after the improved design of the valve tower, i.e., the replacement of the material, as shown in Table 6, it can be seen from the stress response point of view that maximum stress values still occur at the bottom strut insulator, and the value is 280.3 MPa, but it is less than the improved allowable stress of 329.3 MPa, and the allowable safety factor increases to 1.174 and is greater than 1, which meets the seismic design requirements.
Table 6.
Stress response analysis of valve towers before and after improvement due to EI-Centro wave action.
As shown in Figure 13, it can be seen from the displacement response perspective that the overall total displacement of the valve tower structure is reduced from 338.3 mm before the improvement to 24.1 mm after the improvement, while the absolute values of deformation quantity in x, y, and z directions are reduced by 313.1 mm, 6 mm, and 12.6 mm, respectively, compared with the absolute values of deformation before the improvement, indicating that the overall valve tower structure does not experience any large deformation after the improvement. This indicates that the overall structure of the improved valve tower has no large displacements and inelastic deformation, and is less deformed and more stable than the original one.
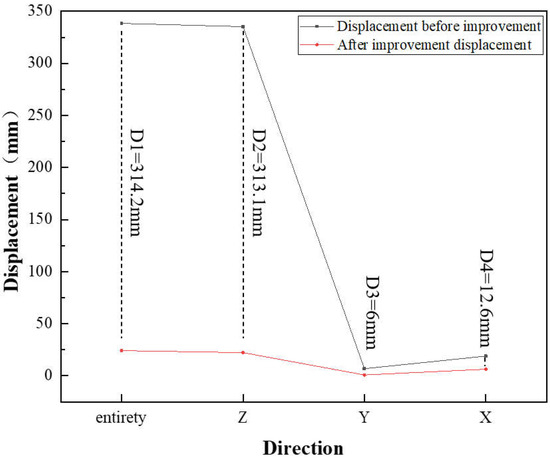
Figure 13.
Calculated displacement in each direction before and after valve tower improvement.
In summary, the overall seismic performance of the improved valve tower structure has been effectively improved under an earthquake of seismic intensity 8, and it can operate safely and normally, meeting the basic requirements and safety standards for seismic design.
6. Conclusions
This paper analyzes the seismic performance characteristics of the flexible DC converter valve following modal and time-domain analysis. The main conclusions are as follows:
- (1)
- The high flexibility of the valve tower structure, the dense frequency distribution, the vibration pattern mostly based on the vibration and torsion of the bottom insulator, and other characteristics indicate that the dynamic characteristics of the valve tower are complex and that the relative weak points under seismic action are at the bottom insulator and the inter-layer insulators.
- (2)
- The remarkable frequency of EI-Centro wave is closer to the fundamental frequency of the valve tower 1 Hz, which makes the tower susceptible to resonance phenomenon. Under the earthquake effect, the calculated results under the EI-Centro effect are both 2–3 times higher than those of Wenchuan and artificial, indicating that the self-oscillation frequency of the valve tower is concentrated low, and the low-frequency seismic wave has a greater impact on its structure.
- (3)
- The improved design has effectively improved the seismic performance of the valve tower, the stability of the Q345 steel structure is relatively good, and the replacement of key parts of the material is also one of the effective measures to improve the seismic performance.
Author Contributions
Conceptualization, C.D.; Software, J.L.; Resources, G.P.; Writing—original draft, Y.L.; Writing—review & editing, P.Z. All authors have read and agreed to the published version of the manuscript.
Funding
This research received no external funding.
Data Availability Statement
The data presented in this study are shown in the paper.
Conflicts of Interest
The authors declare no conflict of interest.
References
- Wang, X.B.; Ooi, T. High voltage direct current transmission system based on voltage source converters. In Proceedings of the 21st Annual IEEE Conference on Power Electronics Specialists, San Antonio, TX, USA, 11–14 June 1990; pp. 325–332. [Google Scholar]
- Yu, J.; Zeng, W.; Fan, J.; Li, H.; Chu, M. Research on Strengthening Structure of Converter Valve Tower in High Seismic Intensity Area. In Proceedings of the 2022 4th International Conference on Artificial Intelligence and Advanced Manufacturing, Hamburg, Germany, 7–9 October 2022; pp. 573–577. [Google Scholar]
- Kim, C.-K.; Jang, G. Development of Jeju–Haenam HVDC system model for dynamic performance study. Int. J. Electr. Power Energy Syst. 2006, 28, 570–580. [Google Scholar] [CrossRef]
- Enblom, R.; Coad, J.N.O.; Berggren, S. Design of HVDC converter station equipment subject to severe seismic performance requirements. IEEE Trans. Power Deliv. 1993, 8, 1766–1772. [Google Scholar] [CrossRef]
- Tang, G.F.; He, Z.Y.; Pang, H. Research, application and development of flexible direct current transmission engineering technology. Power Syst. Autom. 2013, 37, 3–14. [Google Scholar]
- Akulov, N.I.; Berzhinskii, Y.A.; Akulova, V.V. Grounds as a Factor of Seismic Safety for the Territory of the South of East Siberia Earthquake engineering. Constr. Saf. 2019, 1, 13–20. [Google Scholar]
- Xue, J.W.; Liu, W.Q.; Wang, S.G. Research on ground vibration characterization based on site effect. Earthq. Eng. Eng. Vib. 2013, 33, 16–23. [Google Scholar]
- Dong, D.; Yuan, M.X.; Wang, Z.J. Time-frequency characterization of ground vibration based on wavelet transform. J. Earthq. Eng. 2020, 42, 653–664. [Google Scholar]
- Zhang, B.Y.; Fang, S.S.; Fan, Z.H. Seismic calculation of high-voltage electrical equipment. China Electr. Power 2001, 34, 45–48. [Google Scholar]
- Li, X.L.; Huang, Y.; Hu, X.L. Measurement of structural dynamic characteristics of valve hall in converter station. South. Power Grid Technol. 2008, 2, 36–46. [Google Scholar]
- Maison, B.F.; Neuss, C.F.; Kasai, K.K. The comparative performance of seismic response spectrum combination rules in building analysis. Earthq. Eng. Struct. Dyn. 2010, 11, 623–647. [Google Scholar] [CrossRef]
- Zhang, L.; Hu, X.; Zeng, D.; Di, Q.; Lv, W. Study on the anti-seismic properties of the suspended converter valve and displacement restraint measure in high-intensity earthquake area. J. China Inst. Water Resour. Hydropower Res. 2017, 15, 382–388. [Google Scholar]
- Liu, A.G.; Lu, D.Z.; Wen, J.L.; Wen, F.Y. Research on seismic analysis technique of DC converter valve. Vib. Shock. 2011, 30, 226–232. [Google Scholar]
- Lan, D.G.; Li, J.; Qiang, X.; Chen, J. Influence of the offshore electrical platform on the dynamic responses of converter valve under sea waves and earthquakes. Ships Offshore Struct. 2022, 17, 2531–2544. [Google Scholar] [CrossRef]
- Sun, Z.; Zhao, S.; Bi, C.; Chen, Q.; Huang, S.; Chen, J. Dynamic Response Analysis of an Offshore Converter Platform with Valve Towers under Seismic Excitation. Symmetry 2022, 14, 1635. [Google Scholar] [CrossRef]
- Sun, Z.Z.; Bi, C.W.; Zhao, S.X.; Dong, G.H.; Yu, H.F. Experimental Analysis on Dynamic Responses of an Electrical Platform for an Offshore Wind Farm under Earthquake Load. J. Mar. Sci. Eng. 2019, 7, 279. [Google Scholar] [CrossRef]
- Jing, X.; Huang, M.D.; Sun, Q.G. An Artificial Seismic Wave Suitable for Suspended Converter Valve in the UHVDC Transmission Project. E3S Web Conf. 2019, 18, 02039. [Google Scholar]
- Huang, Y.; Wang, Y.Q.; Shi, Y.L. Finite element analysis of seismic performance of frame-braced steel structures. Sichuan Res. Build. Sci. 2005, 31, 140–143. [Google Scholar]
- Hu, W.H.; Zhou, B.L.; Gen, M. Research and application of installation technology of new generation flexible DC converter valve. Sci. Technol. Innov. 2020, 16, 183–184. [Google Scholar]
- Lv, W.; Mao, Z.Y.; Zhang, L.H. Random vibration analysis of an offshore flexible direct current converter valve. E3S Web Conf. 2021, 10, 252. [Google Scholar] [CrossRef]
- Zhu, X.H.; Zhang, C.; Xie, Y.L.; Xiao, J.; Mao, Z.Y.; Wang, Y. Research on seismic performance of flexible DC transmission converter valve. China Electr. 2014, 31, 19–22. [Google Scholar]
- Lu, X.; Cao, M.G.; Chen, X.D.; Xu, W.H.; Zhuo, R. Analysis of dynamic characteristics and seismic performance of high-end valve hall of extra-high voltage converter station. South. Power Grid Technol. 2019, 13, 43–50. [Google Scholar]
- Ekstrom, A.; Eklund, L. HVDC Thyristor Valve Development. IEEE Trans. Power Electron. 1987, 2, 177–185. [Google Scholar] [CrossRef]
- McBean, R.P.; Escalante, L.E.; Shively, A.W. Intermountain Power Project Seismic Criteria. J. Tech. Top. Civ. Eng. ASCE 1983, 109, 73–87. [Google Scholar] [CrossRef]
- Fallgren, R.B.; Jennings, P.C.; Smith, F.L.; Levy, S.W. A seismic Design Criteria for Electrical Facilities. J. Power Div. ASCE 1974, 100, 1. [Google Scholar] [CrossRef]
- Q/GDW 1132-2013; Code for Technical Specification for Seismic Design and Installation and Maintenance of Shock Absorber for UHV Porcelain Insulated Electrical Equipment. China Electric Power Press: Beijing, China, 2013.
- Wu, S.; He, Q.Z.; Yang, F.L.; Liu, X. Seismic characterization of all-welded ball valves based on time course analysis. Fluid Mach. 2020, 48, 18–23. [Google Scholar]
- GB 50260-2013; Seismic Design Code for Electric Power Facilities. China Electricity Council: Beijing, China, 2013; p. 28.
Disclaimer/Publisher’s Note: The statements, opinions and data contained in all publications are solely those of the individual author(s) and contributor(s) and not of MDPI and/or the editor(s). MDPI and/or the editor(s) disclaim responsibility for any injury to people or property resulting from any ideas, methods, instructions or products referred to in the content. |
© 2023 by the authors. Licensee MDPI, Basel, Switzerland. This article is an open access article distributed under the terms and conditions of the Creative Commons Attribution (CC BY) license (https://creativecommons.org/licenses/by/4.0/).