

Comparative Techno-Economic Evaluation of a Standalone Solar Power System for Scaled Implementation in Off-Grid Areas


Abstract
:1. Introduction
- Several significant cost-contributing parameters were either overlooked or arbitrarily selected. For example, Niaz et al. (2022) [21] examined the LCOE considering CAPEX and OPEX over ten years but did not include factors such as power generation scale, salvage value, degradation rate, loss factors, or replacement cost. Similarly, Nadaleti et al. (2020) [22] only considered CAPEX and OPEX. Yates et al. (2020) [23] calculated LCOE using a range of CAPEX and OPEX costs but did not address the impact of economies of scale. Ahshan et al. (2022) [24] investigated the LCOE of wind power, primarily focusing on CAPEX and OPEX. Shehabi et al. (2022) [25] used income tax rate, CAPEX, OPEX, balance of system (BOS) cost, equity, and replacement cost to determine LCOE but did not consider salvage value or the impact of economies of scale.
- The lack of a standardized approach for accounting CAPEX is noted. The direct CAPEX should encompass the costs of PV modules, current balancing devices, installation expenses, and contingency costs when calculating the net present value (NPV). However, it is taken generically, considering CAPEX as the cost/unit-power while excluding the other three cost variables, e.g., by Assowe et al. [26], Alessandro et al. [27], Jang et al. [28], and Burdack et al. [29].
- Furthermore, in the USA as of 2021, out of a total of 1125 proposed photovoltaic (PV) projects, 90% were based on single-axis tracking systems as opposed to fixed tilt systems, and mono-crystalline silicon (mono-c-Si) modules accounted for 69% of installations compared to thin-film modules [30]. Additionally, policy measures in the USA, such as extending the exemption from the 15% import duty through 2026, have encouraged the installation of bi-facial modules. This divergence in plant setup and module specifications in large-scale deployment highlights the need for research to understand how these factors impact energy output and cost.

| Study (Year Published, Ref.) | 2022, [21] | 2022, [24] | 2022, [25] | 2020, [22] | 2020, [31] | 2020, [23] | 2016, [32] | 2015, [33] |
|---|---|---|---|---|---|---|---|---|
| System lifetime | √ | √ | √ | √ | √ | √ | √ | × |
| Degradation rate | × | √ | × | × | × | × | × | × |
| Technical loss factor | × | × | × | × | √ | × | × | × |
| Carbon trading price | × | √ | × | × | × | × | × | × |
| Residual value | × | × | × | × | × | × | × | × |
| CAPEX | √ | √ | √ | √ | √ | √ | √ | √ |
| OPEX | √ | √ | √ | √ | √ | √ | √ | √ |
| Discount rate | × | × | × | √ | × | √ | √ | × |
| Inflation rate | × | × | × | × | × | × | √ | × |
| BOS and installation cost | × | × | × | × | × | × | × | × |
| Foundation (land preparation) | × | × | × | × | × | × | × | × |
| Engineering and developer overhead | × | × | × | × | × | × | × | × |
| Contingency | × | × | × | × | × | × | × | × |
- Development of a robust framework for scaled solar PV plants that incorporates all relevant technological, financial, and benefit considerations. This approach enabled the accurate determination of techno-economic metrics, allowing for a fair comparison with fossil fuel-based power generation.
- Incorporate the essential macro- and micro-cost and technical parameters (Table 2) that are integral to the analysis and that must be considered when developing a techno-economic analysis model. Neglecting any of these parameters can lead to underestimation or overestimation of techno-economic metrics, rendering them unreliable. While certain parameters may have specific ranges, completely excluding them may result in misleading conclusions.
- Evaluation of economies of scale impact on techno-economic metrics of a scaled renewable power plant.
- By examining these factors, the primary objective of the study is to generate valuable insights into the feasibility and viability of implementing scaled solar power plants in the region.
2. Methods and Materials
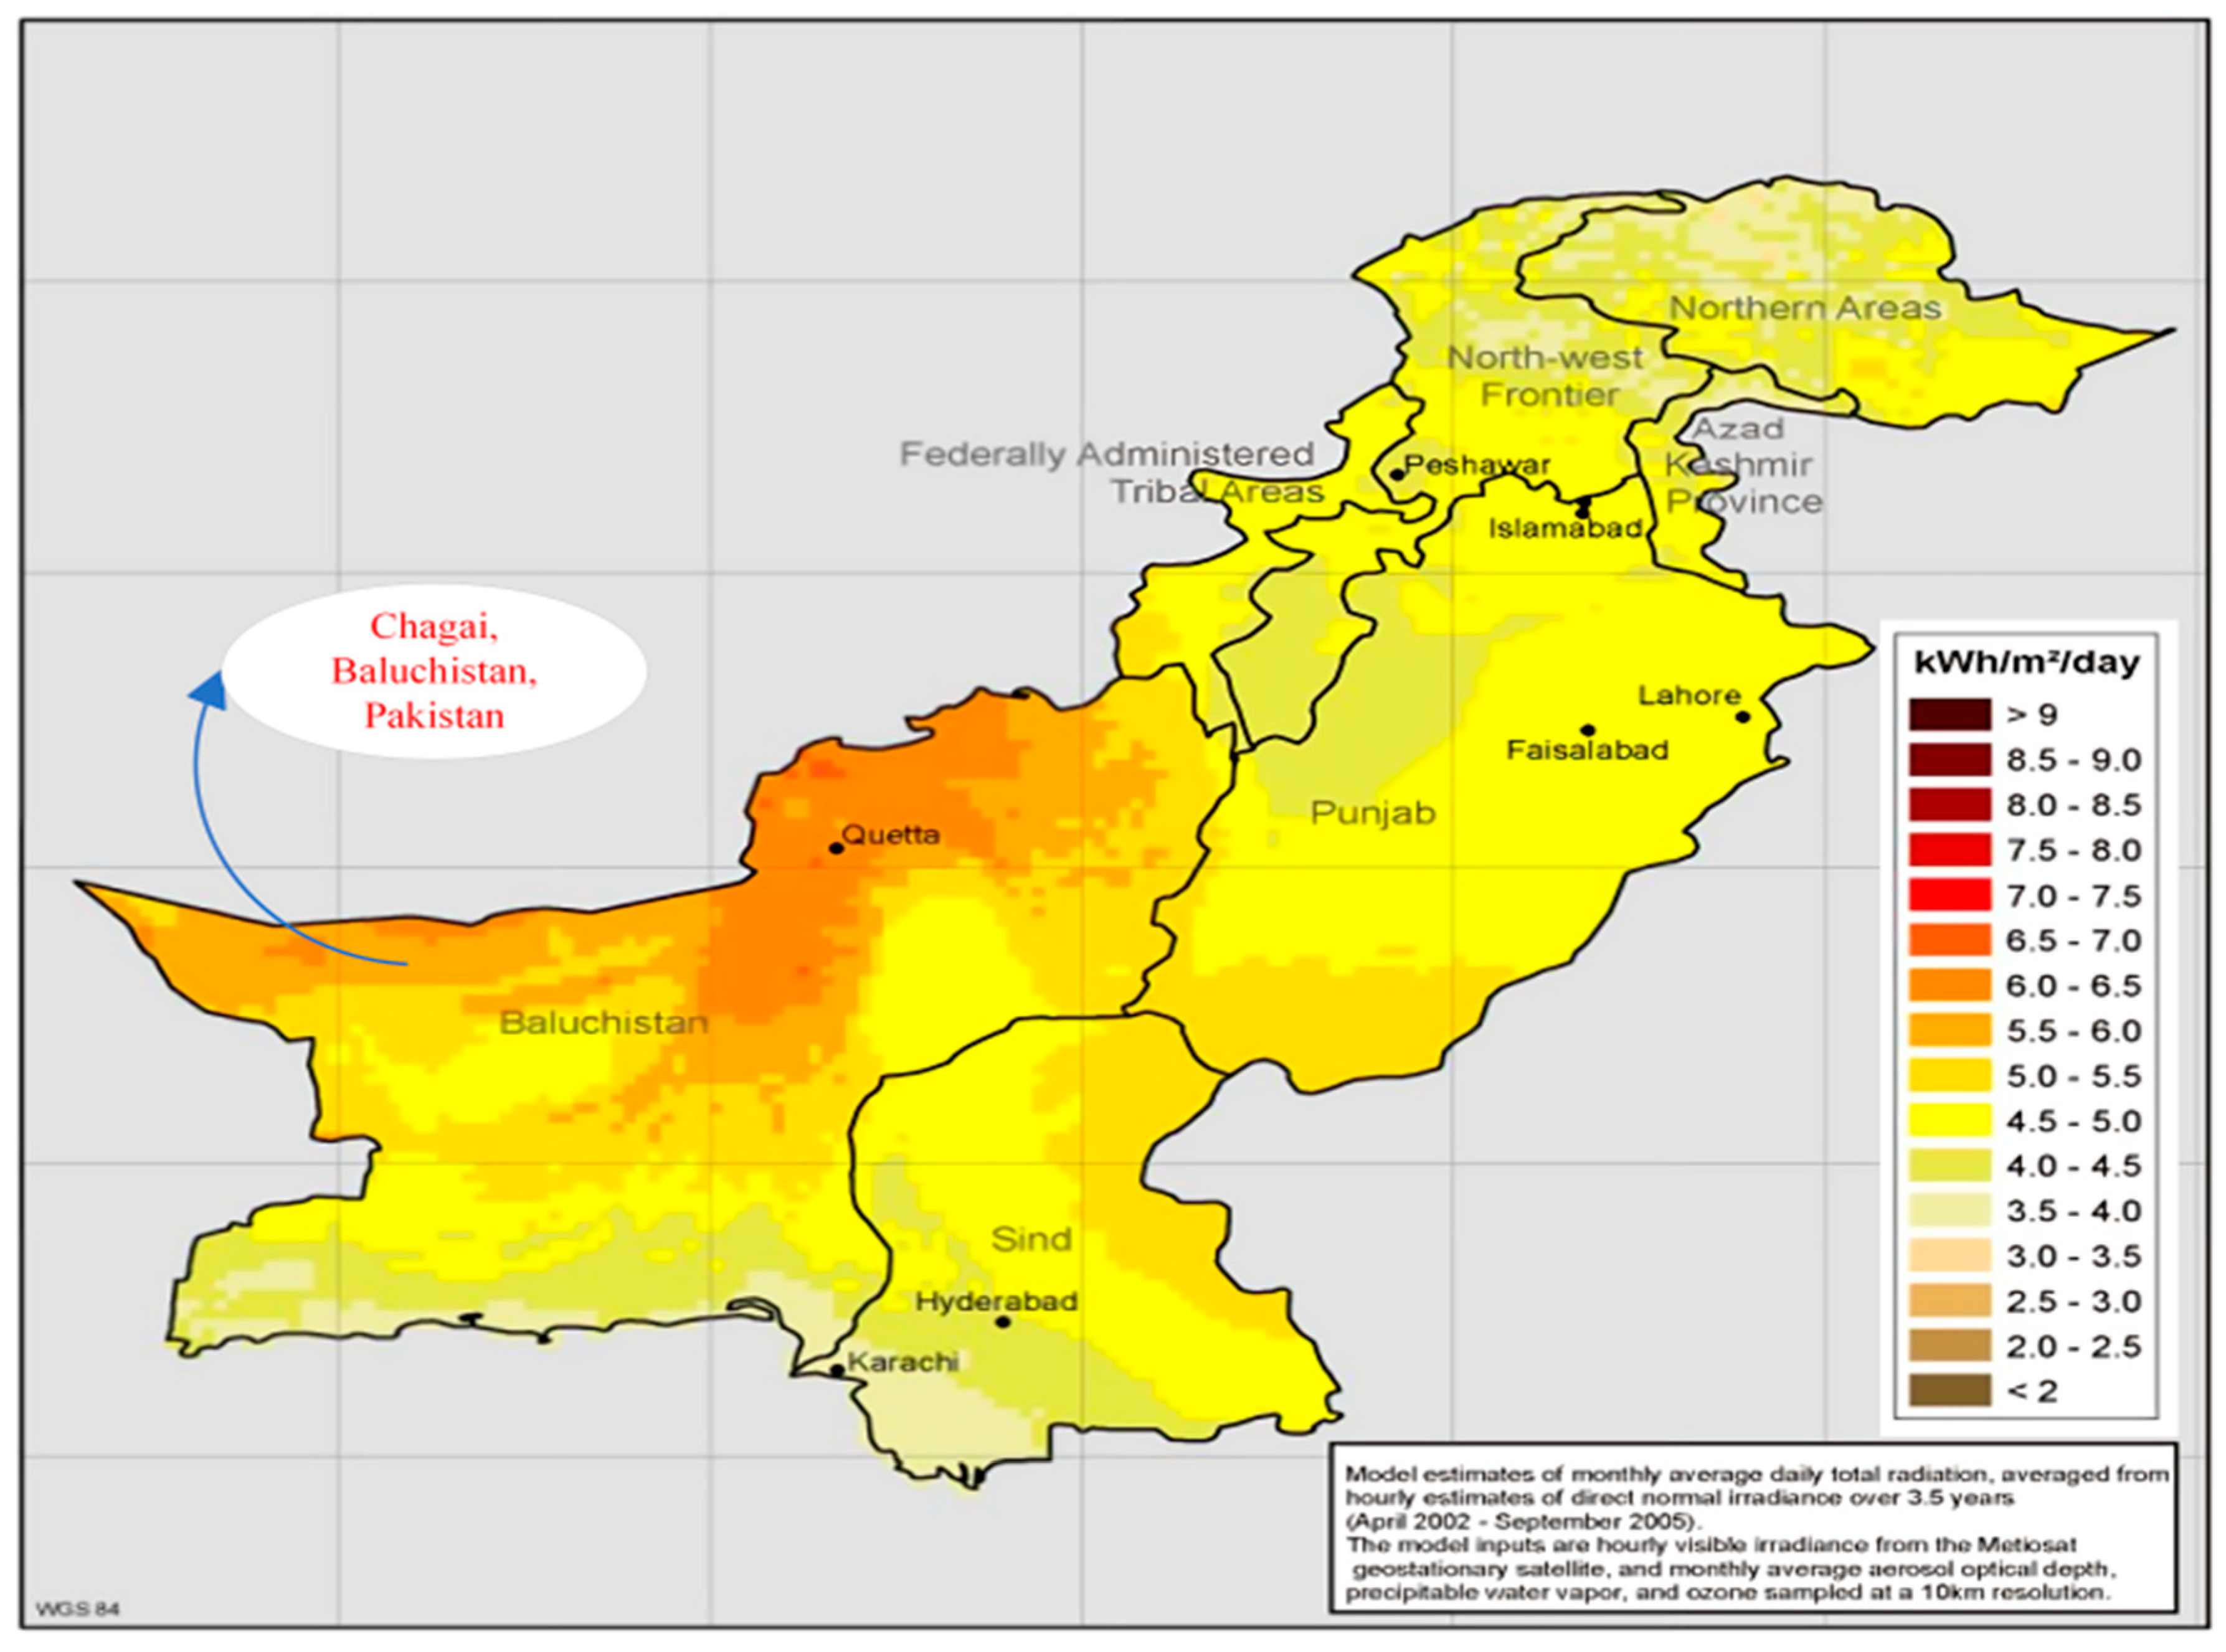
2.1. Geographical Location
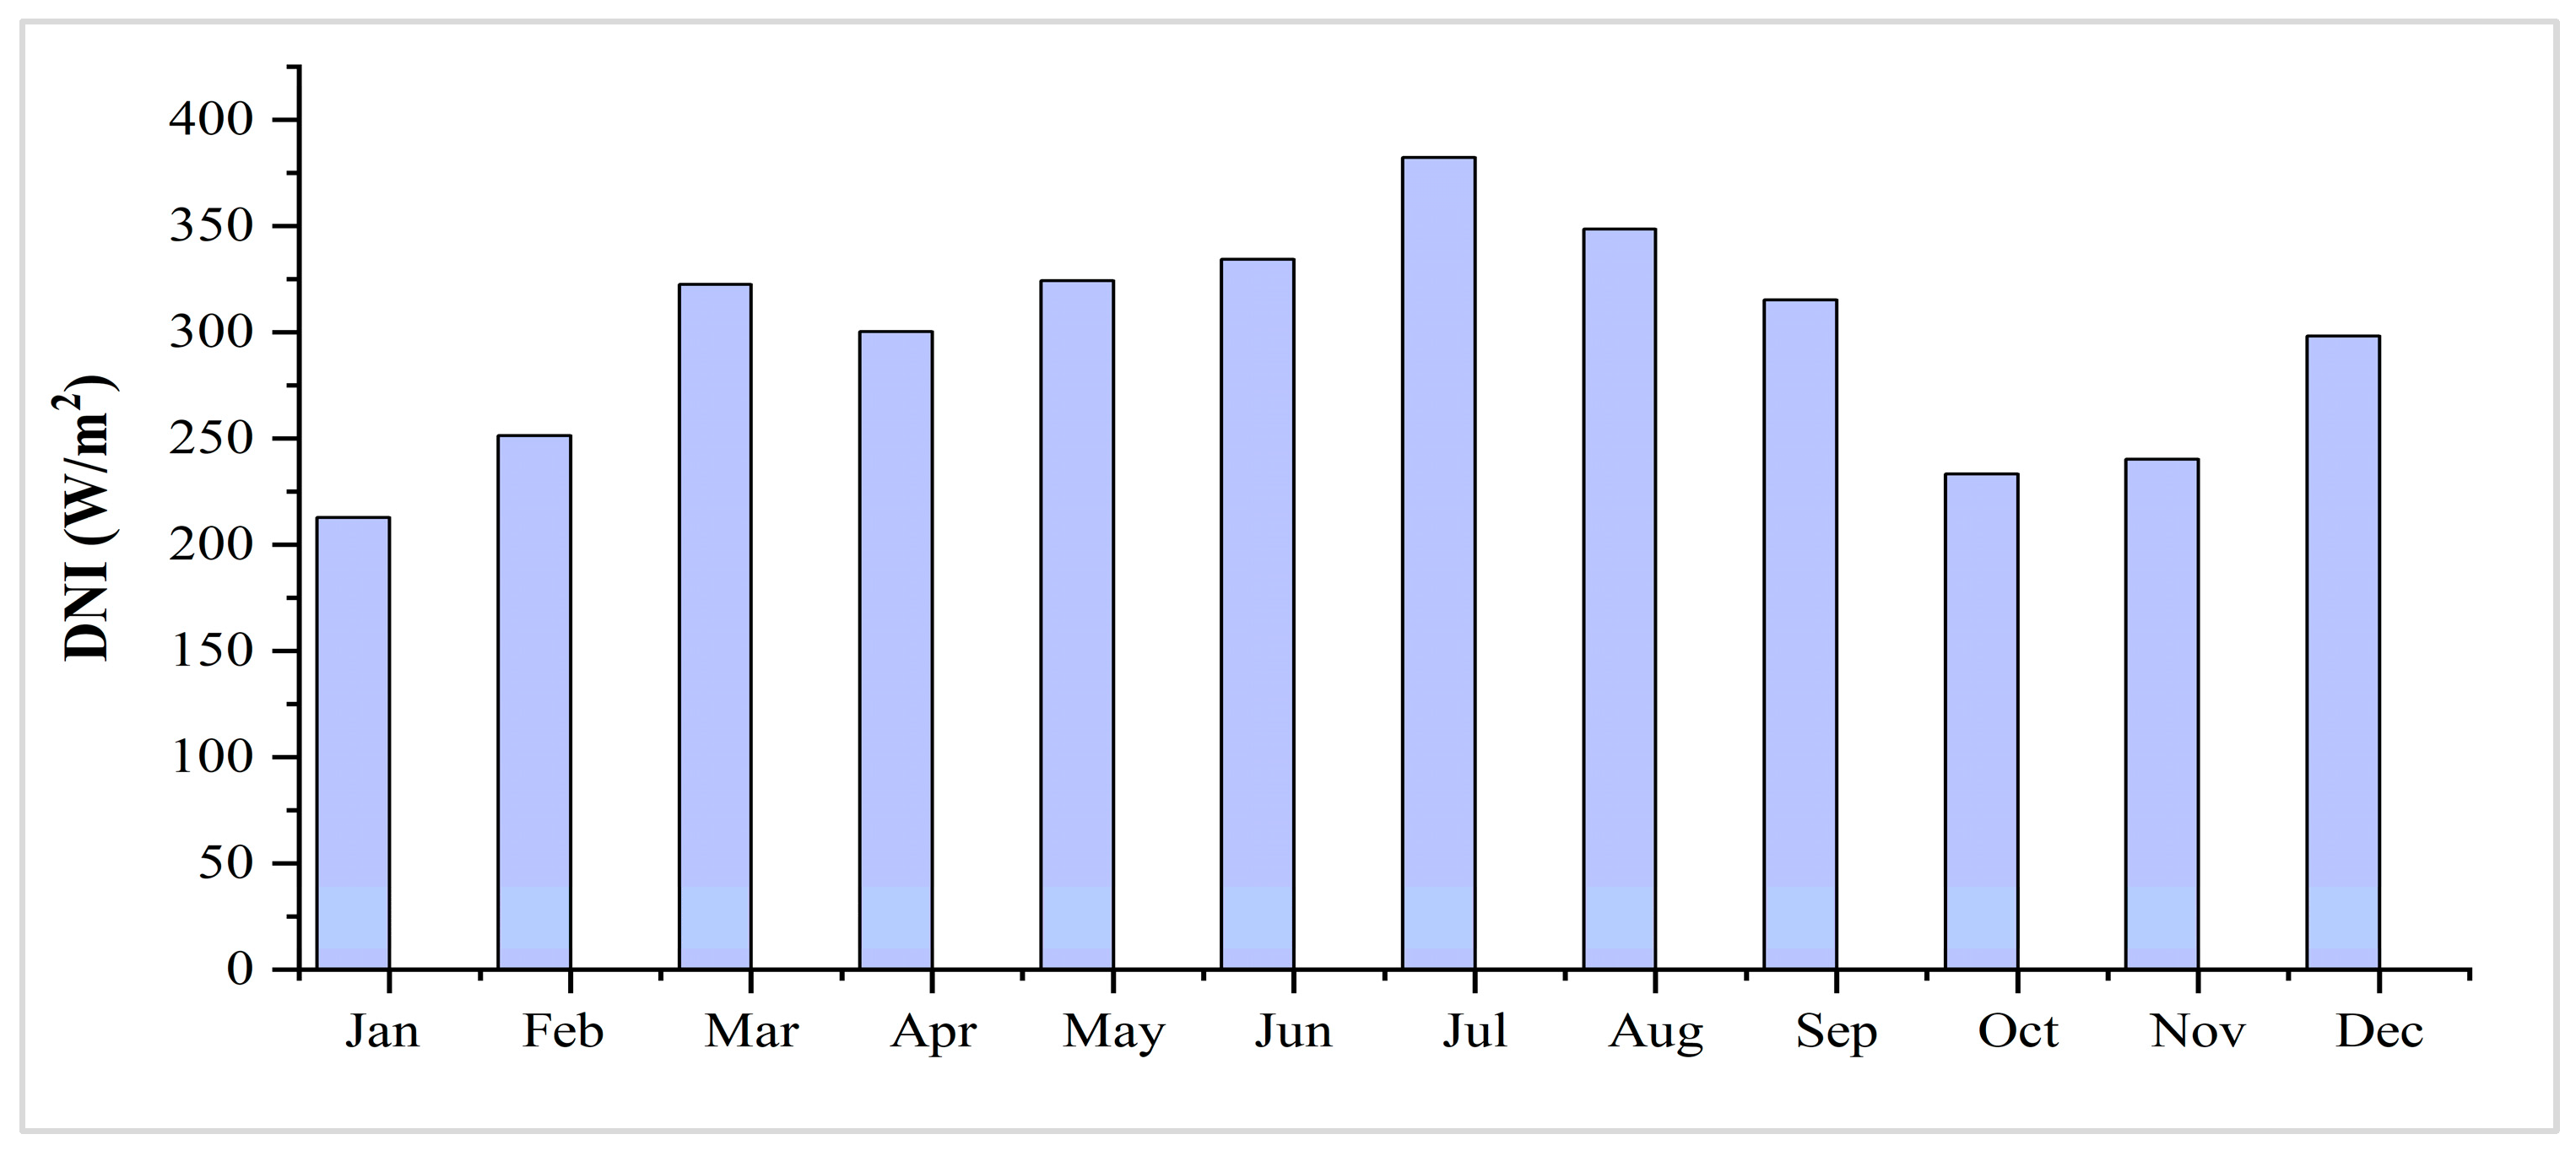
2.2. Metrological Data
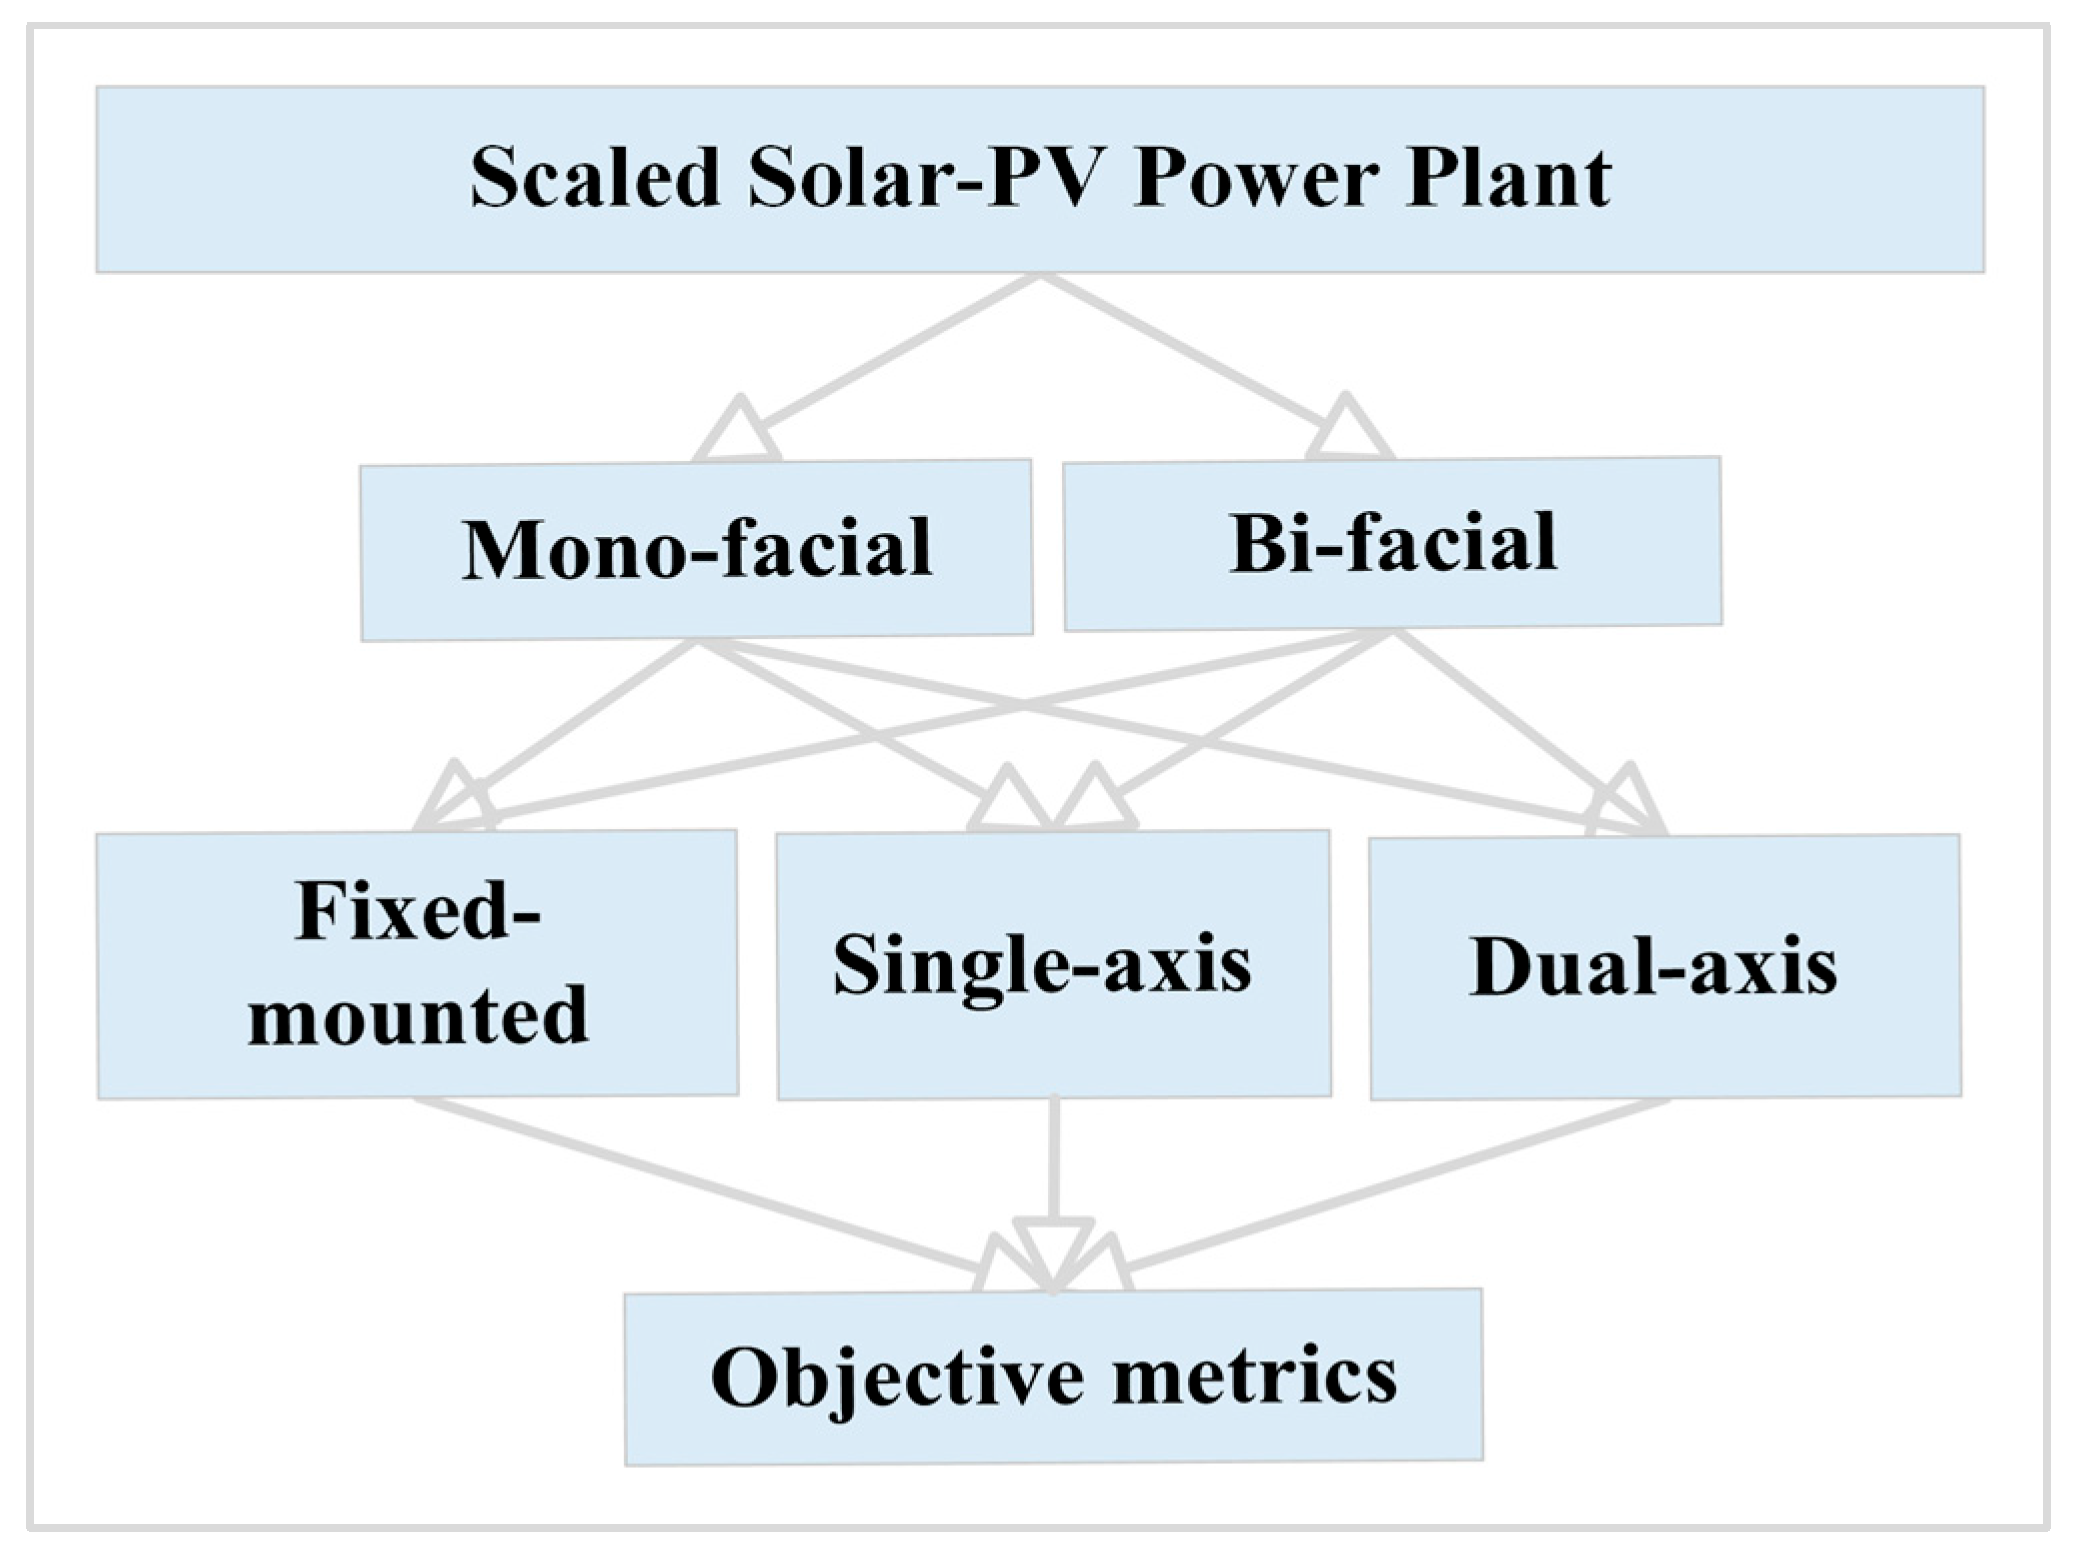
2.3. Power Generation Pathways
2.4. Simulation Algorithm
| Parameters | Unit | Value | Reference |
|---|---|---|---|
| Installer margin and overhead | USD/Wdc | 0.05 | [49] |
| WACC | % | 6 | Typical value |
| Installation cost | USD/Wdc | 0.11 | [49] |
| BOP (mechanical) | USD/Wdc | 0.10 | [50] |
| BOP (electrical) | USD/Wdc | 0.09 | [50] |
| Sun-tracker (single-axis) | USD/Wdc | 0.1 | [30] |
| Sun-tracker (dual-axis) | USD/Wdc | 0.15 | [30] |
| Engineering and developer overhead | USD/Wdc | 0.08 | [49] |
| PII | USD/Wdc | 0.04 | [50] |
| Contingency | % CAPEX | 2 | Typical value |
| Fixed-mounted OPEX | USD/kWdc/y | 13 | [51] |
| Single-axis OPEX | USD/kWdc/y | 14 | [52] |
| Dual-axis OPEX | USD/kWdc/y | 16.26 | [52] |
| Depreciation | %/y | MACRS Standards (Industries) | [53] |
| DC/DC power optimizer | USD/Wdc | 0.15 | [54] |
| PV Module Performance degradation | %/y | 0.5 | [50] |
| Residual value | % CAPEX | 20 | Typical value |
| Inflation | % | 2.6 | [55] |
- CAPEX is the capital expenditure (USD)
- Co&m is the operation and maintenance cost (USD)
- rdeg is the degradation rate (%)
- n is the plant’s lifetime
- Rvalue is the residual value (USD)
- En is the electricity generated
- Cins is the installation cost (power plant) (USD)
- Crep is the replacement cost (USD)
- Ii is the Year “i”
- kW is the Kilowatt
- n is the plant’s lifetime
- USD is the dollar (United States)
- rdep is the depreciation rate (%)
- rtax is the federal capital tax on investment
2.5. Assumptions and Exclusions
- The economic model focused on cost analysis without an energy storage system.
- Power transmission and distribution costs were not taken into account.
- The cost of land acquisition or lease was not included and was assumed to be covered by the public development budget.
- Incentives for investment, green power generation, or capacity build-up are not accounted for in the NPV.
3. Results and Discussion
4. Conclusions and Policy Recommendations
- The active involvement of the private sector is crucial in fostering a resilient renewable energy value chain, especially in regions with limited existing energy infrastructure. It would be helpful to mobilize financial resources from non-budgetary sources and to provide the technical and managerial expertise required for building scaled solar PV plants in off-grid areas.
- The formulation of specialized policies and regulatory frameworks related to solar power generation is required. These initiatives are essential to attract and facilitate investors and to overcome the challenges associated with the renewable energy value chain.
- The BOS cost is the major contributing factor in the LCOE; therefore, solar PV module manufacturers should focus on improving module density within a string to reduce expenses for accessories such as electric cables and racks. Additionally, the production of large-sized and high-power solar PV modules is recommended to decrease the construction time and lower the overall cost of the system.
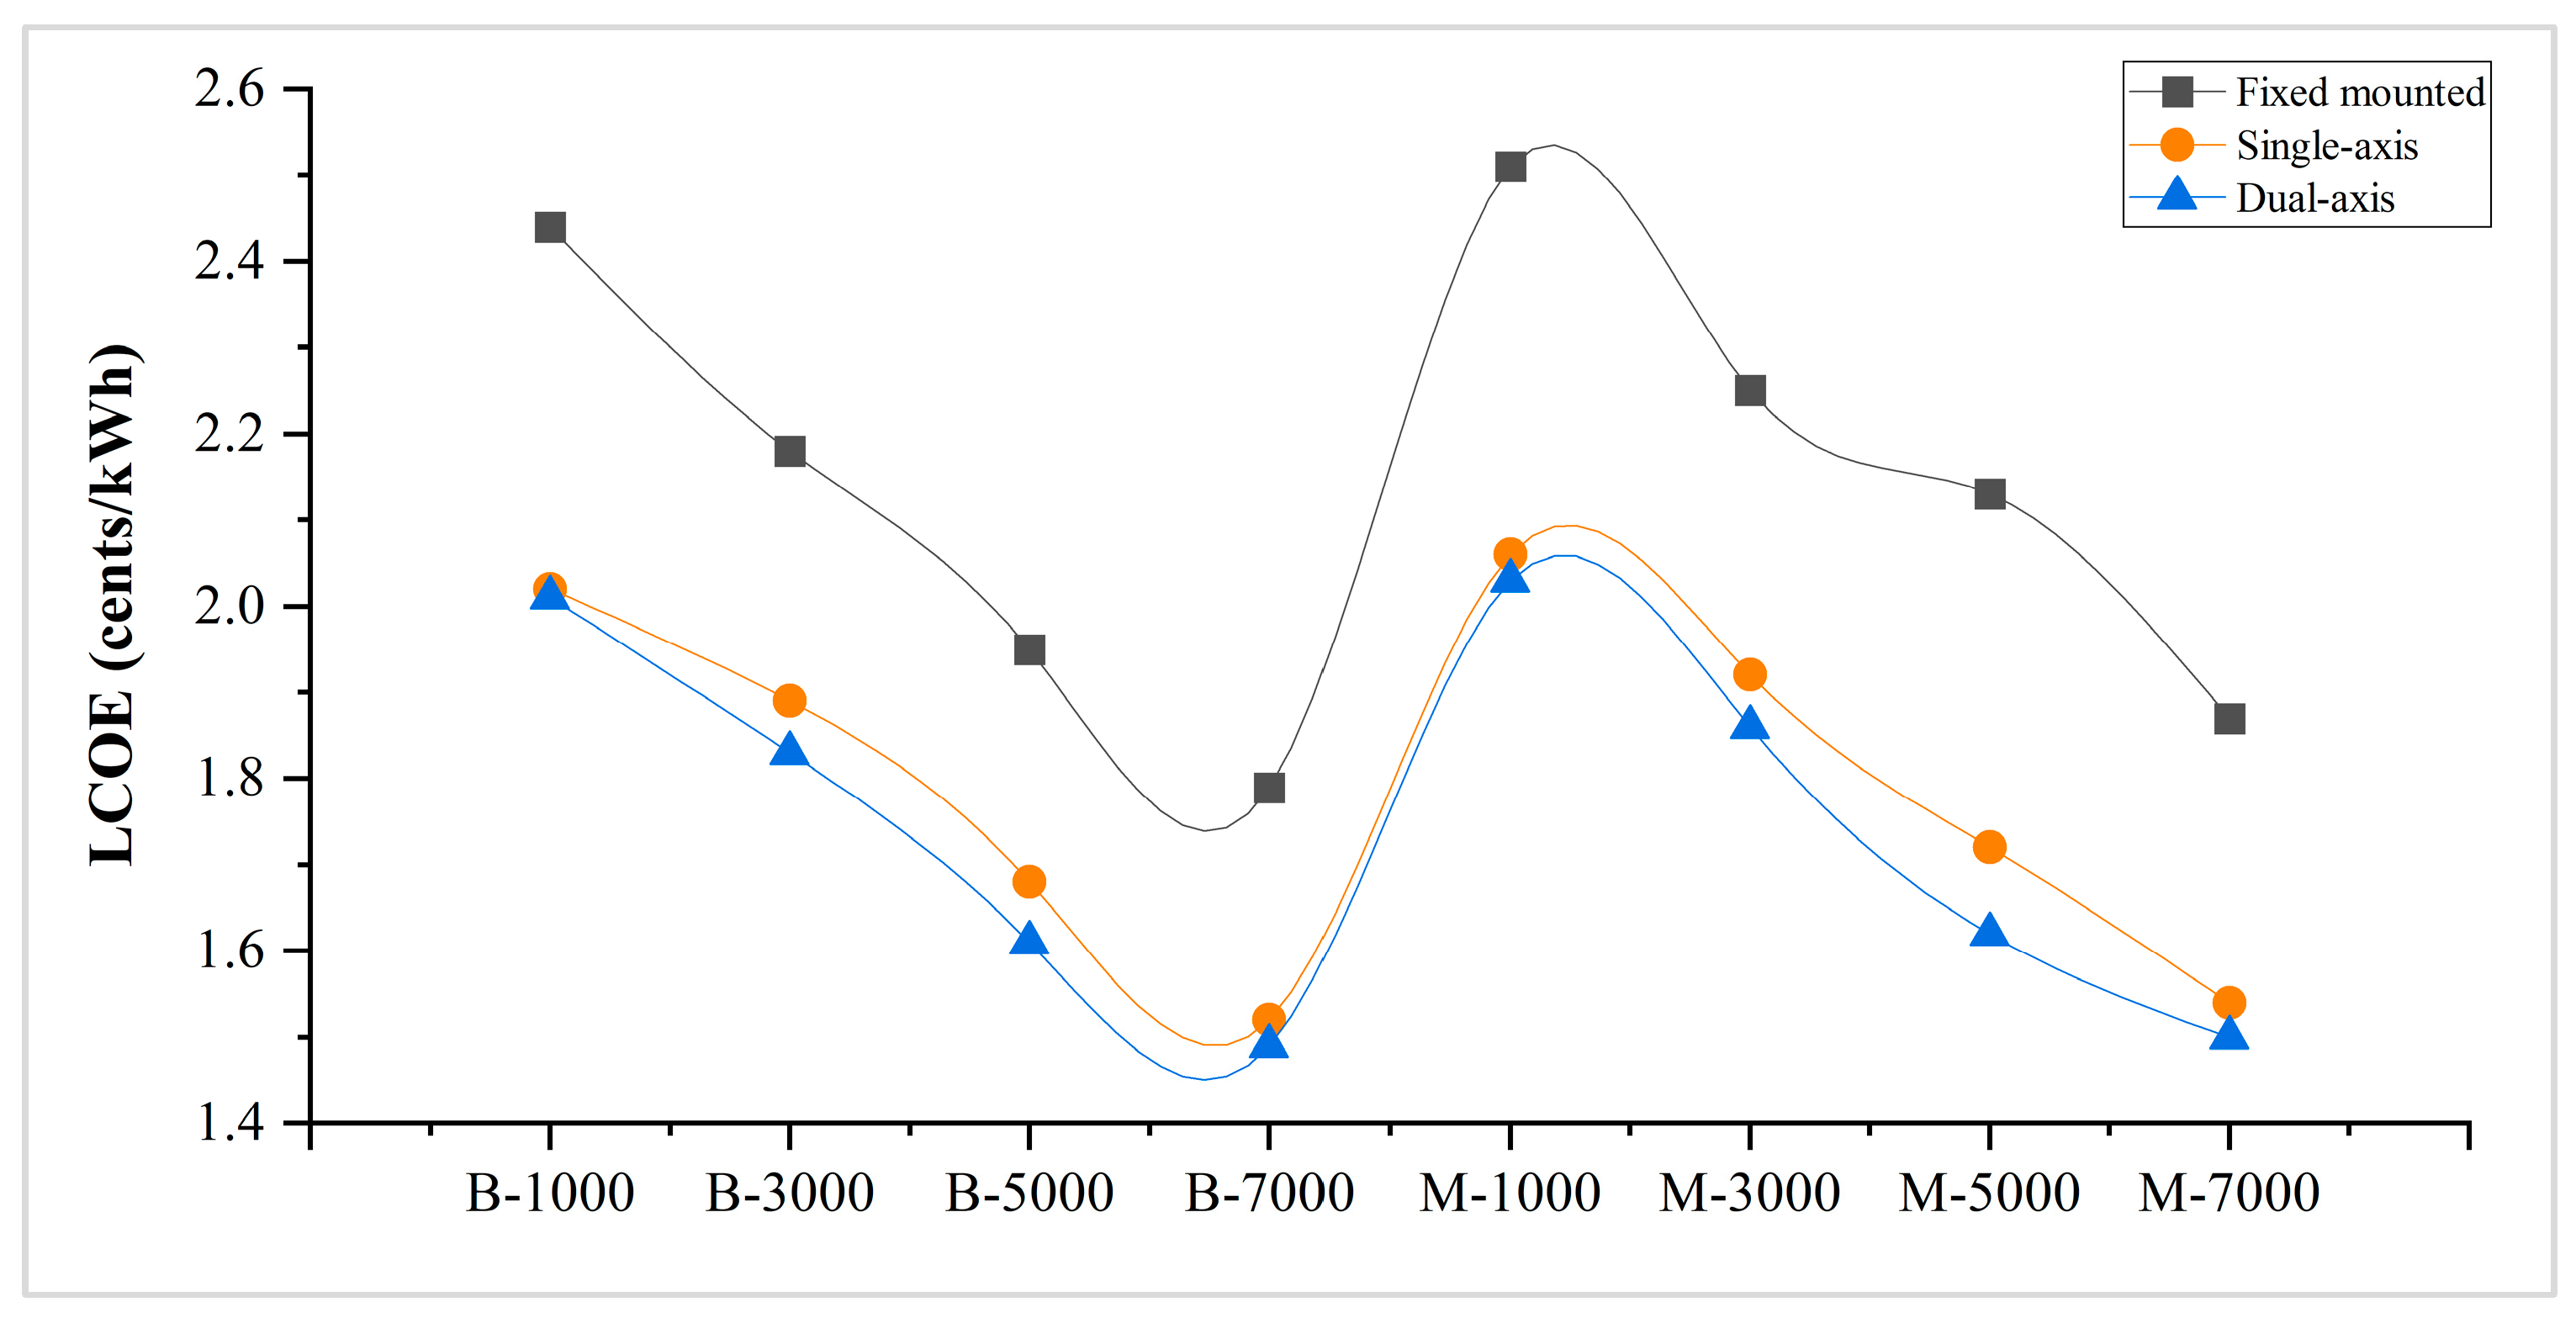
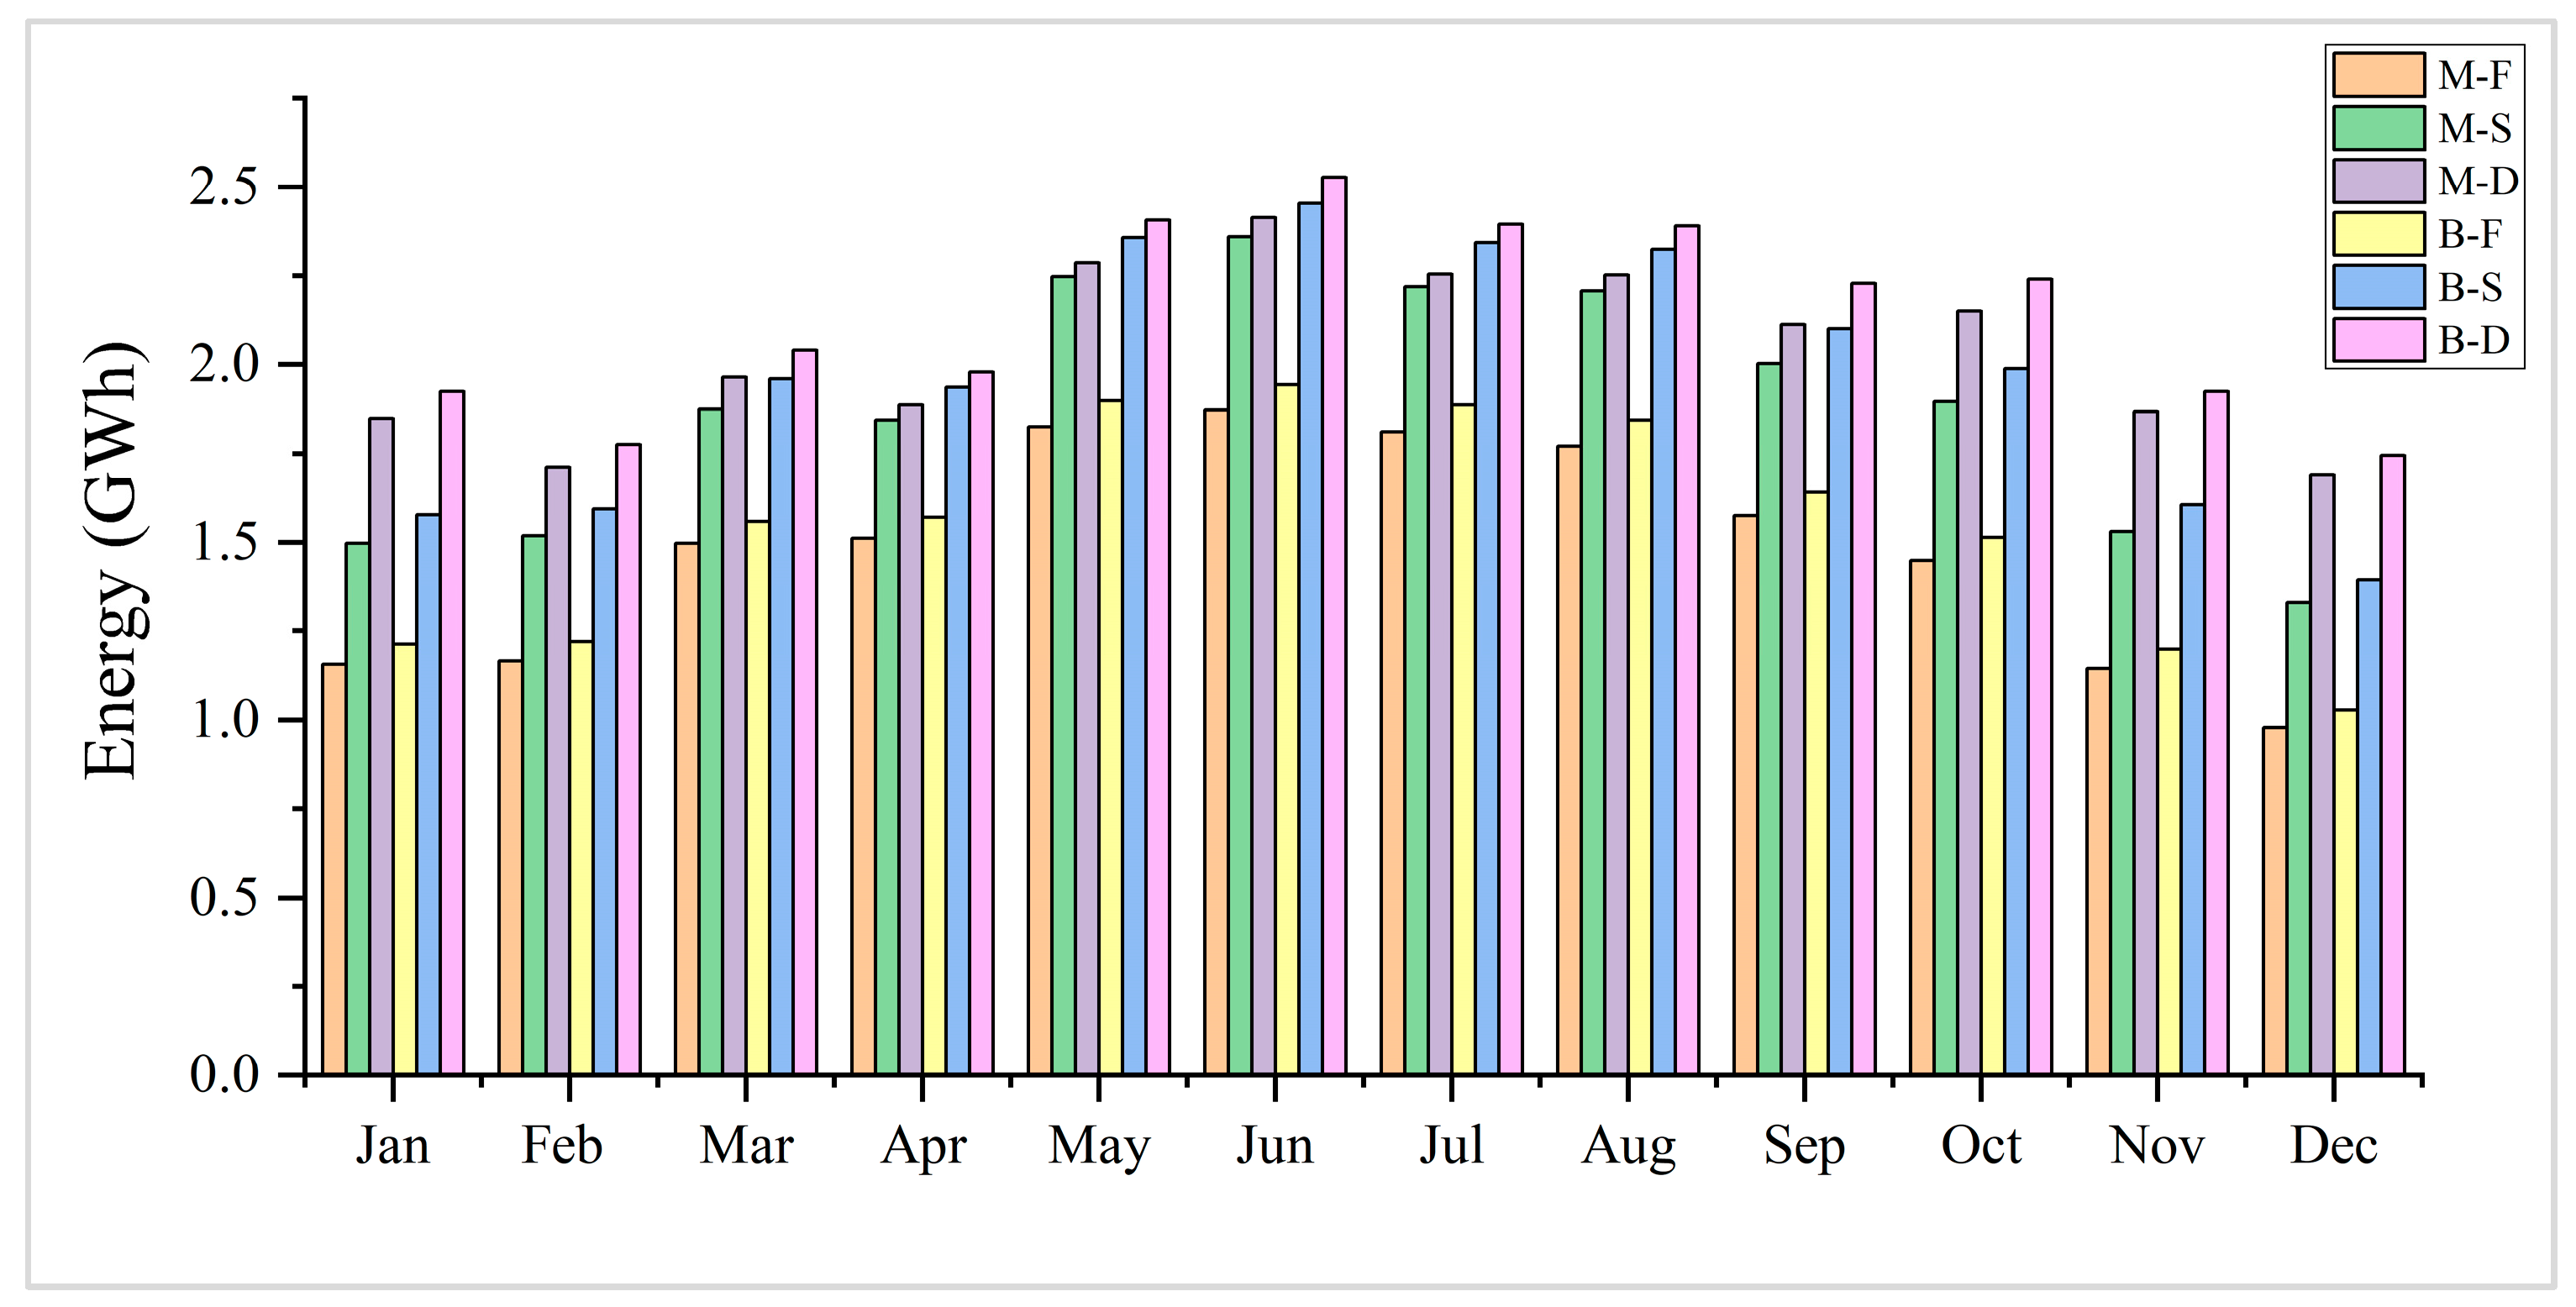
- Although the LCOE using bi-facial modules is ~7–10% lower, a careful comparison of sun-tracker costs is necessary before deciding. A dual-axis tracking system generates around 19.87% more power than a fixed-mounted system, but it comes with a net installed cost difference of ~15.45%. Therefore, when dealing with limited space, a cost-benefit analysis of installing sun trackers and types of modules is critical.
Author Contributions
Funding
Institutional Review Board Statement
Informed Consent Statement
Data Availability Statement
Conflicts of Interest
Abbreviations
| BOS | Balance of system |
| CCUS | Carbon capture utilization and storage |
| CAPEX | Capital expenditures |
| CF | Capacity factor |
| DNI | Direct normal irradiance |
| FCEV | Fuel cell electric vehicle |
| GHG | Greenhouse gas |
| GHI | Global horizontal irradiance |
| IPCC | Intergovernmental Panel on climate change |
| IRENA | International renewable energy agency |
| LCOE | Levelized cost of energy |
| LCC | Life cycle cost |
| MOE | Ministry of Energy United States of America |
| MOU | Memorandum of understanding |
| MT | Million tones |
| NPV | Net present value |
| NREL | National Renewable Energy Laboratory |
| OPEX | Operational expenditures |
| PV | Photovoltaic |
| PPA | Power purchase agreement |
| R&D | Research and development |
| RES | Renewable energy systems |
| SAM | System Advisor Model |
| TWh | Terawatt hours |
| USD | United States dollar |
| WACC | Weighted average cost of capital |
References
- Levenda, A.M.; Behrsin, I.; Disano, F. Renewable energy for whom? A global systematic review of the environmental justice implications of renewable energy technologies. Energy Res. Soc. Sci. 2016, 71, 101837. [Google Scholar] [CrossRef]
- Zebra, E.I.C.; van der Windt, H.J.; Nhumaio, G.; Faaij, A.P. A review of hybrid renewable energy systems in mini-grids for off-grid electrification in developing countries. Renew. Sustain. Energy Rev. 2021, 144, 111036. [Google Scholar] [CrossRef]
- Ali, A.; Imtiaz, M. Effects of Pakistan’s energy crisis on farm households. Util. Policy 2019, 59, 100930. [Google Scholar] [CrossRef]
- World Bank. Poverty & Equity Brief South Asia Pakistan. Available online: https://databankfiles.worldbank.org/public/ddpext_download/poverty/987B9C90-CB9F-4D93-AE8C-750588BF00QA/current/Global_POVEQ_PAK.pdf (accessed on 1 June 2023).
- THE NATION. Available online: https://www.nation.com.pk/05-Aug-2022/pakistan-s-electricity-shortfall-jumps-to-7-641mw (accessed on 13 August 2023).
- Valasai, G.D.; Uqaili, M.A.; Memon, H.R.; Samoo, S.R.; Mirjat, N.H.; Harijan, K. Overcoming electricity crisis in Pakistan: A review of sustainable electricity options. Renew. Sustain. Energy Rev. 2017, 72, 734–745. [Google Scholar] [CrossRef]
- Kumar, V.; Ali, B.S.; Choudry, E.; Khan, S.; Baig, K.; Durrani, N.U.R.; Durrani, N.U.R., Sr. Quality of Neonatal Care: A Health Facility Assessment in Balochistan Province, Pakistan. Cureus 2022, 14, e22744. [Google Scholar] [CrossRef] [PubMed]
- International the News. Available online: https://www.thenews.com.pk/magazine/instep-today/164605-Powerless-Balochistan/ (accessed on 31 May 2023).
- Japan International Corporation Agency. Available online: https://www.jica.go.jp/pakistan/english/activities/activity02_11.html (accessed on 29 May 2023).
- Khan, T.; Waseem, M.; Tahir, M.; Liu, S.; Yu, M. Autonomous hydrogen-based solar-powered energy system for rural electrification in Balochistan, Pakistan: An energy-economic feasibility analysis. Energy Convers. Manag. 2022, 271, 116284. [Google Scholar] [CrossRef]
- Solargis, Solar Resource and Photovoltaic Power Potential of Pakistan: Analysis Based on Validated Model with Reduced Uncertainty. Available online: https://pubdocs.worldbank.org/en/175561587077010849/Solargis-Solar-Resource-Report-Pakistan-WBG-ESMAP.pdf (accessed on 29 May 2023).
- Tareen, W.U.K.; Dilbar, M.T.; Farhan, M.; Ali Nawaz, M.; Durrani, A.W.; Memon, K.A.; Aamir, M. Present status and potential of biomass energy in pakistan based on existing and future renewable resources. Sustainability 2020, 12, 249. [Google Scholar] [CrossRef]
- Raza, M.A.; Khatri, K.L.; Israr, A.; Haque, M.I.U.; Ahmed, M.; Rafique, K.; Saand, A.S. Energy demand and production forecasting in Pakistan. Energy Strategy Rev. 2022, 39, 100788. [Google Scholar] [CrossRef]
- World Bank Report. Balochistan: Development Issues and Prospects Energy Sector. Available online: https://documents1.worldbank.org/curated/zh/352401468145176136/pdf/ACS22580WP0v500art020Energy0Sector.pdf. (accessed on 19 May 2023).
- Digital Associated Press of Pakistan. Off-Grid Solutions Be Explored to Provide Electricity in Southern Balochistan: Asad. Available online: https://www.app.com.pk/business/off-grid-solutions-be-explored-to-provide-electricity-in-southern-balochistan-asad/ (accessed on 1 June 2023).
- Naeem, A.; Shah SM, A.; Marri, M.F. Solar Electrification: A Solution For Socio-Economic Development Of Rural Household: Empirical Evidence From District Sibi, Balochistan, Pakistan. J. Posit. Sch. Psychol. 2023, 7, 807–821. [Google Scholar]
- Anwar, N.U.R.; Waqas, A.M.; Khan, F. Renewable energy technologies in Balochistan: Practice, prospects and challenges. In Proceedings of the 5th International Conference on Energy, Environment & Sustainable Development (EESD) 2018, Jamshoro, Pakistan, 14–16 November 2018; pp. 1–9. [Google Scholar]
- Asian Development Bank. Available online: https://www.adb.org/sites/default/files/institutional-document/32216/private-sector-assessment.pdf (accessed on 20 June 2023).
- Solar Energy Industries Association. Utility-Scale Solar. Available online: https://www.seia.org/initiatives/utility-scale-solar-power (accessed on 19 November 2022).
- United States Department of Energy. The SunShot 2030 Goals. Available online: https://www.energy.gov/sites/prod/files/2020/09/f79/SunShot%202030%20White%20Paper.pdf (accessed on 20 June 2023).
- Niaz, H.; Shams, M.H.; Liu, J. Evaluating the Economic Impact of Using Curtailed Renewable Energy Sources for Green Hydrogen Production. In Proceedings of the 2022 IEEE International Symposium on Advanced Control of Industrial Processes (AdCONIP), Vancouver, BC, Canada, 7–9 August 2022; pp. 102–107. [Google Scholar]
- Nadaleti, W.C.; Borges dos Santos, G.; Lourenço, V.A. The potential and economic viability of hydrogen production from the use of hydroelectric and wind farms surplus energy in Brazil: A national and pioneering analysis. Int. J. Hydrogen Energy 2020, 45, 1373–1384. [Google Scholar] [CrossRef]
- Yates, J.; Daiyan, R.; Patterson, R.; Egan, R.; Amal, R.; Baille, A.H.; Chang, N.L. Techno-economic Analysis of Hydrogen Electrolysis from Off-Grid Stand-Alone Photovoltaics Incorporating Uncertainty Analysis. Cell Rep. Phys. Sci. 2020, 1, 100209. [Google Scholar] [CrossRef]
- Ahshan, R.; Onen, A.; Al-badi, A.H. Assessment of wind-to-hydrogen (Wind-H2) generation prospects in the Sultanate of Oman. Renew. Energy 2022, 200, 271–282. [Google Scholar] [CrossRef]
- Shehabi, M.; Dally, B. Opportunity and Cost of Green Hydrogen Production in Kuwait: A Preliminary Assessment. SSRN Electron. J. 2022, 1, 1–26. [Google Scholar] [CrossRef]
- Dabar, O.A.; Awaleh, M.O.; Waberi, M.M.; Adan, A.B.I. Wind resource assessment and techno-economic analysis of wind energy and green hydrogen production in the Republic of Djibouti. Energy Rep. 2022, 8, 8990–8996. [Google Scholar] [CrossRef]
- Manzotti, A.; Quattrocchi, E.; Curcio, A.; Kwok, S.C.; Santarelli, M.; Ciucci, F. Membraneless electrolyzers for the production of low-cost, high-purity green hydrogen: A techno-economic analysis. Energy Convers. Manag. 2022, 254, 115156. [Google Scholar] [CrossRef]
- Jang, D.; Kim, J.; Kim, D.; Han, W.B.; Kang, S. Techno-economic analysis and Monte Carlo simulation of green hydrogen production technology through various water electrolysis technologies. Energy Convers. Manag. 2022, 258, 115499. [Google Scholar] [CrossRef]
- Burdack, A.; Duarte-Herrera, L.; López-Jiménez, G.; Polklas, T.; Vasco-Echeverri, O. Techno-economic calculation of green hydrogen production and export from Colombia. Int. J. Hydrogen Energy 2022, 48, 1685–1700. [Google Scholar] [CrossRef]
- Lawrence Berkeley National Laboratory. Empirical Trends in Deployment, Technology, Cost, Performance, PPA Pricing, and Value in the United States. Available online: https://eta-publications.lbl.gov/sites/default/files/utility_scale_solar_2022_edition_slides.pdf (accessed on 3 November 2022).
- Armijo, J.; Philibert, C. Flexible production of green hydrogen and ammonia from variable solar and wind energy: Case study of Chile and Argentina. Int. J. Hydrogen Energy 2020, 45, 1541–1558. [Google Scholar] [CrossRef]
- Shaner, M.R.; Atwater, H.A.; Lewis, N.S.; McFarland, E.W. A comparative techno-economic analysis of renewable hydrogen production using solar energy. Energy Environ. Sci. 2016, 9, 2354–2371. [Google Scholar] [CrossRef]
- Siyal, S.H.; Mentis, D.; Mörtberg, U.; Samo, S.R.; Howells, M. A preliminary assessment of wind-generated hydrogen production potential to reduce the gasoline fuel used in road transport sector of Sweden. Int. J. Hydrogen Energy 2015, 40, 6501–6511. [Google Scholar] [CrossRef]
- Schlecht, M.; Meyer, R. Site selection and feasibility analysis for concentrating solar power (CSP) systems. In Concentrating Solar Power Technology; Woodhead Publishing: Cambridge, UK, 2012; pp. 91–119. [Google Scholar] [CrossRef]
- Yang, Y.; Wang, Z.; Xu, E.; Ma, G.; An, Q. Analysis and Optimization of the Start-up Process based on Badaling Solar Power Tower Plant. Energy Procedia 2015, 69, 1688–1695. [Google Scholar] [CrossRef]
- Siddiqi, F. Nation-formation and national movement(s) in Pakistan: A critical estimation of Hroch’s stage theory. Natl. Pap. 2010, 38, 16. [Google Scholar] [CrossRef]
- National Renewable Energy Laboratory (NREL). Available online: https://www.nrel.gov/docs/fy04osti/36705.pdf (accessed on 10 November 2022).
- National Renewable Energy Laboratory. Available online: https://sam.nrel.gov/ (accessed on 12 September 2022).
- National Renewable Energy Laboratory. SAM Photovoltaic Model Technical Reference. Available online: https://www.nrel.gov/docs/fy15osti/64102.pdf (accessed on 12 September 2022).
- Global Price Source. Available online: https://www.globalsources.com/Solar-grid/foldable-solar-panel-kit-1191486741p.htm (accessed on 1 November 2022).
- Global Price Source. Available online: https://www.globalsources.com/Solar-panel/Trina-All-Black-Mono-Solar-Panel-1195174784p.htm (accessed on 1 November 2022).
- National Renewable Energy Laboratory. U.S. Solar Photovoltaic System and Energy Storage Cost Benchmark: Q1 2020. Available online: https://www.nrel.gov/docs/fy21osti/77324.pdf (accessed on 1 November 2022).
- National Renewable Energy Laboratory. U.S. Solar Photovoltaic System and Energy Storage Cost Benchmarks: Q1 2021. Available online: https://www.nrel.gov/docs/fy22osti/80694.pdf (accessed on 2 November 2022).
- National Renewable Energy Laboratory. Solar Industry Update. Available online: https://www.nrel.gov/docs/fy23osti/86215.pdf (accessed on 1 November 2022).
- Dehghanimadvar, M.; Egan, R.; Chang, N.L. Economic assessment of local solar module assembly in a global market. Cell Rep. Phys. Sci. 2022, 3, 100747. [Google Scholar] [CrossRef]
- Electric Power Institute. Budgeting for Solar PV Plant Operations & Maintenance: Practices. Available online: https://www.osti.gov/servlets/purl/1234935 (accessed on 11 November 2022).
- Wiser, R.H.; Bolinger, M.; Seel, J.; Benchmarking Utility-Scale PV Operational Expenses and Project Lifetimes: Results from a Survey of U.S. Solar Industry Professionals. Available online: https://emp.lbl.gov/publications/benchmarking-utility-scale-pv (accessed on 11 November 2022).
- Trina Solar. Available online: https://www.trinasolar.com/en-glb/resources/newsroom/mabos-costs-reduced-63-dnv-gl-report-trina-solar-vertex-210mm-modules%E2%80%99-advantages (accessed on 18 November 2022).
- National Renewable Energy Laboratory. Available online: https://atb.nrel.gov/electricity/2022/utility-scale_pv#operation_and_maintenance_(o&m)_costs (accessed on 10 November 2022).
- National Renewable Energy Laboratory. Overview of Field Experience-Degradation Rates & Lifetimes. Available online: https://www.nrel.gov/docs/fy15osti/65040.pdf (accessed on 10 November 2022).
- International Renewable Energy Agency. Renewable Power Generation Costs in 2017. Available online: https://www.irena.org/-/media/Files/IRENA/Agency/Publication/2018/Jan/IRENA_2017_Power_Costs_2018_summary.pdf (accessed on 10 November 2022).
- García, H.A.; Duke, A.R.; Flores, H.V. Techno-economic comparison between photovoltaic systems with solar trackers and fixed structure in “El Valle de Sula”, Honduras. In Proceedings of the 2020 6th International Conference on Advances in Environment Research, Sapporo, Japan, 26–28 August 2020; Volume 776, pp. 1–12. [Google Scholar] [CrossRef]
- United States Department of Energy. Hydrogen Program Plan. Available online: https://www.hydrogen.energy.gov/pdfs/hydrogen-program-plan-2020.pdf (accessed on 4 September 2022).
- Ghanbari, N.; Mobarrez, M.; Madadi, M.; Bhattacharya, S. Comprehensive Cost Comparison and Analysis of Building-Scale Solar DC and AC Microgrid. In Proceedings of the International Conference on DC Microgrids—ICDCM, Matsue, Japan, 20–23 May 2019. [Google Scholar]
- Saudi Central Bank. Available online: https://www.sama.gov.sa/en-US/EconomicReports/pages/inflationreport.aspx (accessed on 10 December 2022).
- Quid-e-Azam Solar Park. Available online: https://cpec.gov.pk/project-details/10 (accessed on 5 July 2023).
- Ali, F.; Ahmar, M.; Jiang, Y.; Alahmad, M. A techno-economic assessment of hybrid energy systems in rural Pakistan. Energy 2021, 215, 119103. [Google Scholar] [CrossRef]
- Australian Renewable Energy Agency. Opportunities for Australia from Hydrogen Exports-Australian Renewable Energy Agency. Available online: https://arena.gov.au/knowledge-bank/opportunities-for-australia-from-hydrogen-exports/ (accessed on 5 January 2023).
- Lohana, K.; Raza, A.; Mirjat, N.H.; Ahmed, S.; Ahmed, S. Techno-Economic Feasibility Analysis of Concentrated Solar Thermal Power Plants as Dispatchable Renewable Energy Resource of Pakistan: A case study of Tharparkar. IJEEIT Int. J. Electr. Eng. Inf. Technol. 2021, 4, 35–40. [Google Scholar] [CrossRef]
- Abas, N. Techno-Economic Feasibility Analysis of 100 MW Solar Photovoltaic Power Plant in Pakistan. Technol. Econ. Smart Grids Sustain. Energy 2022, 7, 16. [Google Scholar] [CrossRef]
- Ahmad, J.; Imran, M.; Khalid, A.; Iqbal, W.; Ashraf, S.R.; Adnan, M.; Ali, S.F.; Khokhar, K.S. Techno economic analysis of a wind-photovoltaic-biomass hybrid renewable energy system for rural electrification: A case study of Kallar Kahar. Energy 2018, 148, 208–234. [Google Scholar] [CrossRef]
- Ahmed, N.; Khan, A.N.; Ahmed, N.; Aslam, A.; Imran, K.; Sajid, M.B.; Waqas, A. Techno-economic potential assessment of mega scale grid-connected PV power plant in five climate zones of Pakistan. Energy Convers. Manag. 2021, 237, 114097. [Google Scholar] [CrossRef]
- Adnan, M.; Ahmad, J.; Farooq, S.; Imran, M. A techno-economic analysis for power generation through wind energy: A case study of Pakistan. Energy Rep. 2021, 7, 1424–1443. [Google Scholar] [CrossRef]
- Power Technology. Sweihan Photovoltaic Independent Power Project, Abu Dhabi. Available online: https://www.power-technology.com/projects/sweihan-photovoltaic-independent-power-project-abu-dhabi/ (accessed on 1 November 2022).
- Emirates Water and Electricity. Abu Dhabi Power Corporation Announces Lowest Tariff for Solar Power in the World. Available online: https://www.ewec.ae/en/media/press-release/abu-dhabi-power-corporation-announces-lowest-tariff-solar-power-world#:~:text=The%20project%20has%20received%2C%20from,Abu%20Dhabi’%20project%20%E2%80%93%20Abu%20Dhabi’s (accessed on 2 November 2022).
- PV Magazine. Lowest Shortlisted Bid in Saudi 1.47 GW Tender was $0.0161/kWh. Available online: https://www.pv-magazine.com/2020/04/03/lowest-shortlisted-bid-in-saudi-1-47-gw-tender-was-0-0161-kwh/ (accessed on 29 October 2022).
- ACWA Power. Financial Closure Achieved for The Largest Solar Photovoltaic Power Plant in Oman. Available online: https://www.acwapower.com/news/financial-closure-achieved-for-the-largest-solar-photovoltaic-power-plant-in-oman/ (accessed on 3 November 2022).


| Category | Parameter | Notes |
|---|---|---|
| Site selection | Geographical location | DNI and financial factors, e.g., utility tariffs, tax rate, inflation and discount rate, carbon credits, etc., vary with location/country of interest. |
| Energy generation | Capacity | The economy of scale has an impact on net technical and cost parameters. |
| Performance and cost | System lifetime | Various renewable power-generation systems have different life spans and replacement costs. |
| Feasibility | Energy harvesting system | Solar PV, solar-thermal, wind, and biomass have different energy potentials concerning net output power. |
| System performance | Efficiency | Module type in the case of PV, turbine class in the case of wind, and Biomass’s energy-to-power-conversion technique affect the power generated. |
| System performance | Loss factor | In practice, at the industrial level of power generation systems, specific energy and exergy losses typically exist, e.g., DC/AC losses in PV plants. |
| Net output power | Degradation rate | The performance of the power generator degrades with time, reducing the net output power. |
| System cost | CAPEX | The cost of components related to renewable energy system changes due to ongoing increases in global installed capacity and product improvements; more realistic CAPEX based on a well-defined system’s design impacts the net cost. |
| Lifetime cost | Power generation systems and BOS have different lifetimes; hence during the specific analysis period, these should be accounted for separately. | |
| OPEX | Logistics, labor wages, and insurance costs, and other soft costs are often country-specific, hence have a pronounced impact in the long run as OPEX mainly affects annual equivalent costs. | |
| Project finance | Equity | The equity with a specific interest rate through a reasonable estimate must be accounted for in the life cycle costing of the renewable power generation to encourage private sector investment. |
| Net present value | Residual value | The residual value is a significant cost factor, specifically when the analysis period is shorter than plant life. |
| Discount rate | Discount and inflation rates directly affect the LCOE, neglecting or assuming it leads to unrealistic results. | |
| Inflation rate | ||
| IRR | To attract private sector investment, IRR with a reasonable estimate should be declared, and its effect should be reflected in net cost. | |
| Annualized cost | Carbon credit | The penalty charges avoided from reducing CO2 emitting to the atmosphere are accounted for in LCC while evaluating the LCOE. |
| Replacement cost | If the analysis period is different than the system life, then replacement cost needs to be accounted for in annualized cost. | |
| Capital cost | Foundation | Renewable power plant requires a considerable land area for installation, which has a significant impact on CAPEX if leased or purchased. The CAPEX must account for land purchase and preparation costs where applicable. |
| Engineering and developer overhead | Overhead costs, e.g., computer programming, communication, and encoding, are specifically crucial in setting central control systems in scale enactment. | |
| Contingency | In LCOE estimation over the 25–35 years period of the power generation system, the cost associated with uncertain and unpredictable risk should be considered. | |
| BOS and installation cost | BOS equipment and installation cost is a significant direct cost component, and it should be accounted for separately from the CAPEX. |
| Production Site (Pakistan) | Co-Ordinates (°N, °E) | DNI (kWh/m2/d) | Avg. GHI (kWh/m2/d) | Avg. Wind Speed (m/s) | Avg. T (°C) |
|---|---|---|---|---|---|
| Chagai, Baluchistan | 29.3058, 64.6945 | 5.94 | 5.93 | 3.1 | 28.6 |
| Parameters | Unit | Value | |
|---|---|---|---|
| Bi-Facial [40] | Mono-Facial [41] | ||
| Efficiency | % | 21.79 | 20.88 |
| Power capacity | Wdc | 671.055 | 540.696 |
| Performance degradation | %/y | 0.45 | 0.55 |
| Voltage (maximum) | Vdc | 38.5 | 31.2 |
| Current (maximum) | Adc | 17.4 | 17.3 |
| Temperature coefficient | W/°C | −0.303 | −0.371 |
| Cells | Nos | 66 | 55 |
| Area | m2 | 3.080 | 2.59 |
| Unit mass | kg/m2 | 11.092 | 11.092 |
| Length | m | 3.08 | 2.59 |
| Metric | Fixed-Mounted | Single-Axis | Dual-Axis | |||
|---|---|---|---|---|---|---|
| Mono-Facial | Bi-Facial | Mono-Facial | Bi-Facial | Mono-Facial | Bi-Facial | |
| Annual energy (GWh) | 17.76 | 18.52 | 22.53 | 23.64 | 24.45 | 25.56 |
| CF (%) | 22.9 | 22.1 | 28.3 | 29.5 | 31.1 | 32.2 |
| Energy yield (kWh/kW) | 1777 | 1852 | 2255 | 2363 | 2446 | 2558 |
Disclaimer/Publisher’s Note: The statements, opinions and data contained in all publications are solely those of the individual author(s) and contributor(s) and not of MDPI and/or the editor(s). MDPI and/or the editor(s) disclaim responsibility for any injury to people or property resulting from any ideas, methods, instructions or products referred to in the content. |
© 2023 by the authors. Licensee MDPI, Basel, Switzerland. This article is an open access article distributed under the terms and conditions of the Creative Commons Attribution (CC BY) license (https://creativecommons.org/licenses/by/4.0/).
Share and Cite
Sadiq, M.; Kokchang, P.; Kittipongvises, S. Comparative Techno-Economic Evaluation of a Standalone Solar Power System for Scaled Implementation in Off-Grid Areas. Energies 2023, 16, 6262. https://doi.org/10.3390/en16176262
Sadiq M, Kokchang P, Kittipongvises S. Comparative Techno-Economic Evaluation of a Standalone Solar Power System for Scaled Implementation in Off-Grid Areas. Energies. 2023; 16(17):6262. https://doi.org/10.3390/en16176262
Chicago/Turabian StyleSadiq, Muhammad, Phimsupha Kokchang, and Suthirat Kittipongvises. 2023. "Comparative Techno-Economic Evaluation of a Standalone Solar Power System for Scaled Implementation in Off-Grid Areas" Energies 16, no. 17: 6262. https://doi.org/10.3390/en16176262
APA StyleSadiq, M., Kokchang, P., & Kittipongvises, S. (2023). Comparative Techno-Economic Evaluation of a Standalone Solar Power System for Scaled Implementation in Off-Grid Areas. Energies, 16(17), 6262. https://doi.org/10.3390/en16176262