Article

Impact of Automation on Enhancing Energy Quality in Grid-Connected Photovoltaic Systems

by
Virgilio Alfonso Murillo Rodríguez
1,*,
Noé Villa Villaseñor
2,
José Manuel Robles Solís
3 and
Omar Alejandro Guirette Barbosa
4
1
Postgraduates CIATEQ A.C., San Agustín del Retablo 150, Constituyentes Fovissste, Santiago de Querétaro 76150, Mexico
2
Advanced Technology Center, CIATEQ A.C., Zapopan 45131, Mexico
3
Mechatronics Engineering, Polytechnic University of Zacatecas, Fresnillo 99056, Mexico
4
Biotechnology Engineering, Polytechnic University of Zacatecas, Fresnillo 99056, Mexico
*
Author to whom correspondence should be addressed.
Energies 2023, 16(17), 6161; https://doi.org/10.3390/en16176161
Submission received: 4 July 2023 / Revised: 12 August 2023 / Accepted: 14 August 2023 / Published: 24 August 2023
(This article belongs to the Special Issue Advances and Optimization of Electric Energy System)

Abstract

:
Rapid growth in the integration of new consumers into the electricity sector, particularly in the industrial sector, has necessitated better control of the electricity supply and of the users’ op-erating conditions to guarantee an adequate quality of service as well as the unregulated dis-turbances that have been generated in the electrical network that can cause significant failures, breakdowns and interruptions, causing considerable expenses and economic losses. This research examines the characteristics of electrical variations in equipment within a company in the industrial sector, analyzes the impact generated within the electrical system according to the need for operation in manufacturing systems, and proposes a new solution through automation of the regulation elements to maintain an optimal system quality and prevent damage and equipment failures while offering a cost-effective model. The proposed solution is evaluated through a reliable simulation in ETAP (Energy Systems Modeling, Analysis and Optimization) software, which emulates the interaction of control elements and simulates the design of electric flow equipment operation. The results demonstrate an improvement in system performance in the presence of disturbances when two automation schemes are applied as well as the exclusive operation of the capacitor bank, which improves the total system current fluctuations and improves the power factor from 85.83% to 93.42%. Such a scheme also improves the waveform in the main power system; another improvement result is when simultaneously operating the voltage and current filter together with the PV system, further improving the current fluctuations, improving the power factor from 85.83% to 94.81%, achieving better stability and improving the quality of the waveform in the main power grid.

1. Introduction

The term “electric power quality” has gained significant importance due to its close association with increased productivity and competition within companies. There is a direct relationship between productivity, efficiency, and power quality [1,2,3].
Electricity serves as the primary input for productive activities, both in manufacturing and service sectors worldwide [4]. An efficient and affordable electricity supply enhances competitiveness and enables companies and industries to offer improved services in the market. This in turn has a positive impact on economic growth [5]. When products are of higher quality and can be offered at lower prices, it elevates the competitiveness of enterprises and industries. Economic factors highlights the need for companies to prioritize and maintain high standards of electrical power quality service to remain competitive in the market [6,7]. The growing demand for electricity has resulted in an increase in the number of sensitive loads that require high-quality power and improved network performance [8]. Furthermore, the escalating environmental pollution caused by the extensive use of fossil fuels has become a pressing issue. These challenges can be effectively addressed by leveraging distributed generation (DG) systems [9]. Among various sources of distributed generation, photovoltaic (PV) systems offer significant competitive advantages due to their renewable nature, widespread availability, and environmentally friendly operation [10,11,12]. PV panels can be practically used in various locations with proper placement [13]. Power electronic converters serve as the primary interface for connecting PV systems to the grid [14]. As a consequence, there is a growing necessity to develop techniques and solutions that upgrade the power quality in industrial environments [15].
The quality of the electrical service is vital for ensuring the optimal performance of electrical equipment and systems within an industrial environment. According to [16], the presence of power quality (PQ) disturbances has a detrimental effect on the electrical characteristics of power systems, resulting in diminished performance and reduced lifespans of connected equipment. According to [17,18,19], in the current scenario, the proliferation of power-electronics-based loads is on the rise due to their inherent advantages, such as improved efficiency and compactness [20]. However, these loads have significant drawbacks as they introduce harmonics and reactive power into the distribution network, thereby deteriorating the power quality of the grid and leading to increased distribution losses [21].
In this study, a literature review was carried out to identify the most effective techniques and solutions for improving the power quality in industrial environments. According to [22,23], the impact of PV generator installations on the power quality in the distribution network was analyzed [24]. Two distribution network models were considered: industrial and residential [25]. It was observed that as the number of PV plants installed increased, the value of harmonic current total demand distortion (TDD) in the distribution network remained below the TDD current limit recommended by IEEE STD 519-2022. However, the harmonic current (TDD) value at the short-circuit power (PCC) bus was found to be even higher [26,27]. Additionally, the average TDD value of conductor current, specifically the one directly connected to the PV generator bus, is higher as well. The implementation of a tuned passive filter can improve the total harmonic distortion (THD) [28].
An experimental study on electrical variables was carried out using the methodology outlined by IEEE STD 519-2022 [29,30]. This analysis was used as a reference when we compared values for reactive power ranging up to 40% and an apparent power factor up to 20%. The electric power and power factor (PF) are crucial electrical variables that impact industrial settings in the calculation of the cost of electricity. Typically, digital meters or power quality analyzers (PQA) are used. However, different algorithms or methodologies are applied for calculating electric power, producing significant differences when comparing the obtained records of each measured variable.
In another investigation mentioned in [31], a comparative study was conducted to establish the conditions under which computational algorithms based on alternative definitions of the unbalance factor can be accepted. The study focused on the evaluation of calculation algorithms based on different unbalance factor definitions [32]. The results aimed to define compatibility ranges between typical and/or permissible unbalance levels specified in various standards and assess the performance of power quality measurement instruments that adopt different definitions of the unbalanced factor. Another research project presented the design and implementation of a prototype for an outage and voltage drop recorder. This recorder serves as a low-cost alternative for studying the quality of the voltage wave in distribution networks [33]. This paper will first address some definitions related to power quality and will then describe in general terms the design and construction of the protocol for recording two disturbances of the voltage waveform, interruptions and voltage drops. The equipment consists of a data acquisition system and a graphical user interface that allows the analysis and specification of voltage levels for recording disturbances [34].

2. Materials and Methods

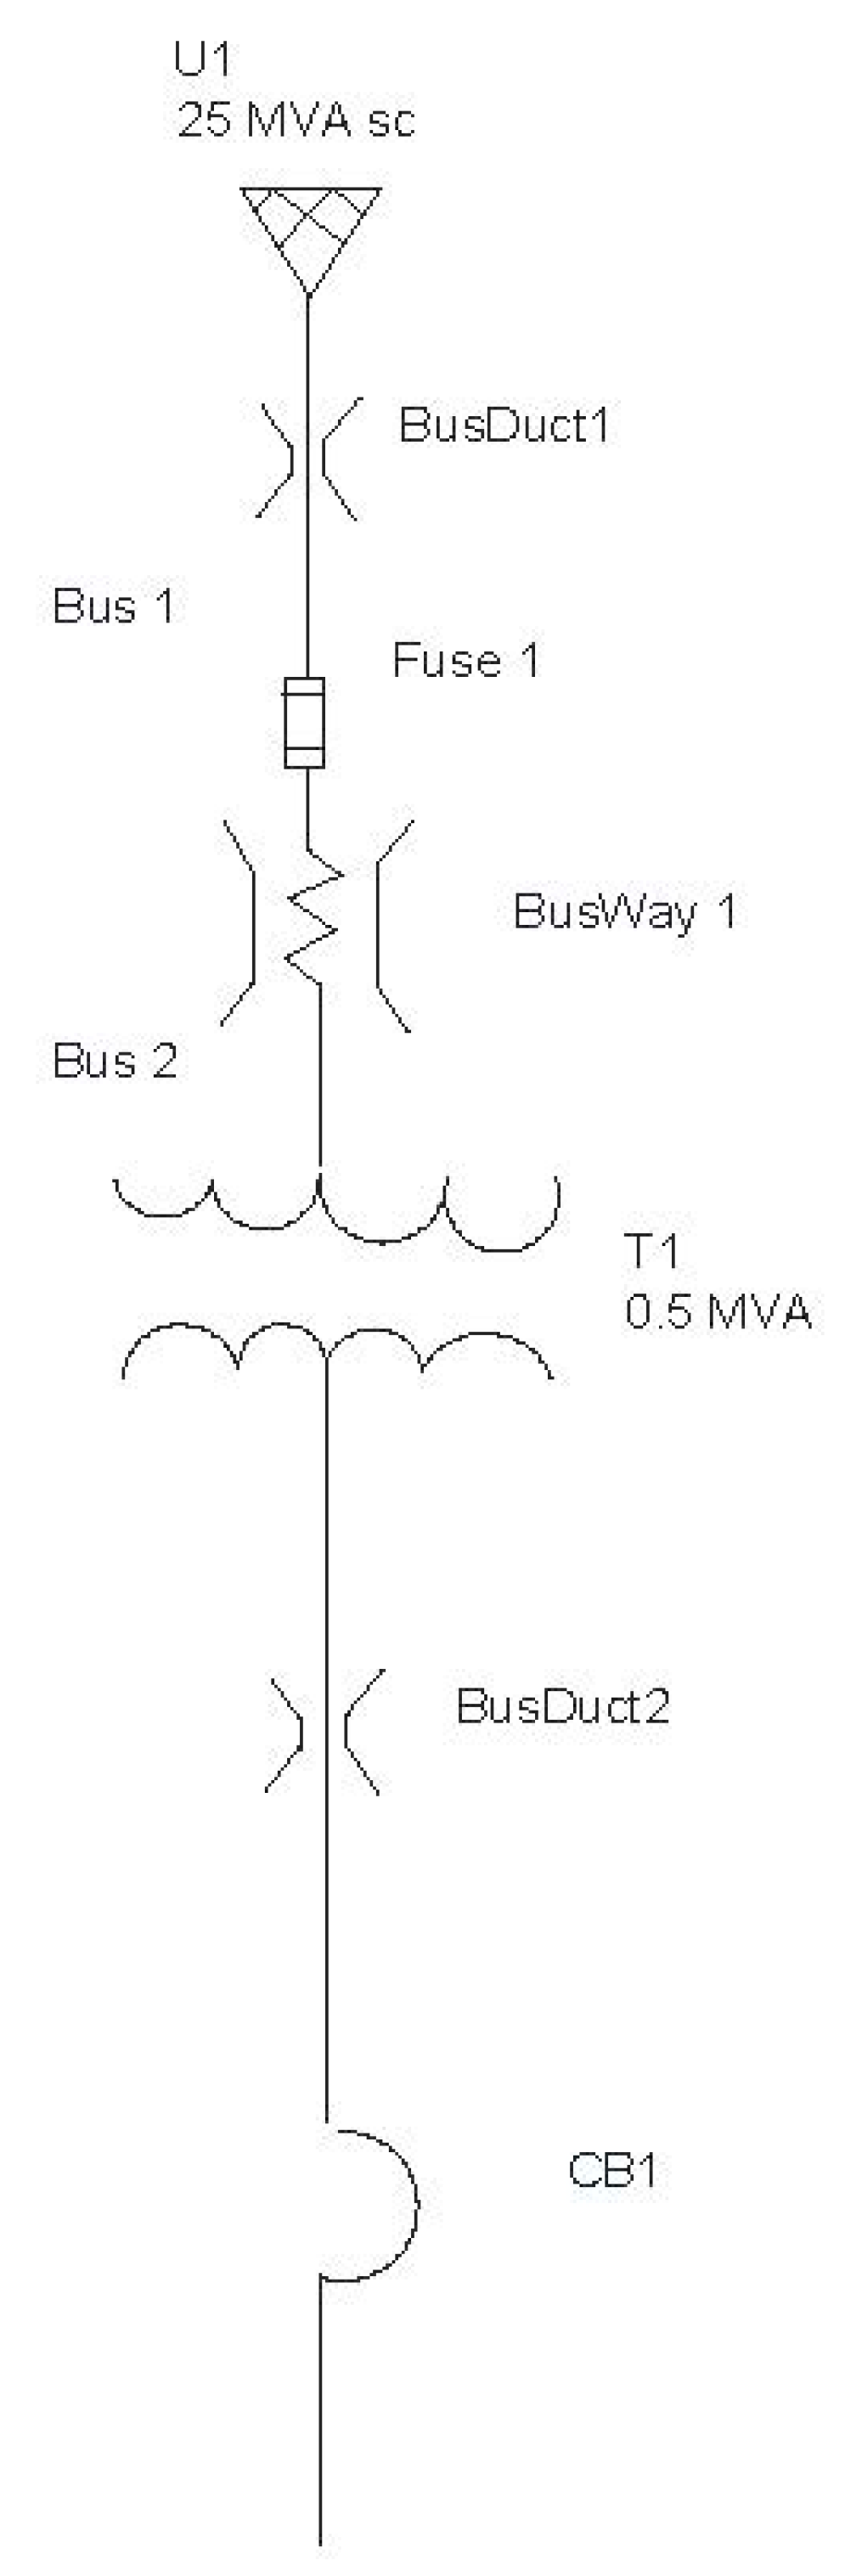
2.1. The Electrical System, General Characteristics

The electrical system is constituted by a set of elements useful for the generation, transmission, and distribution of electrical energy. It incorporates control, safety, and protection mechanisms. The characteristics of our company’s electrical system include two transformers located in the main substation. One transformer is a pole type with a capacity of 150 kVA and voltages of 13,200 Vac/220 Vac, while the other is a transformer pedestal type with a capacity of 500 kVA and voltages of 13,200 Vac/440 Vac. To monitor and analyze the power quality behavior, we focus on the main substation’s 500 kVA section, which operates at a voltage of 13.2 kV on the power supply side and at a voltage of 440 Vac on the low power supply.
As an initial step, we conducted an analysis of the load centers, for which measurement devices were already placed. We began by examining the different lines or phases that integrated the system. Subsequently, we identified the neutral and earth ground connections. Lastly, we proceeded to assess the various devices or machinery connected to the load centers. It is important to note that within the company, they work with two voltage levels. Voltage 1 is a three-phase system with four wires, operating at 440 Vac. Voltage 2 is also a three-phase system with four wires but with a voltage of 220 Vac. The inspection of the load centers will aid us in choosing the most suitable one for conducting the necessary measurements.
The company MACEP is involved in the analysis of the high-demand medium-voltage hourly tariff (GDMTH); this tariff will be applicable to services that involve energy allocation for any purpose, supplied at medium voltage, with a demand equal to or exceeding 100 kW.
The electricity bill was requested to examine the contracted conditions, as well as the consumption history.
The power factor, with an average of 85.83% (as seen in Figure 1), was also recorded, indicating that it was below the allowed level established by the Federal Electricity Commission (CFE L0000-70) [35]. The energy consumption analysis was recorded with an average reading of 20,440 kWh (as illustrated in Figure 2), aiming to contribute to the improvement of the energy quality.

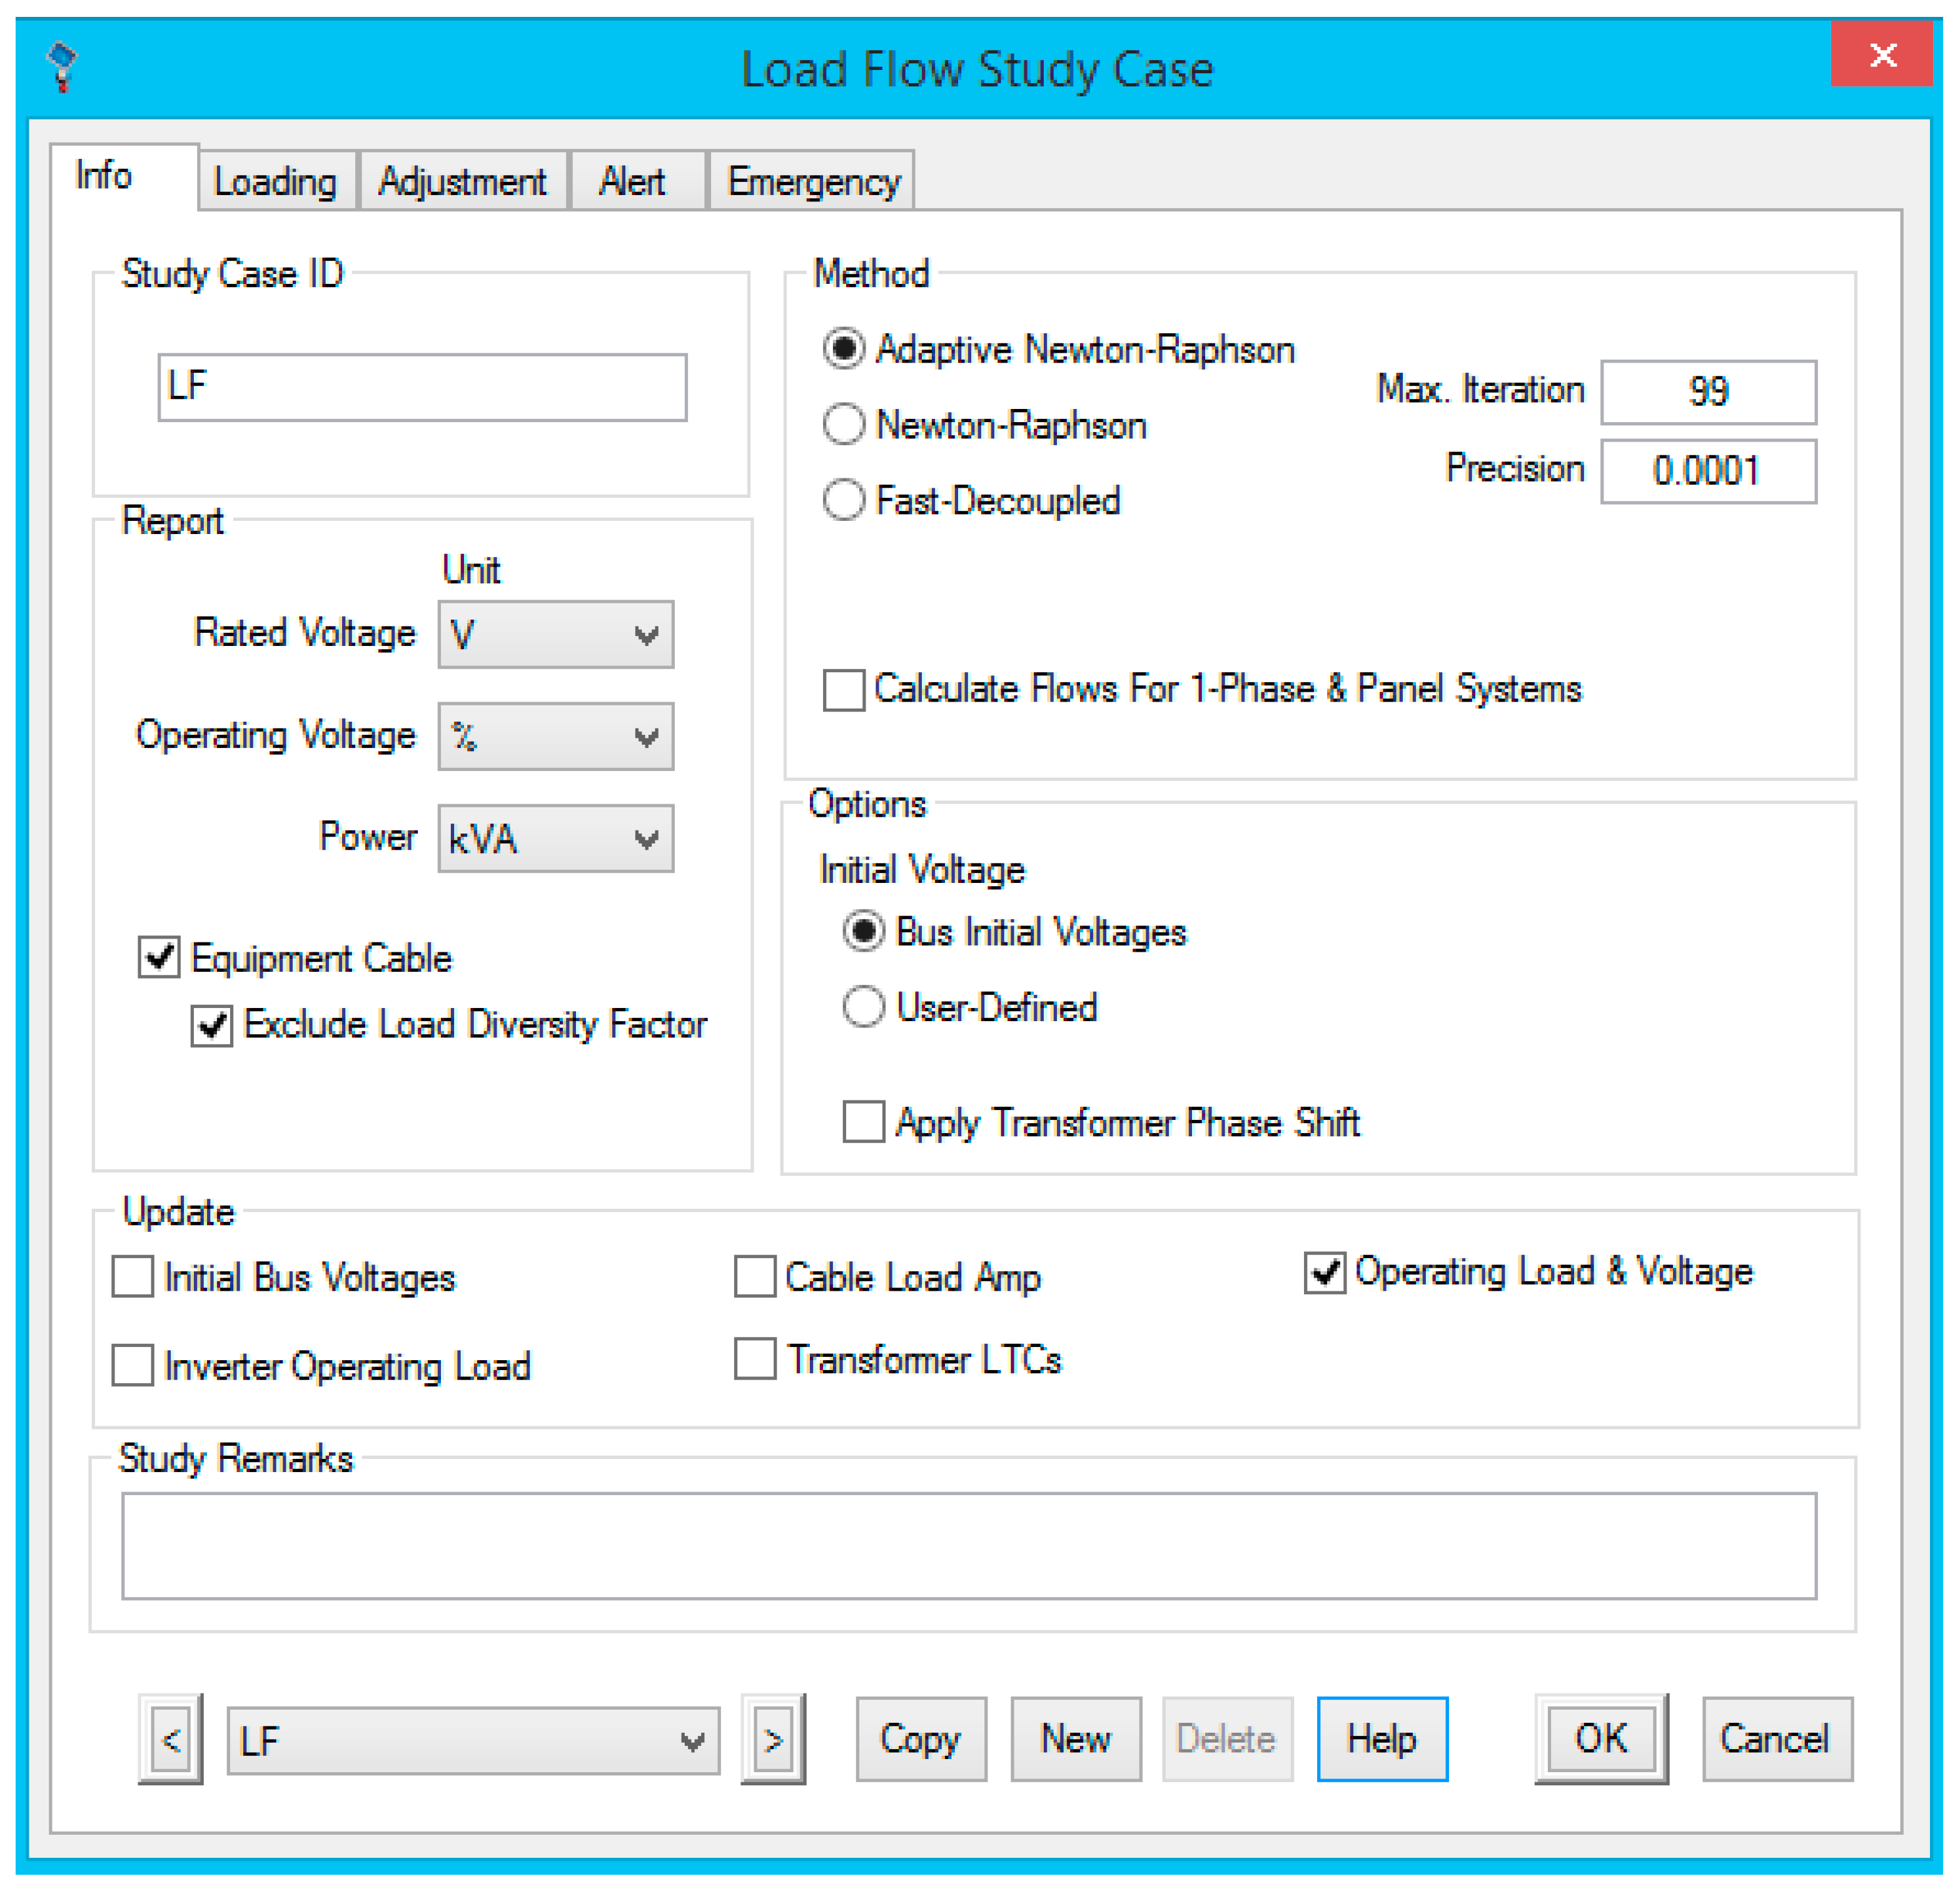
2.2. The Electrical System Analyzer

The network analyzer Fluke 434-II [36] was connected to the main power supply board, which provides a voltage of 440 Vac to the load center. In this step, to establish the connection, the network analyzer was configured beforehand with the specific electrical characteristics of the company. The network analyzer is equipped with clamps or amperometric probes and alligator-type connectors. To make the connections, the housing of the load center was first removed. The connection process involved the following steps: firstly, the ground connection was made, followed by connecting the voltage clamps according to their designated colors and lines. Then, the amperometric probes were connected, also following the color and line configurations. Once the connections were made, data recording was initiated using the monitoring feature of the network analyzer. Over a period of one year, the load was connected to the main power supply board, supplying a voltage of 440 Vac to the load center, and was constantly reviewed. During this period, data were generated indicating current fluctuations ranging from 24 A to a maximum of 105 A, as illustrated in Figure 3.
The load is currently connected to the main power supply board, which provides a voltage of 440 Vac to the load center. An analysis of the current in the main power board at 440 Vac has been carried out, revealing current fluctuations across the three phases, ranging from a maximum of 105 A to a minimum of 8 A, as shown in Figure 4. This analysis was carried out over a three-month period. It is important to mention that phase 1 exhibits higher current parameters, while phase 3 displays lower current parameters. It is vital to maintain these fluctuations within optimal values to prevent any significant disruptions in the electrical system of the plant.
The current fluctuations in the main power supply are shown to range from a maximum of 72 A to a minimum of 8 A specifically in line 1 (see Figure 4 L1 (A)). These fluctuations display irregularity at certain values and exhibit changes in their characteristics over extended periods, particularly when working with equipment that has higher energy consumption [37]. Furthermore, the voltage fluctuations in the main power supply have also been examined. The analysis reveals variations ranging from 420 Vac to 438 Vac, as shown in Figure 5. These voltage fluctuations contribute to a high consumption of electrical energy, which directly affects productivity through increased costs.

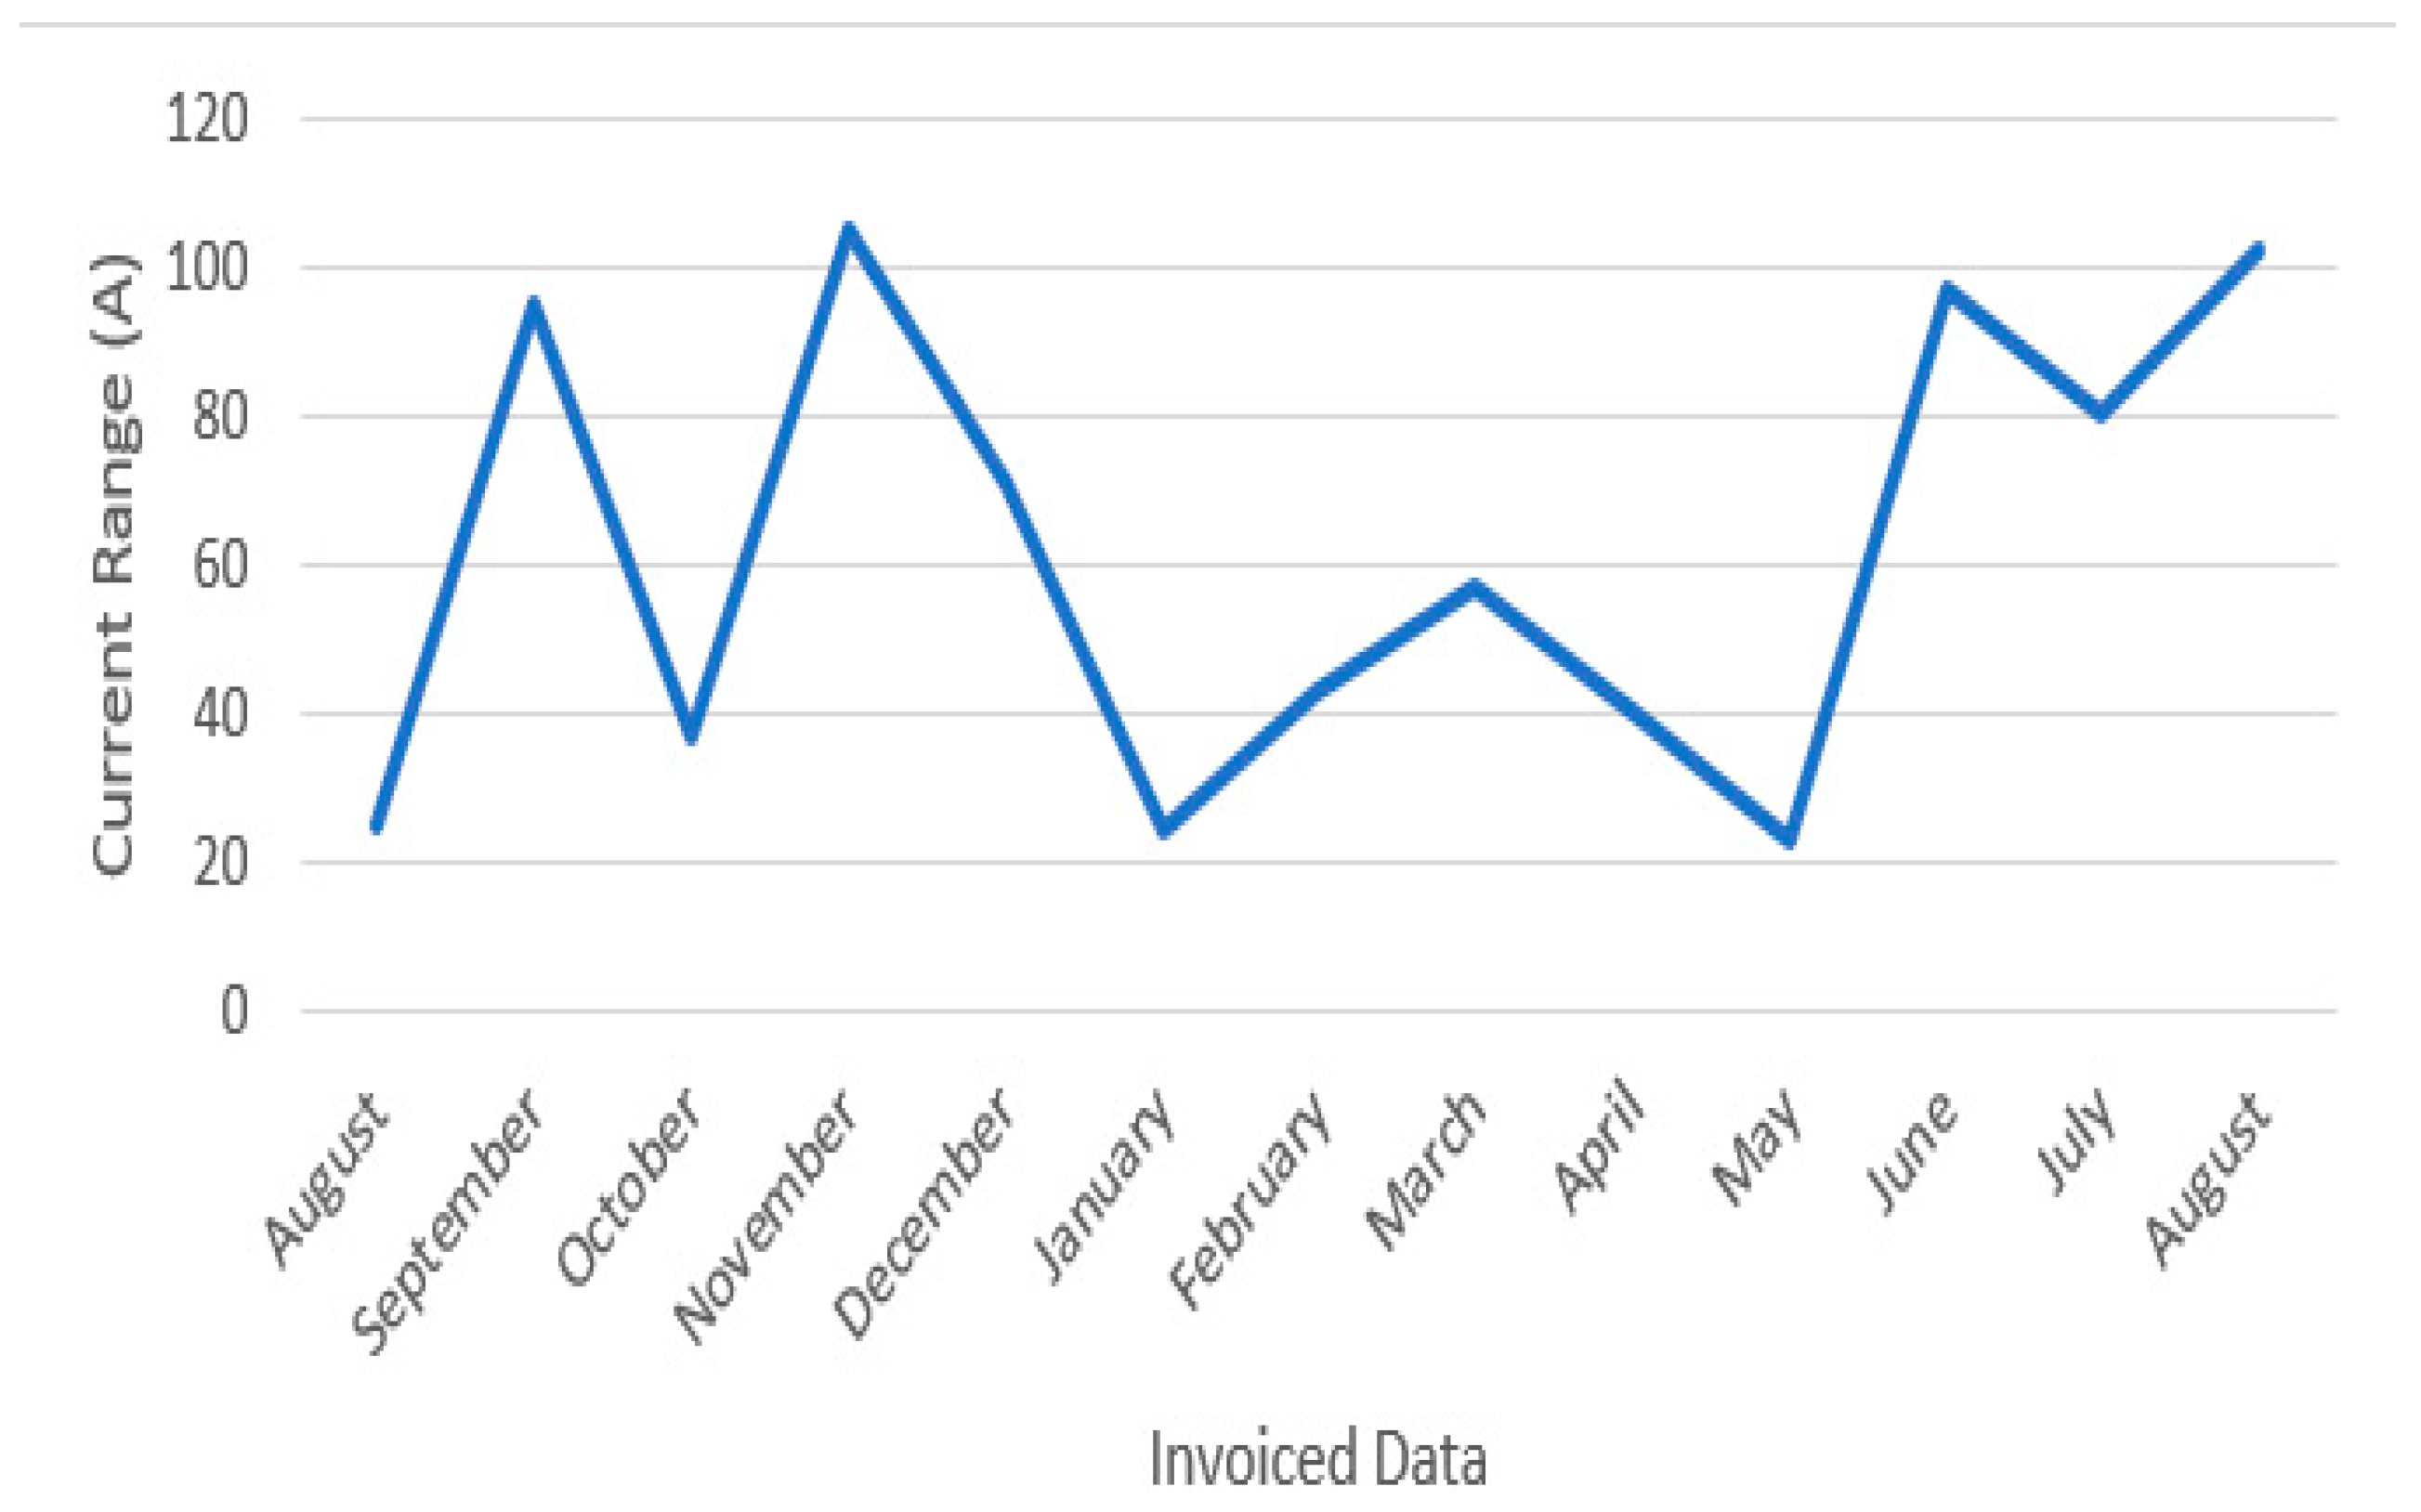
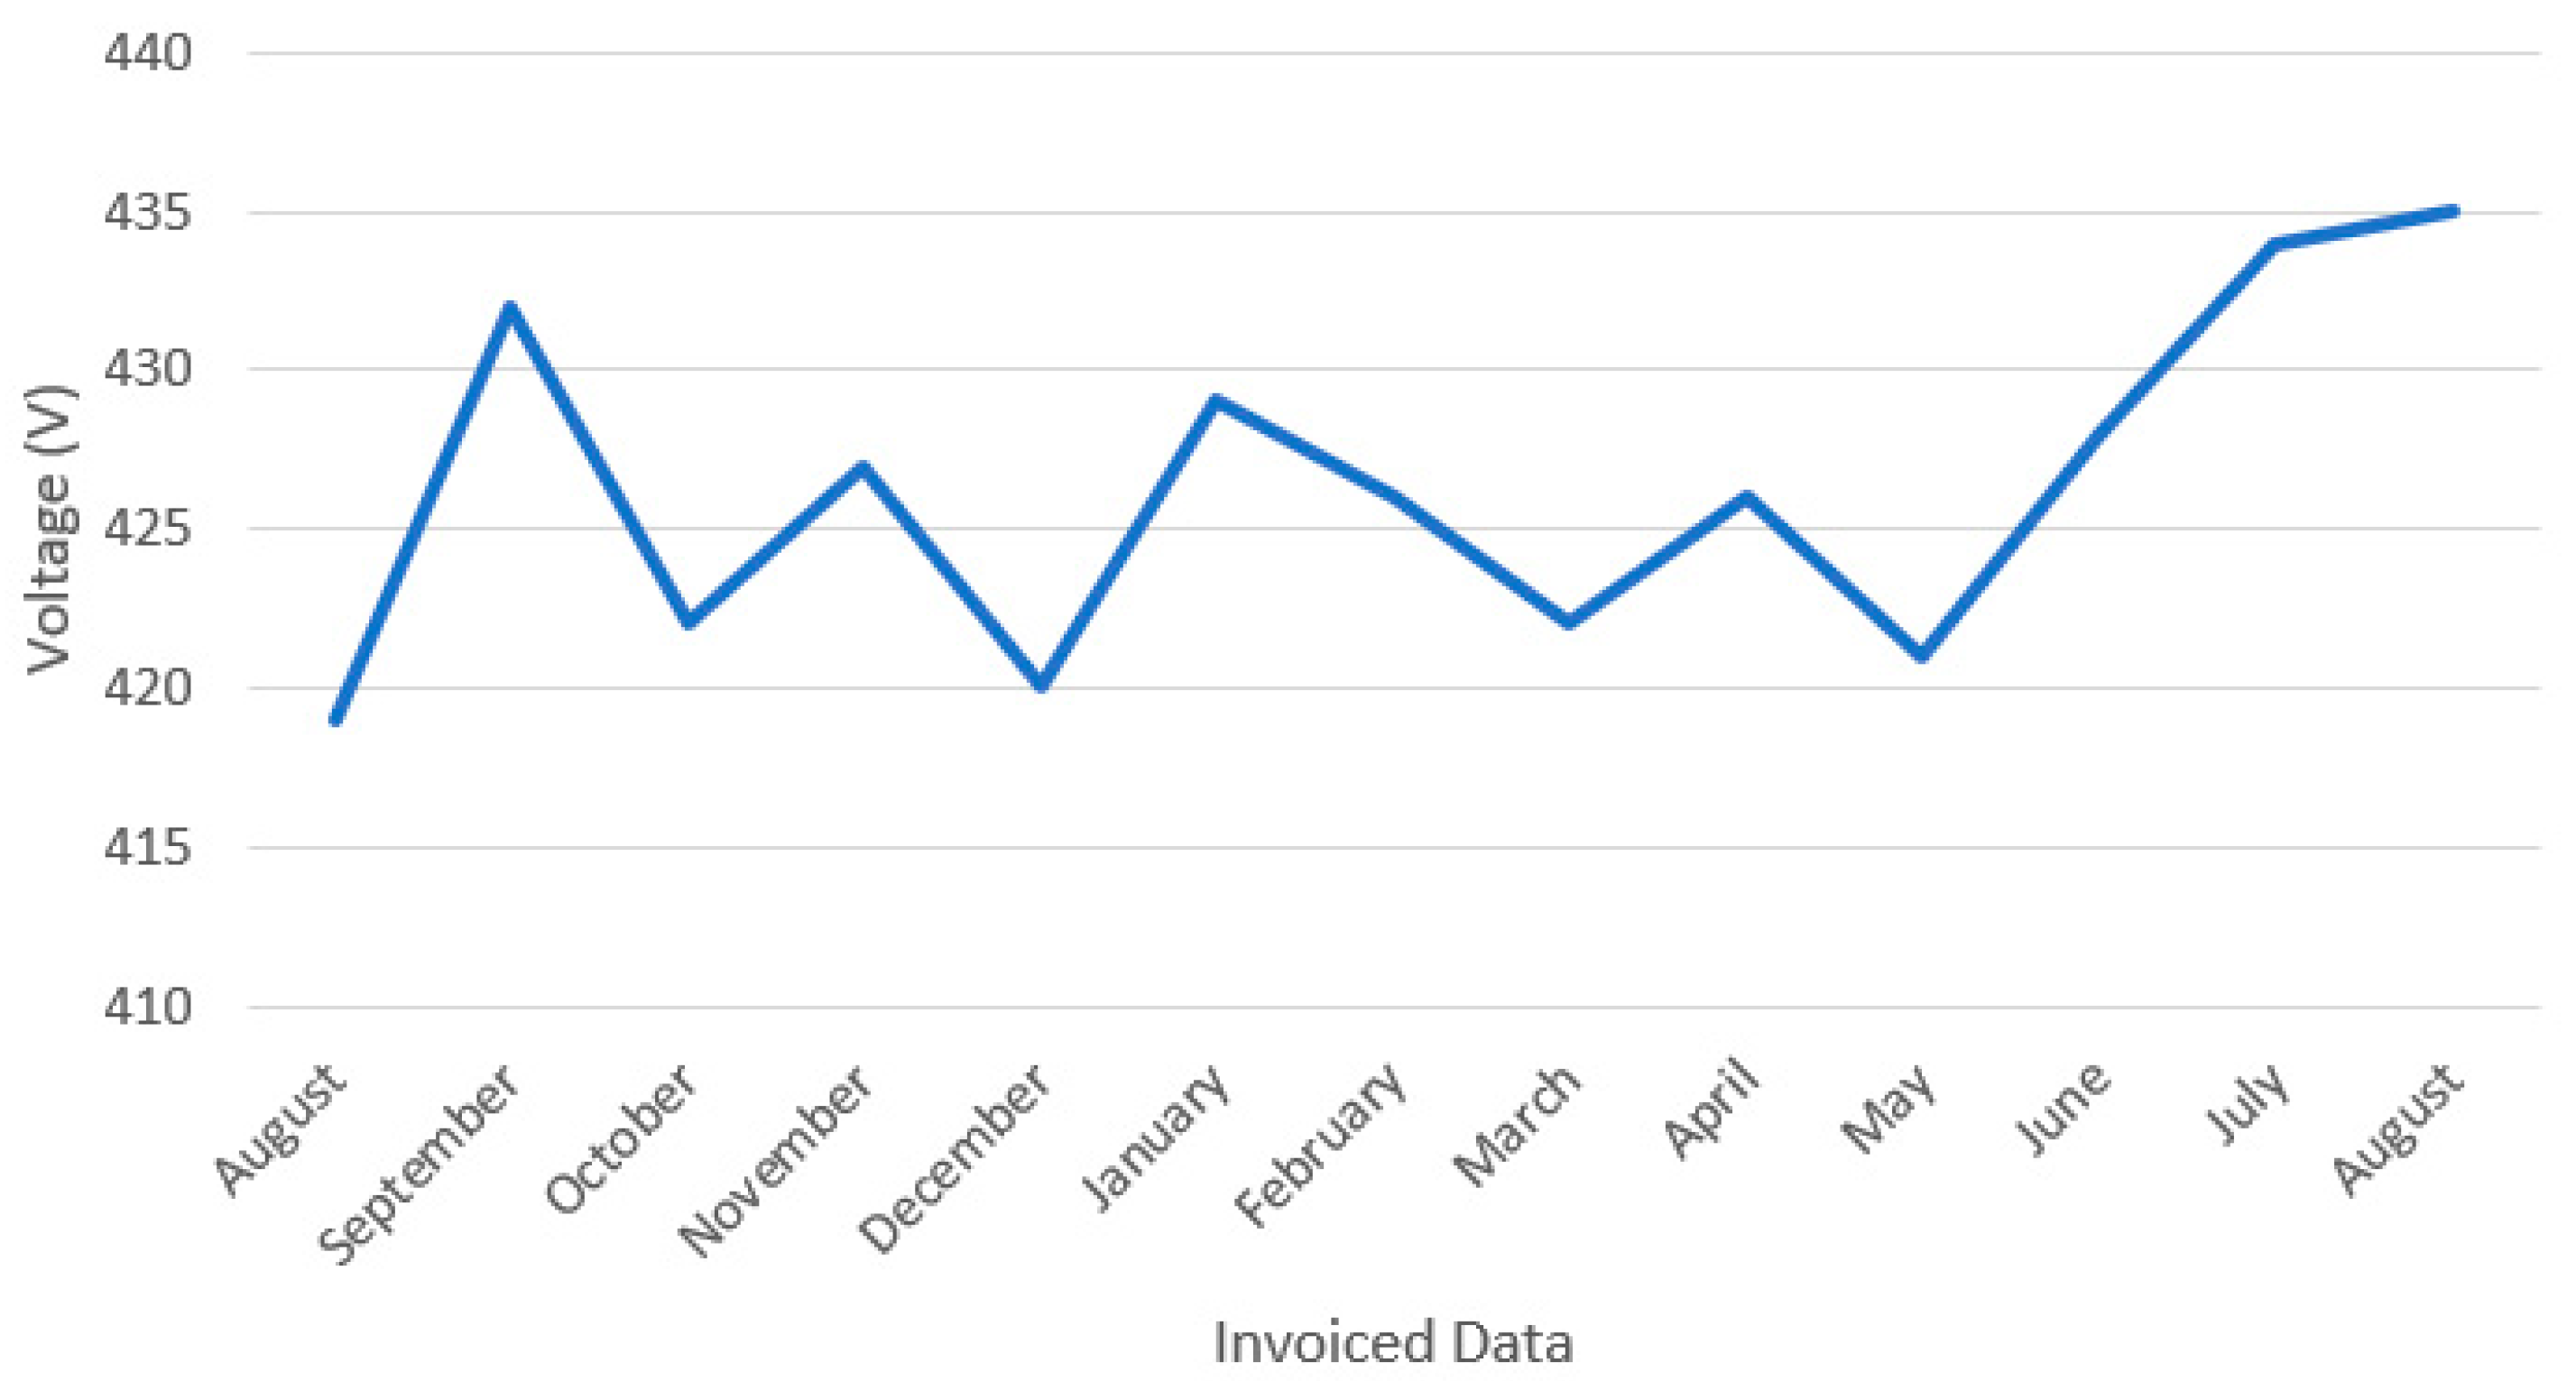
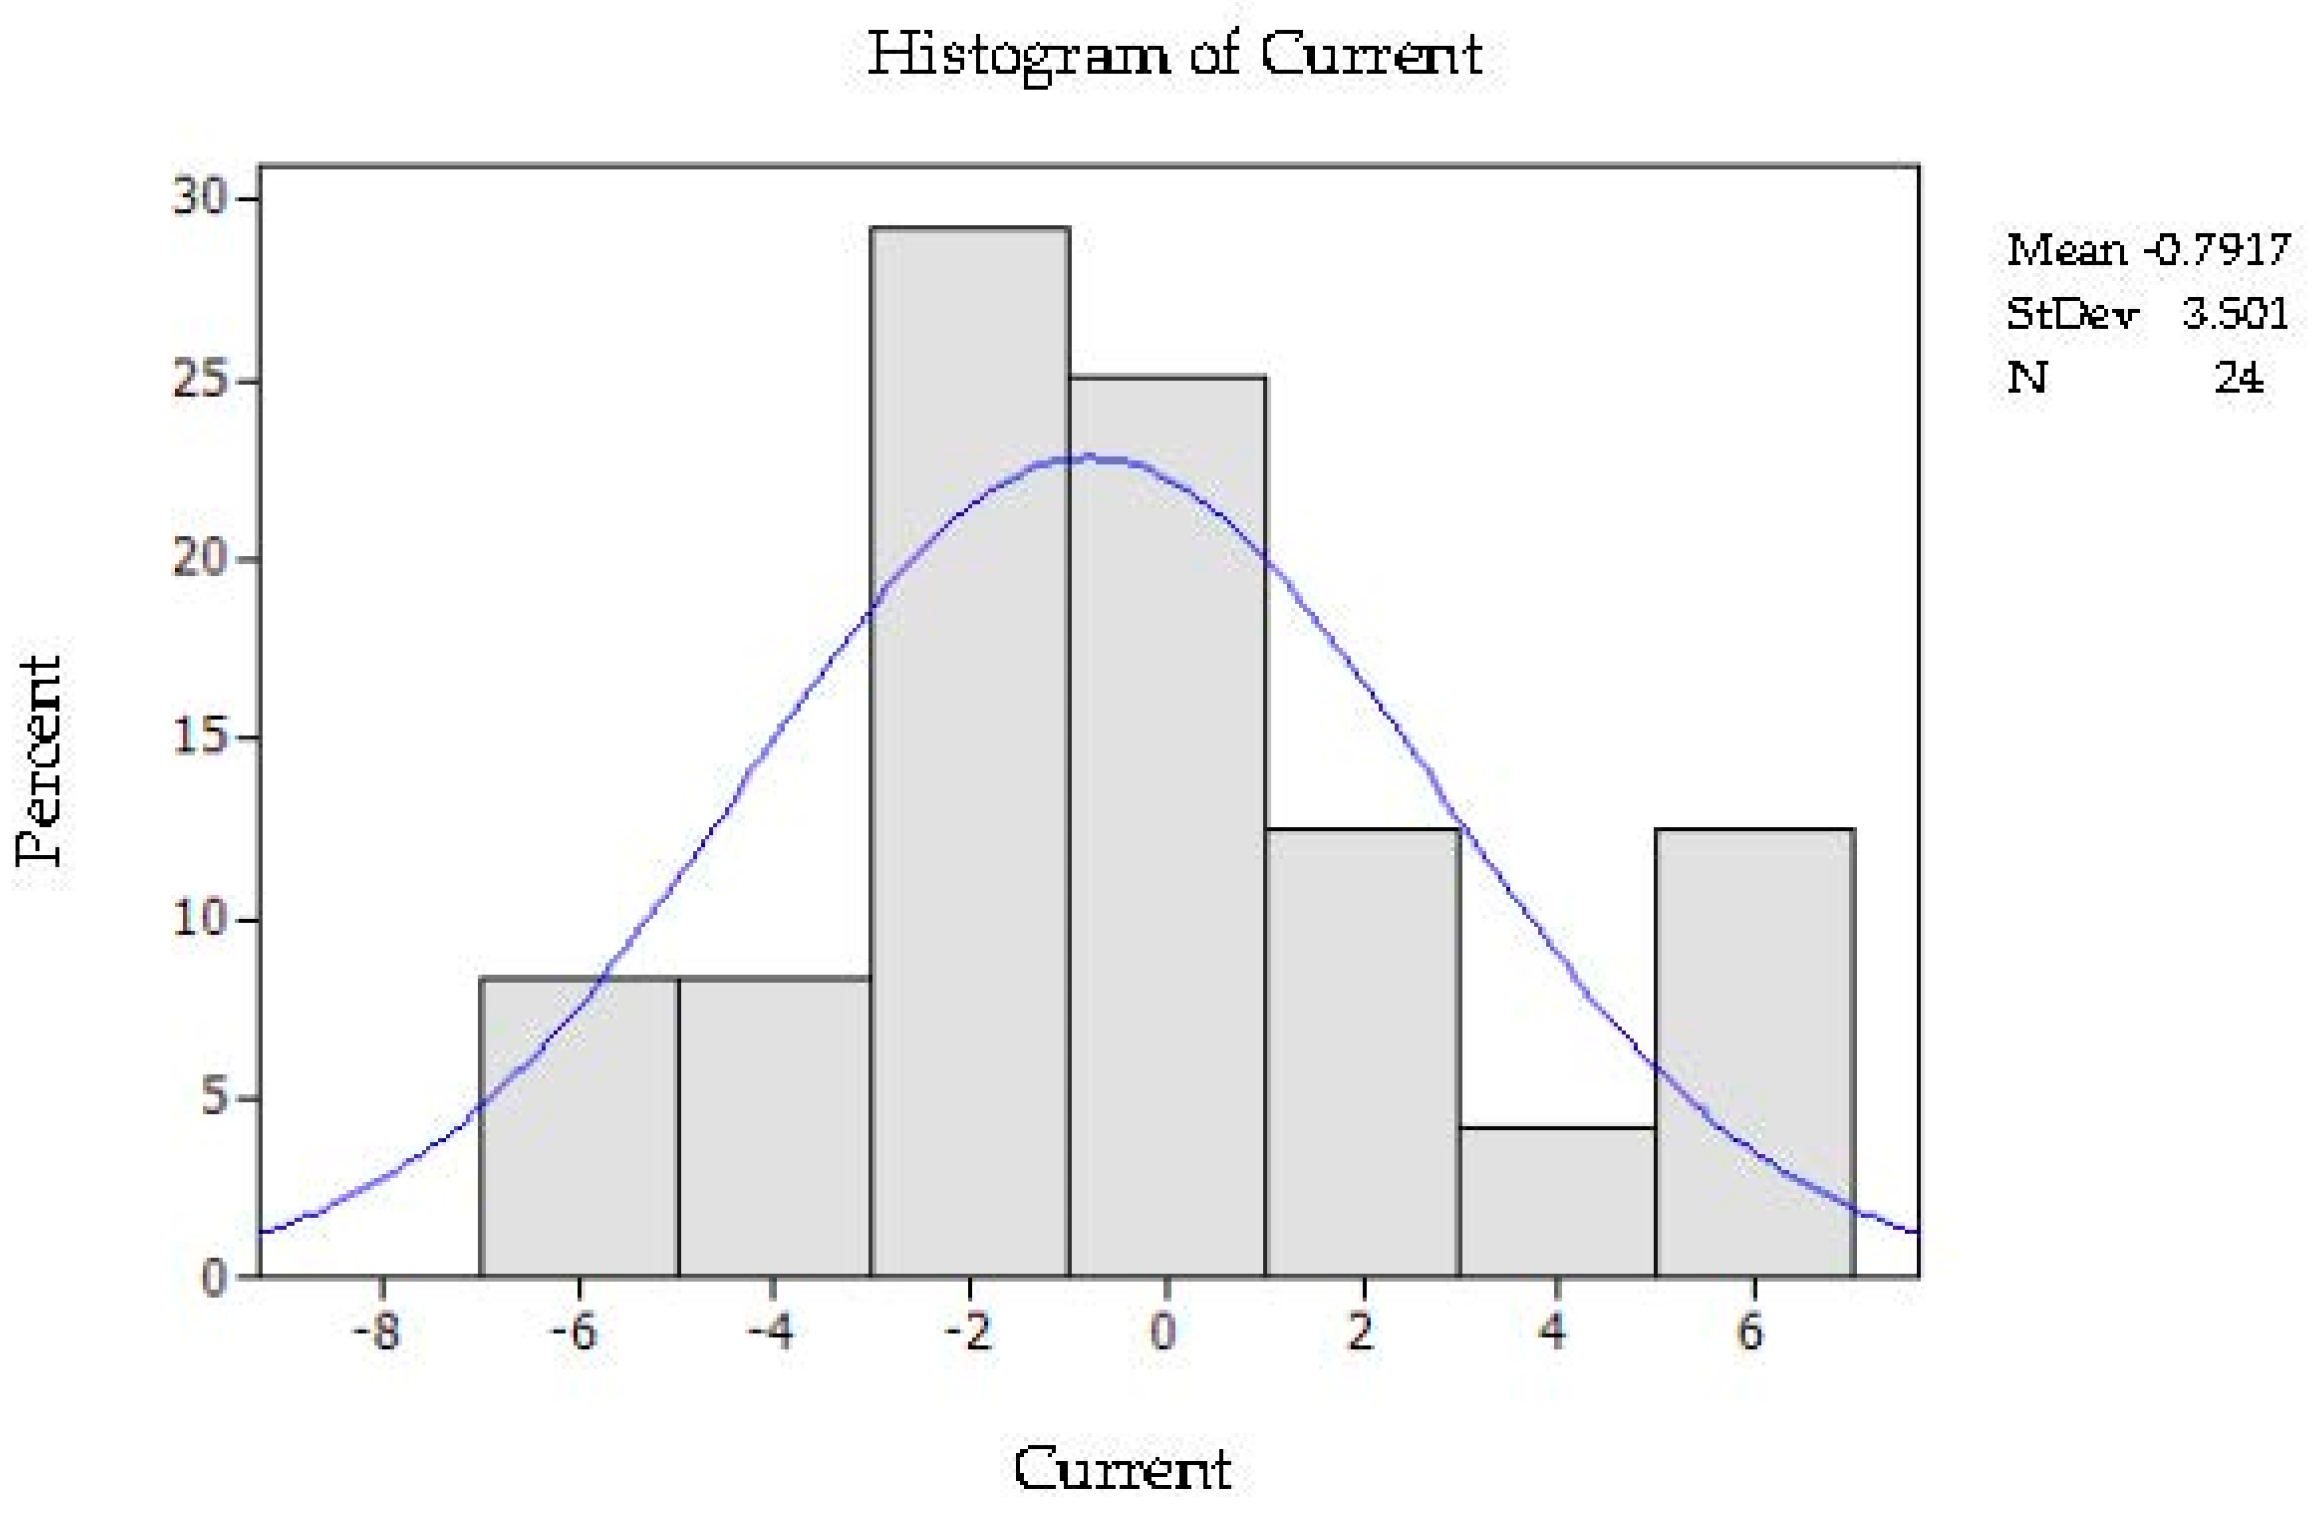
2.3. The Power System, Statistical Analysis

To find the optimal performance and establish a reference for power quality behavior based on the current fluctuations mentioned earlier in the electrical system, a statistical study was conducted using an experimental design with two factors and three variables. This study focused on analyzing the variations in voltage and currents resulting from changes in the powers (active, apparent, and reactive) that cause fluctuations, and an important alteration in the current behavior can be observed (Figure 6) through the histogram representation.
The behavior of current fluctuations in a general power supply was examined through a monitoring scheme using a network analyzer. The results of this analysis are presented in Figure 7, which reveals residual variations in the current with respect to the average and values that exceed the allowed limits for controlling the power quality. It is important to monitor and control the power quality to ensure the safe and efficient operation of electrical systems. Based on the data presented in Figure 7, additional measures can be implemented to improve the power quality. These measures may include adjusting voltage control techniques or installing supplementary filtering equipment.
According to the data established in Table 1, the analysis of variance (see Table 1) was performed with the Minitab statistical software [38].
Based on the analysis of variance (ANOVA), it can be concluded that higher current values are presented when inductive loads are operating within the system. This suggests that current fluctuations occur during periods when most equipment is in operation. In contrast, fewer fluctuations are generated when capacitors and lighting equipment are in operation.

2.4. Selection of the Elements

This section describes the design of the present study by analyzing the electrical characteristics of the system. It aims to explain in detail the calculation for the selection of control elements such as the capacitor bank, voltage and current filter, and photovoltaic system. The goal is to analyze the behavior of the electric power flow during the automatic integration of these elements and assess how they improve the conditions of the electric system, particularly in mitigating disturbances [39].

2.4.1. Capacitor Bank Selection

Knowing the active power (kW) and the power factor (Cos θ1) of an installation makes it very simple to determine the reactive power (kVar) of capacitors necessary to increase the power factor to a new value (Cos θ2). The power factor is a measure of the efficiency or performance of our electrical system. This indicator measures the energy utilization (the amount of energy required to transform into work) [40].
Q c = P ( t a n   1 t a n   2 )  
where:
Qc Reactive Power
P Active power
tan 1 Current Power Factor Angle
tan 2 Power factor angle to be improved
To determine the capacity of the capacitor bank, the average power factor has been taken into account, as indicated by the electricity bill (CFE) of the company MACEP. The recorded power factor is below the nominal allowed value of an 85.83% power factor. Additionally, the maximum capacity of the active power in the electrical system has been determined to be 189,442 kW.
Data:
Average power factor: 85.83%.
Desired power factor (nominal according to the standard): 90%.
Active power: 189,442 kW.
Apparent power: 500 kVA.
C o s   θ 1 = 0.8583 ;   θ = C o s 1   0.8583 = 30.87 °
C o s   θ 2 = 0.9 ;   θ = C o s 1   0.9 = 25.84   °
t a n   1   ( 30.87 ° ) = 0.577
t a n   2   ( 25.84 ° ) = 0.4842
Q c = P   ( t a n   1 t a n   2 )
Q c = 189.442   ( 0.599 0.4842 )
where
Cos θ1 Current Power Factor Angle
Cos θ2 Power factor angle to be improved
Therefore, a three-phase capacitor bank with a rating of 25 kVAr at 440 Vac has been selected based on the selection.
The load flow simulation of the electrical system was conducted using the Software for Analysis and Operation of Electrical Power Systems (ETAP) [41]. This software calculates the voltages at each bus and the power factors for different load types as well as estimates of the current flow for each bus by simulating the flow in each section of the load (Newton–Raphson and/or Gauss–Seidel [42]). Initially, the load flow began in a specific area to provide voltage and power values, as well as the operational percentage at the voltage.

2.4.2. Voltage and Current Filter Selection

One of the most widely used indexes is the total harmonic distortion applicable for both the current and voltage. This index is defined as the ratio between the r.m.s. value of the total harmonic components and the r.m.s. value corresponding to the fundamental [43]. For the current waveform, it will be:
T H D   1 = k = 2 I k 2 I 1 100 %  
Xc = h 2 h 2 1 Xeff  
C = 1 2 π fXc  
XL = Xc h 2
L = XL 2 π f  
Analysis to determine the control system using the voltage-current filter in the electrical system.
V L L = k V   b a s e V a . u = 13.2   kV 1   p . u . = 13.2   kV
X e f f = ( V l l s i s t ) 2 Q e f f = ( 13200 ) 2 25000 = 6.96   Ω
X c = h 2 h 2 1 X e f f = ( 10.34 ) 2 10.34 2 1 6.96 = 79.056   Ω
D a t a         M V A   B a s e = 250   MVA                       k V b a s e = 13.2   kV
Z b a s e = k V b a s e 2 M V A b a s e = 13.2 2 250 = 0.697 Ω  
C = 1 2 π f X c = 1 2 π 60 79.056 = 0.335   μ f
X L = X c h 2 = 79.056 10.34 2 = 0.739
L = X l 2 π f = 0.739 2 π 60 = 1.96 mH
R = X L h Q f = 1.96 10.34 20 = 1.013   Ω
X X L = X c h 2 = 79.056 10.34 2 = 0.739
I f u n d =   V l l s i s 3 X c X L = 7621 79.056 0.736 = 97   A
I 5 = 25 % I f u n = 24.25
I 7 = 15 % I f u n = 14.55
I 11 = 10 % I f u n = 9.7
I 13 = 5 % I f u n = 4.85
I t o t a l = ( 97 2 + 24.25 2 + 14.55 2 + 9.7 2 + 4.85 2 ) = 101.62   A
% C u r r e n t   M a r g i n = I t o t a l I f u n 100 = 101.62 97 100 = 104.76 %          
Itotalrms = 104.76% Ifun ≤ 135% Ifun established in the standard.IEEE-519-2022 It is within the norm.
V c ( 1 ) = I f u n X c = 97 79.056 = 7.668   kV
V c ( h ) = h I h 5
V c ( 5 ) = 24.25 79.056 5 = 0.3843   kV
V c ( 7 ) = 14.55 79.056 7 = 0.164   kV
V c ( 11 ) = 9.7 79.056 11 = 0.069   kV
V c ( 13 ) = 4.85 79.056 13 = 0.0295   kV
V c ( h ) = 0.6455   kV
V c l . n t o t a l   p e a k = 2 V c ( 1 ) + V c ( h ) = 2 ( 7.688 + 0.6455 ) = 11.75   kV
V l . N p e a k = V L L 3 = 13.2 3 = 7.62   kV
                  V L . N p e a k   s i s = 2 V L . N s i s = 2 7.62 = 10.77   kV
Vcl.ntotal peak—peak total voltage
Vl.Npeak—Maximum voltage
VL.npeak sis –Maximum symmetrical voltage
% C u r r e n t   V o l t a g e = V c l N t o t a l   p e a k V L N p e a k   s i s 100 = 11.75 10.77 100 = 109.1 %  
Vtotalrms = 109.1% Vfun ≤ 110% Vfun established in the standard.IEEE-519-2022 It is within the norm.
where:
THD 1Harmonic distortionVllsisSupply voltage
IkRated currentIfundFundamental Current
I1Maximum currentRResistance
XcCapacitive reactanceItotalCurrent Total
hFundamental currentVc(h)Fundamental Voltage
XeffEffective reactanceVcl ntotal peakPeak total Voltage
CCapacitanceVl.Npeak sisVoltage Peak System
fFrequencyVl. NsisNominal Voltage
LInductance%Current VoltageCurrent Voltage
VLLBase Voltage
Va.u.Voltage per unit

2.4.3. Photovoltaic System Selection

The design of a photovoltaic system was carried out with the goal of improving the electric energy consumption [44].
N u m b e r   o f   P V   p a n e l s = E c V o c I s c H . S . P .  
N u m b e r   r o w s   i n   s e r i e s = V i n v V m  
N u m b e r   o f   p a r a l l e l   b r a n c h e s = I i n v I m  
I n v e r t e r   P o w e r = N u m b e r   o f   P V   p a n e l s P o w e r   o f   P a n e l s  
where:
EcDaily energy consumptionVinvInverter voltage
VocOpen circuit voltageVmPanel rated voltage
IscShort circuit currentIinvInverter current
H.S.P.Peak sun hoursImPanel rated current
This improvement is focused on the performance and operation of the most power-intensive equipment, which accounts for only 53% of the total consumption. In terms of general consumption, an average of 26,284 kWh is estimated. Taking into account the 53% estimate, only 13,930 kWh is considered for the design of the photovoltaic system. Since the tariff of the electrical system is monthly, the calculation for the photovoltaic system is based on daily consumption. As a result, a total consumption estimate of 464,350 kWh is obtained.
N u m b e r   o f   P V   p a n e l s = E c V o c I s c H . S . P . = 464350   Wh 49.8 10.36 5.4 = 167   p a n e l s  
N u m b e r   r o w s   i n   s e r i e s = V i n v V m = 650 49.8 = 13   p a n e l s  
N u m b e r   o f   p a r a l l e l   b r a n c h e s = I i n v I m   175 10.36 = 16.89   b r a n c h e s  
Inverter Power= 167 panels ∗ 515 watts = 86005 watts
Each of the main data are taken into account by integrating them into each block of the main power supply system connection. These data are obtained from the supplying company (CFE) and include the following: a power rating of 25 MVA, a supply voltage of 13,200 Vac, positive sequence reactance of 2498 + 3123j, and a delta connection obtained from the load flow in the system simulation. Additionally, the conduction and protection elements are integrated, consisting of a copper insulating feeder type BusDuct and a 15 kV fuse with a nominal current of 10 A. Finally, a 500 kVA main step-down transformer is used, with a primary power supply of 13,200 Vac and a secondary voltage of 440 Vac. The impedance settings of the transformer have also been taken into account and included in the data.
Once the data for the load flow simulation process are provided, the system is run through to analyze the peak currents at each of the buses that make up the system, starting from the main protection fuse (Fuse 1) on the high side (13,200 Vac). The display options for the study of the flow are selected from the display (Display Options); they include the active power, apparent power, current flow, and combinations of these parameters. Additionally, the power factor is analyzed in each section (bus) of the system. In this case, it has been decided to carry out the study with respect to the active power and reactive power (kW + kVAr) in the main supply section and the maximum load section (bus 9). In the supply section, a maximum active power of 246.2 + j142 is observed, which represents the active and reactive power of the system according to the load flow. Considering that the maximum active power is approximately 255 kW, it indicates an operational percentage of 97.9% of the total load on bus 4.
Figure 8 shows the one-line diagram elaborated in the simulation software that integrates the connection of the supplying company (CFE) to the main substation. The diagram consists of a fuse blade interconnected in bus 1 (main bus), passing through a wiring duct of the 13,200 Vac voltage line to the general step-down transformer of 13,200 Vac to 440 Vac with a power of 0.5 MVA. This connection is connected to a main load center for the distribution of circuits that integrates the electrical system.
The simulation of the load flow in the electrical system calculates the voltages in each of the buses and the different power factors in each derivation according to the type of connected load, and it also provides an estimate of the current flow for each bus by simulating the flow in each section of the load. First, the starting area of the load flow is selected to determine the voltage and power values, as well as the percentage of operation at the voltage levels, as shown in Figure 9.
The study of the current flow and power factor has been carried out by analyzing the results in the main supply (Fuse 1, 13,200 Vca). The analysis shows a maximum current of 12.5 A and a power factor of 76.52%. The power factor value is considered to be very low according to the control, as it should be up to 90%. Additionally, in bus 4, the current is measured to be 374.3 A with a power factor of 74.56%.
The proposal is to develop a control system using contactors and relays; the objective is to provide an intelligent and cost-effective control by monitoring the electrical parameters of the voltage and current. The system will respond to changes caused by the consumption of different connected loads. To achieve this, a control algorithm is developed to activate the necessary elements and regulate variations and potential issues that may arise from fluctuations in load operation, specifically regulating the power factor. The control method also aims to integrate the sizing of a photovoltaic system, which should contribute to the regulation of the elements with higher energy consumption. Figure 10 shows this concept.
In order to design the control system and considering the operating conditions as shown in Table 2, which includes equipment that generates disturbances in power quality such as a low power factor, voltage and current fluctuations, and power consumption, control elements such as the capacitor bank, voltage and current filter, and photovoltaic system are connected according to the design of the control system on bus 4 (0.44 kV main bus). These elements are integrated into the main bus (bus 4), which corresponds to the connection bus of all the equipment with respect to the current flow in the bypass bus of the control elements with a current of 424.3 A and 8.52% as well as the flow in each case for the capacitor bank of 330.8 A and −11.6%, 30.6 A and −59.66% for the flow of the voltage and current filter current, and finally, the flow in the photovoltaic system with a current of 116 A generation and 80% contribution to the system (Figure 11).
Within this proposal, it has been considered to integrate the operating conditions of the equipment through the interlocking of contactors and relays (CR5 capacitor bank, CR7 voltage and current filter, CR8 photovoltaic system, connected to bus 4) for control, conditioned to operate according to the specific requirements of the MACEP’s operation, as shown in Table 2.

3. Results and Discussion

According to the analysis of the results, we can conclude that implementing the control system in the automation by means of the work combinations, through the combination of various elements, leads to improved performance in terms of current–voltage fluctuations and a higher power factor compared to the main transformer. The voltage and current filter (HF3), along with the integration of the photovoltaic system (PVA3), demonstrates better power quality conditions both on the high side of the transformer T1 and on the low side at bus 4.
On the other hand, when analyzing the automation of the other elements in general, disturbances in both the power factor and the voltage–current are presented.

3.1. Simulation 1 of 7: The Automation Scheme Energizing Only the Capacitor Bank

As shown in Figure 12a,b, when only the capacitor bank (CAP 3) is energized (Figure 12a), the current in the supply bus on the primary side of the main transformer T1 (13,200 Vac) is 12.9 A with a power factor of −93.42%. On the low side of the transformer T1, the current is 386.8 A with a power factor of −92.17%.
The final characteristics in terms of the waveform formation are regular, as shown in Figure 12b below. When waveforms deviate from a sinusoidal waveform, they contain harmonics, so the waveforms in the simulation part clearly show that they have higher harmonics.

3.2. Simulation 2 of 7: Energizing Only the Voltage and Current Filter

Energizing only the voltage and current filter (Figure 13a), we can observe a current on the high side of transformer T1 of 12.6 A and a power factor of 90.06%. Similarly, on the low side of transformer T1, we recorded data with a current of 377.9 A and a power factor of 91.1%. The final characteristics in terms of the waveform formation are irregular, as shown in Figure 13b. The waveforms of the simulation part clearly show that they have higher harmonics.

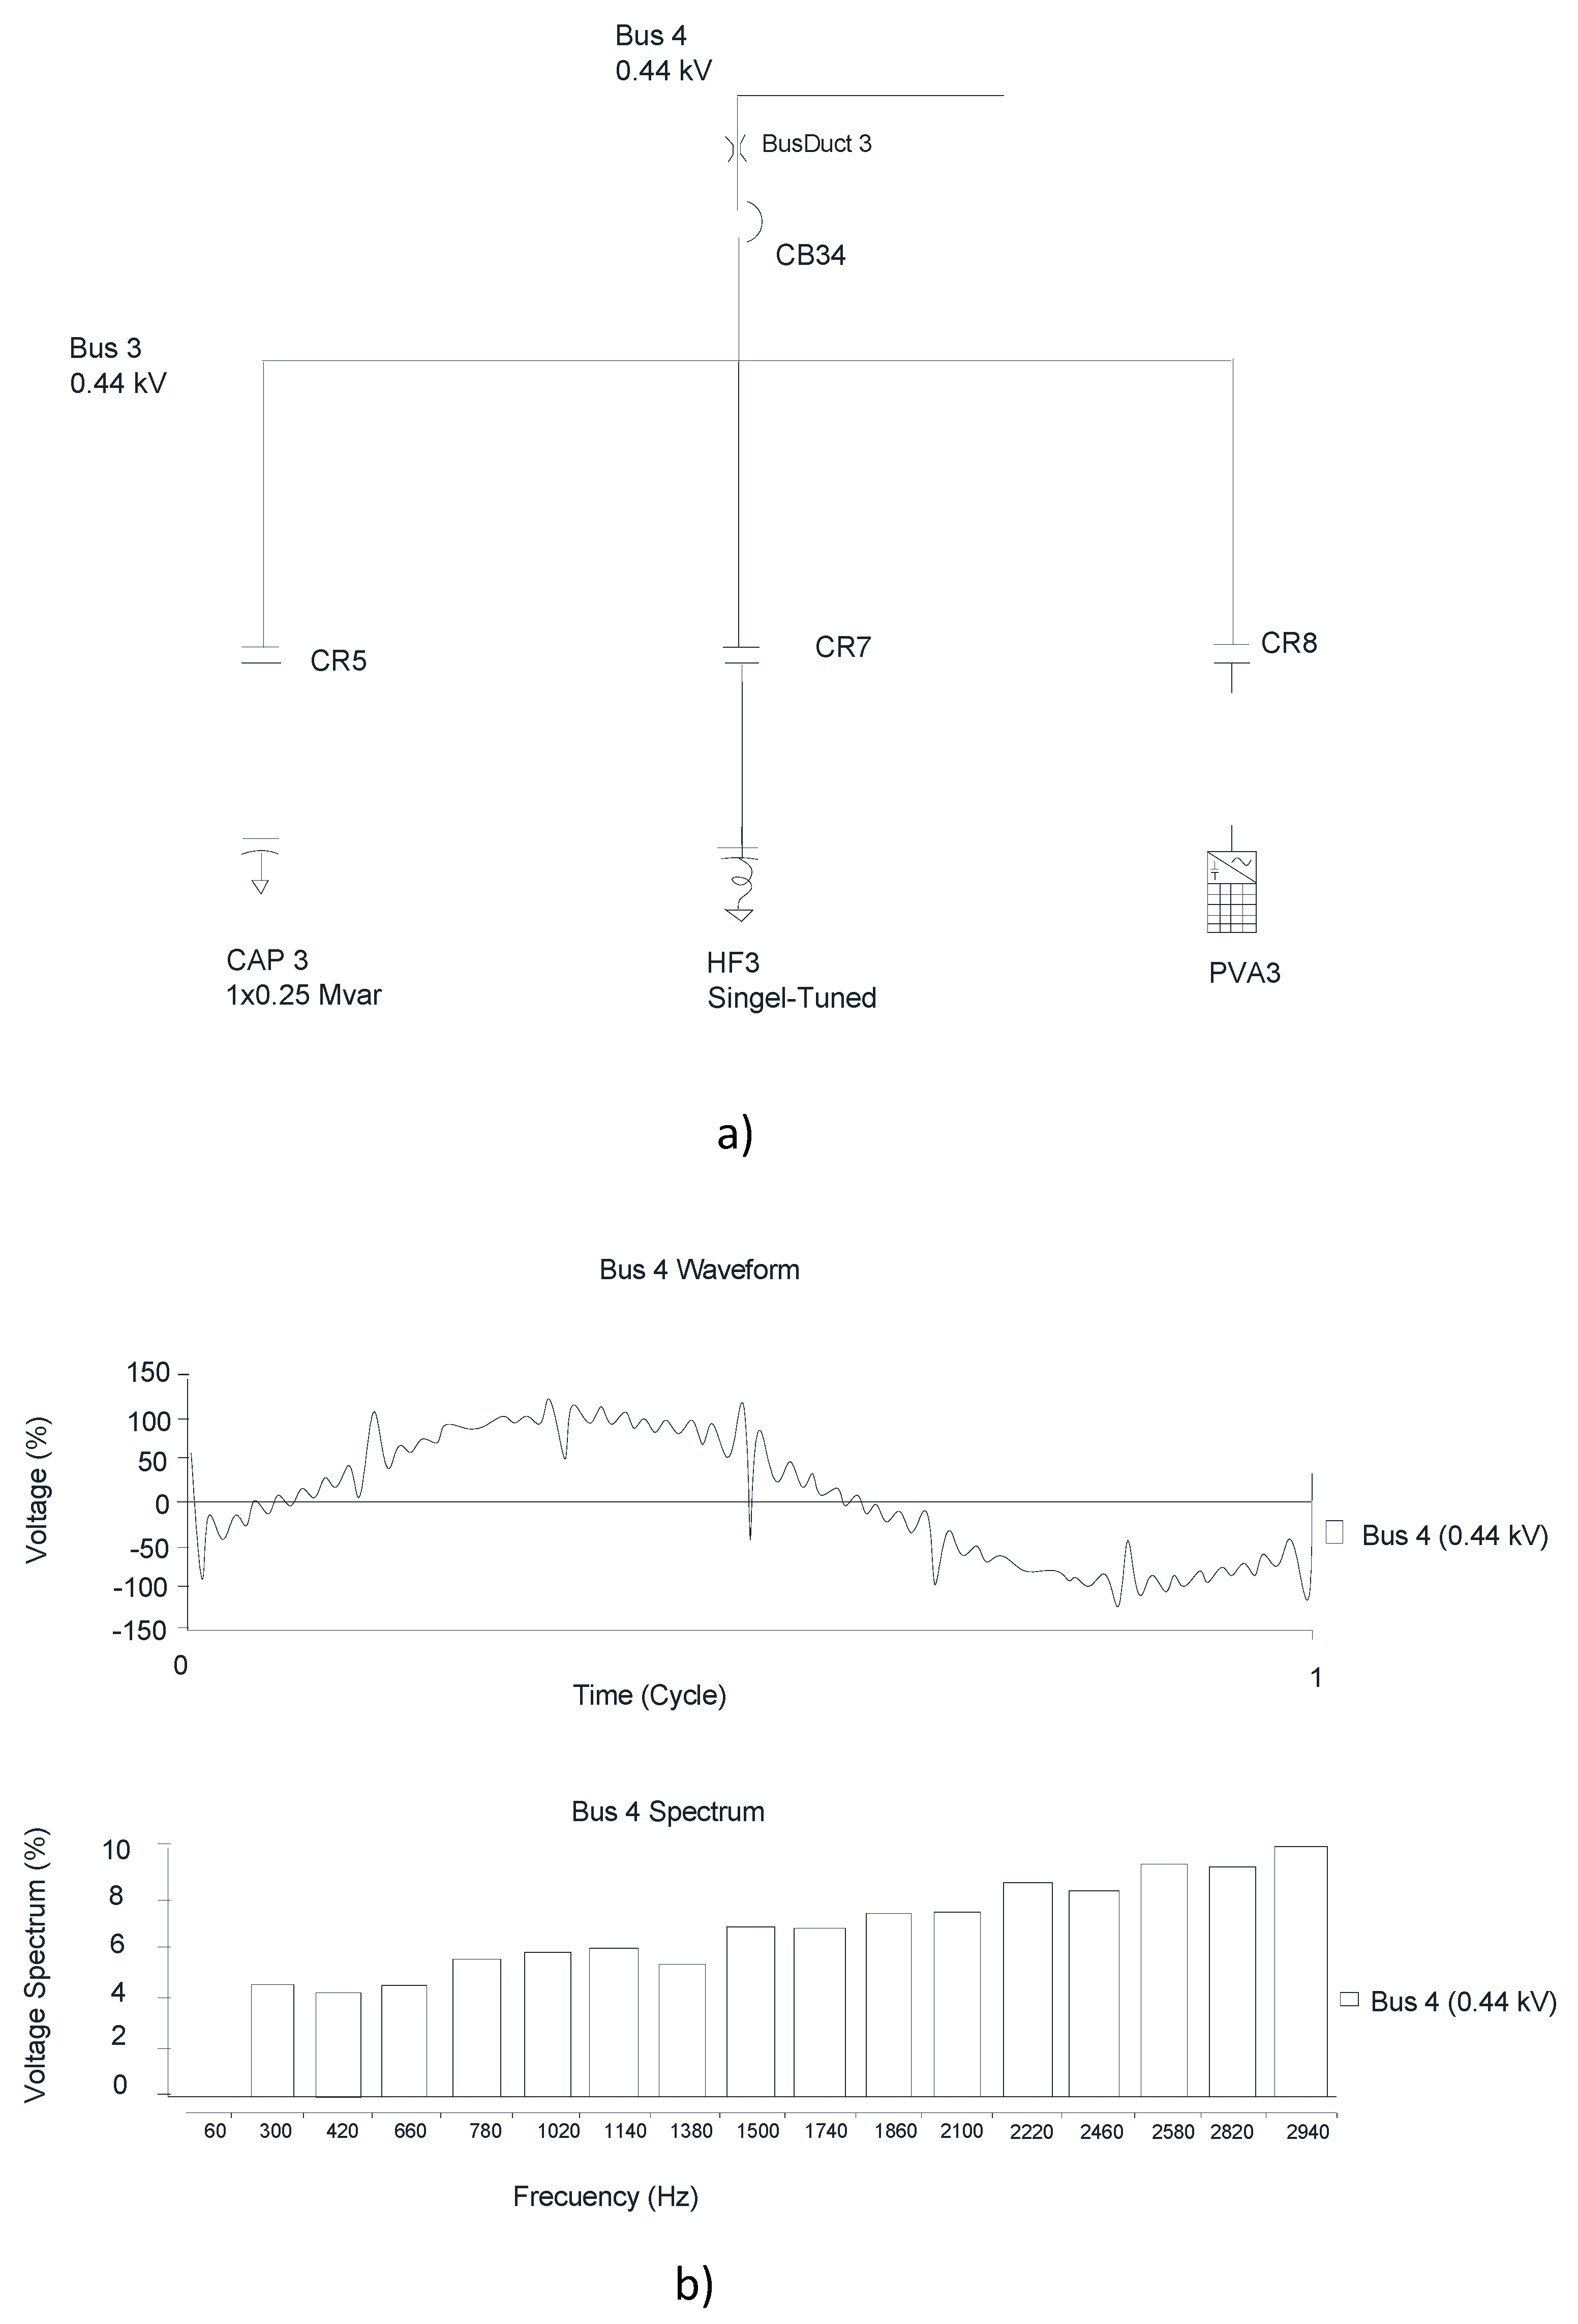
3.3. Simulation 3 of 7: Energizing Only the Photovoltaic System

According to the control system, when the conditions for energizing the photovoltaic system are met, the results show a current on the high side of transformer T1 of 8.4 A and a power factor of 89.94%. On the low side of transformer T1, the data registered show a current of 252.4 A and a power factor of 90.63%. The formation of the final waveform is irregular, as shown in Figure 14b. The waveforms of the simulation part clearly show that they have higher harmonics.

3.4. Simulation 4 of 7: Energizing the Capacitor Bank Together with the Voltage and Current Filter

The data recorded in the simulation, connecting the capacitor bank (CAP3) with the voltage and current filter (HF3) (see Figure 15a), show that on the high side of the main transformer T1, the current is 13.8 A and the power factor is −90.03%. On the low side of the transformer T1, the recorded data show a current of 413.2 A and a power factor of −90.56%, indicating a higher inductive load. The formation of the final waveform is regular, as shown in Figure 15b below. The waveforms of the simulation part clearly show that they have higher harmonics.

3.5. Simulation 5 of 7: Energizing the Capacitor Bank Together with the Photovoltaic System

In the system control simulation, both the capacitor bank (CAP3) and the photovoltaic system (PVA3) are energized simultaneously to analyze the behavior of the main variables, as shown in Figure 16a. The data recorded from this simulation were taken into account, showing that on the high side of the main transformer T1, the current is 11.5 A with a power factor of −77.65%; and on bus 4, the recorded data show a current of 344.2 A with a power factor of −75.87%. The formation of the final waveform is regular, as depicted in Figure 16b. The waveforms of the simulation part clearly show that they have higher harmonics.

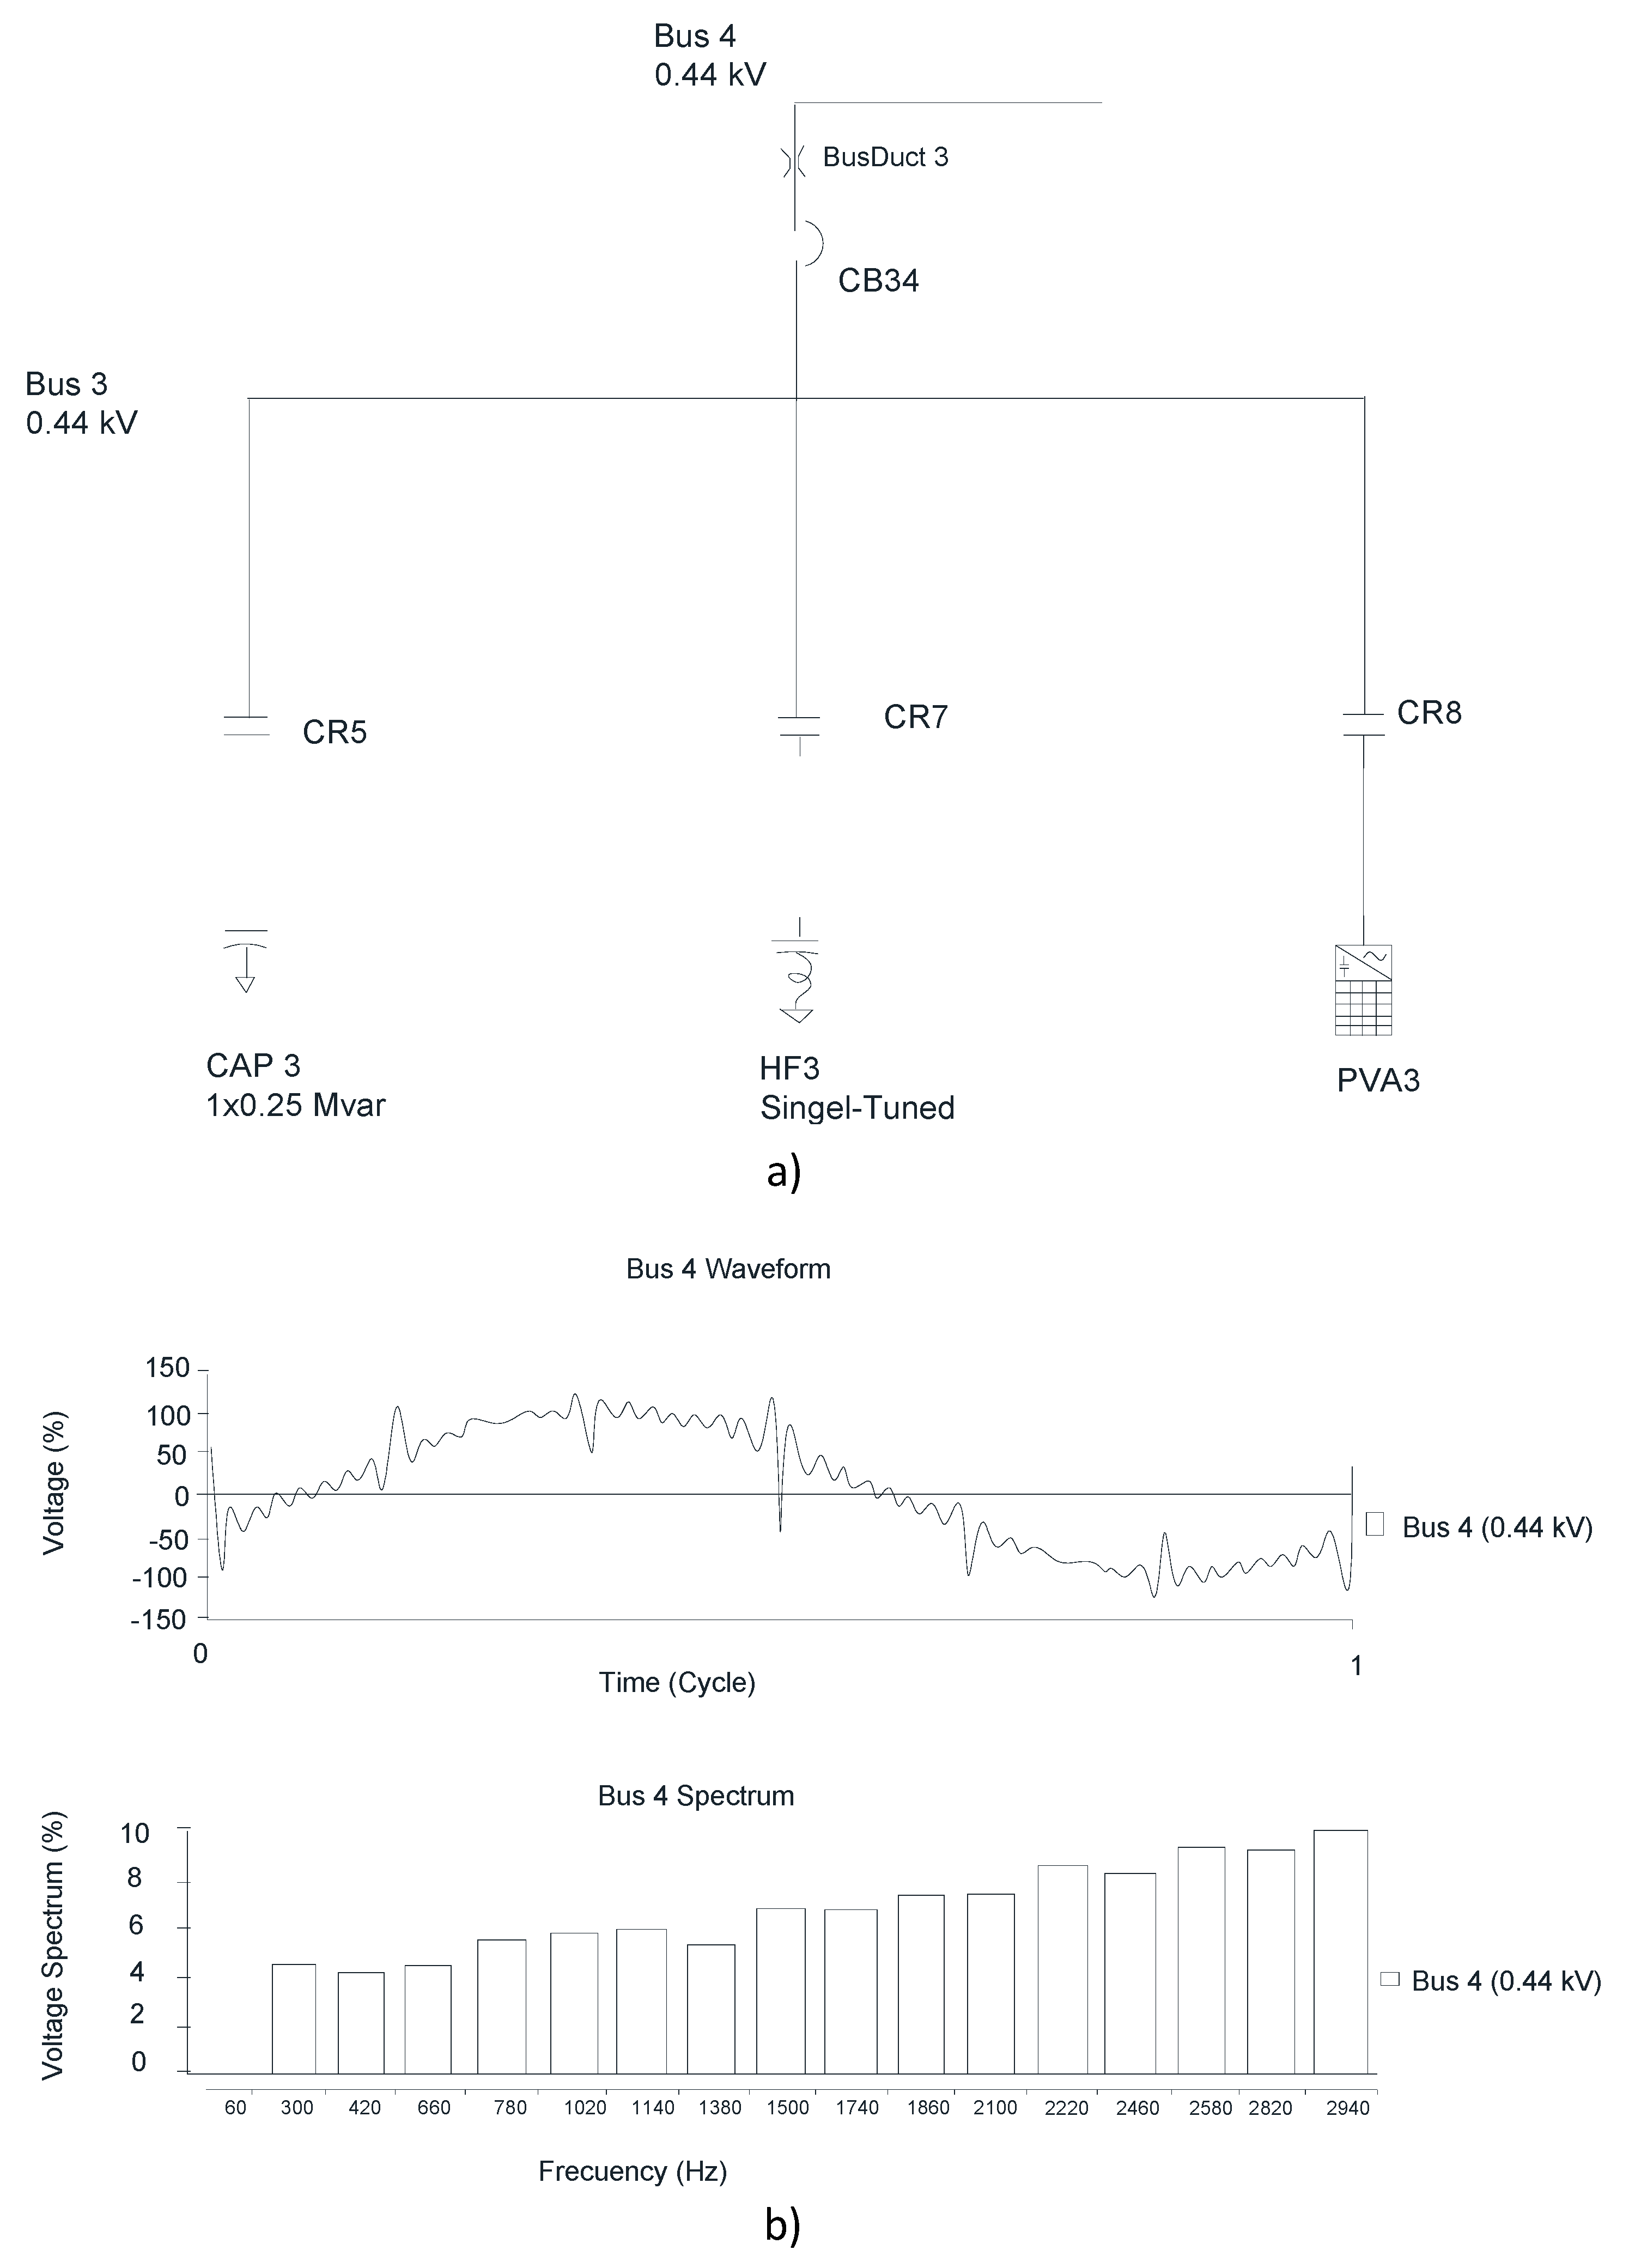
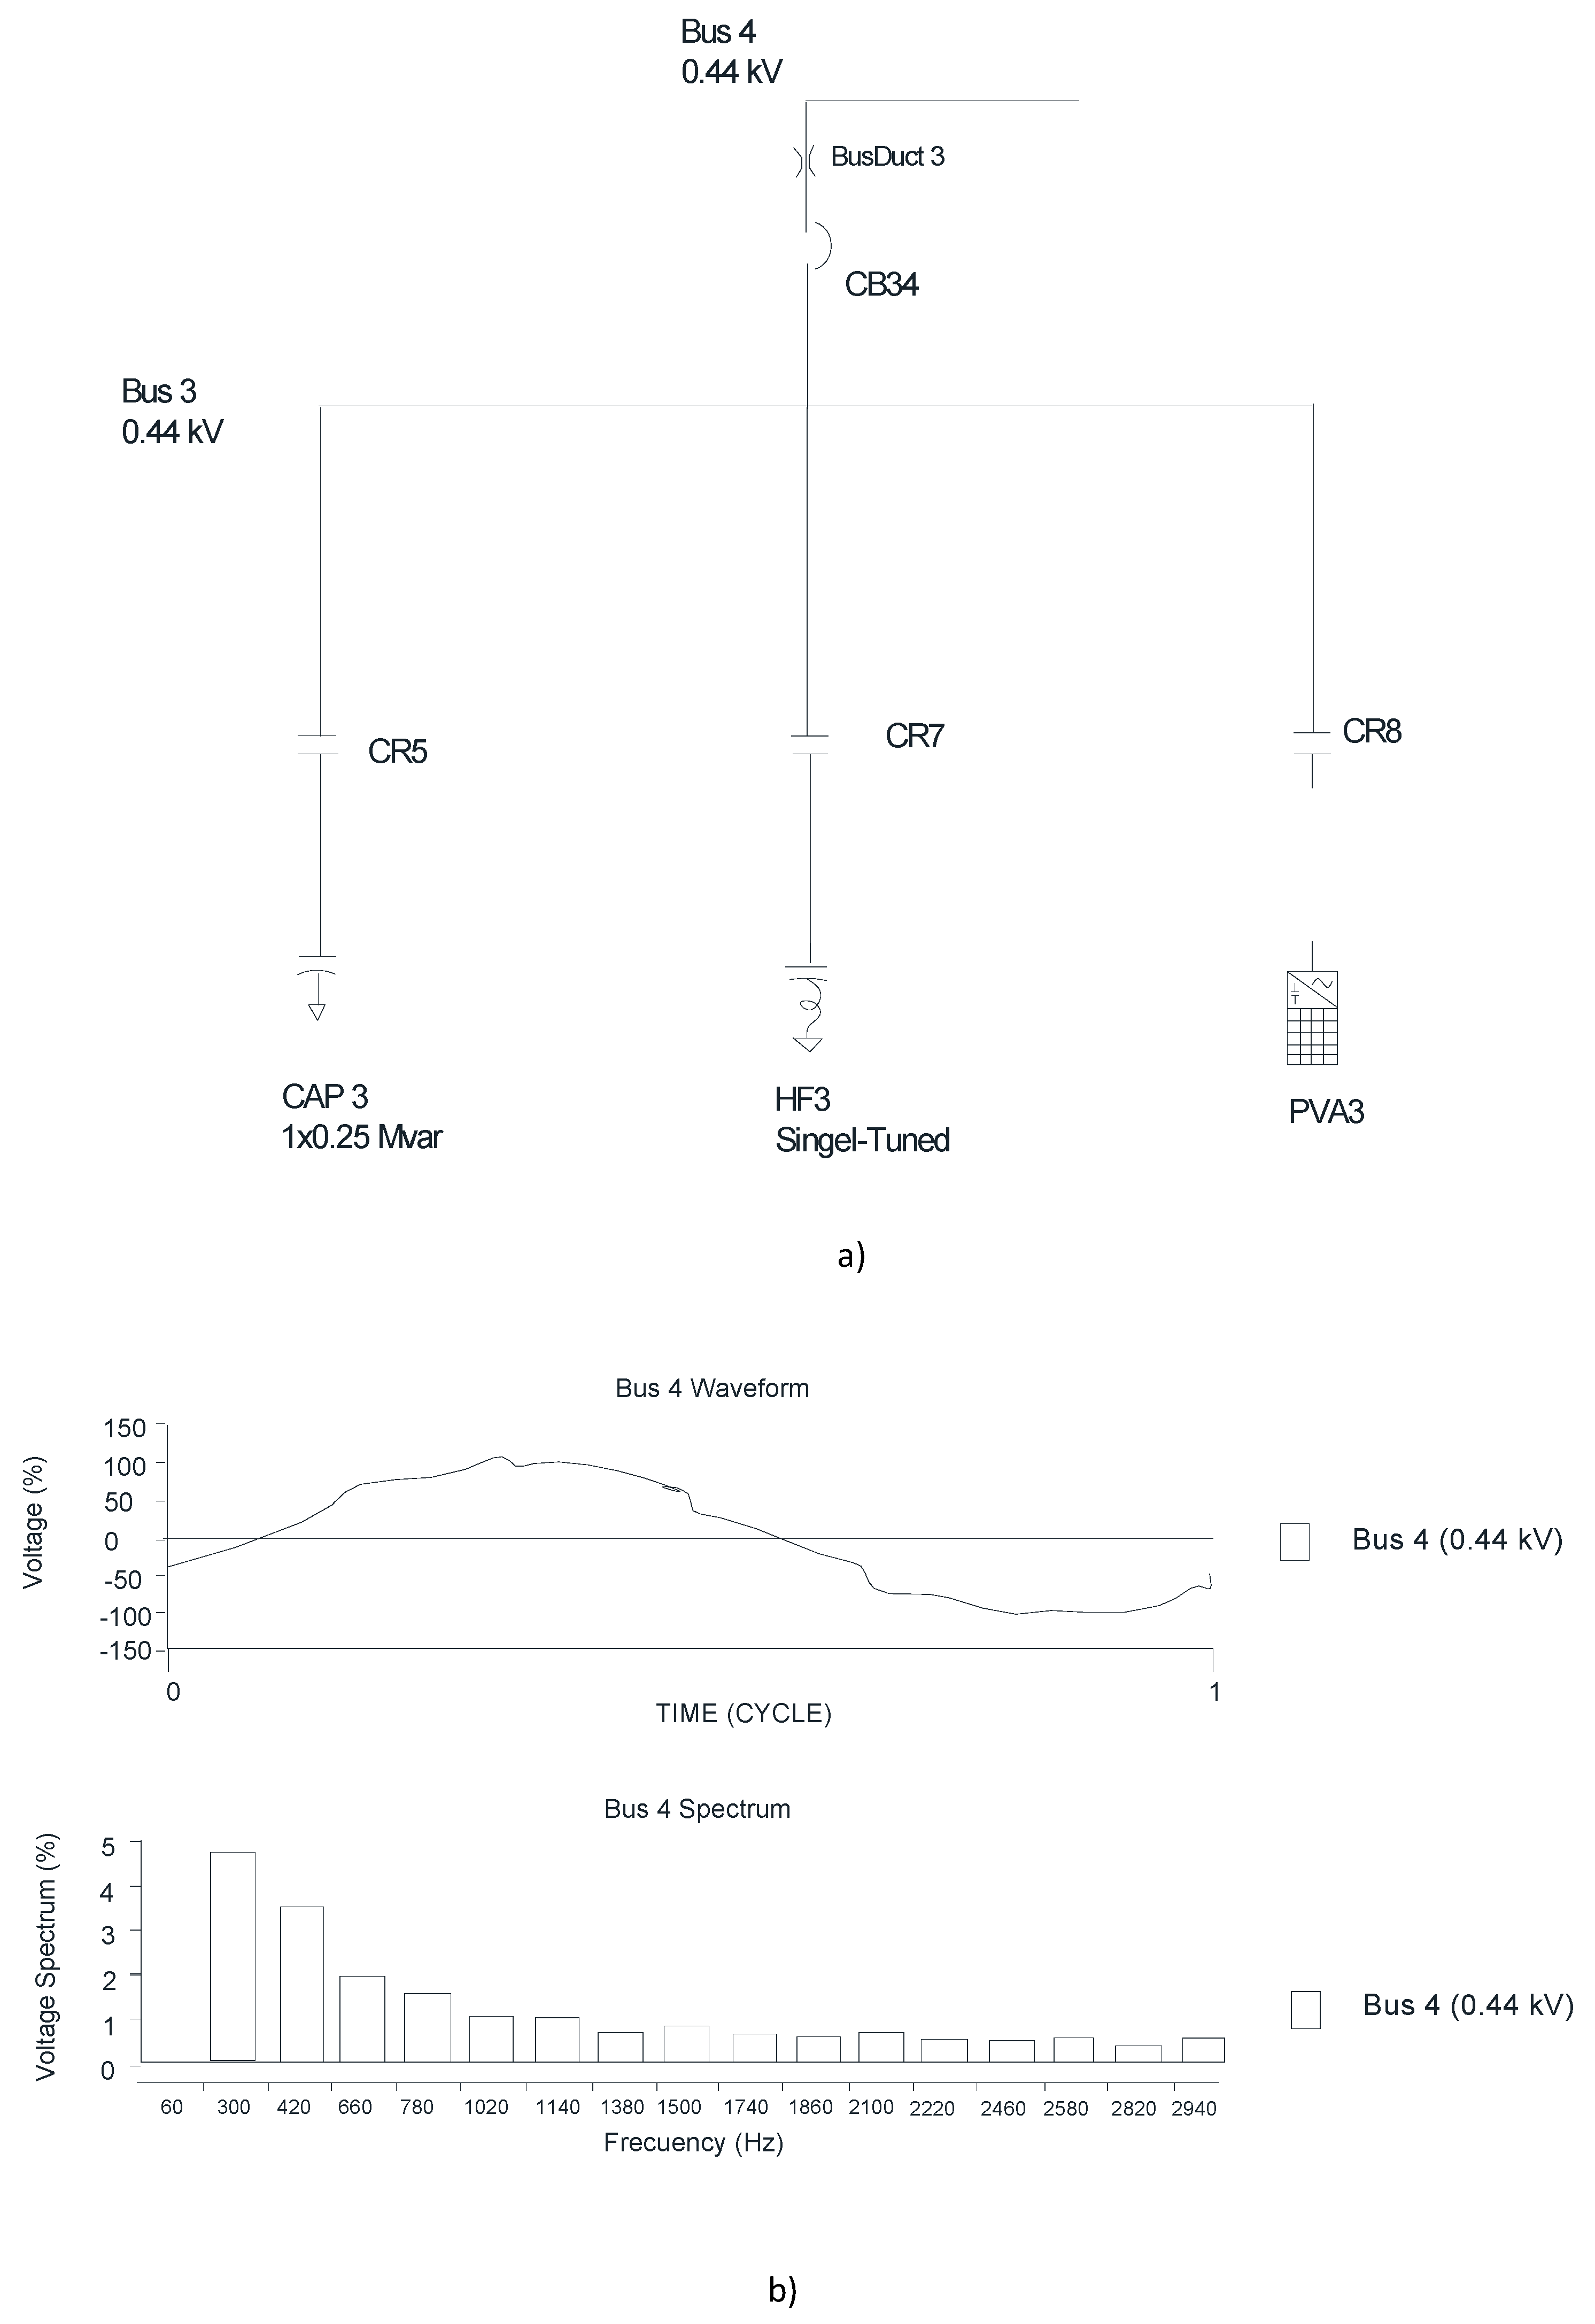
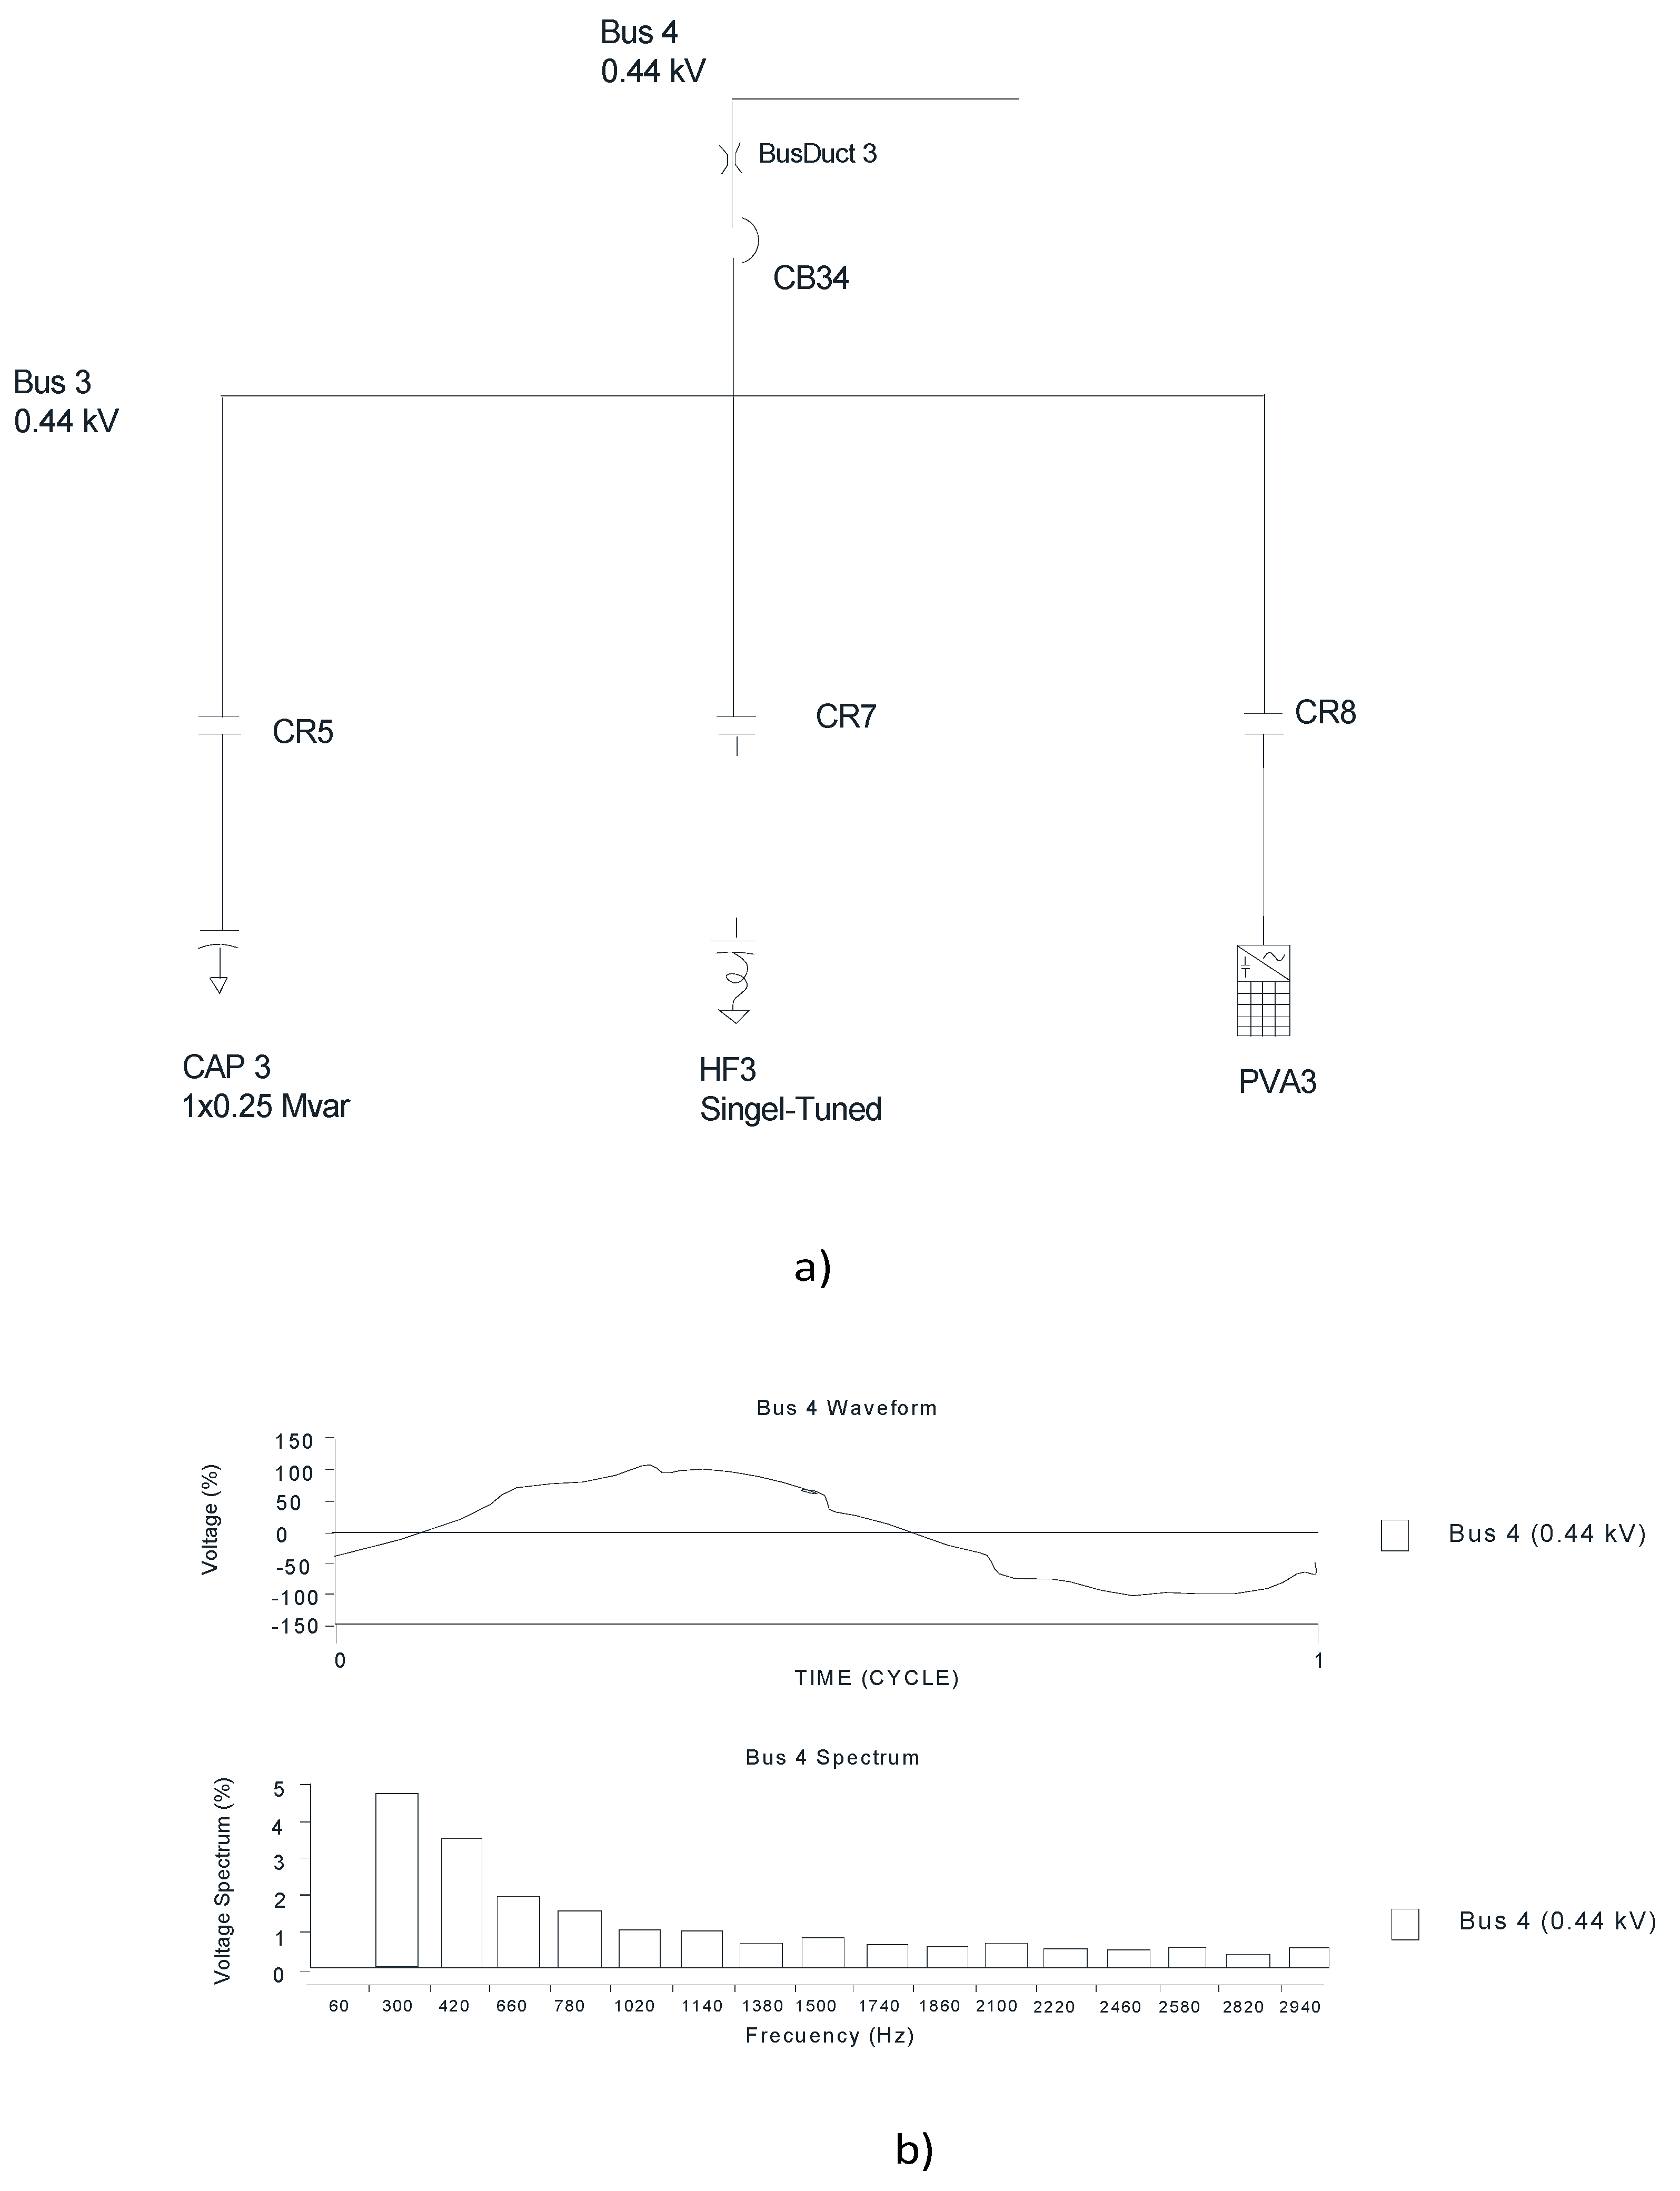
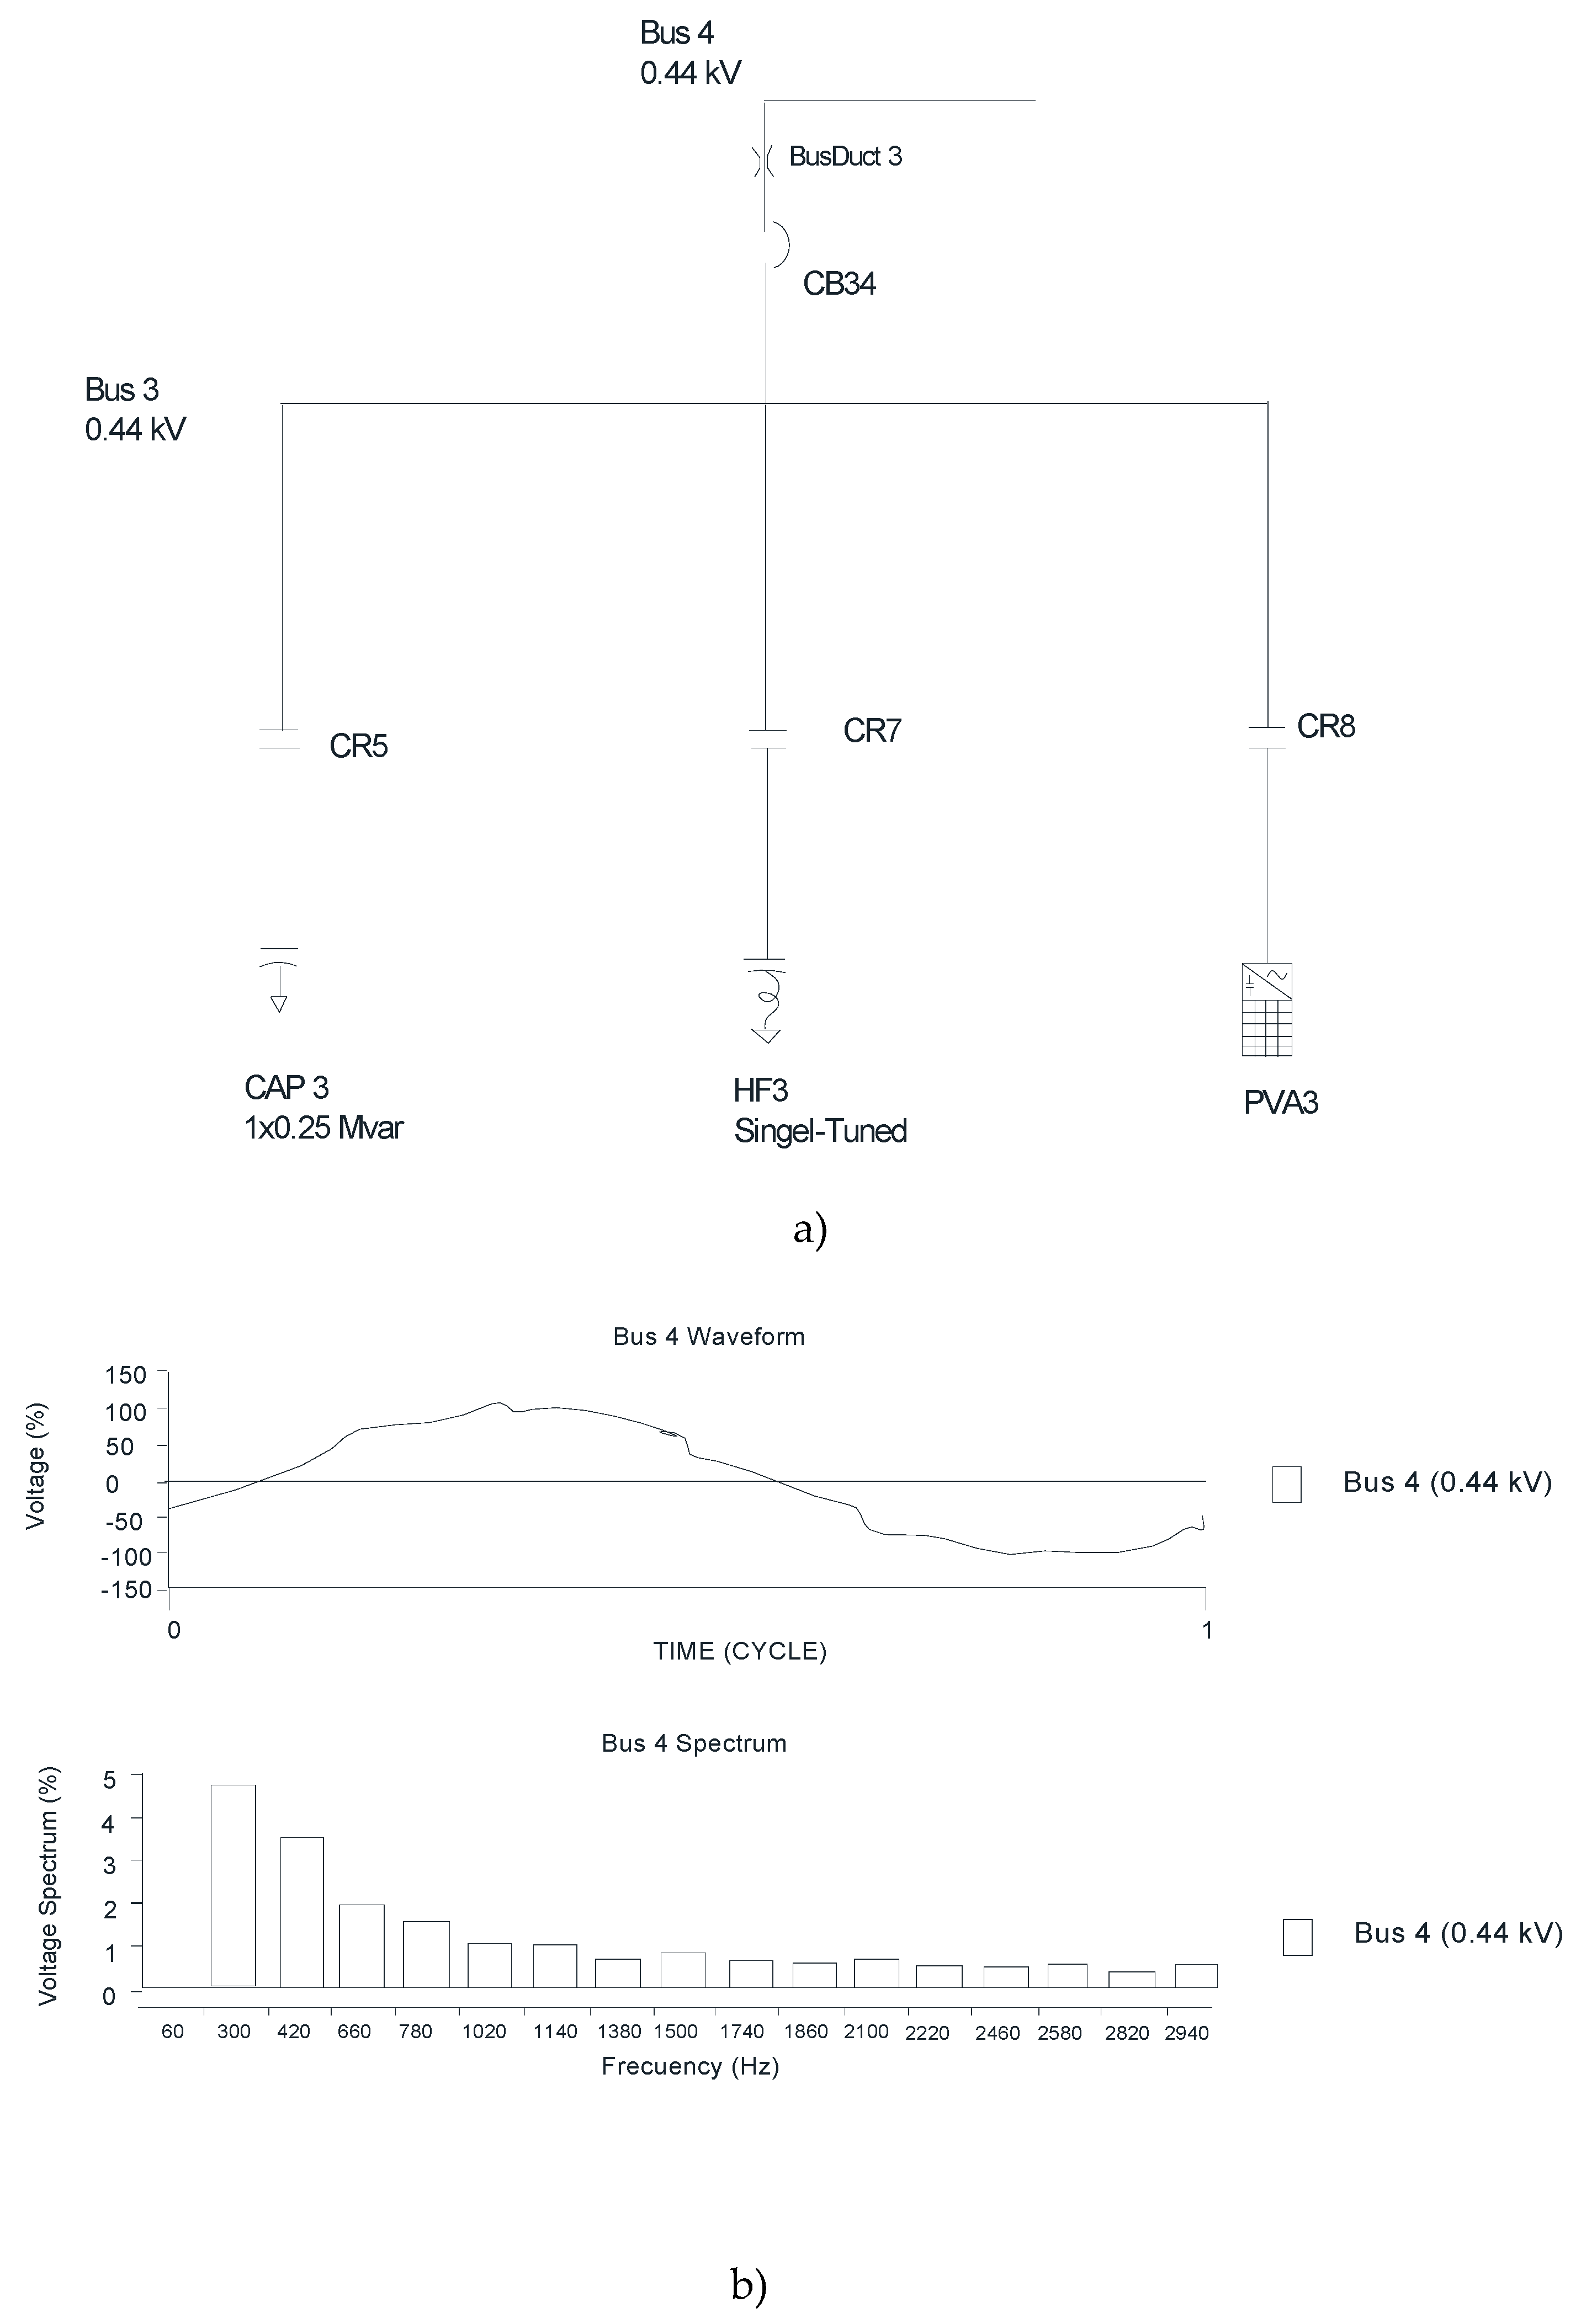
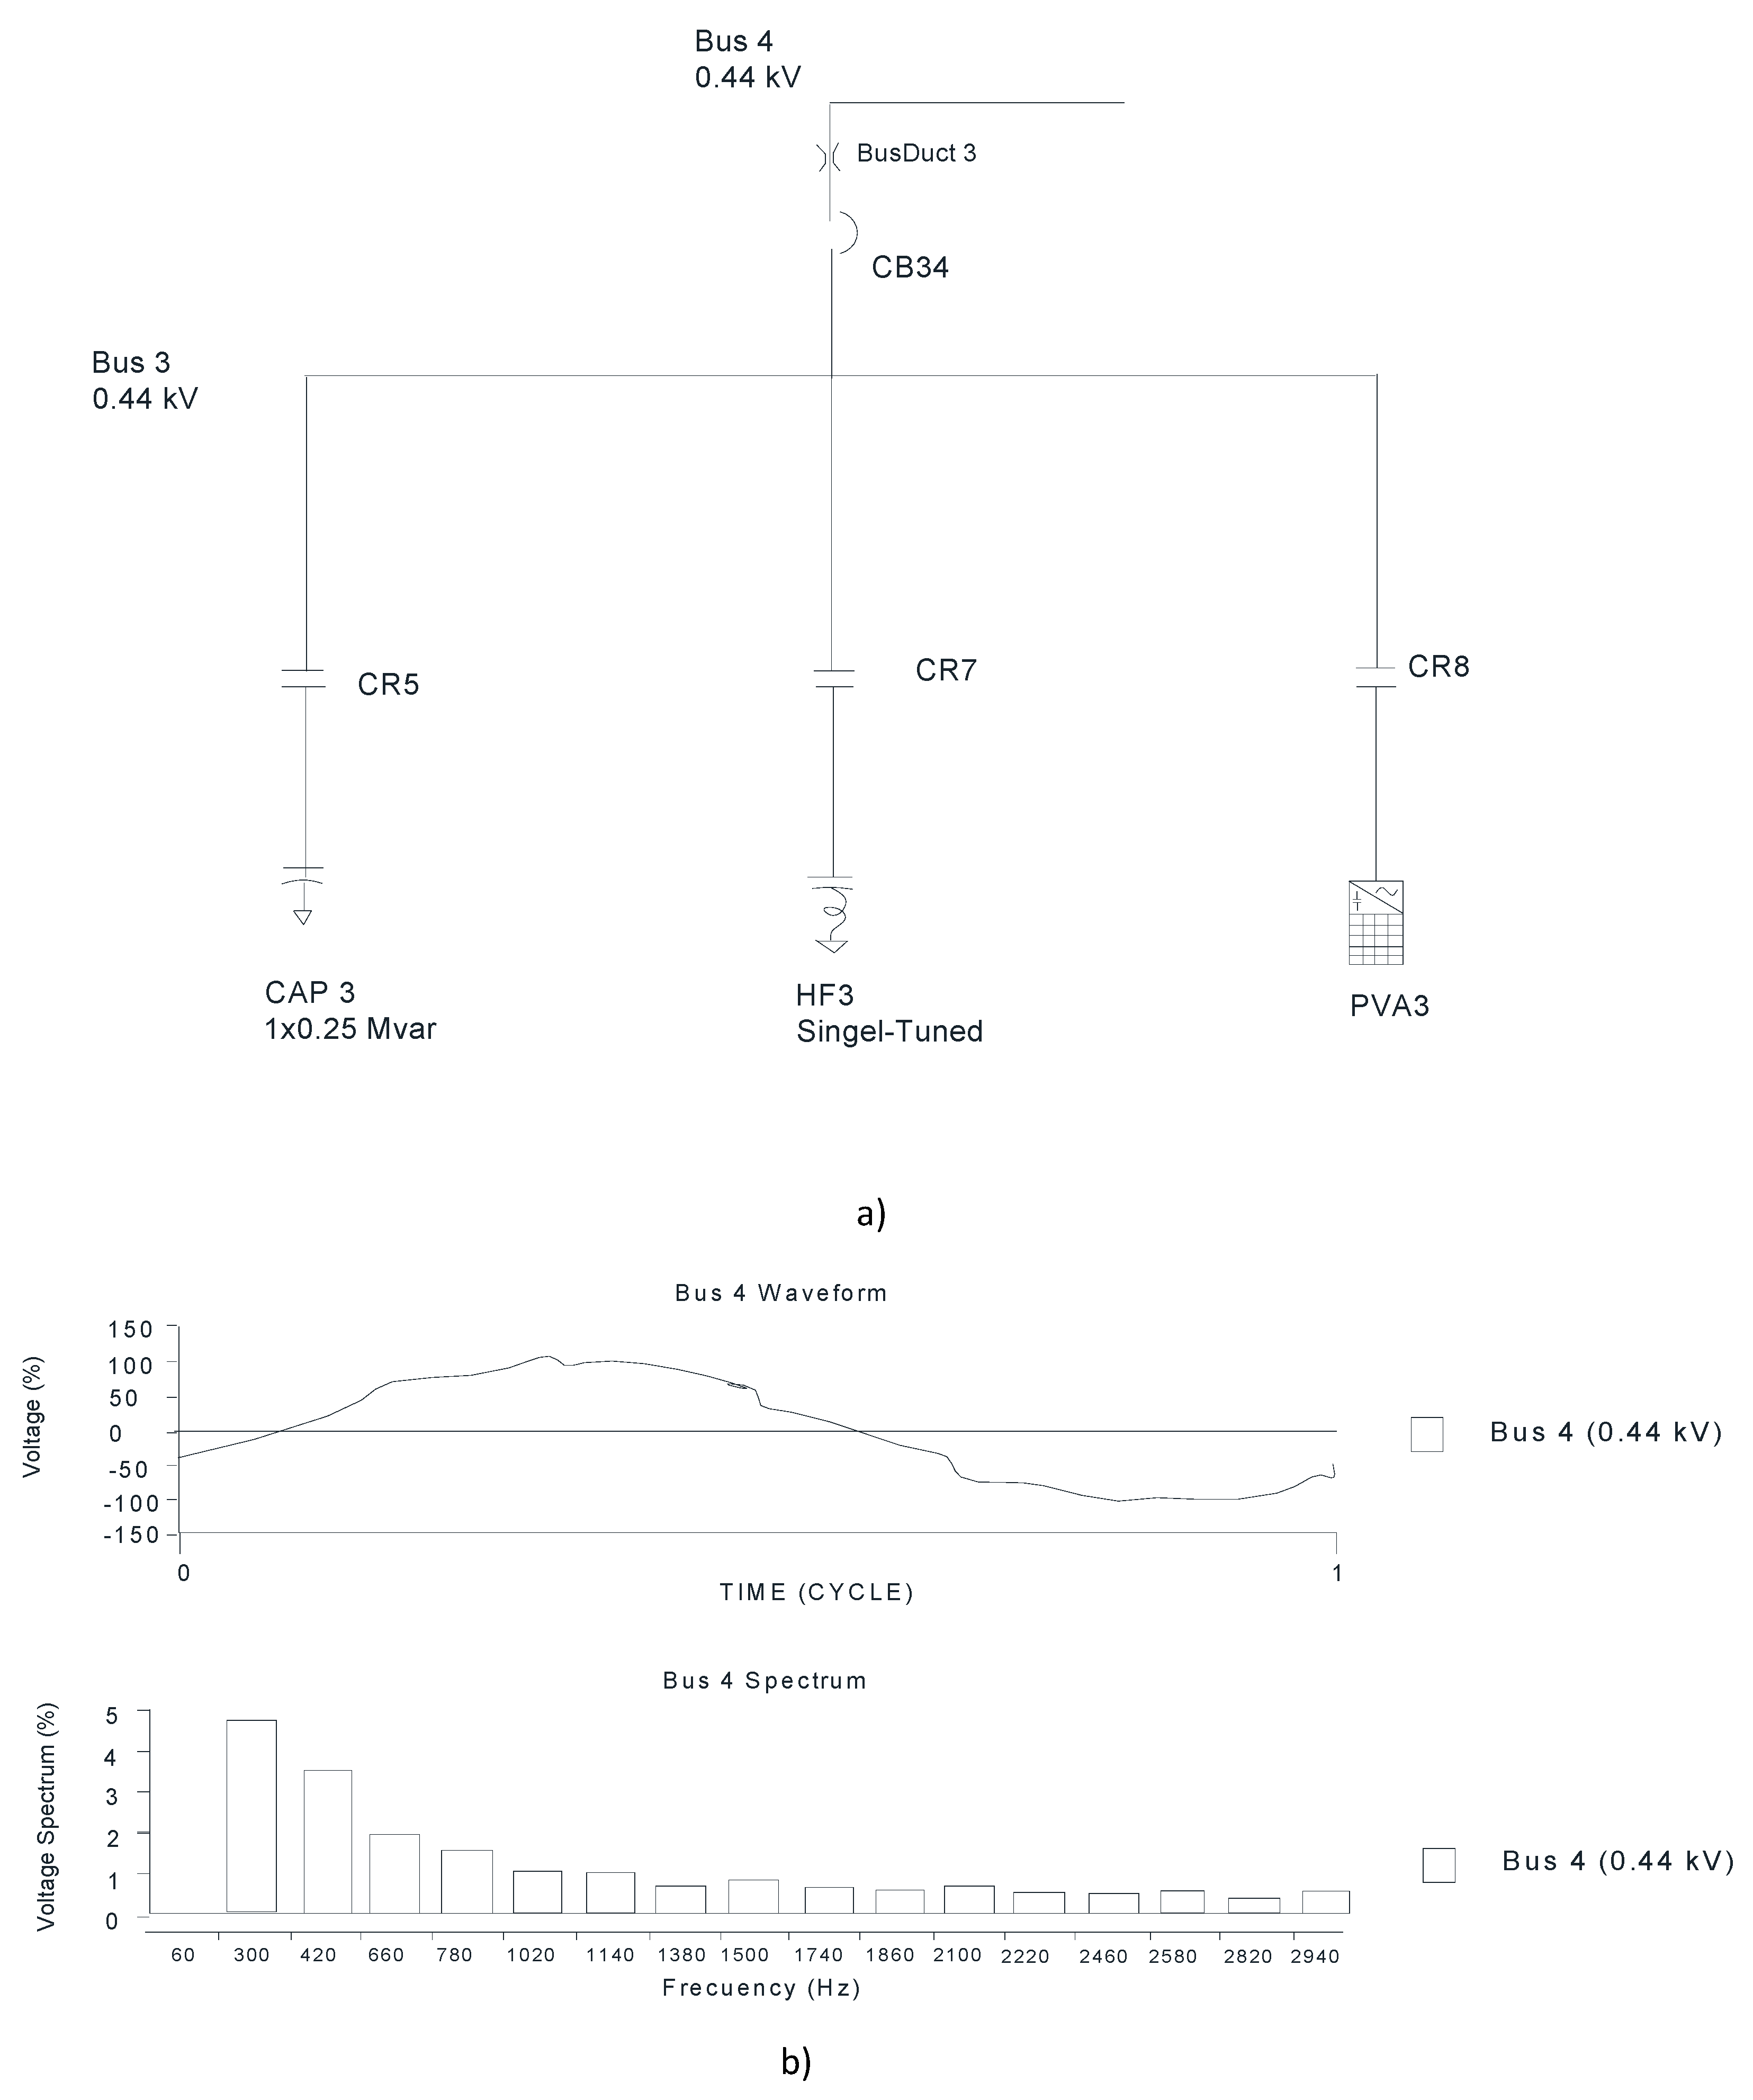
3.6. Simulation 6 of 7: Energizing the Voltage and Current Filter Together with the Photovoltaic

In the system, by energizing the voltage and current filter control systems along with the PV system simultaneously, as depicted in Figure 17a, we can obtain the following data for the current and power factor: on the high side of transformer T1, the current is 8.7 A with a power factor of 94.21%, and on bus 4, the current is 259.7 A with a power factor of 94.81%. The formation of the final waveform is regular, as shown in Figure 17b. The waveforms of the simulation part clearly show that they have higher harmonics.

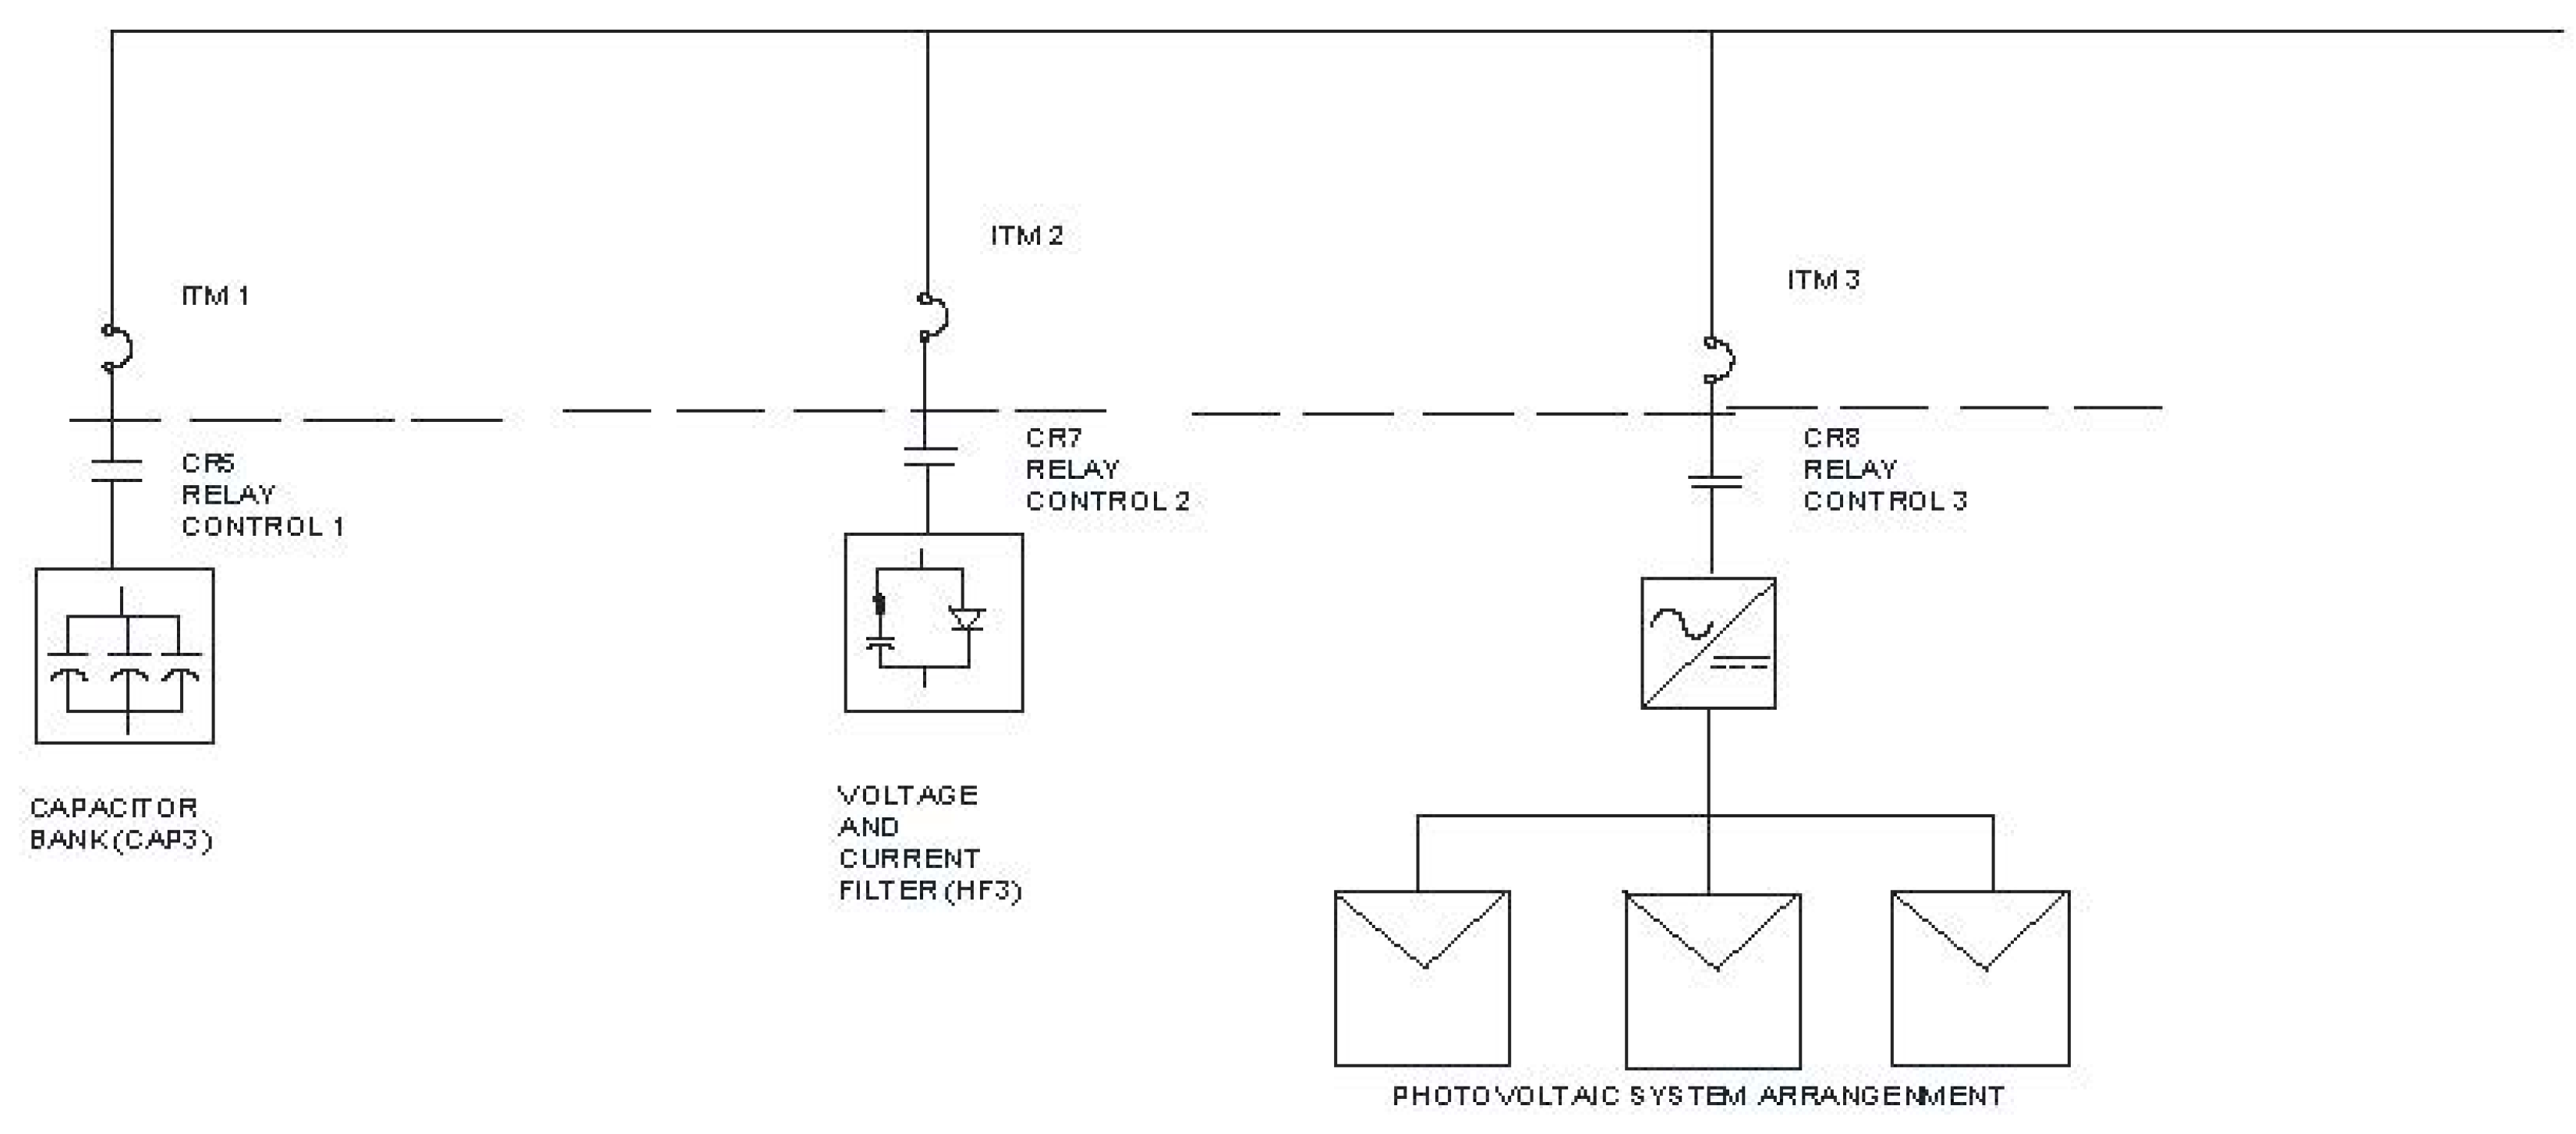
3.7. Simulation 7 of 7: Energizing the Three Elements: Capacitor Bank, Photovoltaic System, Voltage and Current Filter

Once the three control elements (as shown in Figure 18a) were energized, current and power factor readings were taken. On the high side of transformer T1, the current was measured at 12.5 A with a power factor of −76.52%. Similarly, on the low side of transformer T1, the recorded data showed a current of 374.3 A and a power factor of −74.56% (as depicted in Figure 18b). The formation of the final waveform was regular. The waveforms of the simulation part clearly show that they have higher harmonics.
Once the case studies shown above were developed, a table (Table 3) was created to integrate the results for each case. The table demonstrates that better results are obtained when the automation is integrated by energizing only the capacitor bank (CAP3). Additionally, better control is achieved in the electrical system when the photovoltaic system is energized together with the voltage and current filter.

4. Conclusions

According to the analysis developed in the simulation of the electrical system integrating the power quality control with the automation of the equipment, with respect to the simulation and following the load flow for each case, the following observations have been generated:
  • When operating only the capacitor bank, the power factor improved to 93.42%. This improvement in the power factor also led to better control over the characteristics of current fluctuations.
  • When both control systems operate, the photovoltaic system together with the voltage and current filter improves the power factor to 94.21%, reducing voltage and current fluctuations, resulting in a more stable waveform on bus 4.
  • One of the significant contributions of the analysis lies in the interaction of the control scheme. An important improvement, compared to other research contributions, is achieved by energizing the voltage control and current filter systems simultaneously withthe photovoltaic system. This integrated approach leads to notable results, such as a current of 8.7 A and a power factor of 94.21% on the high side of transformer T1 and a current of 259.7 A and a power factor of 94.81% on bus 4. The formation of the final waveform is regular, indicating that this operational scheme is one of the most effective contributions to the system’s control.
Once the automation of the control devices is developed, it is observed that the interaction of the control systems produces improvements in the power system disturbances including the following:
  • Current variations outside the specified range in the system have a significant impact on the disturbances in the electrical system.
  • Constant voltage variations in values can lead to significant disturbances and failures in the system.
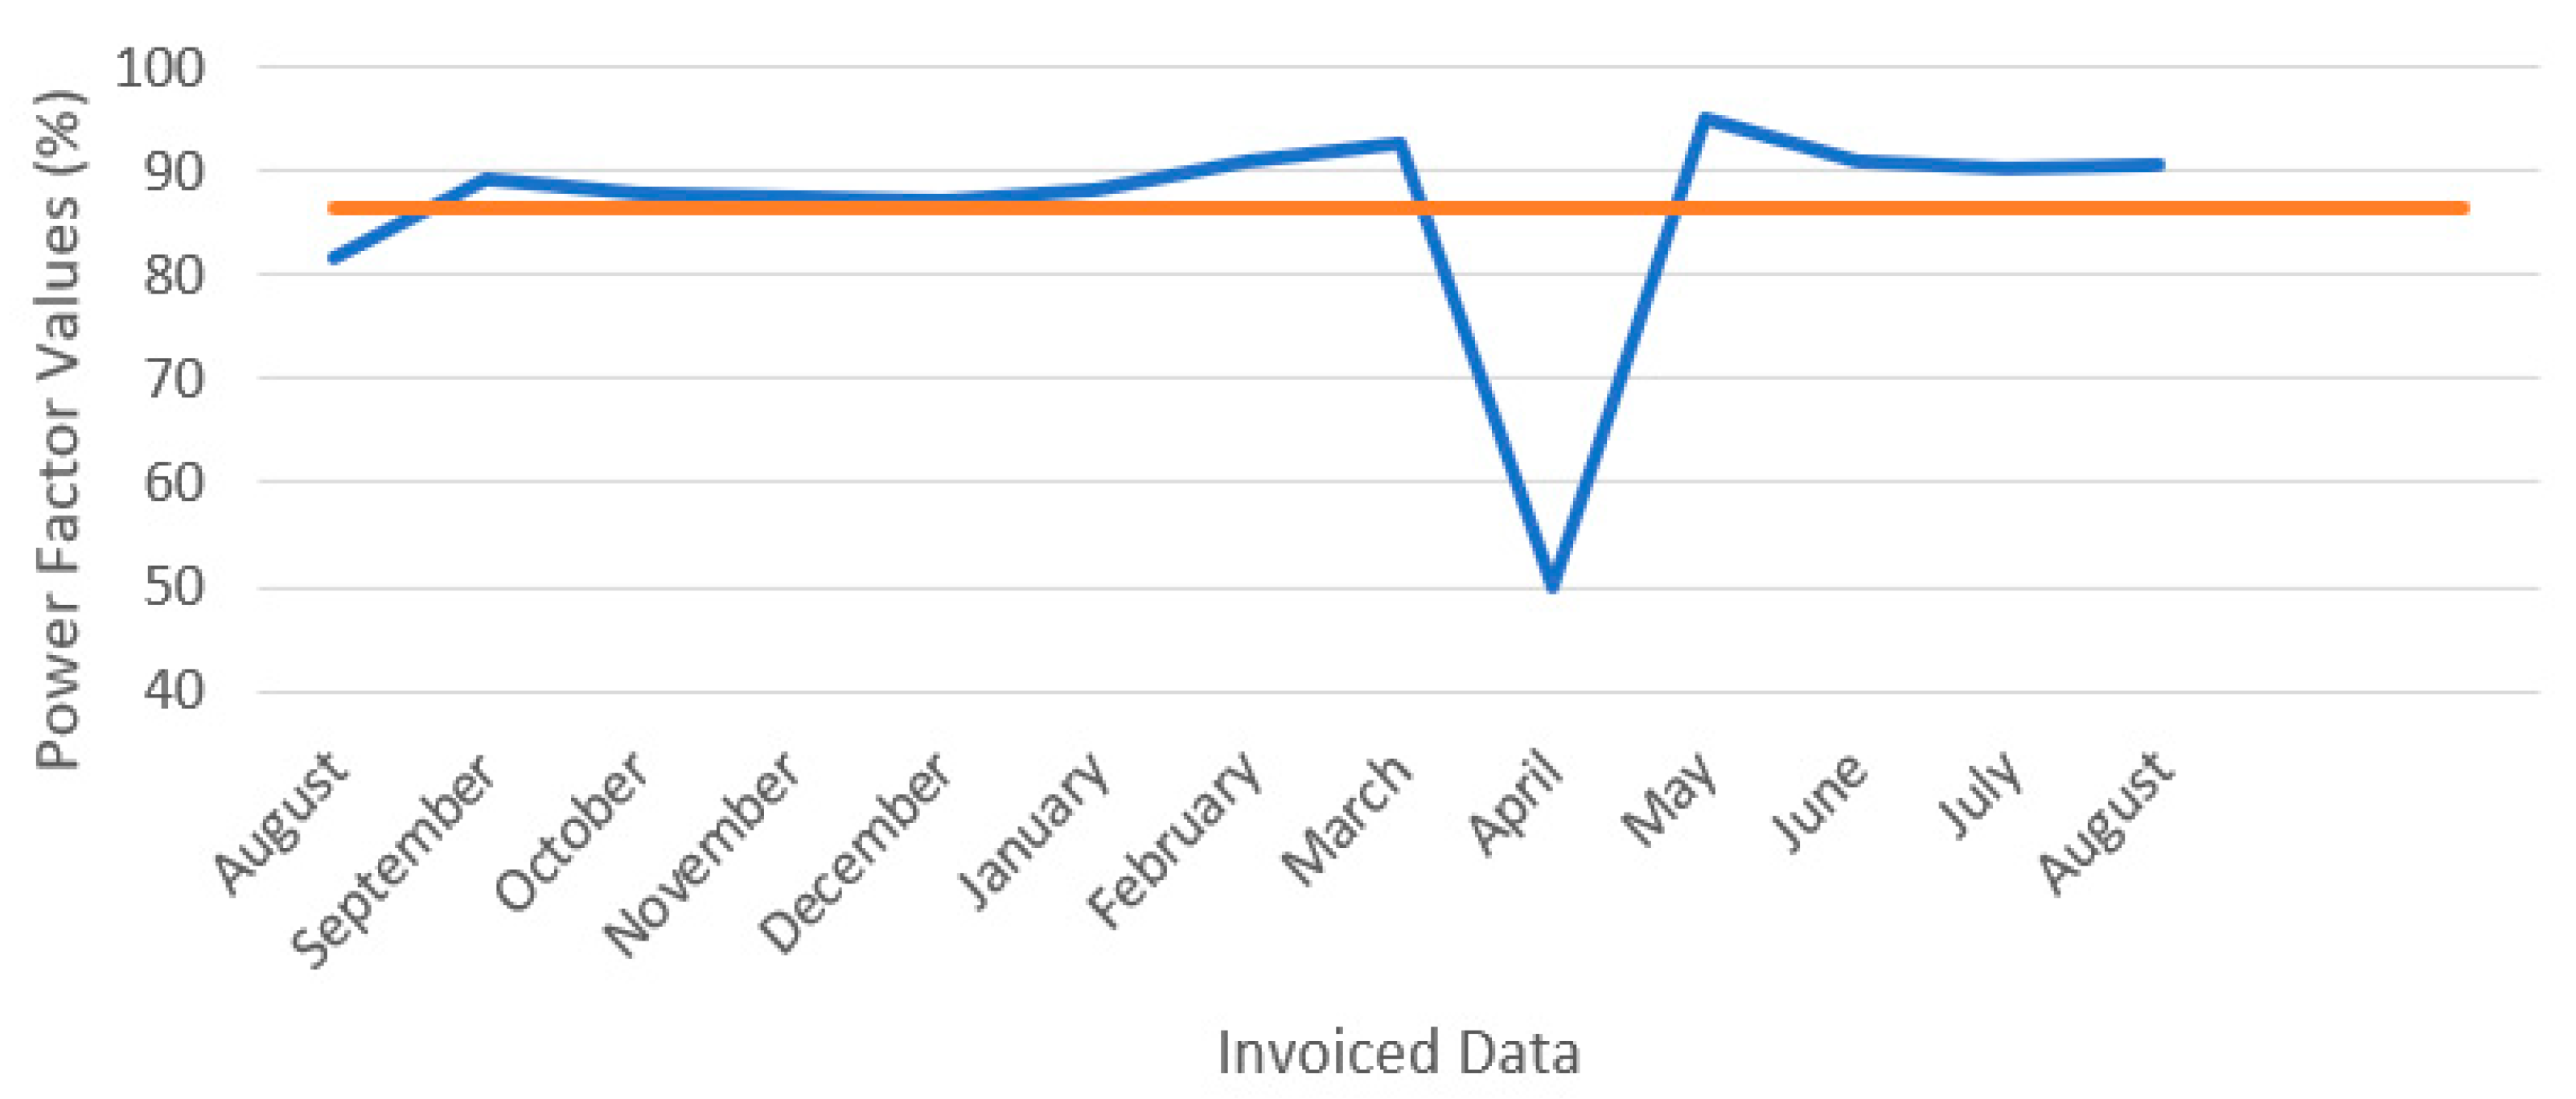
  • Power factor levels may be below the allowed limits due to insufficient power compensation in the operation of the equipment.
  • The integration of photovoltaic systems with inverters introduces harmonics into the electrical system.
The disadvantages in the development of the automation scheme that can be mentioned are:
  • Integrating power quality control elements into the electrical system of an industrial plant is challenging.
  • These elements include a capacitor bank, a voltage and current filter and a photovoltaic system to interface with the grid, which results in an extra cost for the company.
  • Carrying out the installation and adaptation of the equipment in the electrical system as well as the development of tests is resource intensive.
The innovation developed in this research is that, through the simulation of electrical systems that integrate photovoltaic systems to the grid as well as the automation of the control elements, we can realize the operating conditions for the power quality in order to identify areas of opportunity for improvement in the electrical system and to implement corrective actions. By identifying improvement actions, we can reduce energy consumption costs as well as optimize equipment operation and improve maintenance. The analysis of the literature focused on other improvement topics such as the internal optimization of voltage and current filters, improvement of grid-connected inverters of photovoltaic systems, and real-time monitoring of the system.

Author Contributions

V.A.M.R., conceptualized, carried out the investigation, wrote and prepared the article. N.V.V., J.M.R.S. and O.A.G.B. were responsibles for reviewing, editing and advising on the comments, structure and writing of the article. All authors have read and agreed to the published version of the manuscript.

Funding

No financial support was obtained for the development of the project.

Institutional Review Board Statement

Not applicable.

Informed Consent Statement

Not applicable.

Data Availability Statement

Not applicable.

Conflicts of Interest

The authors declare no conflict of interest.

Glossary and Abbreviations

Cos υpower factor
Qccapacitor bank
Xccapacitive reactance
Ccapacitor
Linductor
VinvInveter voltage
Imcurrent module
Vmvoltage module
EtapModel, analysis and optimization of energy system
MACEPMesh and armex of Aguascalientes S.A. de C.V.
CFEFederal Electricity Commission a public company with a social character that provides electric power in Mexico.
GDMTHHigh Demand Medium Voltage Hourly
IEEEInstitute of Electrical and Electronics Engineers
PCCshort-circuit power

References

  1. Erazo, O.; Quevedo, P. Power Quality Analysis and redesign of the electrical system at the industrial plant project corporation. Multiple Multi-Projects S.A. Guayaquil Ecuador. Bachelor’s Thesis, Salesian Polytechnic University, Cuenca, Ecuador, 2018. [Google Scholar]
  2. Alcayde-García, F.; Salmerón-Manzano, E.; Montero, M.A.; Alcayde, A.; Manzano-Agugliaro, F. Power Transmission Lines: Worldwide Research Trends. Energies 2022, 15, 5777. [Google Scholar] [CrossRef]
  3. Afkar, H.; Esmaeeli, M. Complete load Compensation in a Distribution Network with a Single-Stage PV Grid Interface Converter. J. Energy Eng. Mang. 2023, 12, 18–19. [Google Scholar] [CrossRef]
  4. Valtierra-Rodriguez, M.; de Jesus Romero-Troncoso, R.; Osornio-Rios, R.A.; Garcia-Perez, A. Detection and Classification of Single and Combined Power Quality Disturbances Using Neural Networks. IEEE Trans. Ind. Electron. 2014, 61, 2473–2482. [Google Scholar] [CrossRef]
  5. Singh, A.K.; Kumar, S.; Singh, B. Solar PV Energy Generation System Interfaced to Three Phase Grid with Improved Power Quality. IEEE Trans. Ind. Electron. 2020, 67, 3798–3808. [Google Scholar] [CrossRef]
  6. Amirullah; Penangsang, O.; Soeprijanto, A. Effect of Installation of Photovoltaic (PV) Generation to Power Quality in Industrial and Residential Custumers Distribution Network. In Proceedings of the International Seminar on Intelligent Technology and Its Applications, Its Applications (ISITIA), Surabaya, Indonesia, 20–21 May 2015; pp. 193–200. [Google Scholar] [CrossRef]
  7. Daza, A.U.; Buriticá, C.I.; Garzón, Y.R. Experimental study of powers, power factor in industrial loads taking as reference the norm IEEE Std 1459-2010. Tecnura 2015, 16, 41–54. [Google Scholar]
  8. Issouribehere, P.E.; Barbero, J.C.; Barbera, G.A. Comparative Study of the Different Definitions of Voltage and Current Unbalance Factors in Three-Phase Systems. In Proceedings of the CIGRE Ibero-American Regional Meeting, Puerto de Iguazú, Argentina, 24–28 May 2009; Volume 12, pp. 1–8. Available online: http://sedici.unlp.edu.ar/bitstream/handle/10915/36357/Documento_completo.pdf?sequence=1 (accessed on 15 July 2021).
  9. Silva, M.A.; Ordóñez, G.P. Power Quality: Design and Construction of a Prototype as an Alternative for Monitoring Power Outages and Brownouts. Redalyc. UIS Ing. 2005, 1, 1–14. Available online: https://www.redalyc.org/articulo.oa?id=553756895005 (accessed on 20 May 2020).
  10. Souza, G.; Santos, R.; Saraiva, E. A Log-Logistic Predictor for Power Generation in Photovoltaic Systems. Energies 2022, 15, 5973. [Google Scholar] [CrossRef]
  11. Wang, H.; Wang, J.; Piao, Z.; Meng, X.; Sun, C.; Yuan, G.; Zhu, S. The Optimal Allocation and Operation of an Energy Storage System with High Penetration Grid-Connected Photovoltaic Systems. Sustainability 2020, 12, 6154. [Google Scholar] [CrossRef]
  12. Beltrán, M.E.; Boscán, N. Identification of Needs for the Acquisition of Technology for the Production of Electrical Energy through the Use of Photovoltaic Systems in Venezuela. Redalycle 2011, 10, 89–106. Available online: http://www.redalyc.org/articulo.oa?id=78421854006 (accessed on 28 August 2019).
  13. Sousa, V.S.; Gómez, J.S. Power Quality and State-of-Load Analysis in a Power Switching and Transformation Station. Int. J. Manag. Sci. Oper. Res. 2019, 4, 27–32. Available online: http://ijmsoridi.com/index.php/ijmsor/article/view/109/98 (accessed on 18 May 2020).
  14. Arteaga, D.J. Virtual Reality Training System for Monitoring Power Quality Indicators in Electrical Substation. Master’s Thesis, Autonomous University of Queretaro, San Juan del Rio, Mexico, 20 March 2021. Available online: https://ri-ng.uaq.mx/handle/123456789/2797 (accessed on 7 February 2020).
  15. Carreño Perez, J.C.; Espinel Ortega, A. Identificación de Activos y Ciber Activos Críticos En Sistemas de Transmisión de Energía Eléctrica. Tecnura 2020, 24, 27–38. [Google Scholar] [CrossRef]
  16. Beltran, T.A.; López, F.E.; Beltran, C.S. Bridge Inverter Power Quality Analysis and SPWM Control. Energy Eng. 2020, 41, 1–11. Available online: https://dialnet.unirioja.es/ejemplar/544727 (accessed on 16 September 2021).
  17. Marcelo, G.T. Estimated Cost of Electricity with Time Horizon for Micro Grid Based on the Policy Response of Demand for Real Price of Energy. Enfoque Ute 2020, 4, 41–55. Available online: http://ingenieria.ute.edu.ec/enfoqueute (accessed on 11 October 2021).
  18. De Oliveira, V.; Vilela, D.F.; Vilela, T.F. Study of the Anatomy of Losses in Electric Energy Distribution. Energy Eng. 2022, 43, 1–10. Available online: https://rie.cujae.edu.cu/index.php/RIE/article/view/646/791 (accessed on 2 January 2023).
  19. Amaya, L.V.; Inga, E. Location of Harmonic Distortions in Electrical Systems using Compressed Sensing. Eng. Compet. 2022, 24, e30511037. Available online: https://www.redalyc.org/journal/2913/291371829032/html/ (accessed on 7 February 2023).
  20. Martins, J.C.; Morandi, M.I.; Lacerda, D.P.; Andrade, B.P. Energy Efficiency Decision-Making in Non-Energy Intensive Industries: Content and Social Network Analysis. Production 2022, 32, e20210065. [Google Scholar] [CrossRef]
  21. Angelino dos Santos, T.; Gomes de Freitas, F.; Carvalho Gonçalves, D.L.; Fernández-Ramírez, L.M. Design and Validation of IOT Measurement System for Photovoltaic Generation. Ingenius 2022, 28, 44–52. [Google Scholar] [CrossRef]
  22. Herrera, R.C.; García, J.G.; Bello, B.; Herrera, F.B. Proposal of an Intelligent Predictive Model for a Photovoltaic Plant. Cuba. J. Comput. Sci. 2022, 16, 144–162. Available online: https://www.redalyc.org/journal/3783/378370413010/movil/ (accessed on 22 March 2023).
  23. Camargo, F.G. Fuzzy Multi-Objective Optimization of the Energy Transition towards Renewable Energies with a Mixed Methodology. Production 2022, 32, e20210132. [Google Scholar] [CrossRef]
  24. Thango, B.A.; Bokoro, P.N. Battery Energy Storage for Photovoltaic Application in South Africa: A Review. Energies 2022, 15, 5962. [Google Scholar] [CrossRef]
  25. Mastromauro, R.A.; Liserre, M.; Kerekes, T.; Dell’Aquila, A. A Single-Phase Voltage-Controlled Grid-Connected Photovoltaic System with Power Quality Conditioner Functionality. IEEE Trans. Ind. Electron. 2009, 56, 4436–4444. [Google Scholar] [CrossRef]
  26. Tareen, W.U.; Mekhilef, S.; Seyedmahmoudian, M.; Horan, B. Active Power Filter (APF) for Mitigation of Power Quality Issues in Grid Integration of Wind and Photovoltaic Energy Conversion System. Renew. Sustain. Energy Rev. 2017, 70, 635–655. [Google Scholar] [CrossRef]
  27. Hai, T.; Zhou, J.; Rezvani, A.; Le, B.N.; Oikawa, H. Optimal Energy Management Strategy for a Renewable Based Microgrid with Electric Vehicles and Demand Response Program. Electr. Power Syst. Res. 2023, 221, 109370. [Google Scholar] [CrossRef]
  28. Marmolejo-Duarte, C.; Chen, A. Uncovering the Price Effect of Energy Performance Certificate Ratings When Controlling for Residential Quality. Renew. Sustain. Energy Rev. 2022, 166, 112662. [Google Scholar] [CrossRef]
  29. Zhang, W.; Wu, Y.; Calautit, J.K. A Review on Occupancy Prediction through Machine Learning for Enhancing Energy Efficiency, Air Quality and Thermal Comfort in the Built Environment. Renew. Sustain. Energy Rev. 2022, 167, 112704. [Google Scholar] [CrossRef]
  30. IEEE STD 519-2022; Standard for Harmonic Control in Electric Power Systems. (Revision of IEEE STD 519-2014). IEEE: New York, NY, USA, 2022; pp. 1–15. [CrossRef]
  31. Gandoman, F.H.; Ahmadi, A.; Sharaf, A.M.; Siano, P.; Pou, J.; Hredzak, B.; Agelidis, V.G. Review of Facts Technologies and Applications for Power Quality in Smart Grids with Renewable Energy Systems. Renew. Sustain. Energy Rev. 2018, 82, 502–514. [Google Scholar] [CrossRef]
  32. Das, C.K.; Bass, O.; Kothapalli, G.; Mahmoud, T.S.; Habibi, D. Overview of Energy Storage Systems in Distribution Networks: Placement, Sizing, Operation, and Power Quality. Renew. Sustain. Energy Rev. 2018, 91, 1205–1230. [Google Scholar] [CrossRef]
  33. Rauch, J.; Brückl, O. Achieving Optimal Reactive Power Compensation in Distribution Grids by Using Industrial Compensation Systems. Electricity 2023, 4, 78–95. [Google Scholar] [CrossRef]
  34. Mulenga, E. Solar PV Stochastic Hosting Capacity Assessment Considering Epistemic (e) Probability Distribution Function (PDF). Electricity 2022, 3, 586–599. [Google Scholar] [CrossRef]
  35. Ayala, L.C. Energy Quality: Characteristics and Limits of Disturbances of Electric Power Parameters; Technical Manual; CFE (Commission Electricity): Mexico City, Mexico, 2009; Available online: https://lapem.cfe.gob.mx/normas/pdfs/I0000-70.pdf (accessed on 21 October 2019).
  36. Corporation, F. Fluke 434-II/435-II/435-II/437-II Three-Phase Power and Power Quality Analyzer User’s Manual; Netherlands Test World: Rocklin, CA, USA, 2012; Available online: https://testworld.com/wp-content/uploads/user-manual-fluke-434-435-three-phase-quality-analyzer.pdf (accessed on 8 November 2020).
  37. Ayaz Atalan, Y.; Tayanç, M.; Erkan, K.; Atalan, A. Development of Nonlinear Optimization Models for Wind Power Plants Using Box-Behnken Design of Experiment: A Case Study for Turkey. Sustainability 2020, 12, 6017. [Google Scholar] [CrossRef]
  38. Minitab Statistical Software. Available online: https://www.minitab.com/en-us/products/minitab/free-trial/2020 (accessed on 10 June 2021).
  39. Abdul Kadir, A.F.; Khatib, T.; Elmenreich, W. Integrating Photovoltaic Systems in Power System: Power Quality Impacts and Optimal Planning Challenges. Int. J. Photoenergy 2014, 2014, 321826. [Google Scholar] [CrossRef]
  40. Chandra, A.; Agarwal, T. Capacitor Bank Designing for Power Factor Improvement. Int. J. Emerg. Technol. Adv. Eng. 2014, 4, 235–239. Available online: https://www.ijetae.com/Volume4Issue8.html (accessed on 5 May 2019).
  41. ETAP, O.T. Version 21.1.0. 2022. Available online: https://etap.com/es/demo-download (accessed on 22 March 2023).
  42. Le Nguyen, H. Newton-Raphson Method in Complex form [Power System Load Flow Analysis]. IEEE Trans. Power Syst. 1997, 12, 1355–1359. [Google Scholar] [CrossRef]
  43. Suarez, J.A.; di Mauro, G.; Anaut, D.; Aguero, C. Analysis of the Harmonic Distortion and the Effects of Attenuation and Diversity in Residential Areas. IEEE Lat. Am. Trans. 2005, 3, 53–59. [Google Scholar] [CrossRef]
  44. Sánchez, G.; Franco, G. Design and Implementation of a Photovoltaic System Interconnected to the grid with storage support at the Technological University of Pereira, Faculty of Technology, and Degree Thesis of Bechelor. May 2016. Available online: https://repositorio.utp.edu.co/bitstreams/3a02efc9-d8fb-432a-b2ee-e50b181dd11b/download (accessed on 22 October 2020).
Figure 1. Monthly power factor levels indicating the average (85.83%).
Energies 16 06161 g001
Figure 2. Electricity consumption in the company MACEP.
Energies 16 06161 g002
Figure 3. RMS current change recorded in the control center for a year.
Energies 16 06161 g003
Figure 4. Changes in the RMS value of the current recorded in the control center.
Energies 16 06161 g004
Figure 5. RMS voltage recorded in the control center.
Energies 16 06161 g005
Figure 6. Current behavior histogram.
Energies 16 06161 g006
Figure 7. Residual analysis of current behavior.
Energies 16 06161 g007
Figure 8. CFE (Supply) service connection and main substation of the Single-wire diagram of the electrical system.
Energies 16 06161 g008
Figure 9. Load flow simulation configuration.
Energies 16 06161 g009
Figure 10. Proposed single-wire diagram for connection of the control and control systems.
Energies 16 06161 g010
Figure 11. Automation of the control elements (simulation).
Energies 16 06161 g011
Figure 12. Results of the automation operating the capacitor bank. (a) Electrical Diagram; (b) Spectrum.
Energies 16 06161 g012
Figure 13. Results of the automation operating the capacitor bank. (a) Electrical Diagram; (b) Spectrum.
Energies 16 06161 g013
Figure 14. Results of the automation operating the photovoltaic system. (a) Electrical Diagram (b) Spectrum.
Energies 16 06161 g014
Figure 15. Results of the automation operating the capacitor bank (CAP3) together with the voltage and current filter (HF3). (a) Electrical Diagram (b) Spectrum.
Energies 16 06161 g015
Figure 16. Results of the automation operating the capacitor bank (CAP3) together with the photovoltaic system. (a) Electrical Diagram (b) Spectrum.
Energies 16 06161 g016
Figure 17. Results of the automation operating the voltage and current filter together with the photovoltaic system. (a) Electrical Diagram (b) Spectrum.
Energies 16 06161 g017
Figure 18. Results of the automation operating the voltage and current filter together with the photovoltaic system. (a) Electrical Diagram (b) Spectrum.
Energies 16 06161 g018
Table 1. Analysis of Variance (ANOVA).
Analysis of Variance of Current, Using Adjusted SS for Tests
SourceDegrees of FreedomSum of SquareSeg.Adj.Sum of SquareAdj.Mean SquareF Ratiop Value
Power Active24.004.002.000.160.853
Power Reactive14.174.174.170.330.571
Power Aparent16.006.006.000.480.497
Error19237.83237.8312.52
Full23252.00
Table 2. Equipment operating and start-up conditions.
NomenclatureEquipmentPower (W/H.P.)Control Diagram
abcdefg
CR5/CAP3CR7/HF3CR8/PVA3CR5-CR7/CAP3-HF3CR5-CR8/CAP3-PVA3CR7-CR8/HF3-PVA3CR5-CR7-CR8/CAP3-HF3-PVA3
Mtr1Mallacriba 1372.5/0.5 X
Mtr4Mallacriba 2372.5/0.5 X
Mtr2Straightenera 18940/12 X X
Mtr3Straightening machine 28940/12 X
Mtr5Bending machine7450/10 XX
Mtr6Compressor7450/10 X X
Mtr7Heavy Drag7450_/10 X
Mtr8Light Drag22,350/30X XX X
Mtr9Straightening2235/3 X
Mtr10Rolling machine3725/5 X
Mtr11Slitter3725/5 X X
Mtr12Drawing machine 118,625/25X XX X
Mtr13Drawing machine 214,900/20 X XX
Mtr14Drawing machine 311,175/15 XX
Mtr15Drawing machine 418,625/25X XXXX
Mtr16Drawing machine 514,900/20 X XX
Mtr17Drawing machine 622,350/30X XXXX
Mtr18pump3750/5 X
Mtr19Geared motor7450/10X
Mtr20Mallacriba 32235/3 X
Mtr21Mallacriba 42235/3 X
Mtr22Mallacriba 5186.5/0.25 X
Table 3. Current and power factor results under the simulation conditions.
EquipmentCurrent (A)Power Factor (%)Waveform Characteristics
Transformer T1 High SideTransformer Low Side (Bus 4)Transformer T1 High SideTransformer Low Side (Bus 4)Transformer T1 High SideTransformer Low Side (Bus 4)
Capacitor bank (CAP3)12.9386.8−93.42−92.17RegularGood
Voltage-current filter (HF3)12.6377.990.0691.1BadBad
Photovoltaic System Arrangement (PVA3)8.4252.489.9490.63RegularBad
Capacitor bank (CAP3) and Voltage-current filter (HF3)12.5374.3−76.52−74.56RegularGood
Capacitor bank (CAP3) and Photovoltaic Array (PVA3)11.5344.2−77.65−75.87RegularGood
Photovoltaic system array (PVA3) and Voltage-current filter (HF3)8.7259.794.2194.81BadGood
Photovoltaic system array (PVA3) and Voltage-current filter (HF3) and Capacitor Bank (CAP3)12.5373.3−76.52−74.56RegularRegular
Disclaimer/Publisher’s Note: The statements, opinions and data contained in all publications are solely those of the individual author(s) and contributor(s) and not of MDPI and/or the editor(s). MDPI and/or the editor(s) disclaim responsibility for any injury to people or property resulting from any ideas, methods, instructions or products referred to in the content.

