Article

A Novel Allocation Strategy Based on the Model Predictive Control of Primary Frequency Regulation Power for Multiple Distributed Energy Storage Aggregators

1
Electric Power Research Institute, China Southern Power Grid, Guangzhou 510663, China
2
Shenzhen Power Supply Company, China Southern Power Grid, Shenzhen 518067, China
3
College of Electric Power Engineering, South China University of Technology, Guangzhou 510640, China
*
Author to whom correspondence should be addressed.
Energies 2023, 16(17), 6140; https://doi.org/10.3390/en16176140
Submission received: 22 July 2023 / Revised: 17 August 2023 / Accepted: 21 August 2023 / Published: 23 August 2023
(This article belongs to the Section F1: Electrical Power System)

Abstract

:
As the amount of distributed energy storage (DES) in a power system continues to increase, it will not be long before there are multiple DES aggregators participating in frequency regulation, and the realization of their coordinated control is a critical topic of current research. This study focused on the primary frequency regulation (PFR) power allocation strategy among multiple DES aggregators participating in PFR. This study first calculated the PFR demand according to a system frequency response model of the power system with DESs. Next, a PFR power allocation model of DES aggregators was developed based on model predictive control. The objective of this model was to minimize the overall frequency regulation cost while satisfying all of the constraints of DESs. Finally, the distributed interior point method was used to solve the model rapidly. The correctness and effectiveness of the proposed model and algorithm were verified on two unified transmission and distribution systems with DES aggregators used to supply the PFR service. The results revealed that the proposed model could effectively allocate PFR power to the various types of energy storage, with the additional benefits of slowing down the shift in the state of charge for energy storage units and ensuring the continuity of energy storage participation in frequency regulation.

1. Introduction

With the increasing penetration of wind, photovoltaic, and other renewable energy sources into power grids, the equivalent inertia of power systems decreases gradually [1]. The current frequency regulation (FR) method based on conventional generators, however, cannot fully satisfy the FR demand of the power system. Therefore, investigating novel methods of FR is critical [2].
Due to its bi-directional regulation and fast response characteristics, energy storage has been increasingly used to provide FR service in power systems [3]. Generally, large-scale energy storage can participate in FR by forming energy storage stations with hundreds of megawatt hours. Nevertheless, it is uneconomical to directly construct energy storage stations due to their expensive investment costs. Instead, with the rapid growth of grid-connected distributed energy storage (DES) in distribution networks, the FR ability of numerous DESs could be utilized effectively [4].
Numerous studies have been conducted to address the problems associated with the participation of DESs in FR. Ghazavi et al. proposed several frequency support strategies for DESs under low-grid-inertia conditions in [5]. In [6], a profit-maximizing strategy, including the FR phase and state of charge (SOC) recovery phase, was presented for the DES aggregator to participate in the primary frequency regulation (PFR) market. Considering the uncertain behavior of users, Sun et al. [7] proposed a dynamic DES control strategy based on the risk-averse multi-armed bandits method. In [8], a fast hierarchical control framework was designed for DESs to provide frequency and voltage support using the coordinated injection of active and reactive power. This framework addressed two hierarchical schemes, namely, physical and logical schemes. The physical scheme is designed to prioritize the power injection from DESs, while the logical scheme refers to the computation for the power commands of DESs concerning their operational constraints. Considering the FR requirements of the power system, an independent AGC control strategy based on the area control error signal was proposed in [9] for DESs to participate in secondary frequency regulation (SFR). The FR power allocation strategies employed in the above studies are based on the available regulation capacity of DES, which is characterized by a simple control mode, but does not take into account the differences in the regulation costs and operational constraints of different DESs. Model predictive control (MPC) is an optimal control technique that can solve optimization problems under multiple constraints; as a result, it is widely used in various aspects of power systems [10,11]. Aiming at the SFR jointly carried out by DESs and thermal power units, Wang et al. [12] proposed an optimal control method based on model predictive control (MPC). Considering the uncertainty of system operation, a two-layer MPC-based DES control strategy was developed in [13] to provide efficient control signals that respond to the SFR requirements of the power system. In the above studies, the management of DESs was unified by the power dispatching and control center [5,9,12,13] or an aggregator [6,7,8]. However, with the increase in the number of DESs, multiple DES aggregators may participate in FR, where the realization of their coordinated control is a critical topic of current research.
The control methods of power systems discussed in the emerging literature can be generally categorized into centralized and distributed categories [14]. Distributed control strategies are more suitable for the application of DES aggregators participating in PFR, as this type of approach can protect the private information of DESs. To date, distributed algorithms have been widely used in other fields of power grids, such as economic dispatch [15,16], optimal power flow [17,18], and reactive power optimization [19,20], while distributed methodologies were not utilized in FR problems until recently. In [21], the alternating direction multiplier method (ADMM) was adopted to solve the power allocation problem of joint FR with wind turbines and energy storage. To collectively provide ancillary FR service using distributed resources, a distributed control method based on consensus control protocol was designed in [22]. In [23], a distributed control strategy based on a finite-time consensus algorithm was proposed for the DES aggregator to provide an FR service. In [24], Xiong et al. developed a novel strategy for coordinating wind turbines and energy storage to achieve consensus control by employing a specified time consensus approach. In [25], the authors proposed a two-level synergetic unit commitment model to integrate FR into the unit commitment scheduling strategy and solved the model by utilizing the analytical target cascading algorithm. However, the aforementioned distributed algorithms typically require more iterations to converge, which may lead to the potential risks of action failure or frequency instability in response to the frequency command.
The distributed interior point method (DIPM) is an optimality condition decomposition method [26], whose essence is the distributed solution of the Karush–Kuhn–Tucker (KKT) optimality conditions of coupled constraints. Unlike the distributed algorithms adopted in [21,22,23,24,25], the DIPM relies on the second-order optimization method (Newton method) and hence enjoys superior convergence properties. Due to its strong convergence, the DIPM has been widely used in the multi-region coordinated optimization of power systems. In [27], the DIPM is applied to solve for a multi-region optimal reactive power flow. However, the proposed method requires a central coordinator to solve the correction equations of the coupled variables. Based on [27], Lu et al. [28] proposed a fully decentralized distributed interior point method without a central controller and applied it to the optimal power flow problem. Considering the risk management of a multi-regional interconnected energy system, Zhang et al. [29] constructed a risk-averse model of regional energy service providers and applied the DIPM to solve it. At present, the distributed interior point method is mainly applied to the optimal dispatch and has not been used to solve the frequency regulation problem.
In sum, the participation of DESs in primary frequency regulation (PFR) mainly has to contend with two problems. The first is that DESs in a power grid are currently managed by a dispatching center or an aggregator, and the power allocation problems that arise from multiple aggregators are not considered. The second is that in order to protect the privacy of aggregators, the power allocation model should be solved by a distributed algorithm, but the distributed algorithms that are currently applied to the FR problem require many iterations to converge. This study focuses on these problems and proposes a novel power allocation strategy for multiple DES aggregators participating in PFR and applies the DIPM to solve the model in a distributed manner.
The main contributions of this study are as follows:
(1)
An MPC-based PFR power allocation model with multiple DES aggregators was established that incorporates the predictive model and receding horizon optimization model. The predictive model of DES aggregators was developed by considering both the dynamic equation of the active power output increment for DESs and the transfer equation of the battery SOC. Based on the predictive model, the receding horizon optimization model was subsequently developed to minimize the FR cost of DESs while satisfying all of the constraints of DESs.
(2)
The DIPM was applied to solve the PFR power allocation model in a distributed manner, which can ensure the speed and accuracy of the solution while simultaneously protecting the private information of each aggregator. Unlike the distributed algorithms adopted in [21,22,23,24,25], the DIPM has a second-order convergence speed.
The remainder of this paper is organized as follows. In Section 2, the calculation for the PFR demand considering DES aggregators is introduced. Then, the PFR power allocation model is described in Section 3. In Section 4, the distributed solution for the PFR power model is elaborated upon. The case studies and analytical results are presented in Section 5. Finally, the conclusion of this study is given.

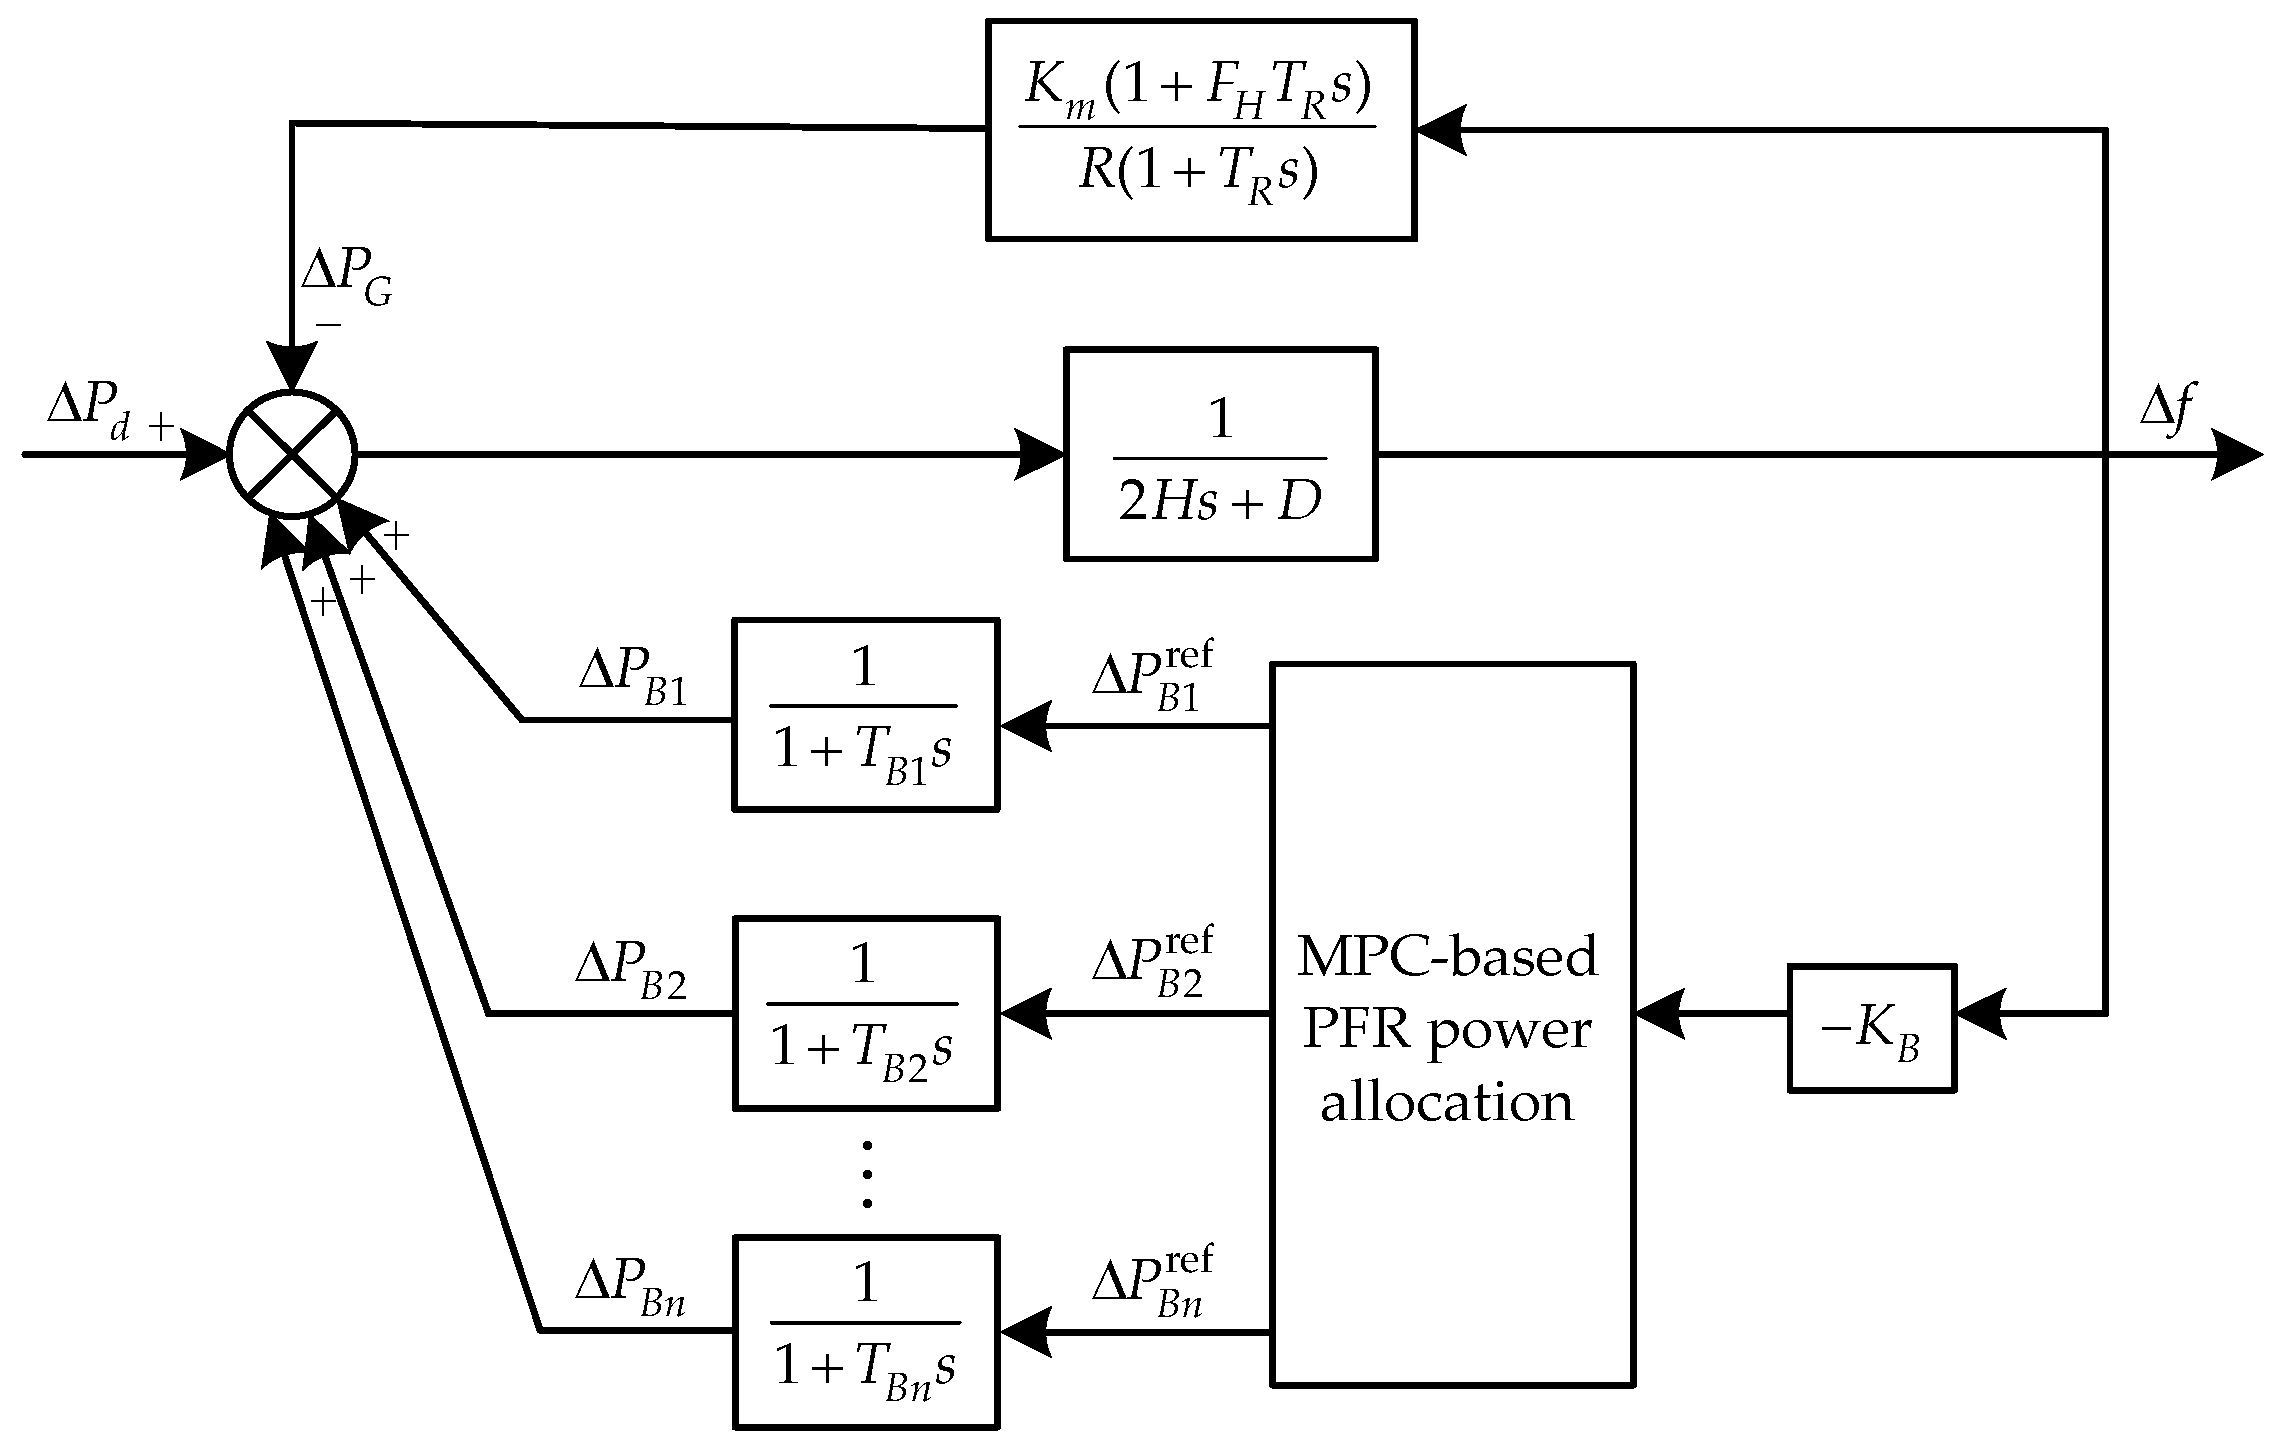
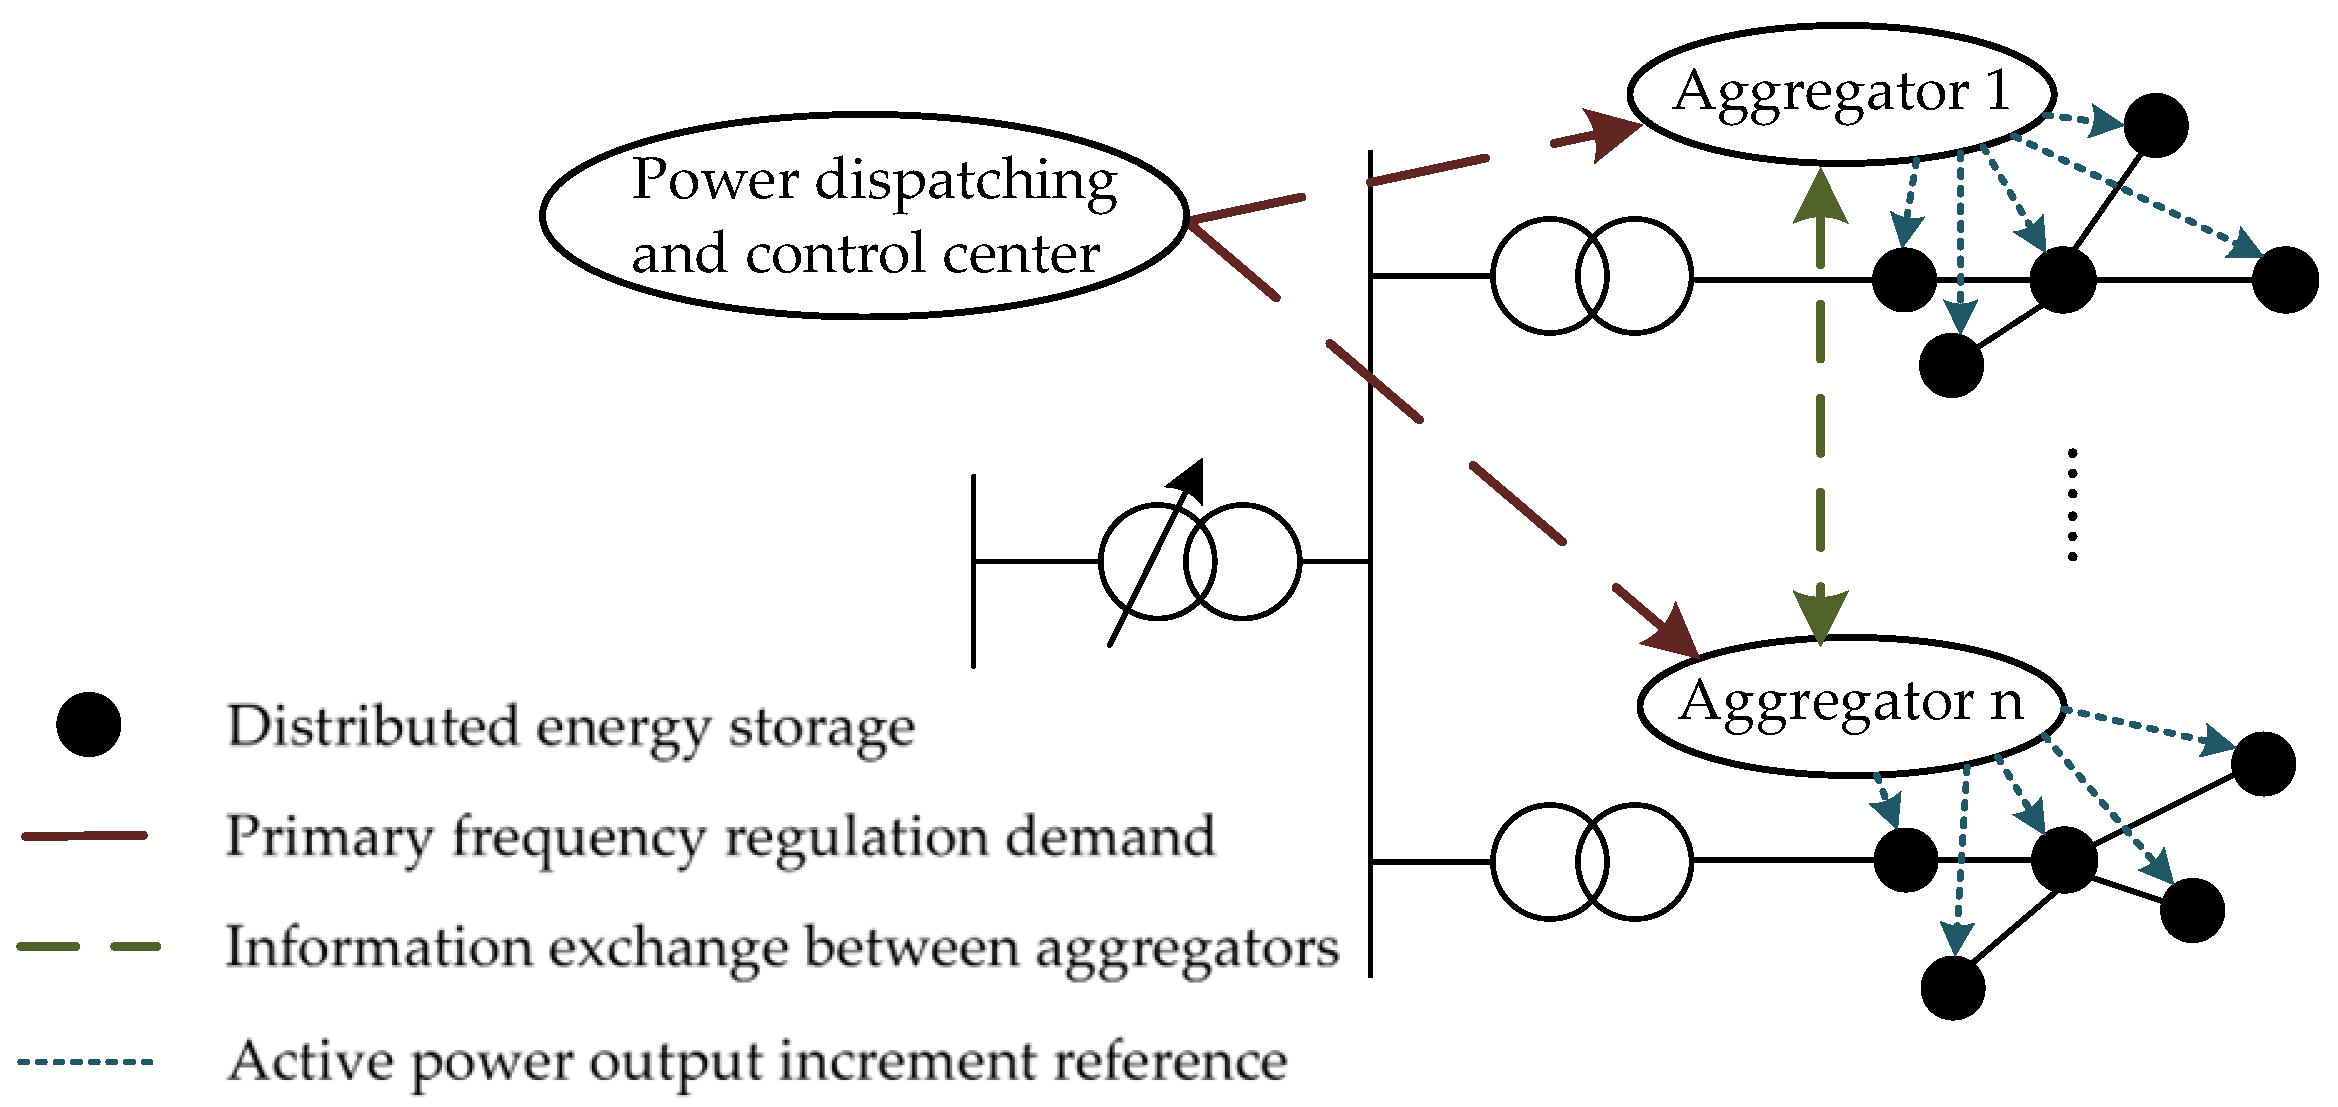
2. Calculation of the PFR Demand

In Figure 1, the architecture of the PFR service provided by multiple DES aggregators is displayed. Under scenarios of power disturbances, such as generator failure and tie line disconnection, considerable frequency fluctuations in power grids could occur. Then, the power dispatching and control center could calculate the PFR demand of the entire system based on the power disturbance and send it to the controlled DES aggregators. With the help of the developed distributed optimization algorithm, each aggregator can determine its optimal power allocation plan and allocate the active power output increment reference to each DES to adjust its outputs, which ultimately contributes to ensuring the frequency stability of the entire system.
In this study, based on the conventional low-order frequency response model [30], DESs were incorporated to construct the system frequency response model participating in PFR, as shown in Figure 2. This model consists of three types of transfer functions: a reheat turbine unit, a DES, and a rotor motion equation of the equivalent synchronous generator to describe system frequency variation.
For the reheat turbine unit, the most significant time constant is the turbine equivalent inertia time, identified as TR in Figure 2. This constant tends to dominate the response of the largest fraction of power output. Compared with TR, all of the other reheat turbine unit time constants are insignificant. Ignoring all of the other constants, the transfer function of the reheat turbine unit can be written as
G g ( s ) = K m ( 1 + F H T R s ) R ( 1 + T R s )
where Km is the mechanical power gain coefficient, FH is the ratio of total power generated by the high-pressure turbine, and R is the governor regulation coefficient.
DES has the advantages of a rapid response, flexible controllability, and stable operation. A first-order inertia link is usually adopted to represent the frequency response of DES [31]. The transfer function of the DES model is
G B i ( s ) = 1 1 + T B i s
where TB is the response time of the ith DES.
The rotor motion equation used to describe the frequency variation in the equivalent synchronous generator of the power system is written as
Δ f = 1 2 H s + D ( i Δ P B i + Δ P d Δ P G )
where D is the load-damping coefficient, H is the system equivalent inertia time, ΔPd is the power disturbance of the system, ΔPG refers to the turbine mechanical power increment, ΔPBi is the active power output increment of the ith DES, and Δf is the frequency deviation.
To achieve fast PFR, energy storage typically uses droop control to adjust the active power output according to the droop coefficient. However, the system characteristics should be considered when adjusting the droop coefficient. Therefore, the total droop coefficient of DESs should be optimized according to the system frequency response model.
According to the frequency response model with DESs participating in PFR, the frequency domain expression of the frequency deviation can be derived [32]:
G sys ( s ) = Δ f Δ P d = 1 2 H T R T R s + 1 s 2 + 2 ζ ω n s + ω n 2
where
ω n 2 = D M T R + K m M R T R + K B R B M T R
ζ = 1 2 ω n 1 T R + D M + F H K m M R + K B R B M
By applying the inverse Laplace transform, the time domain expression of the frequency deviation can be obtained as follows:
Δ f ( t ) = R Δ P d D R + K B R + K m [ 1 + a e ζ ω n t sin ( ω d t + θ ) ]
Let the partial derivative of Equation (7) with respect to time t be 0; then, the time (tnadir) corresponding to the maximum frequency deviation can be obtained and the maximum frequency deviation can be deduced as follows:
Δ f n a d i r ( t n a d i r ) = R Δ P d D R + K B R + K m [ 1 + a e ζ ω n t n a d i r sin ( ω d t n a d i r + θ ) ]
According to the requirements of the technical guidelines for the safety and stability control of power systems in China, the maximum frequency deviation was set to 0.5 Hz. Thus, the total droop coefficient of DESs can be calculated from Equation (8) as follows:
K B = Δ P d [ 1 + a e ζ ω n t n a d i r sin ( ω d t n a d i r + θ ) ] Δ f n a d i r ( t n a d i r ) D K m R
After obtaining the PFR demand, the power dispatching and control center then sends it to each DES aggregator for further calculation.

3. Primary Frequency Regulation Power Allocation Model

As mentioned previously, this study developed a novel MPC-based power allocation model that incorporates both a predictive model and the receding horizon optimization model. In this section, the predictive model of aggregators is introduced first, followed by an elaboration of the receding horizon optimization model.

3.1. Predictive Model of Aggregators

DES has fast response characteristics, and its dynamic process can be expressed using the following first-order differential equation:
T B i a d Δ P B , i a d t + Δ P B , i a = Δ P B , i a , ref
where aA, and A is the set of DES aggregators; T B i a is the response time of the ith DES in aggregator a; and Δ P B , i a and Δ P B , i a , r e f denote the active power output increment and its reference for the ith DES in aggregator a, respectively.
The SOC of the DES will change during the charging and discharging processes. The transfer process of the SOC of the DES can be described as follows:
S i a = S i , 0 a 0 t Δ P B , i a d τ E B , i a
where S i , 0 a and S i a are the initial SOC and SOC at time t for the ith DES in aggregator a, respectively, and E B , i a is the rated capacity of the ith DES in aggregator a.
Therefore, the predictive model in Equations (10) and (11) for the ith DES in aggregator a can be expressed in the standard form as follows:
x ˙ i a = A i a x i a + B i a u i a
y i a = C i a x i a
where x i a = [ Δ P B , i a , S i a ]T is the state vector of the ith DES in aggregator a; u i a = [ Δ P B , i a , ref ] is the input vector of the ith DES in aggregator a; y i a = [ Δ P B , i a , S i a ]T denotes the output vector of the ith DES in aggregator a; and matrix A i a = 1 T B , i 0 1 E B , i a 0 , matrix B i a = 1 T B , i , 0 T , and matrix C i a = 1 , 1 T .
Assuming that Na represents the number of DESs that are owned by aggregator a, according to Equations (12) and (13), the predictive model of aggregator a can be expressed as follows:
x ˙ a = A a x a + B a u a
y a = C a x a
where xa = [ x 1 a ; x 2 a ;…; x N a a ]T denotes the state vector of aggregator a; ua = [ u 1 a ; u 2 a ; …; u N a a ]T is the input vector of aggregator a; and ya = [ y 1 a ; y 2 a ; …; y N a a ]T is the output vector of aggregator a. Matrix Aa = diag[ A 1 a , A 2 a , …, A N a a ], Ba = diag[ B 2 a , B 2 a , …, B N a a ], and Ca = diag[ C 1 a , C 2 a , …, C N a a ].
Based on the continuous model (14) and (15), the discrete model with sampling time Ts can be obtained as follows:
x a ( k + 1 ) = G a x a ( k ) + H a u a ( k )
y a ( k ) = C a x a ( k )
where G a = e A a T s , H a = ( 0 T s e A a t d t ) B a .

3.2. Receding Horizon Optimization Model

(1)
Objective
The objective of the PFR power allocation problem is to minimize the FR cost of the DES participating in the PFR, which includes the active power deviation cost and the SOC offset cost:
min 1 N p n = 1 N p a A i N a [ c B , i a ( Δ P B , i a ( k + n | k ) ) 2 + c S O C , i a E B , i a 2 ( S i a ( k + n | k ) S i a , ref ) 2 ]
where c B , i a denotes the active power deviation cost coefficient of the ith DES in aggregator a; c S O C , i a is the SOC offset cost coefficient of the ith DES in aggregator a; Δ P B , i a ( k + n | k ) refers to the active power output increment of the ith DES in aggregator a at time k + n; S i a ( k + n | k ) is the SOC of the ith DES in aggregator a at time k + n; and S i a , ref is the expected reference value of SOC of the ith DES in aggregator a.
(2)
Constraints
The active power output increment of DES should satisfy the following constraint:
P B , i a , max Δ P B , i a ( k + n | k ) P B , i a , max
where Δ P B , i a ( k + n | k ) and Δ P B , i a , max denote the active power output increment at time k + n and its maximum value for the ith DES in aggregator a, respectively.
The SOC of DES should satisfy its upper and lower limits as follows:
S i a , min S i a ( k + n | k ) S i a , max
where S i a , min and S i a , max are the minimum and maximum values of the SOC of the ith DES in aggregator a, respectively.
The active power output increment reference of aggregator a should be equal to the sum of the active power output increment references of its DESs as follows:
Δ P B a , ref ( k + n | k ) = i N a Δ P B , i a , ref ( k + n | k )
where Δ P B a , ref ( k + n | k ) and Δ P B , i a , ref ( k + n | k ) refer to the active power output increment references of aggregator a and its ith DES at time k + n, respectively, and Δf (k + n|k) denotes the frequency deviation at time k + n.
The sum of the active power output increment references of all aggregators should be equal to the PFR demand as follows:
a A Δ P B a , ref ( k + n | k ) = K B Δ f ( k + n | k )

4. Distributed Solution of PFR Power Allocation Model

For the convenience of discussion, the PFR power allocation model with multiple DES aggregators expressed by Equations (18)–(22) can be expressed as follows:
min a A f a ( x a )
s . t .   g ( x a ) = 0 , a A
h ( x a ) h ¯ ,   a A
where xa = [xa(I); xa(C)] represents the decision variables of aggregator a, xa(I) represents the internal variables of aggregator a, and xa(C) represents the coupling variables between aggregator a and other aggregators. Equation (24) consists of Equations (21) and (22), and Equation (25) consists of Equations (19) and (20).
In order to protect the privacy of each DES aggregator, the problem shown in Equation (20) can be transformed into a distributed quadratic programming problem and solved in a distributed manner using the DIPM [28]. The solution process is described below.

4.1. Construction of the Unconstrained QP Model

Considering the DES aggregator a as an example, its PFR power allocation model can be rewritten as follows:
min f a ( x a )
s . t .   g ( x a ) = 0
h ( x a ) h ¯
(1)
Construction of the Lagrange function
By introducing slack variables ma and Lagrange multipliers (or dual variables) ya and za to Equations (27) and (28), the Lagrange function can be obtained as follows:
L a = f a ( x a ) y a T g ( x a ) z a T [ h ( x a ) + m a h ¯ ] μ a i = 1 r ln m i a
where ma ≥ 0, za ≤ 0, r is the number of inequality constraints, and μa denotes the barrier factor of aggregator a.
(2)
Derivation for the Karush–Kuhn–Tucker (KKT) optimality conditions
The necessary condition for the existence of a minimal value of the Lagrangian function (29) is that the partial derivatives of the Lagrangian function with respect to all variables are 0. This leads to the following system of KKT equations:
L x a a = f a ( x a ) g T ( x a ) y a h T ( x a ) z a = 0
L y a a = g ( x a ) = 0
L z a a = h ( x a ) + m a h ¯ = 0
L m a a = Z a M a e + μ a e = 0
where Za = diag(za), Ma = diag(ma), and e refers to a unit column vector.
The complementary gap for aggregator a is defined as follows:
G a p a = ( z a ) T m a
Based on Equations (33) and (34), the following equation can be obtained:
μ a = G a p a r
(3)
Derivation of the correction equation
The KKT optimality conditions (30)–(33) can be solved using Newton’s method. The following correction equation can be obtained by retaining Δxa and Δya and eliminating other variables:
H g T ( x a ) g ( x a ) 0 Δ x a Δ y a = L ~ x a a L y a a
where
H = x a 2 f a ( x a ) x a 2 g ( x a ) y a x a 2 h ( x a ) z a h T ( x a ) ( Z a ) 1 M a h ( x a )
L ~ x a a = L x a a + h T ( x a ) ( M a ) 1 ( L m a a Z a L z a a )
(4)
Derivation of the unconstrained QP model
The correction Equation (36) can be converted into the following unconstrained QP model [33]:
min Δ x a , Δ y a 1 2 ( Δ x a ) T H Δ x a ( L ~ x a a ) T Δ x a + ( Δ y a ) T g ( x a ) Δ x a + L y a
By merging the unconstrained QP models of all aggregators, the aggregated unconstrained QP model can finally be obtained as follows:
min Δ x a , Δ y a a A 1 2 ( Δ x a ) T H Δ x a ( L ˜ x a a ) T Δ x a + ( Δ y a ) T g ( x a ) Δ x a + L y a

4.2. Approach for Solving the Unconstrained QP Model

The unconstrained QP model of aggregator a in Equation (39) can be written as a QP model, which is expressed in terms of the coupling variables’ increments. Each aggregator first forms its QP model, and then obtains the aggregated unconstrained QP model by communicating with the other aggregators. Thereafter, each aggregator solves the aggregated unconstrained QP model independently to obtain the coupling variables’ increments, which, in turn, updates the primal and dual variables. The specific process is outlined in what follows.
(1)
The construction of QP models expressed in the coupling variables’ increments
For the unconstrained QP problem in Equation (39), the decision variables’ increments are rearranged in the order of the internal variables’ increments and coupling variables’ increments, that is, Δxa = [Δxa(I); Δxa(C)]. Then, corresponding adjustments are made to the dual variables’ increments and the coefficient matrices, and the following equation can be obtained:
min Δ x a ( I ) , Δ y a 1 2 Δ x a ( I ) T H II a Δ x a ( I ) L ~ x ( I ) a H IC a Δ x a ( C ) T Δ x a ( I ) + Δ y a T g I ( x a ) Δ x a ( I ) + L y a + g C ( x a ) Δ x a ( C ) + 1 2 Δ x a ( C ) T H CC a Δ x a ( C ) L ~ x ( C ) a T Δ x a ( C )
where the coupling variables’ increments are regarded as parameters.
Therefore, Equation (41) can be written as follows:
H CC a g I ( x a ) T g I ( x a ) 0 Δ x a ( I ) Δ y a = L x ( I ) a H IC a Δ x a ( C ) L y a + g C ( x a ) Δ x a ( C )
According to Equation (42), the internal variables’ increments and dual variables’ increments can be expressed in terms of the coupling variables’ increments as follows:
Δ x a ( I ) = R x Δ x a ( C ) + r x
Δ y a = R y Δ x a ( C ) + r y
Substituting Equations (43) and (44) into Equation (41), the QP models expressed in the coupling variables’ increments can be expressed as follows:
F ¯ a ( Δ x a ( C ) ) = 1 2 Δ x a ( C ) T C 1 a Δ x a ( C ) + C 2 a T Δ x a ( C ) + c a
where C 1 a denotes the coefficient matrix corresponding to the quadratic terms, C 2 a denotes the coefficient vector corresponding to linear terms, and c a is a constant.
(2)
Solving for the coupling variables’ increments
After building the QP model (45) expressed in terms of the coupling variables’ increments, each aggregator then shares its C 1 a and C 2 a with other aggregators through the communication network to obtain the aggregated unconstrained QP model (46). The coupling variables’ increments can be obtained as follows:
min Δ x a ( B ) a A F ¯ a ( Δ x a ( C ) )
(3)
Updating the primal and dual variables
Substituting the coupling variables’ increments into Equations (43) and (44), the internal variables’ increments and dual variables’ increments can be subsequently obtained. The primal and dual variables can then be updated by the following equations:
x a = x a + α p Δ x a
y a = y a + α d Δ y a
m a = m a + α p Δ m a
z a = z a + α d Δ z a
Thus, the computational steps of the DIPM can be summarized as follows:
Step 0:Give k = 0; set tolerance ε = 10−4; for aggregator a, initialize its primal variables xa(k) and ma(k) and dual variables ya(k) and za(k).
Step 1:Calculate complementary gap Gapa(k) for each aggregator and obtain the maximum complementary gap Gapmax(k) by communicating with other aggregators.
If Gapmax(k) < ε, then output the optimal solution and stop.
Step 2:Each aggregator calculates C 1 a and C 2 a in Equation (45) independently and obtain the aggregated unconstrained QP model (46) by communicating with other aggregators.
Step 3:Each aggregator solves Equation (46) independently to obtain Δxa(C)(k) and subsequently computes Δxa(I)(k), Δya(k), Δma(k), and Δza(k).
Step 4:Update xa(k + 1), ya(k + 1), ma(k + 1), and za(k + 1) according to Equations (47)–(50).
Step 5:Set k = k + 1; go to step 1.

5. Case Studies and Analysis

Numerical experiments were conducted with the Dell Precision 3660 Tower with Intel® CoreTM i7-12700K [email protected] GHz and 32 GB RAM. The algorithm was coded using MATLAB R2022a software.

5.1. Parameter Setup

To verify the effectiveness of the proposed method, a unified transmission and distribution system with two DES aggregators to provide PFR service was utilized, as shown in Figure 3. The parameters of the frequency response model of the system [34] are listed in Table 1. The parameters of DESs are listed in Table 2. The expected reference values of the SOC of DESs were set as 0.5. The sampling time was 0.05 s, the control cycle was 0.2 s, and the prediction horizon was 5 s. The convergence accuracy of the DIPM was set as ε = 10−4.
Two cases were designed to demonstrate the advantages of the proposed PFR power allocation strategy.
Case 1: System load increased by 45 MW at t = 10 s.
Case 2: System load decreased by 40 MW at t = 10 s.
According to Equation (3), the total droop coefficients KB of the DESs in case 1 and case 2 were found to be 32.1 and 21, respectively.
To illustrate the superiority of the proposed PFR power allocation strategy, it was compared with the traditional allocation strategy (i.e., the strategy based on available regulation capacity used in [5,6,7,8,9]) in both case 1 and case 2.

5.2. Result Analysis

To fully reflect the differences in the PFR power allocation strategy of various types of DESs, five representative DESs, that is, DES2, DES4, DES5, DES7, and DES8, were selected for detailed analysis.

5.2.1. Analysis of Case 1

The change in the system frequency after the system load increased by 45 MW abruptly is shown in Figure 4. After the 45 MW load step rise, when DESs do not participate in FR, the lowest system frequency was 49.26 Hz, and the maximum frequency deviation reached 0.74 Hz, which does not satisfy the frequency requirements for the safe and stable operation of the power system. When the DESs participated in FR, the maximum frequency deviation of the system was reduced to 0.5 Hz, and the steady-state frequency increased from 49.63 to 49.70 Hz.
Figure 5 shows the PFR power response of the aggregators under different allocation strategies in case 1. Aggregator 2 took on a heavier FR task than aggregator 1 with the proposed allocation strategy because its DESs had a lower FR cost coefficient. Adopting the traditional allocation strategy resulted in the same phenomenon, but this was because the available regulation capacity of aggregator 2 was larger than that of aggregator 1, meaning that its output was also larger than that of aggregator 1. Comparing the two allocation strategies, we could determine that the output of aggregator 2 with the proposed allocation strategy was larger than that of aggregator 2 with the traditional allocation strategy, while the opposite was true for aggregator 1. This was because the proposed strategy took into account the FR cost coefficients of the DESs; because the cost coefficient of aggregator 2 was lower, its output power was larger than that of aggregator 2 using the traditional allocation strategy. Similarly, aggregator 1 had a higher cost coefficient, and thus, its output was smaller than that of aggregator 1 using the traditional allocation strategy.
Table 3 shows the FR costs when using the two allocation strategies in case 1. Compared with the traditional strategy, the proposed allocation strategy took the FR cost into consideration. Therefore, when the proposed allocation strategy was adopted to allocate the FR power, aggregator 1, which had a higher FR cost coefficient, was allocated less FR power, resulting in its FR cost being lower than that when the traditional allocation strategy was used. Because the FR cost coefficient of aggregator 2 was lower, it took on more FR tasks, which made its FR cost higher. By comparing the total FR cost with the two allocation strategies, it could be determined that the proposed allocation strategy was more economical than the traditional strategy.
Figure 6 illustrates the outputs of DESs in case 1. Figure 6 reveals that DES8 had the largest output in the FR process since its active power deviation cost coefficient was the smallest, whereas DES2 had the smallest output due to it having the highest power deviation cost coefficient. The technical parameters of DES4, DES5, and DES7 were identical, but the initial SOC differed considerably. Among the three DESs, the output of DES4 was the smallest in the FR process because its initial SOC was less than the expected reference value of the SOC, whereas DES7 maintained the largest output because its initial SOC was larger than the expected reference value. The output of DES5 was between those of DES4 and DES7 because its initial SOC was the same as the expected reference value of the SOC.
Figure 7 shows the change in the SOC of different DESs in Case 1. Figure 7a reveals that the change in the SOC of DES8 was more evident than that of DES2 since DES8 exhibited the largest capacity and the largest output, while DES2 had the smallest capacity and the smallest output, which are presented in Table 2 and Figure 6. Although DES4, DES5, and DES7 had the same rated capacity, the change in their SOCs differed, as shown in Figure 7a–c. Among these three DESs with the same rated capacity, the larger the output was, the more the SOC changed.

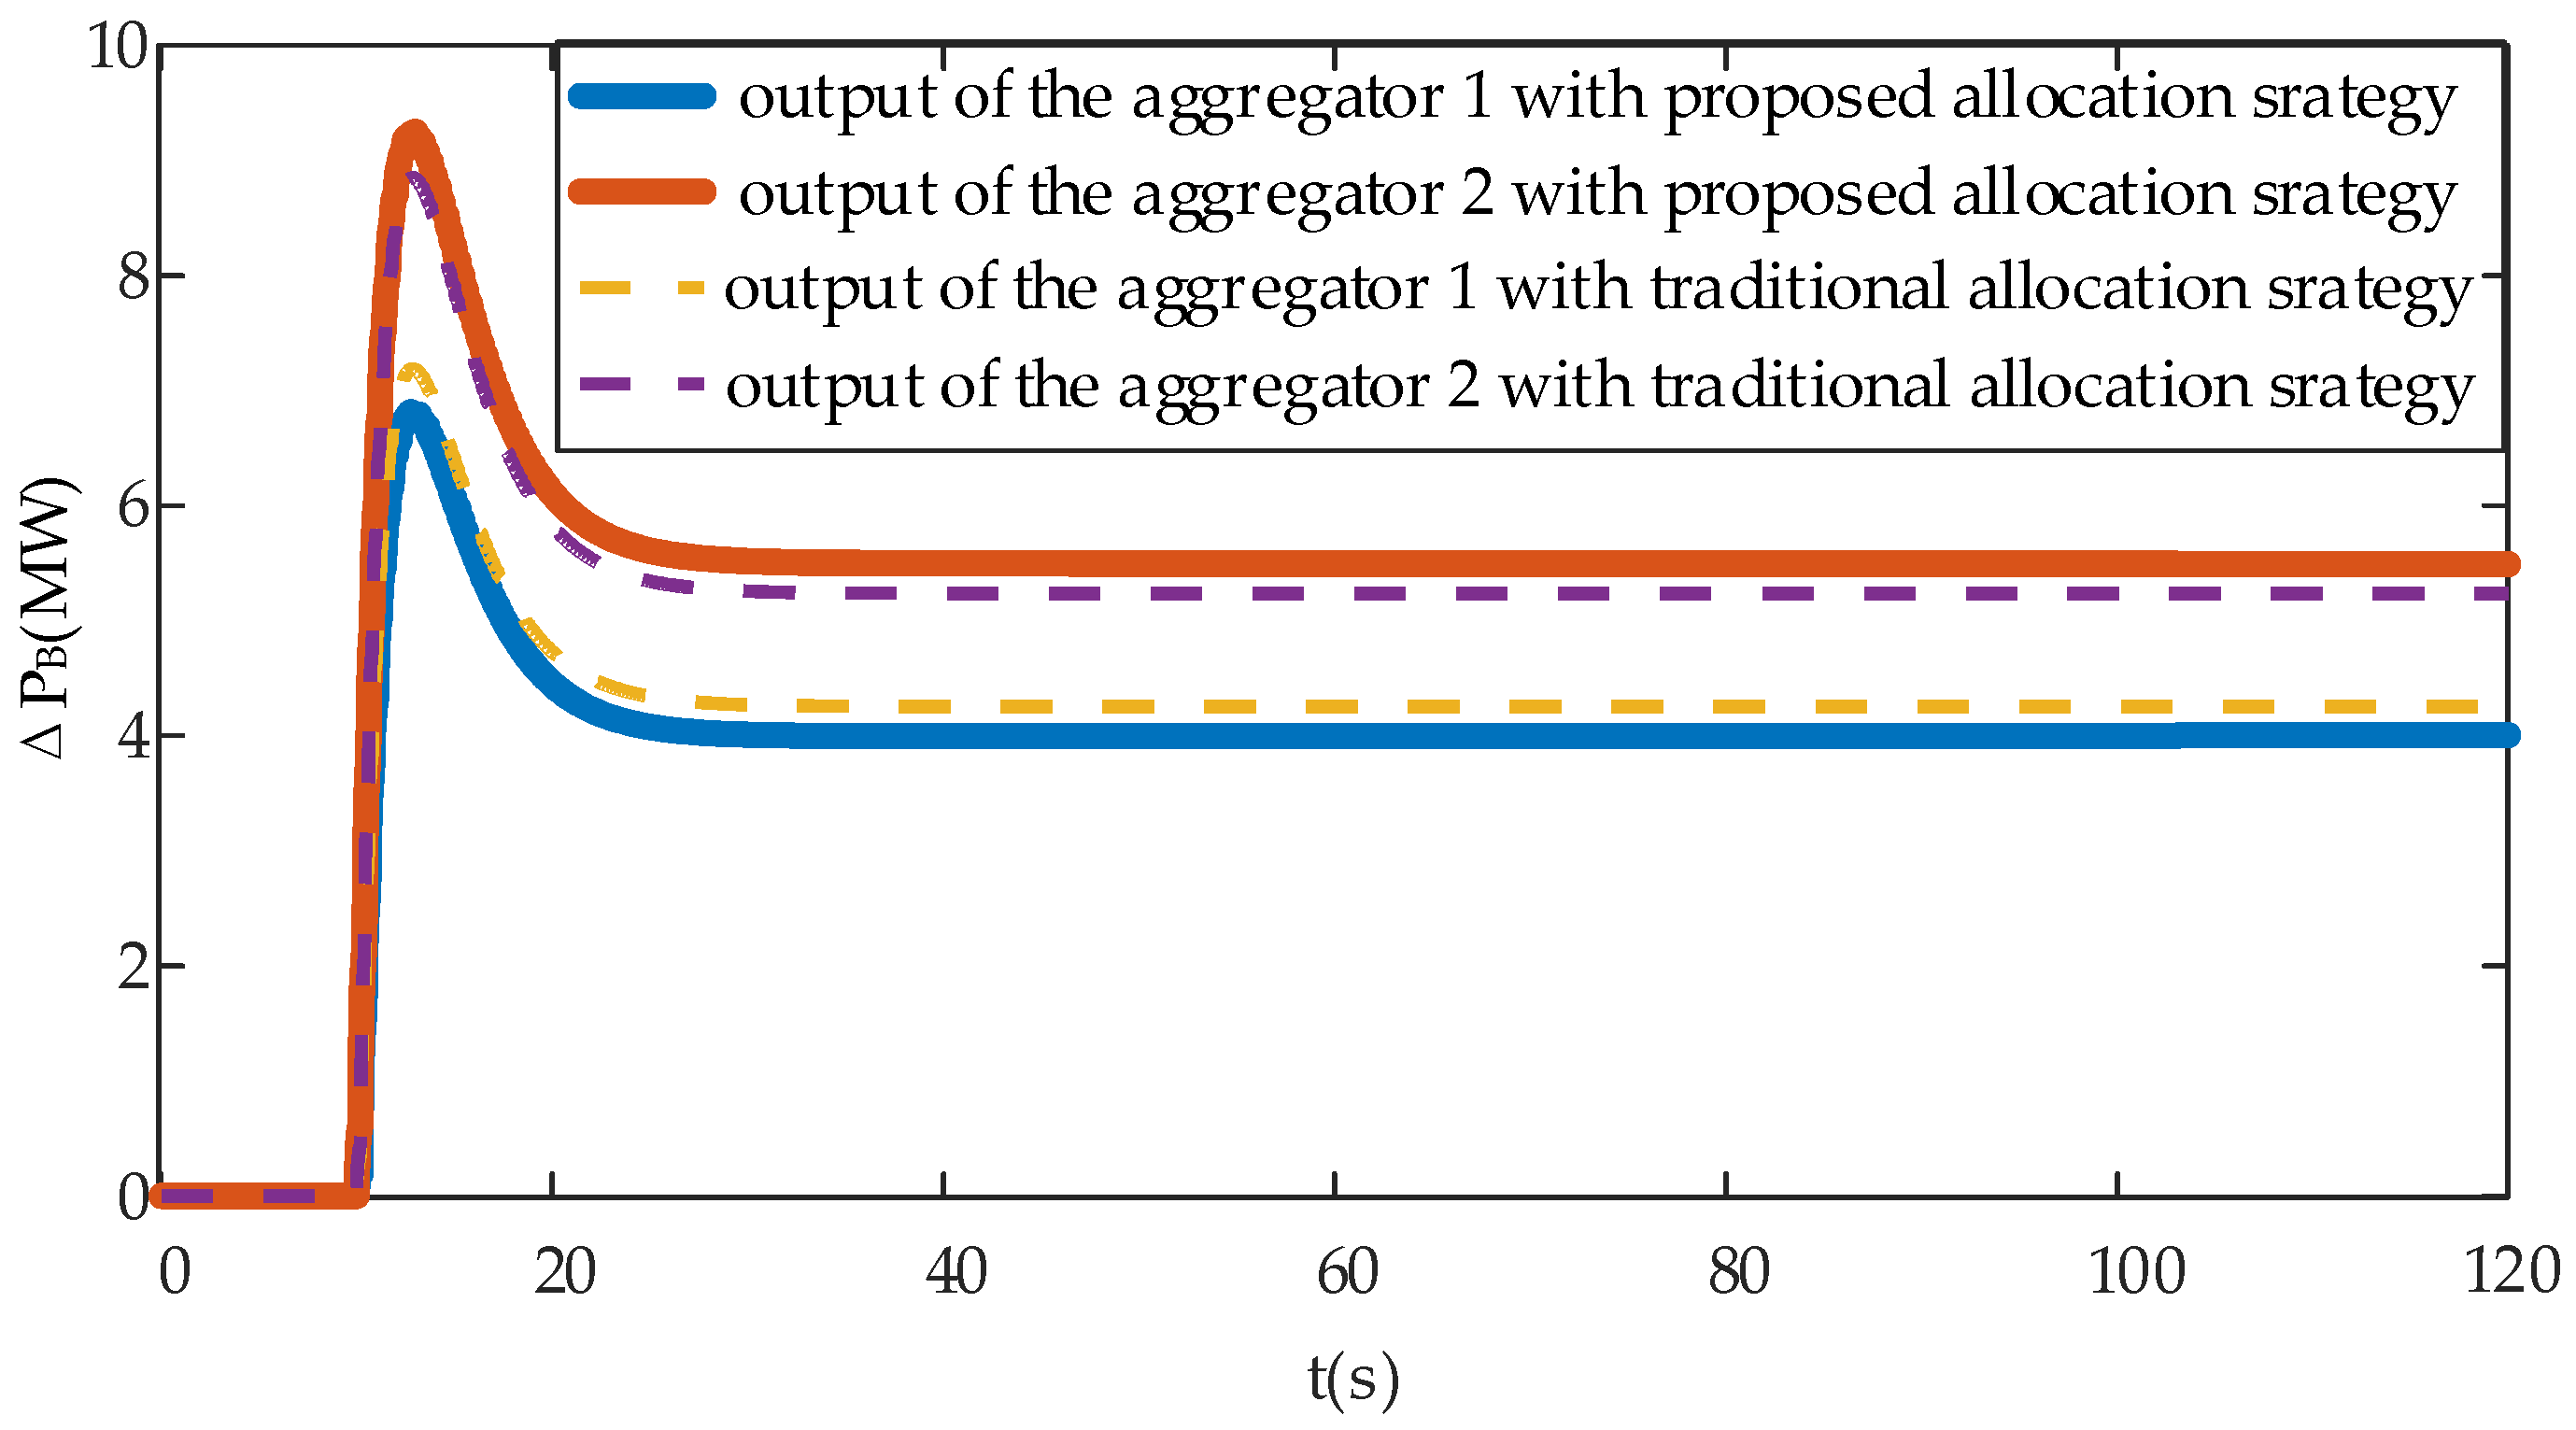
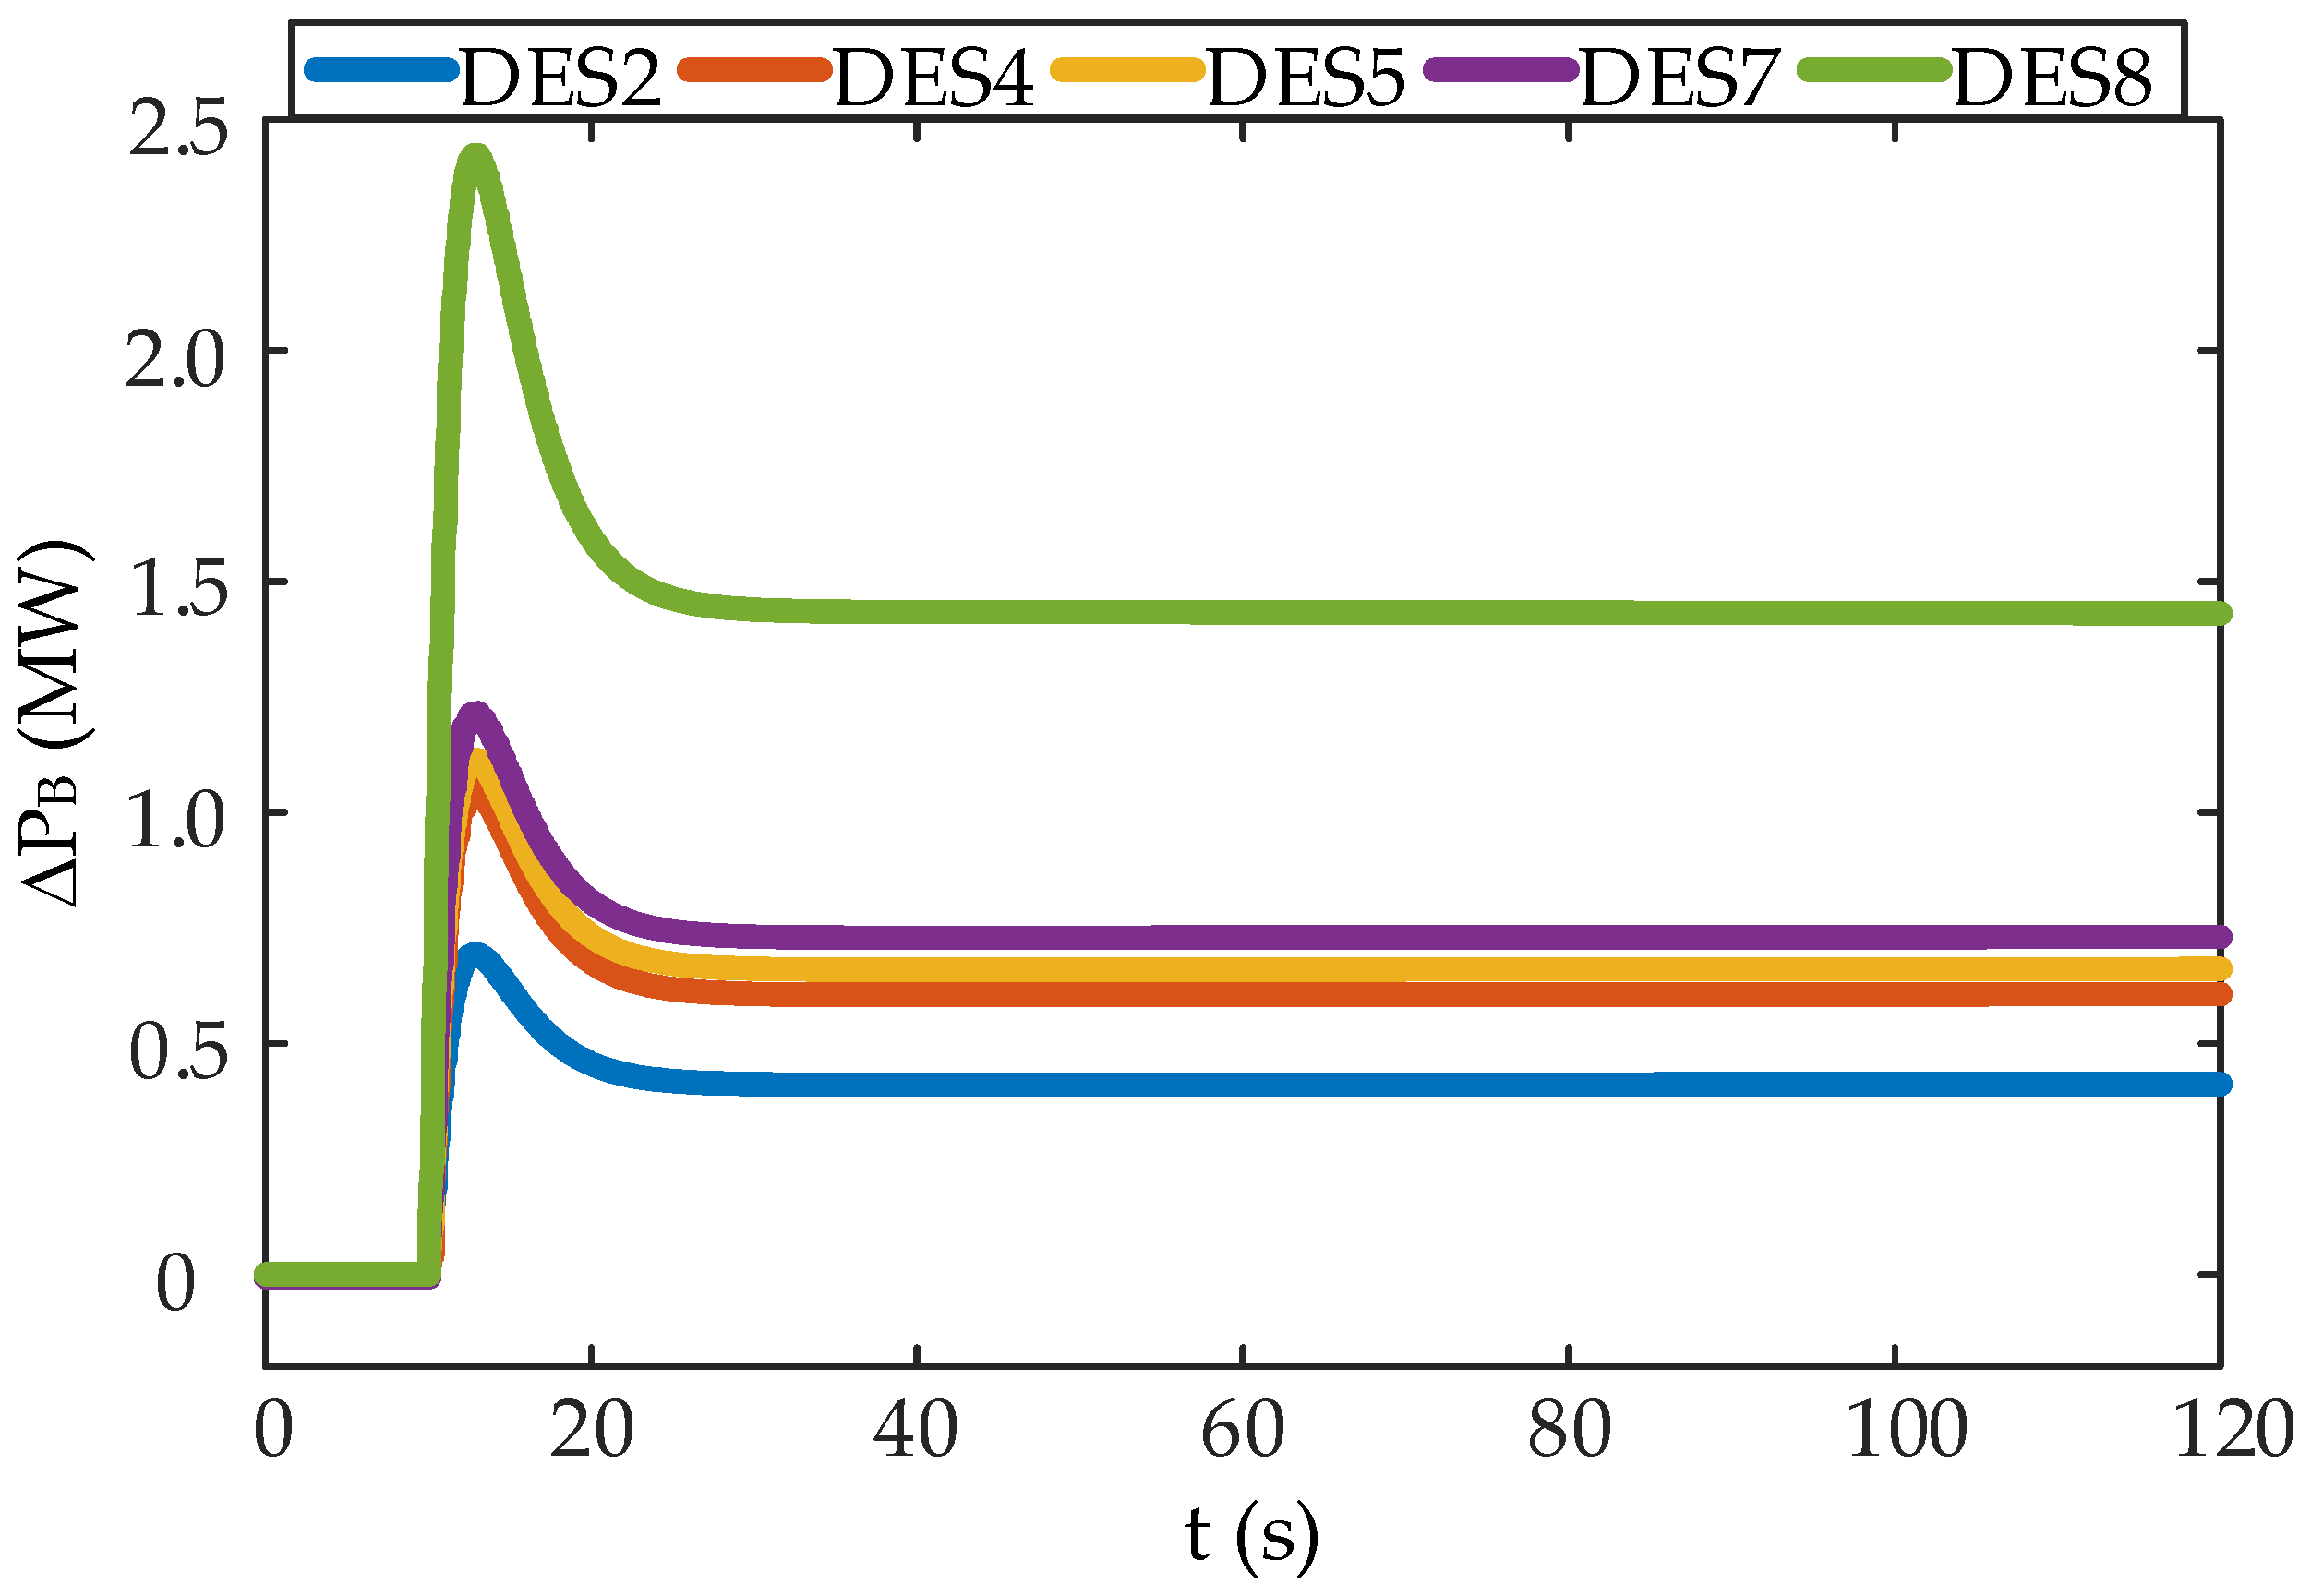
5.2.2. Analysis of Case 2

After a sudden reduction in the system load by 40 MW, the change in the system frequency is illustrated in Figure 8.
Figure 8 reveals that after the load step-down disturbance occurred when the DESs participated in FR, the highest system frequency was 50.65 Hz, and the maximum frequency deviation was 0.65 Hz, which did not satisfy the frequency requirements for the safe and stable operation of the system. When the DESs participate in FR, the maximum frequency deviation of the system was reduced to 0.5 Hz, and the steady-state frequency was reduced from 50.33 to 50.28 Hz.
Figure 9 shows the PFR power response of the aggregators under different allocation strategies in case 2. Similar to case 1, the DESs’ active power deviation cost coefficient of aggregator 2 was lower than that of aggregator 1. Therefore, aggregator 2 had a larger output under the proposed allocation strategy. The output of aggregator 2 was also larger than that of aggregator 1 when adopting the traditional allocation strategy because aggregator 2 had a larger available regulation capacity. Compared with the two allocation strategies, it can be seen that the output of aggregator 2 with the proposed allocation strategy was larger than that when using the traditional allocation strategy, whereas the opposite was true for aggregator 1. The reason for this was that the proposed strategy considers the FR cost coefficient of the DESs and the cost coefficient of aggregator 2 was lower, and thus, its output power was larger than that of aggregator 2 using the traditional allocation strategy. Similarly, because aggregator 1 had a larger cost coefficient, its output was lower when using the proposed strategy than when using the traditional allocation technique.
Table 4 shows the FR costs under the two allocation strategies in case 2. Similar to case 1, because the proposed allocation method considers FR cost, for aggregator 1, which had a small FR cost coefficient, the FR cost using the proposed strategy was smaller than that when using the traditional strategy. Meanwhile, the FR cost of aggregator 2 under the proposed strategy was higher than that of the traditional strategy because aggregator 2 had a smaller FR cost coefficient and bore more FR tasks. Compared with the total FR cost, we could find that the proposed allocation strategy was more economical than the traditional allocation strategy.
Figure 10 shows the outputs of the DESs in case 2. Similar to case 1, DES8 undertook most of the FR tasks because of its smallest active power deviation cost coefficient, whereas DES2 had the largest active power deviation cost coefficient. Therefore, the charging power of DES2 was the smallest. The charging power of DES5 was larger than that of DES7 but smaller than that of DES4, as the DESs were in the charging state in case 2. Thus, under a sudden reduction of power load, for DESs with the same rated capacity, the smaller the initial SOC was, the larger the charging power was.
Figure 11 shows the change in SOC of DESs in case 2. Figure 11a reveals that although DES8 had the largest capacity, it had the largest charging power during the FR process, which resulted in its SOC change being more evident than that of DES2, which had a small capacity and less charging power. For DES4, DES5, and DES7, although their rated capacities were identical, the change in their SOCs differed, as shown in Figure 7a–c. For the three DESs with the same rated capacity, the larger the charging power was, the more the SOC changed.

5.2.3. Sensitivity of the PFR Power Allocation Model

The prediction horizon is an important parameter of MPC, and it is used to control how far into the future the MPC predicts the system response when evaluating the optimality of the control objective. A longer prediction horizon generally increases the control performance but also results in increasing the computational complexity. In this subsection, we present the analysis results of the sensitivity of the performance of the proposed model in case 1 with different prediction horizons, as shown in Table 5.
As can be seen from Table 5, the optimization objective of the proposed model (i.e., the total cost of frequency regulation) decreased as the prediction horizon increased and the solution time increased. The optimization objective of the model decreased at an accelerated rate when the prediction horizon varied from 2 s to 5 s, but the decreasing speed slowed down considerably from 5 s to 10 s; meanwhile, the computation time consistently increased. Considering the optimization objective and the solution time, 5 s was the most appropriate prediction horizon for the model proposed in this study.

5.2.4. Performance of the DIPM

To demonstrate the effectiveness and superiority of the solution algorithm, the DIPM and other distributed optimization algorithms, such as ADMM and the synchronous alternating direction multiplier method (S-ADMM), were compared. Quadprog, which is a QP solver in MATLAB, was used as a benchmark for the comparison. Details on the computational performance in case 1 are presented in Table 6. The parameters of ADMM were set to the following: ρ = 0.05, λ0 = 1, and ε = 10−4. The parameters of S-ADMM were the same as that of ADMM.
Table 6 reveals that the DIPM was consistent with Quadprog in terms of solution accuracy. From the perspective of computational efficiency, compared with ADMM, S-ADMM had a shorter solution time, but also had more iterations, which resulted in higher requirements for communication reliability; meanwhile, the DIPM was optimal in terms of iterations and solving time. The results revealed that the DIPM could guarantee a good solution speed while ensuring high accuracy.

5.2.5. Scalability of the PFR Power Allocation Strategy

To demonstrate the scalability of the proposed allocation strategy, an extended system (i.e., a unified transmission and distribution system with four DES aggregators to provide PFR service) was established, as shown in Figure 12. The parameters of the frequency response model of the system can be found in [35], and the parameters of the DESs are listed in Table A1.
To demonstrate the advantages of the proposed PFR power allocation strategy, a case in which the system load increased by 150 MW at t = 10 s was designed. According to Equation (9), the total droop coefficient KB of the DESs in this case was found to be −116.6.
Table 7 shows the FR costs with the two allocation strategies applied in the extended system. It can be seen from the table that the power allocation strategy proposed in this paper was more economical than the traditional allocation strategy when applied to larger power systems or when there was an increased number of DES aggregators.
Table 8 shows the details of the computational performance of the four algorithms applied in the extended system. The parameters of the four algorithms were the same as those in Section 5.2.4. Comparing the results in Table 6 and Table 8, it can be seen that when applied to a larger power system or when there was an increased number of DES aggregators, the iterations and solution time of ADMM and S-ADMM increased rapidly and their computational efficiencies could not meet the FR requirements of the power grid. Meanwhile, the DIPM only required nine iterations to converge and had a solution time of 0.1421 s, which was much smaller than that of ADMM and S-ADMM. The computational performance in the extended system fully demonstrated the superiority of the DIPM for distributed solutions.

6. Conclusions

To solve the problem of insufficient FR capacity of power systems resulting from the high penetration of various sources of renewable energy, such as wind power and photovoltaic power, an MPC-based PFR power allocation model for DES aggregators was developed. Based on the simulation results, the following conclusions could be drawn:
(1)
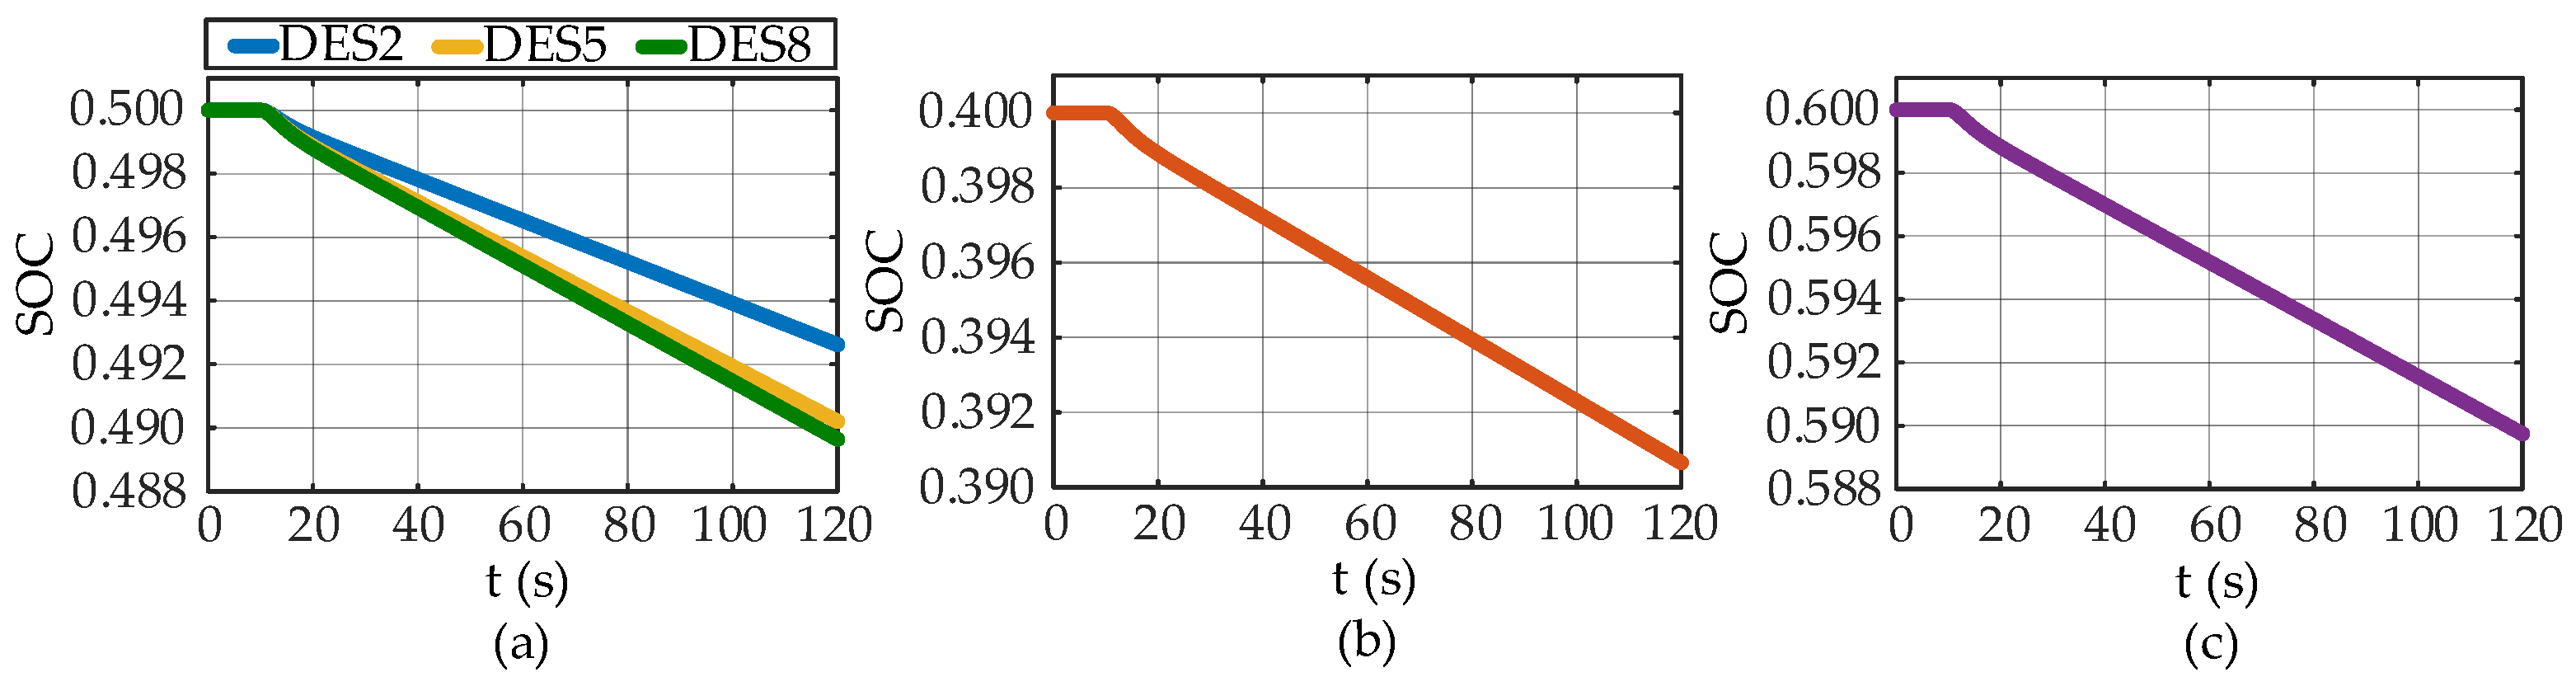
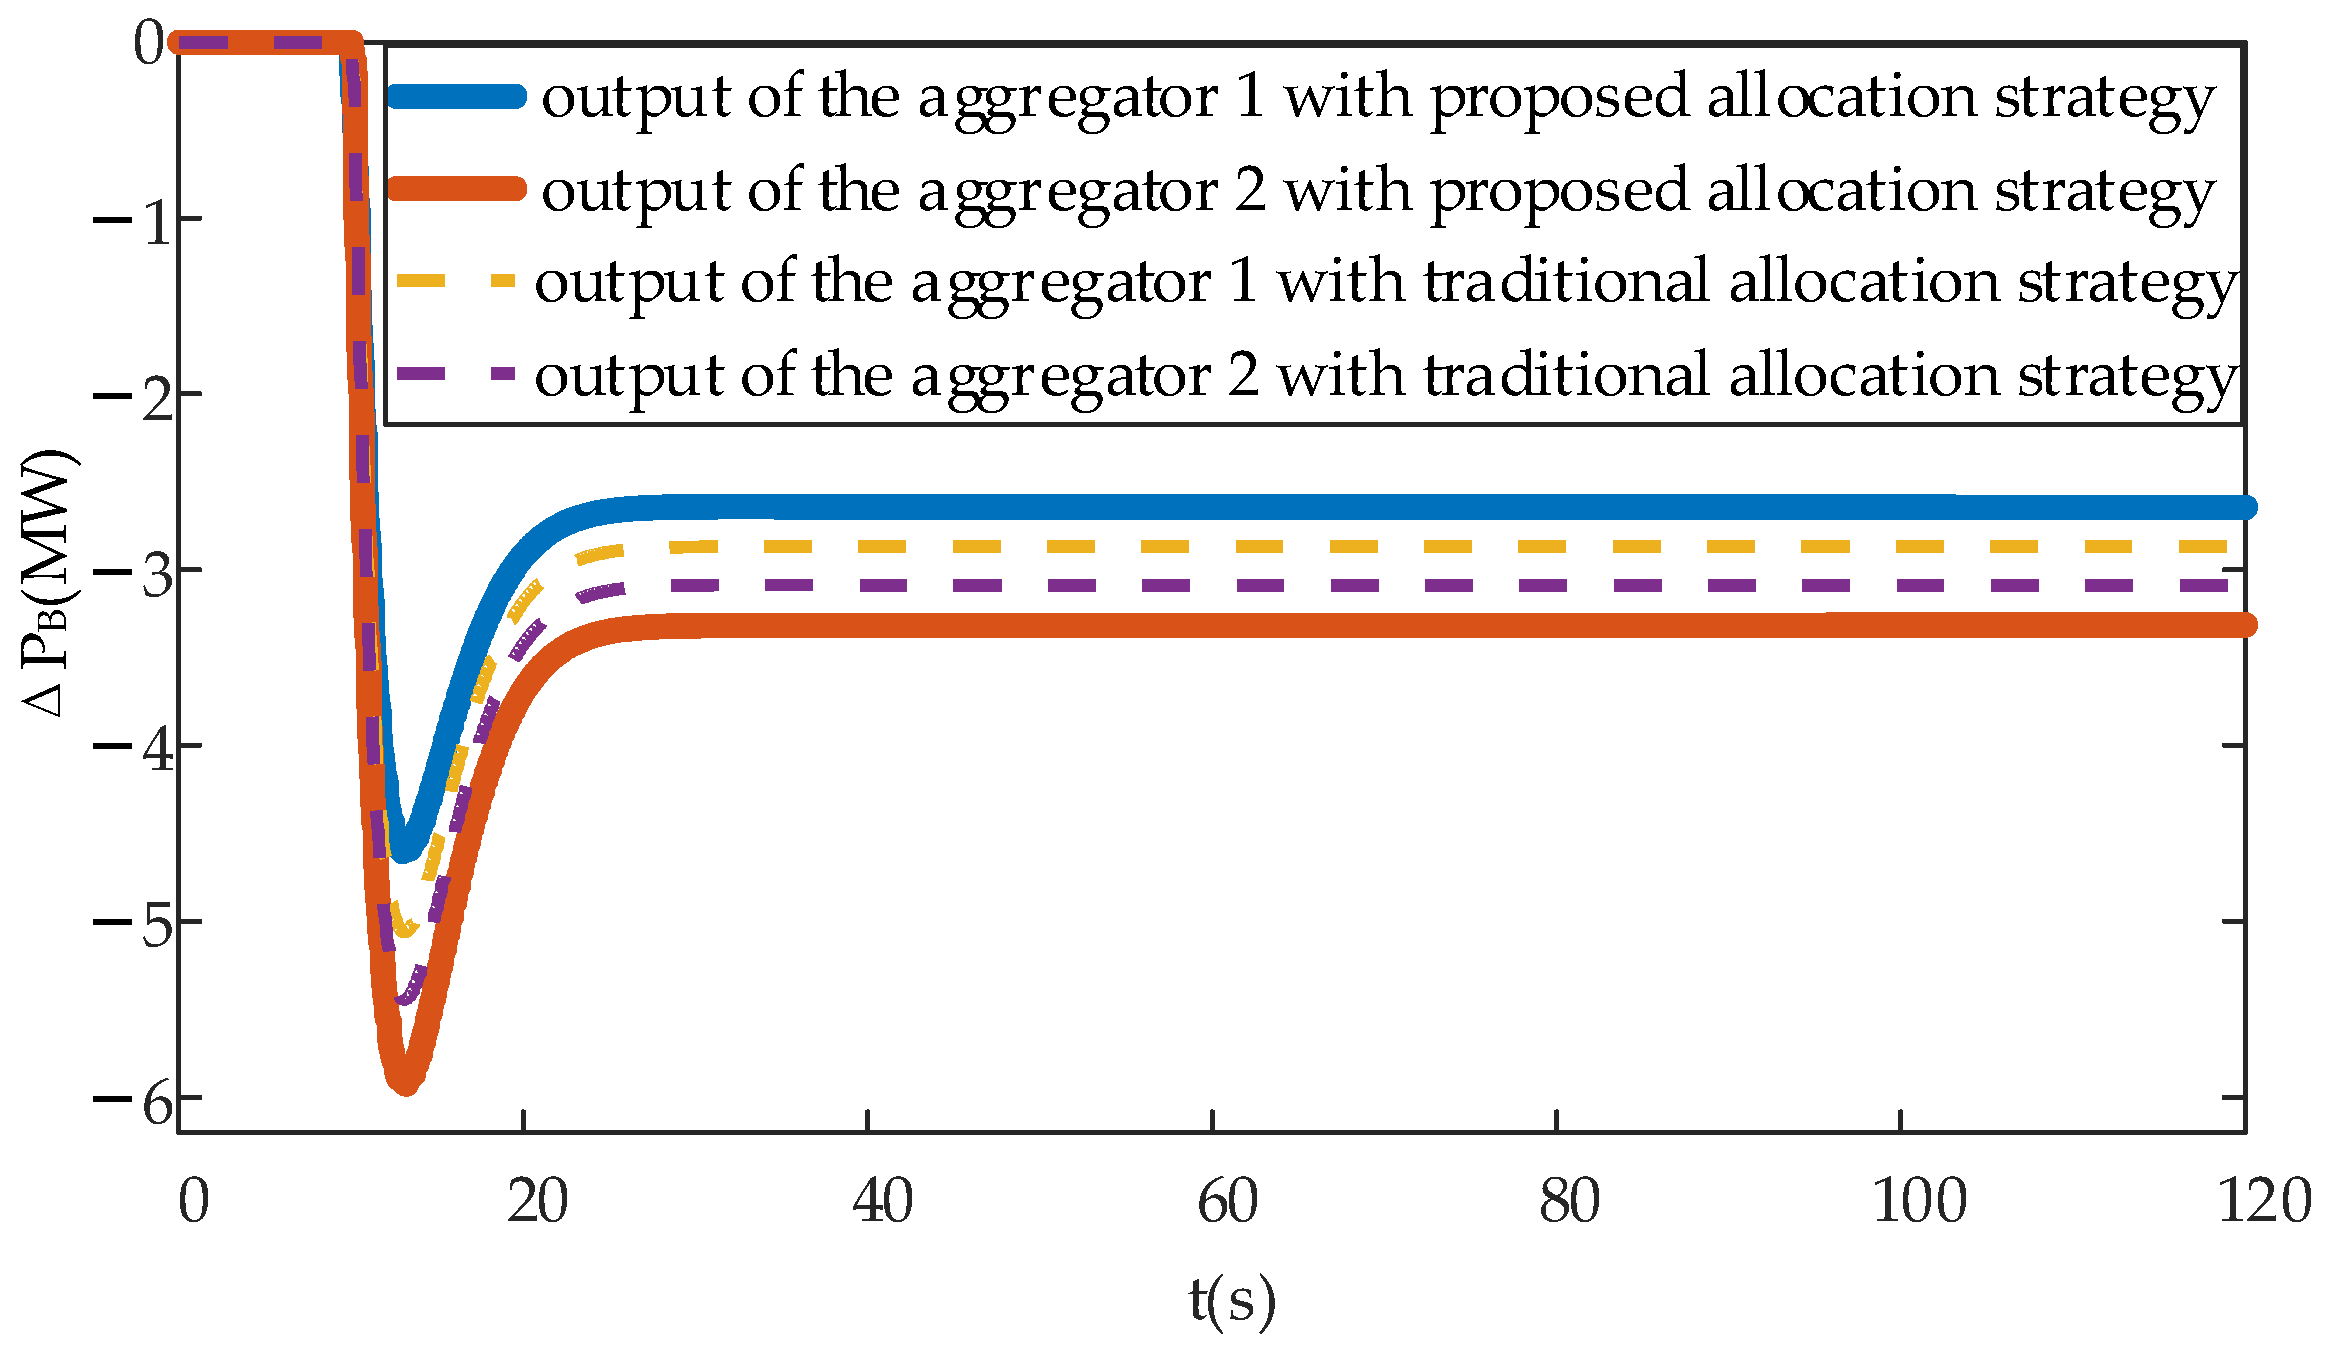
The proposed PFR power allocation strategy can fully consider the differences in the power, capacity, SOC, and FR cost of various types of DESs and intelligently allocate the FR tasks. Furthermore, the proposed allocation strategy can slow down the SOC offset in the FR process to ensure the continuity of DES participating in FR.
(2)
By applying the DIPM technique for distributed solving, the information exchanged by each aggregator does not involve any private data or the variable information of a single DES, which can ensure the privacy of each aggregator. In addition, compared with ADMM and S-ADMM, the DIPM was superior in terms of both computational efficiency and regulation performance.
However, the proposed PFR power allocation strategy requires predicting the behavior of the system, and the implementation cost of this was relatively high. Although the DIPM was used to transform the model into an unconstrained quadratic programming problem for distributed solutions, its calculation requirements were still larger than those of traditional allocation strategies [5,6,7,8,9]. Moreover, data communication is an essential part of distributed algorithms in real-world scenarios. Future work will focus on the influence of partial information loss on the convergence of the algorithm in the data communication process and on finding a suitable correction strategy to make the algorithm more robust.

Author Contributions

Conceptualization, T.M. and Y.G.; methodology, S.H., Y.G. and M.L.; software, Y.G., T.M. and M.L.; validation, S.H., W.Z. and T.W.; formal analysis, T.M., Y.G. and W.T.; investigation, Y.G. and W.Z.; resources, T.M. and W.Z.; data curation, T.M., W.T. and T.W.; writing—original draft preparation, Y.G. and M.L.; writing—review and editing, T.M., Y.G. and M.L. All authors have read and agreed to the published version of the manuscript.

Funding

This research was funded by the Science and Technology Project of the China Southern Power Grid Company: “Research and demonstration application of key technologies for large-scale interaction between electric vehicles and power grids (Phase I),” (SZKJXM20210138/090000KK52210132).

Data Availability Statement

Not applicable.

Acknowledgments

We thank LetPub (www.letpub.com (accessed on 17 August 2023)) for its linguistic assistance during the preparation of this manuscript.

Conflicts of Interest

The authors declare no conflict of interest.

Appendix A

Table A1. Parameters of various distributed energy storages (DESs) in the extended case.
Aggregator NumberDES NumberDES TypeMaximum Active Power (MW)Rated
Capacity (MWh)
Initial SOCActive Power Deviation Cost CoefficientSOC Offset Cost Coefficient
11Supercapacitor201.0850.50.30.15
12Superconducting magnetic energy storage141.7550.50.70.15
13Lithium battery energy storage104.450.50.20.15
14Flywheel energy storage112.0550.40.450.15
25Flywheel energy storage182.0550.50.450.15
26Supercapacitor141.1250.50.30.15
27Flywheel energy storage142.0550.60.450.15
28Lithium battery energy storage104.360.50.20.15
39Lithium battery energy storage94.440.50.20.15
310Supercapacitor181.1380.50.30.15
311Flywheel energy storage181.1250.60.30.15
312Superconducting magnetic energy storage141.7550.30.70.15
413Lithium battery energy storage104.450.50.20.15
414Lithium battery energy storage95.240.50.20.15
415Supercapacitor181.1380.40.30.15
416Flywheel energy storage182.0550.50.450.15

References

  1. Fernández-Guillamón, A.; Gómez-Lázaro, E.; Muljadi, E.; Molina-García, Á. Power Systems with High Renewable Energy Sources: A Review of Inertia and Frequency Control Strategies over Time. Renew. Sustain. Energy Rev. 2019, 115, 109369. [Google Scholar] [CrossRef]
  2. Kez, D.A.; Foley, A.M.; Morrow, D.J. Analysis of Fast Frequency Response Allocations in Power Systems with High System Non-Synchronous Penetrations. IEEE Trans. Ind. Appl. 2022, 58, 3087–3101. [Google Scholar] [CrossRef]
  3. Yoo, Y.; Jung, S.; Jang, G. Dynamic Inertia Response Support by Energy Storage System with Renewable Energy Integration Substation. J. Mod. Power Syst. Clean Energy 2020, 8, 260–266. [Google Scholar] [CrossRef]
  4. Xiang, Y.; Lu, Y.; Liu, J. Deep Reinforcement Learning Based Topology-Aware Voltage Regulation of Distribution Networks with Distributed Energy Storage. Appl. Energy 2023, 332, 120510. [Google Scholar] [CrossRef]
  5. Ghazavi Dozein, M.; Gomis-Bellmunt, O.; Mancarella, P. Simultaneous Provision of Dynamic Active and Reactive Power Response from Utility-Scale Battery Energy Storage Systems in Weak Grids. IEEE Trans. Power Syst. 2021, 36, 5548–5557. [Google Scholar] [CrossRef]
  6. Zhu, D.; Zhang, Y.-J.A. Optimal Coordinated Control of Multiple Battery Energy Storage Systems for Primary Frequency Regulation. IEEE Trans. Power Syst. 2019, 34, 555–565. [Google Scholar] [CrossRef]
  7. Sun, J.; Zhao, Y.; Zhang, N.; Chen, X.; Hu, Q.; Song, J. A Dynamic Distributed Energy Storage Control Strategy for Providing Primary Frequency Regulation Using Multi-armed Bandits Method. IET Gener. Transm. Distrib. 2022, 16, 669–679. [Google Scholar] [CrossRef]
  8. Mejia-Ruiz, G.E.; Paternina, M.R.A.; Segundo Sevilla, F.R.; Korba, P. Fast Hierarchical Coordinated Controller for Distributed Battery Energy Storage Systems to Mitigate Voltage and Frequency Deviations. Appl. Energy 2022, 323, 119622. [Google Scholar] [CrossRef]
  9. Cheng, Y.; Tabrizi, M.; Sahni, M.; Povedano, A.; Nichols, D. Dynamic Available AGC Based Approach for Enhancing Utility Scale Energy Storage Performance. IEEE Trans. Smart Grid 2014, 5, 1070–1078. [Google Scholar] [CrossRef]
  10. Djouadi, H.; Ouari, K.; Belkhier, Y.; Lehouche, H.; Ibaouene, C.; Bajaj, M.; AboRas, K.M.; Khan, B.; Kamel, S. Non-linear Multivariable Permanent Magnet Synchronous Machine Control: A Robust Non-linear Generalized Predictive Controller Approach. IET Control. Theory Appl. 2023, 17, 1688–1702. [Google Scholar] [CrossRef]
  11. Ouali, N.; Lehouche, H.; Belkhier, Y.; Achour, A. Indoor Temperature Regulation and Energy Consumption inside a Working Office in Building System Using a Predictive Functional Control. Energy Sources Part A Recovery Util. Environ. Eff. 2021, 1–21. [Google Scholar] [CrossRef]
  12. Wang, X.; Li, X.; Ni, W.; Wen, F. A Model Predictive Control Based Optimal Task Allocation among Multiple Energy Storage Systems for Secondary Frequency Regulation Service Provision. Energies 2023, 16, 1228. [Google Scholar] [CrossRef]
  13. Oshnoei, A.; Kheradmandi, M.; Muyeen, S.M. Robust Control Scheme for Distributed Battery Energy Storage Systems in Load Frequency Control. IEEE Trans. Power Syst. 2020, 35, 4781–4791. [Google Scholar] [CrossRef]
  14. Dou, C.-X.; Yang, J.; Li, X.; Gui, T.; Bi, Y. Decentralized Coordinated Control for Large Power System Based on Transient Stability Assessment. Int. J. Electr. Power Energy Syst. 2013, 46, 153–162. [Google Scholar] [CrossRef]
  15. Huang, B.; Li, Y.; Zhan, F.; Sun, Q.; Zhang, H. A Distributed Robust Economic Dispatch Strategy for Integrated Energy System Considering Cyber-Attacks. IEEE Trans. Ind. Inform. 2022, 18, 880–890. [Google Scholar] [CrossRef]
  16. Duan, Y.; He, X.; Zhao, Y. Distributed Algorithm Based on Consensus Control Strategy for Dynamic Economic Dispatch Problem. Int. J. Electr. Power Energy Syst. 2021, 129, 106833. [Google Scholar] [CrossRef]
  17. Pourbabak, H.; Alsafasfeh, Q.; Su, W. A Distributed Consensus-Based Algorithm for Optimal Power Flow in DC Distribution Grids. IEEE Trans. Power Syst. 2020, 35, 3506–3515. [Google Scholar] [CrossRef]
  18. Chai, Y.; Liu, Y.; Bai, L.; Wang, C.; Guo, L.; Wang, Z.; Xue, Y. Hierarchical Distributed Optimal Power Flow of HV and MV Distribution Networks with Continuous and Discrete Devices. IEEE Trans. Power Syst. 2023, 38, 1009–1021. [Google Scholar] [CrossRef]
  19. Zhou, B.; Shen, X.; Pan, C.; Bai, Y.; Wu, T. Optimal Reactive Power Dispatch under Transmission and Distribution Coordination Based on an Accelerated Augmented Lagrangian Algorithm. Energies 2022, 15, 3867. [Google Scholar] [CrossRef]
  20. Khan, I.; Li, Z.; Xu, Y.; Gu, W. Distributed Control Algorithm for Optimal Reactive Power Control in Power Grids. Int. J. Electr. Power Energy Syst. 2016, 83, 505–513. [Google Scholar] [CrossRef]
  21. Bao, W.; Wu, Q.; Ding, L.; Huang, S.; Terzija, V. A Hierarchical Inertial Control Scheme for Multiple Wind Farms with BESSs Based on ADMM. IEEE Trans. Sustain. Energy 2021, 12, 751–760. [Google Scholar] [CrossRef]
  22. Fu, R.; Wu, Y.; Wang, H.; Xie, J. A Distributed Control Strategy for Frequency Regulation in Smart Grids Based on the Consensus Protocol. Energies 2015, 8, 7930–7944. [Google Scholar] [CrossRef]
  23. Wang, Y.; Xu, Y.; Tang, Y.; Liao, K.; Syed, M.H.; Guillo-Sansano, E.; Burt, G.M. Aggregated Energy Storage for Power System Frequency Control: A Finite-Time Consensus Approach. IEEE Trans. Smart Grid 2019, 10, 3675–3686. [Google Scholar] [CrossRef]
  24. Kabsha, M.M.; Rather, Z.H. A New Control Scheme for Fast Frequency Support from HVDC Connected Offshore Wind Farm in Low-Inertia System. IEEE Trans. Sustain. Energy 2020, 11, 1829–1837. [Google Scholar] [CrossRef]
  25. Zhang, Y.; Zhang, X.; Ji, X.; Yang, M.; Han, X.; Yin, Z. Distributional Two-Level Synergetic Unit Commitment Considering Three Scheduling States. Electr. Power Syst. Res. 2022, 213, 108771. [Google Scholar] [CrossRef]
  26. Lai, X.; Zhong, H.; Xia, Q.; Kang, C. Decentralized Intraday Generation Scheduling for Multiarea Power Systems via Dynamic Multiplier-Based Lagrangian Relaxation. IEEE Trans. Power Syst. 2017, 32, 454–463. [Google Scholar] [CrossRef]
  27. Yan, W.; Wen, L.; Li, W.; Chung, C.Y.; Wong, K.P. Decomposition–Coordination Interior Point Method and Its Application to Multi-Area Optimal Reactive Power Flow. Int. J. Electr. Power Energy Syst. 2011, 33, 55–60. [Google Scholar] [CrossRef]
  28. Lu, W.; Liu, M.; Lin, S.; Li, L. Fully Decentralized Optimal Power Flow of Multi-Area Interconnected Power Systems Based on Distributed Interior Point Method. IEEE Trans. Power Syst. 2018, 33, 901–910. [Google Scholar] [CrossRef]
  29. Zhang, C.; Yang, L. Risk-Profit Analysis of Regional Energy Service Providers by Regularized Primal-Dual Interior Point Method. Int. J. Electr. Power Energy Syst. 2022, 135, 107542. [Google Scholar] [CrossRef]
  30. Anderson, P.M.; Mirheydar, M. A Low-Order System Frequency Response Model. IEEE Trans. Power Syst. 1990, 5, 720–729. [Google Scholar] [CrossRef]
  31. Zhang, J.; Liang, J.; Chen, H.; Zhai, S.; He, D.; Xu, J. Secondary Frequency Modulation Control Strategy of Power System Using Energy Storage Battery. In Proceedings of the 2022 7th International Conference on Power and Renewable Energy (ICPRE), Shanghai, China, 23–26 September 2022; pp. 396–401. [Google Scholar]
  32. Zhao, Q.; Zhang, Y.; Chen, Z.; Gao, Z. Frequency Characteristic Analysis of Low-Inertia Power System Considering Energy Storage. Proc. CSEE 2023, 43, 904–914. [Google Scholar]
  33. Khoshfetrat Pakazad, S.; Hansson, A.; Andersen, M.S.; Nielsen, I. Distributed Primal–Dual Interior-Point Methods for Solving Tree-Structured Coupled Convex Problems Using Message-Passing. Optim. Method Softw. 2017, 32, 401–435. [Google Scholar] [CrossRef]
  34. Hu, Z.; Gao, B.; Sun, R. An Active Primary Frequency Regulation Strategy for Grid Integrated Wind Farms Based on Model Predictive Control. Sustain. Energy Grids Netw. 2022, 32, 100955. [Google Scholar] [CrossRef]
  35. Ravanji, M.H.; Canizares, C.A.; Parniani, M. Modeling and Control of Variable Speed Wind Turbine Generators for Frequency Regulation. IEEE Trans. Sustain. Energy 2020, 11, 916–927. [Google Scholar] [CrossRef]
Figure 1. Architecture of primary frequency regulation service provided by multiple distributed energy storage aggregators.
Energies 16 06140 g001
Figure 2. Frequency response model of power systems with distributed energy storage participating in primary frequency regulation (PFR). Note: MPC, model predictive control.
Energies 16 06140 g002
Figure 3. Connection diagram of a unified transmission and distribution system with two distributed energy system aggregators.
Energies 16 06140 g003
Figure 4. Change in system frequency in case 1.
Energies 16 06140 g004
Figure 5. Primary frequency regulation power responses of aggregators with different allocation strategies in case 1.
Energies 16 06140 g005
Figure 6. Outputs of the DESs in case 1.
Energies 16 06140 g006
Figure 7. Change in the state of charge (SOC) of distributed energy storages (DESs) in case 1: (a) change in SOC of DES2, DES5, and DES8; (b) change in SOC of DES4; (c) change in SOC of DES7.
Energies 16 06140 g007
Figure 8. Change in the system frequency in case 2.
Energies 16 06140 g008
Figure 9. Primary frequency regulation power response of the aggregators under different allocation strategies in case 2.
Energies 16 06140 g009
Figure 10. Outputs of distributed energy storages (DESs) in case 2.
Energies 16 06140 g010
Figure 11. Change in the state of charge (SOC) of distributed energy storages (DESs) in case 2: (a) change in SOC of DES2, DES5, and DES8; (b) change in SOC of DES4; (c) change in SOC of DES7.
Energies 16 06140 g011
Figure 12. Connection diagram of unified transmission and distribution systems with four distributed energy system aggregators.
Energies 16 06140 g012
Table 1. Parameter settings.
ParametersValues
Nominal frequency f50 Hz
Mechanical power gain coefficient Km0.95
Ratio of total power generated by the high-pressure turbine FH0.3
Governor regulation coefficient R0.05
Turbine equivalent inertia time TR8 s
System equivalent inertia time H7 s
Load damping coefficient D1
Response time of DES TB0.1 s
Table 2. Parameters of various distributed energy storages (DESs).
Aggregator NumberDES Number DES’ TypeMaximum Active Power (MW)Rated Capacity (MWh)Initial SOCActive Power Deviation Cost CoefficientSOC Offset Cost Coefficient
11Supercapacitor201.0850.50.30.15
12Superconducting magnetic energy storage141.7550.50.70.15
13Lithium battery energy storage104.450.50.20.15
14Flywheel energy storage112.0550.40.450.15
15Flywheel energy storage182.0550.50.450.15
26Supercapacitor141.1250.50.30.15
27Flywheel energy storage142.0550.60.450.15
28Lithium battery energy storage104.360.50.20.15
29Lithium battery energy storage94.440.50.20.15
210Supercapacitor181.1380.50.30.15
Table 3. FR costs with the two allocation strategies in case 1.
Allocation StrategyFR Cost of Aggregator 1 (CNY)FR Cost of Aggregator 2 (CNY)Total FR Cost (CNY)
Proposed strategy2944.262546.675490.93
Traditional strategy3026.842476.035502.87
Table 4. FR cost with the two allocation strategies in case 2.
Allocation StrategyFR Cost of Aggregator 1 (CNY)FR Cost of Aggregator 2 (CNY)Total FR Cost (CNY)
Proposed strategy2410.842757.825168.66
Traditional strategy2390.482789.775180.25
Table 5. Performance of the proposed model in case 1 with different prediction horizons.
Prediction Horizon (s)Total Cost of Frequency Regulation (CNY)Solution Time of Quadprog (s)Solution Time of DIPM (s)
25528.490.00650.0183
45503.350.01090.0742
55490.930.01500.1076
65482.610.01850.1640
85467.270.02940.2161
105455.320.04200.3122
Table 6. Comparison of the computational performance of four algorithms in case 1.
AlgorithmIterationsSolution Time (s)Total FR Cost (CNY)
Quadprog-0.01395490.93
ADMM390.33415491.01
S-ADMM630.25635491.02
DIPM90.10765490.57
Table 7. FR costs under the two allocation strategies applied in the extended system.
Allocation StrategyFR Cost of
Aggregator 1 (CNY)
FR Cost of
Aggregator 2 (CNY)
FR Cost of
Aggregator 3 (CNY)
FR Cost of
Aggregator 4 (CNY)
Total FR Cost (CNY)
Proposed strategy3923.552904.879160.962453.7618,443.14
Traditional strategy4101.762871.709253.472682.7918,909.73
Table 8. Comparison of the computational performance of four algorithms applied in the extended system.
AlgorithmIterationsSolution Time (s)Total FR Cost (CNY)
Quadprog-0.029518,443.14
ADMM781.324918,444.36
S-ADMM1270.925818,444.75
DIPM90.142118,443.07
Disclaimer/Publisher’s Note: The statements, opinions and data contained in all publications are solely those of the individual author(s) and contributor(s) and not of MDPI and/or the editor(s). MDPI and/or the editor(s) disclaim responsibility for any injury to people or property resulting from any ideas, methods, instructions or products referred to in the content.

