1. Introduction
With the increasing prominence of economic development and natural resources and environmental conflicts, green and low-carbon development has become an important trend in global development, with deepening integration with all areas of human society, economy and politics [
1,
2,
3,
4,
5]. From a global perspective, countries are strengthening cooperation on environmental protection, setting stricter carbon emission targets, and promoting a shift to renewable energy and energy-efficient technologies. Enterprises are also integrating green concepts into their strategic planning, increasing environmental protection investment, and promoting the development of green industries [
6].
Data centers are recognized as a high energy-consuming industry. “2023 Data Center Green Development Conference” data from the Ministry of Industry and Information Technology of the People’s Republic of China shows that by the end of 2022, the total size of China’s in-use data centers exceeded 6.5 million standard racks, with an average growth rate of more than 25% over the past five years; 2022 Chat Generative Pre-trained Transformer (ChatGPT) opens the Artificial Intelligence Generated Content (AIGC), a new industry, pushing Artificial Intelligence (AI) development into the AI2.0 era featuring multimodal and large models, and pushing the construction of smart computing facilities into a new stage. The popularity of the Internet, the rapid development of mobile applications and the popularity of social media have led to the generation of a large amount of digital data in people’s daily lives. The rise of the Internet of Things (IoT) and AI technologies has also put tremendous pressure on power demand. The rapid development of AI technologies requires massive computing resources and energy support. Many innovative technologies and solutions are emerging to meet these exploding computing and power demands. Nowadays, one of the focuses of research efforts is to transform data centers into green data centers to reduce energy consumption [
7,
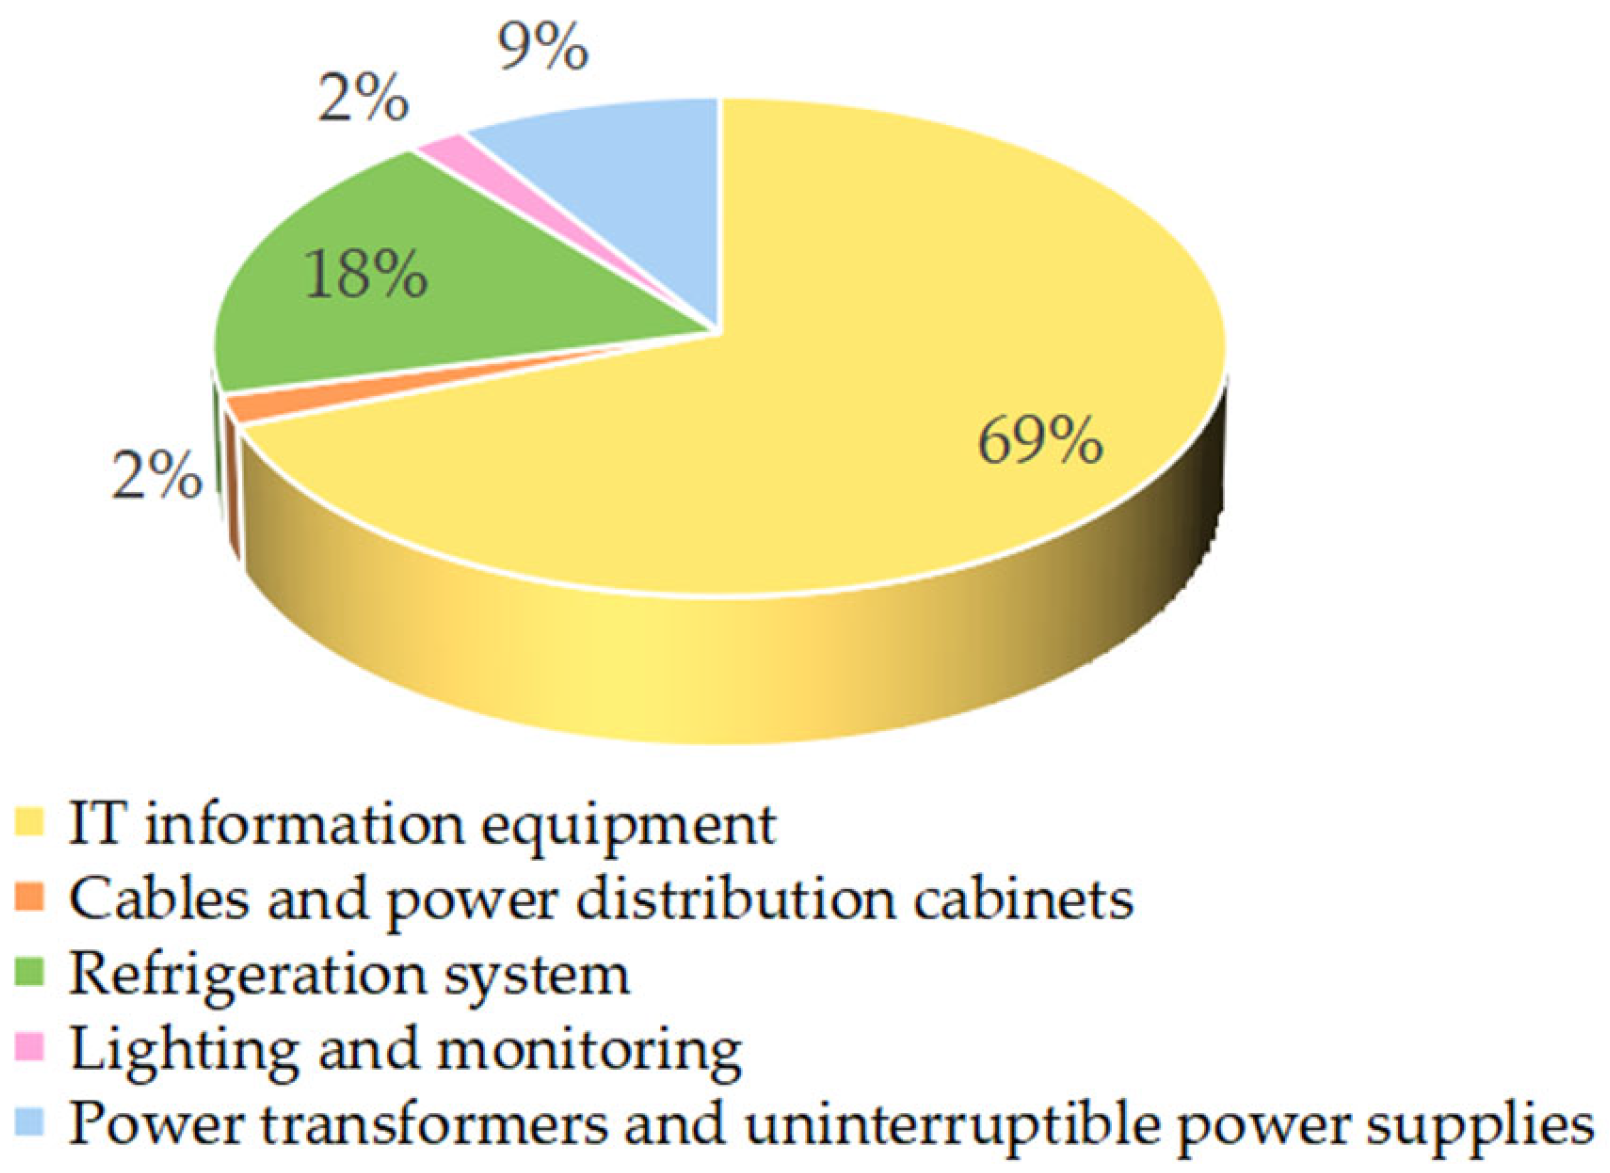
8]. Data center power-consuming facilities include servers and computing equipment, network equipment, Refrigeration system, Uninterruptible Power Supply (UPS) systems, and equipment support systems. Among them, servers and computing equipment, refrigeration systems are the most important power-consuming facilities [
9]. Many enterprises and scholars at home and abroad have conducted extensive surveys to study the proportion of energy consumption components of data centers, and although the results of different studies may differ, the overall energy consumption components and ranking are basically similar.
Figure 1 shows that the energy consumption of servers and computing equipment as well as the energy consumption of refrigeration systems is the largest.
Therefore, efficient design and optimization of data centers are essential, and predicting the energy consumption of servers and computing devices is one of the keys to achieving this goal. By predicting server energy consumption, data centers can provide more reference information for intelligent tasking to achieve optimal energy usage; better assess and budget future power usage to improve economic efficiency; identify specific improvement measures to increase energy efficiency and assess the impact of energy consumption on the environment and take appropriate measures to reduce carbon emissions and other environmental impacts, and better fulfill our responsibility for sustainable development.
At present, most refrigeration systems adopt the basic control mode, limited by the interface capacity of the control board, unable to access a large number of sensors, the distribution of sensors cannot meet the requirements of the precise collection of airflow temperature and generally use the empirical value to set the relevant parameters. In addition, the controller in the refrigeration unit adopts the traditional control algorithm, which lacks the intelligence of machine learning and cannot achieve the purpose of precise control. Especially in the same data center server room, multiple refrigeration units “go their own way” and lack the intelligence of group control, which results in a waste of refrigeration resources and increases the overall energy consumption of the refrigeration system. AI control method can solve the above problems, unlike the basic control method, the latter adopts the intelligent collector in addition to collecting a large number of temperature data but also collects the energy consumption data of refrigeration equipment, power supply and distribution equipment, and IT information equipment for background management [
10,
11,
12,
13,
14,
15]. The AI control approach is based on AI technology, combining physical a priori, big data and IoT technology, with the help of historical data, real-time data, and algorithmic models, etc., to predict potential risks, optimize resource allocation, and achieve the purpose of predicting temperatures, intelligent management, as well as reducing energy consumption [
16,
17,
18,
19]. As a result, an intelligent management strategy for dynamic energy efficiency of data center networks with AI fitting control is proposed.
The main contributions include three aspects:
By normalizing the temperature and power consumption data of the data center room, using the log-mean-square error and the coefficient of determination as the evaluation indexes for the effect of the prediction model, and adjusting the network parameters through the indexes to obtain the optimal neural network prediction model.
A deep Q-network algorithm-based intelligent controller for air-conditioning is designed for air-conditioning control. The state input network is constructed through indoor environment indicators, feedback and control actions, and the parameters are updated using error backpropagation and the optimal actions are selected to achieve intelligent control.
According to the distribution of power consumption of information equipment load and partition calculation of the refrigeration module, the output of refrigeration equipment in a certain range is intelligently controlled to reduce the risk of local overheating and achieve effective group control operation.
The remainder of the article is organized as follows.
Section 2 reviews and presents the background knowledge of data center cooling systems.
Section 3 details the design and application of the proposed digital twin (simulation) module.
Section 4 details the design and application of the proposed hotspot and fault pre-control module, as well as the group control optimization control module.
Section 5 validates the proposed methodology of the article through experiments.
Section 6 concludes the full paper.
2. Materials and Methods
The data center cooling system consists of underlying intelligent measurement devices and collectors that form the collection units of the subsystems, as shown in
Figure 2. These units collect a large amount of decentralized data, which are transmitted via Ethernet to the DS distribution server and the DB database server. The servers process historical and real-time data, calibrate, clean, classify, and generate different databases. The AI algorithm server uses deep learning to mine, learn, and compute data to compare temperatures, controls, and events to provide optimized control algorithms. The Control Visualizer runs on the Windows operating system and is supported by B/S (SiteWeb6.0) and C/S (SiteMonitor 2.0) software architectures to present analysis curves, charts, and reports. The Data Center Infrastructure Management Platform uses Computational Fluid Dynamics Simulation (CFD) (6SigmaRoom, Release 16.2) and Building Information Modeling (BIM) software (AUTODESK Revitit 2020) to establish a cooling system model and apply neural networks to pre-control hot spots and faults and realize optimized group control of air conditioners.
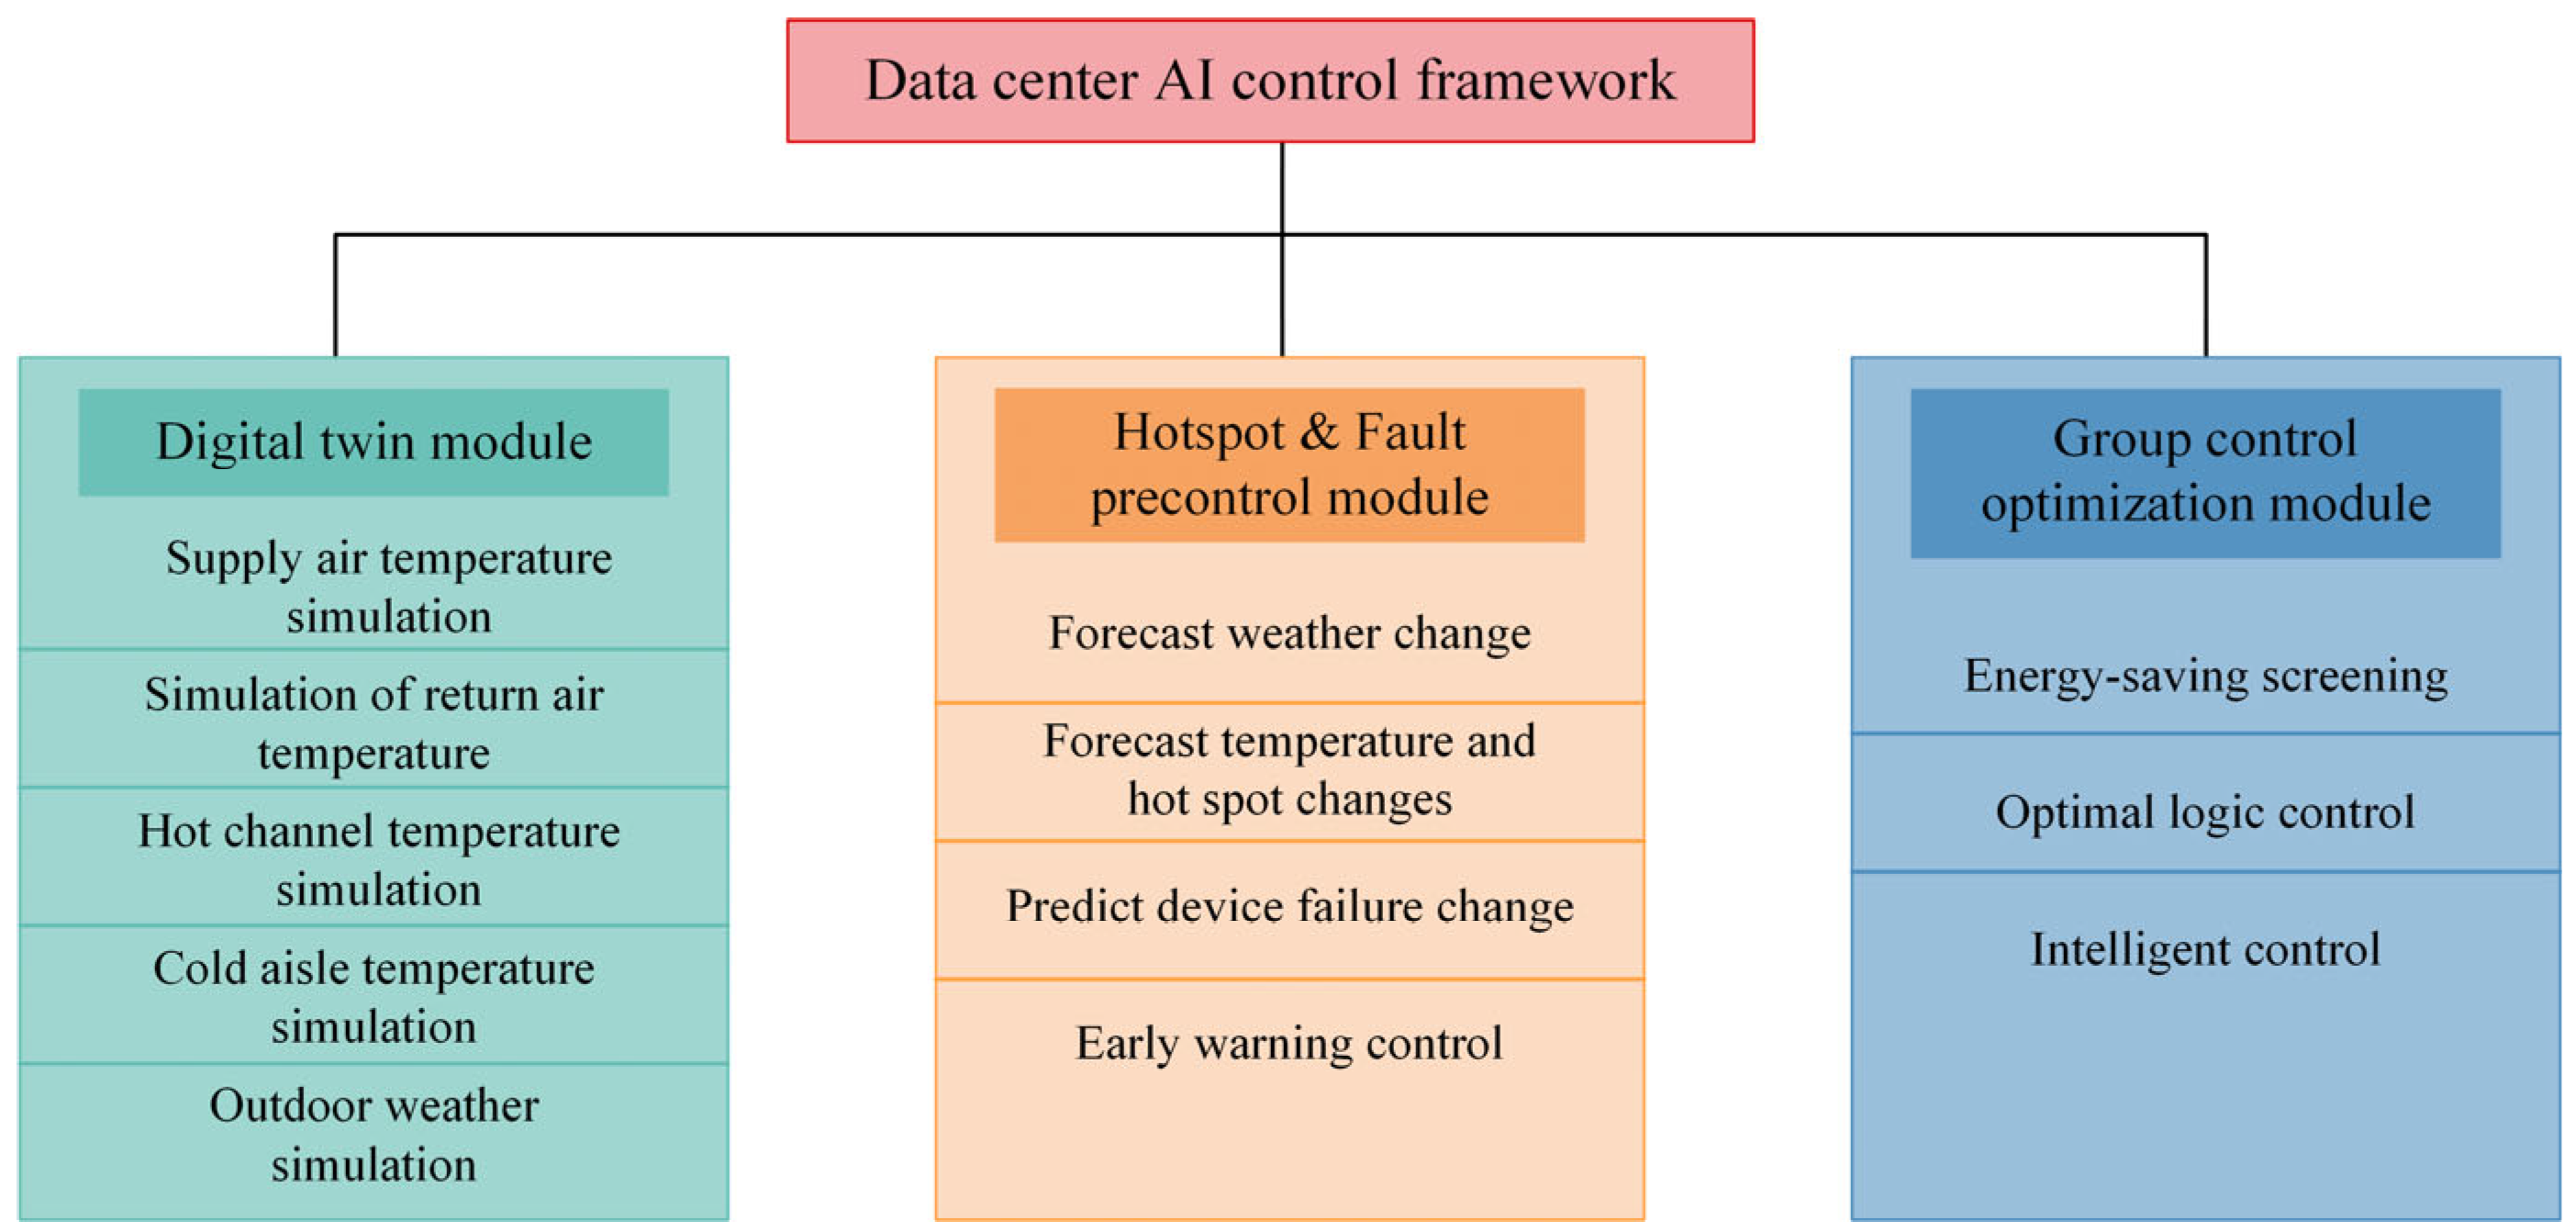
The construction of the main module of the data center cooling system mainly includes the design of the digital twin (simulation) module, the hot spot and pre-failure control module and the group control optimization and control module. As shown in
Figure 3.
4. Optimal Control Module: Hotspot and Fault Pre-Control and Group Control
4.1. Hot Spots and Fault Pre-Control
Deep Q-Network (DQN) is a deep neural network structure used to implement the Deep Q-Learning algorithm. DQN was proposed by DeepMind in 2013 [
26], which solves the traditional Q-Learning challenges in dealing with high-dimensional state space by combining deep learning and Q-Learning. challenges when dealing with high-dimensional state spaces. DQN uses deep neural networks as estimators of the Q-value function and is able to effectively deal with high-dimensional state spaces deal with high-dimensional state spaces. The target network is used to compute the target Q-value, and the target network is separated from the main network, which reduces the volatility of the target value in training. DQN introduces the Experience Replay technique, which solves the problems of data correlation and non-static distribution and improves the efficiency and stability of training by storing the experience of the agent’s interactions with the environment in the buffer and randomly sampling the samples for training. The DQN algorithm pseudo-code is shown in Algorithm 1.
| Algorithm 1: Introducing deep -networks for experience playback. |
1: Input: State space , Action space , Discount rate , Learning rate
2: Output: network
3: Initialise the experience playback buffer with capacity ;
4: Initialise the -network with parameters ;
5: Initialise the parameters of the target -network ;
6: repeat
7: Initialise the start state ;
8: repeat
9: In state , the choice action ;
10: Perform action , observe the environment, and get even the reward and the new state ;
11: Putting into ;
12: Sample from ;
13: ;
14: Train the Q network with as the loss function;
15: ;
16: Every steps, to ;
17: until is the termination state;
18: until convergence; |
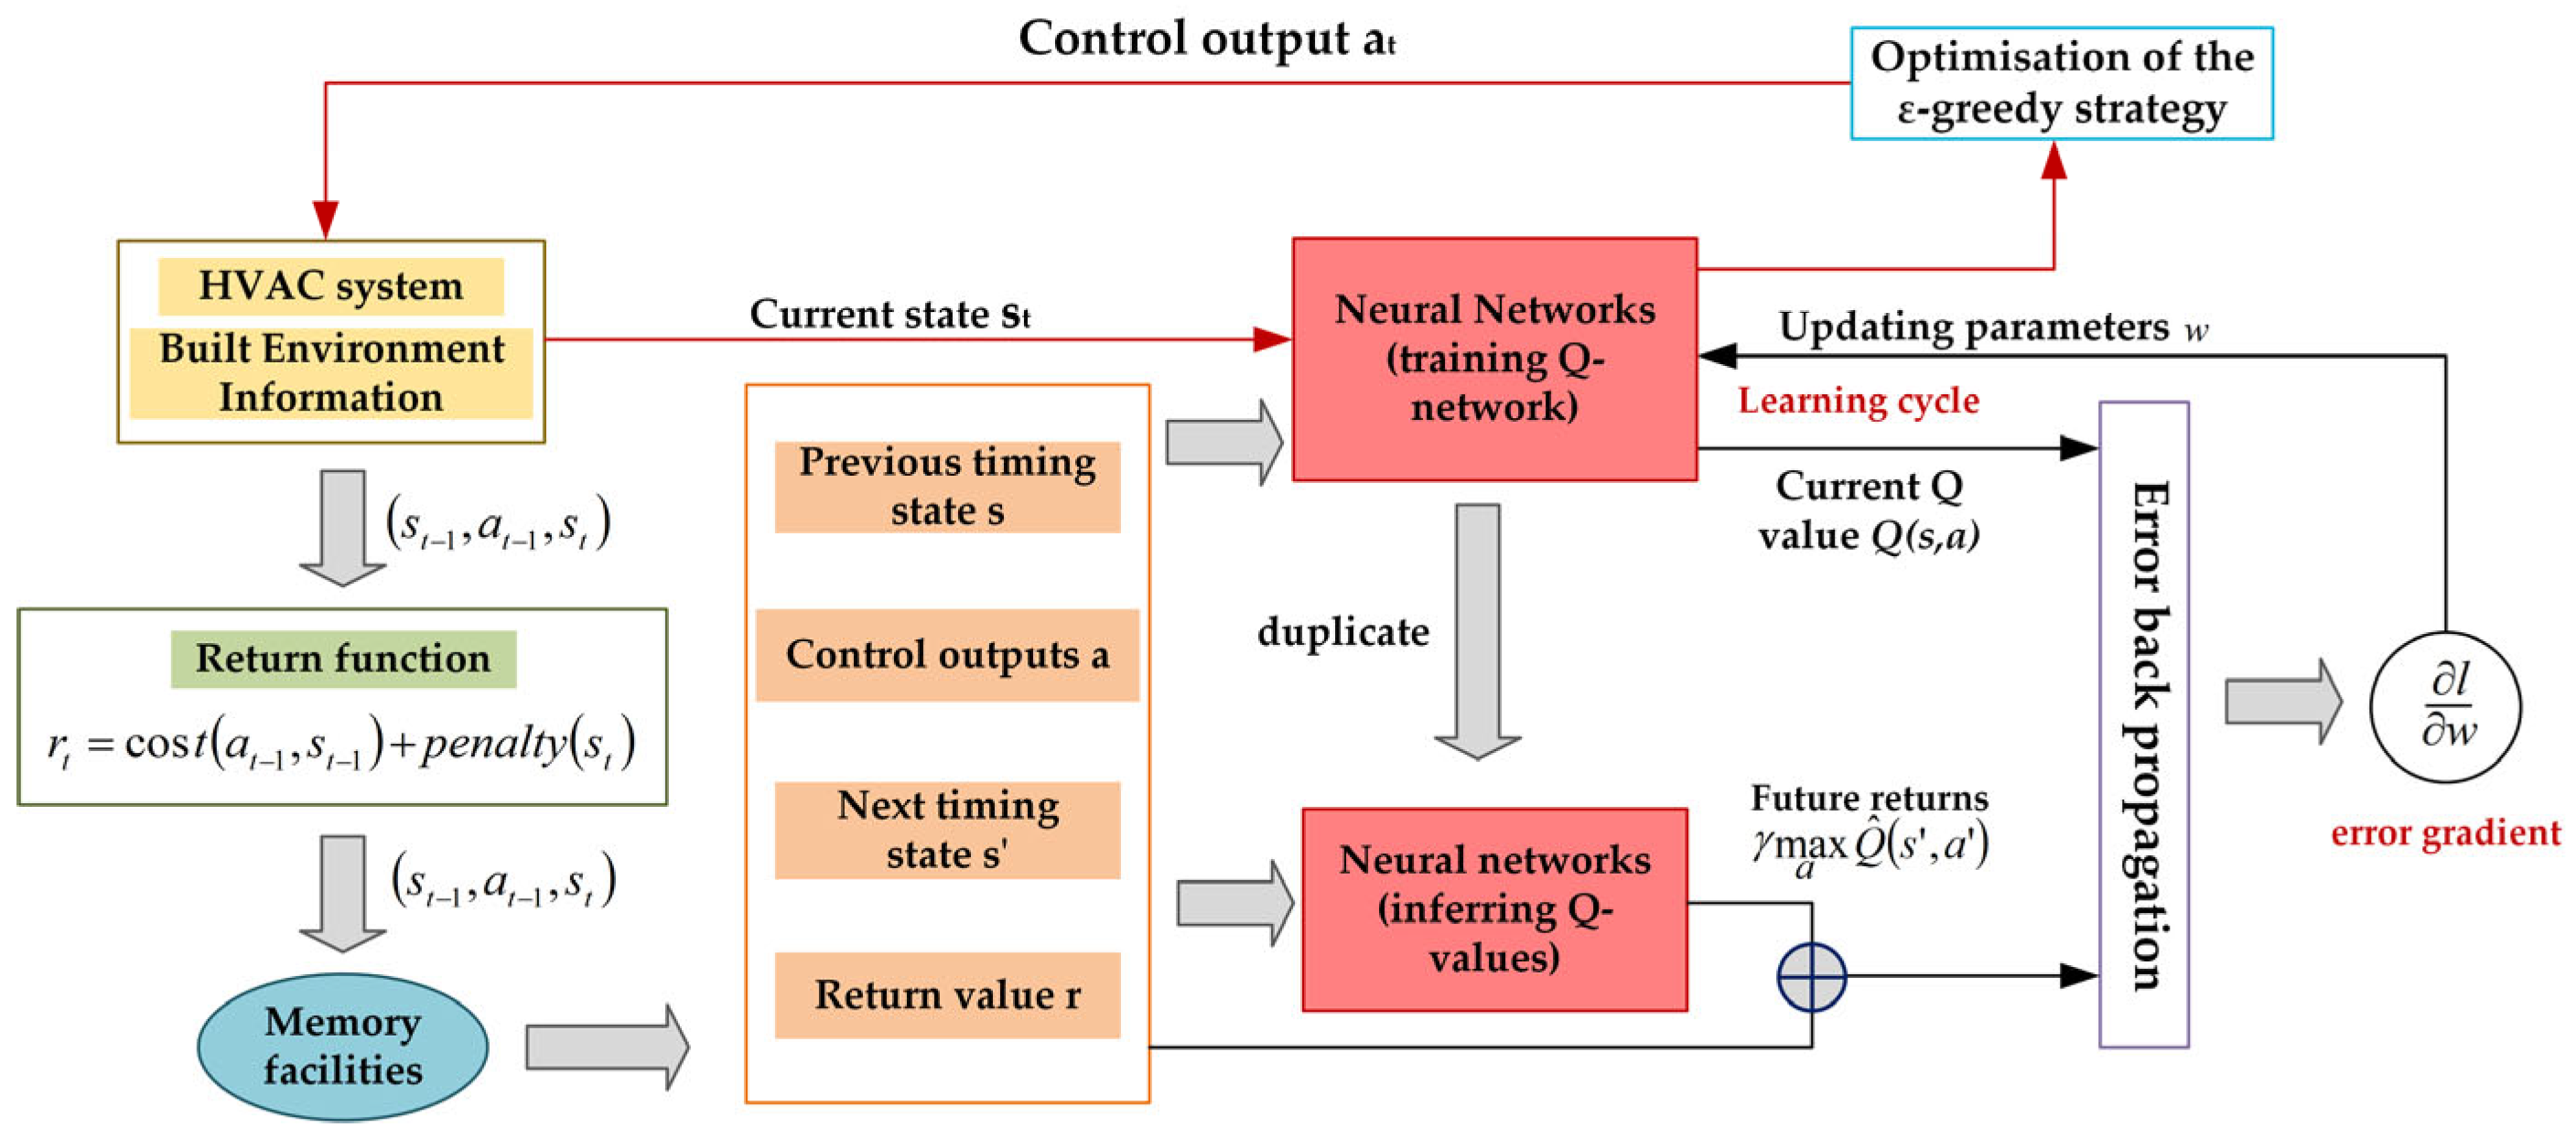
The control flowchart of the air conditioner intelligent controller based on the DQN algorithm for air conditioners is shown in
Figure 6. The controller takes two consecutive time-series of indoor environmental indicators, the feedback of the previous time-series, and the control action of the previous time-series as the state input networks, constructs the error gradient of error back-propagation through the two Q-networks, updates the parameters of the Q-networks through the back-gradient propagation algorithm, and uses the Q-networks for prediction and selects the optimal output action under the current state and outputs the final control action using the
-greedy (epsilon-greedy) algorithm to output the final control action.
Similarly, when the refrigeration system has a fault, according to the established algorithmic control strategy, the maximum degree of opening the fault pre-control module ensures that the safe operation of the data center is not affected. The data center is generally equipped with several refrigeration systems as standby systems, which are normally in the state of hot standby operation in order to save energy, and the system automatically notifies the relevant personnel to arrive at the scene at the same time, and according to the results of the AI algorithm, the system automatically adjusts to increase the refrigeration capacity of standby refrigeration equipment in its area to ensure that no overheating point occurs. After the elimination of faults, periodic tracking judgment, after the no-fault point appears, and restores the normal control logic.
4.2. Optimised Control Module for Group Control
According to the distribution of load and power consumption of the information equipment, under the premise of meeting the design requirements, the average temperature prediction model and power consumption prediction model are used to exclude dangerous and energy-consuming instructions from the AI instruction set, and then the deep reinforcement learning algorithm is used to select the optimal instructions to be issued, with priority to energy efficiency as the goal, taking into account safety, and continuous optimization.
The AI group control module collects the demand and temperature of the refrigeration equipment in group control mode and sends down the average demand after calculating according to the refrigeration group control module, which improves the temperature uniformity inside and outside the channel and enhances the overall energy efficiency. Based on the collected temperature data, it intelligently adjusts the output of the refrigeration equipment within a certain range to reduce the risk of local overheating. Realize independent control of different channels, adjusting the output of its own devices according to temperature changes, reducing energy consumption and hot spot frequency. Under the balanced thermal load, the airflow is the same, and the cooling capacity is output on demand, maximizing the use of natural cooling sources. As the outdoor temperature rises, it automatically allocates natural/traditional cooling sources to meet the equipment load demand and realize energy saving and emission reduction.
5. Experiments
5.1. Data Center Simulation Platform
The experimental site machine room has a floor height of 5.4 m and an anti-static floor height of 1.0 m. There are five micro-modules in the equipment area, 40 cabinets in each micro-module, a total of 200 cabinets, and the height of the cabinets is 2.2 m. Each module is arranged on both sides, with 20 cabinets on each side. The power consumption of a single cabinet load is 5 KW, and the equipment area adopts anti-static flooring with an air supply underneath and cable routing on top. The cabinet layout for hot and cold channel design, cold channel isolation; the channel with open floor air supply, and floor through the hole rate of 70%. The air conditioning area is separated from the main equipment area by a wall, and the air supply and return ports are opened on the upper and lower part of the partition wall. The air conditioners are distributed in the air conditioning rooms on the left and right sides, and seven air conditioners with 100 KW cooling capacity are installed in each air conditioning room, which adopts the mode of five mains and two standbys. Air conditioning rated air volume of 25,000 m3/h, using air temperature control, set to 26 degrees.
The CFD simulation software for this experiment is 6SigmaDCX (6SigmaRoom, Release 16.2), an authoritative software in the data center industry. Based on the finite element method, 6SigmaDCX realizes the simulation of real physical phenomena by solving partial differential equations (single field) or partial differential equations (multi-field) and uses mathematical methods to solve physical phenomena. Before modeling and solving the data center, the following simplified assumptions are proposed for the model to improve the calculation speed while ensuring the calculation accuracy. The boundary conditions are as follows:
The gas flow state is regarded as steady turbulence;
The heat of the cabinet does not change with time, is a constant value;
Ignore the heat radiation of solid walls and indoor surfaces and the heat transfer of the enclosure structure;
Ignore obstacles such as cables and pipelines in the machine room;
Ignore the human body heat dissipation and lighting heat dissipation.
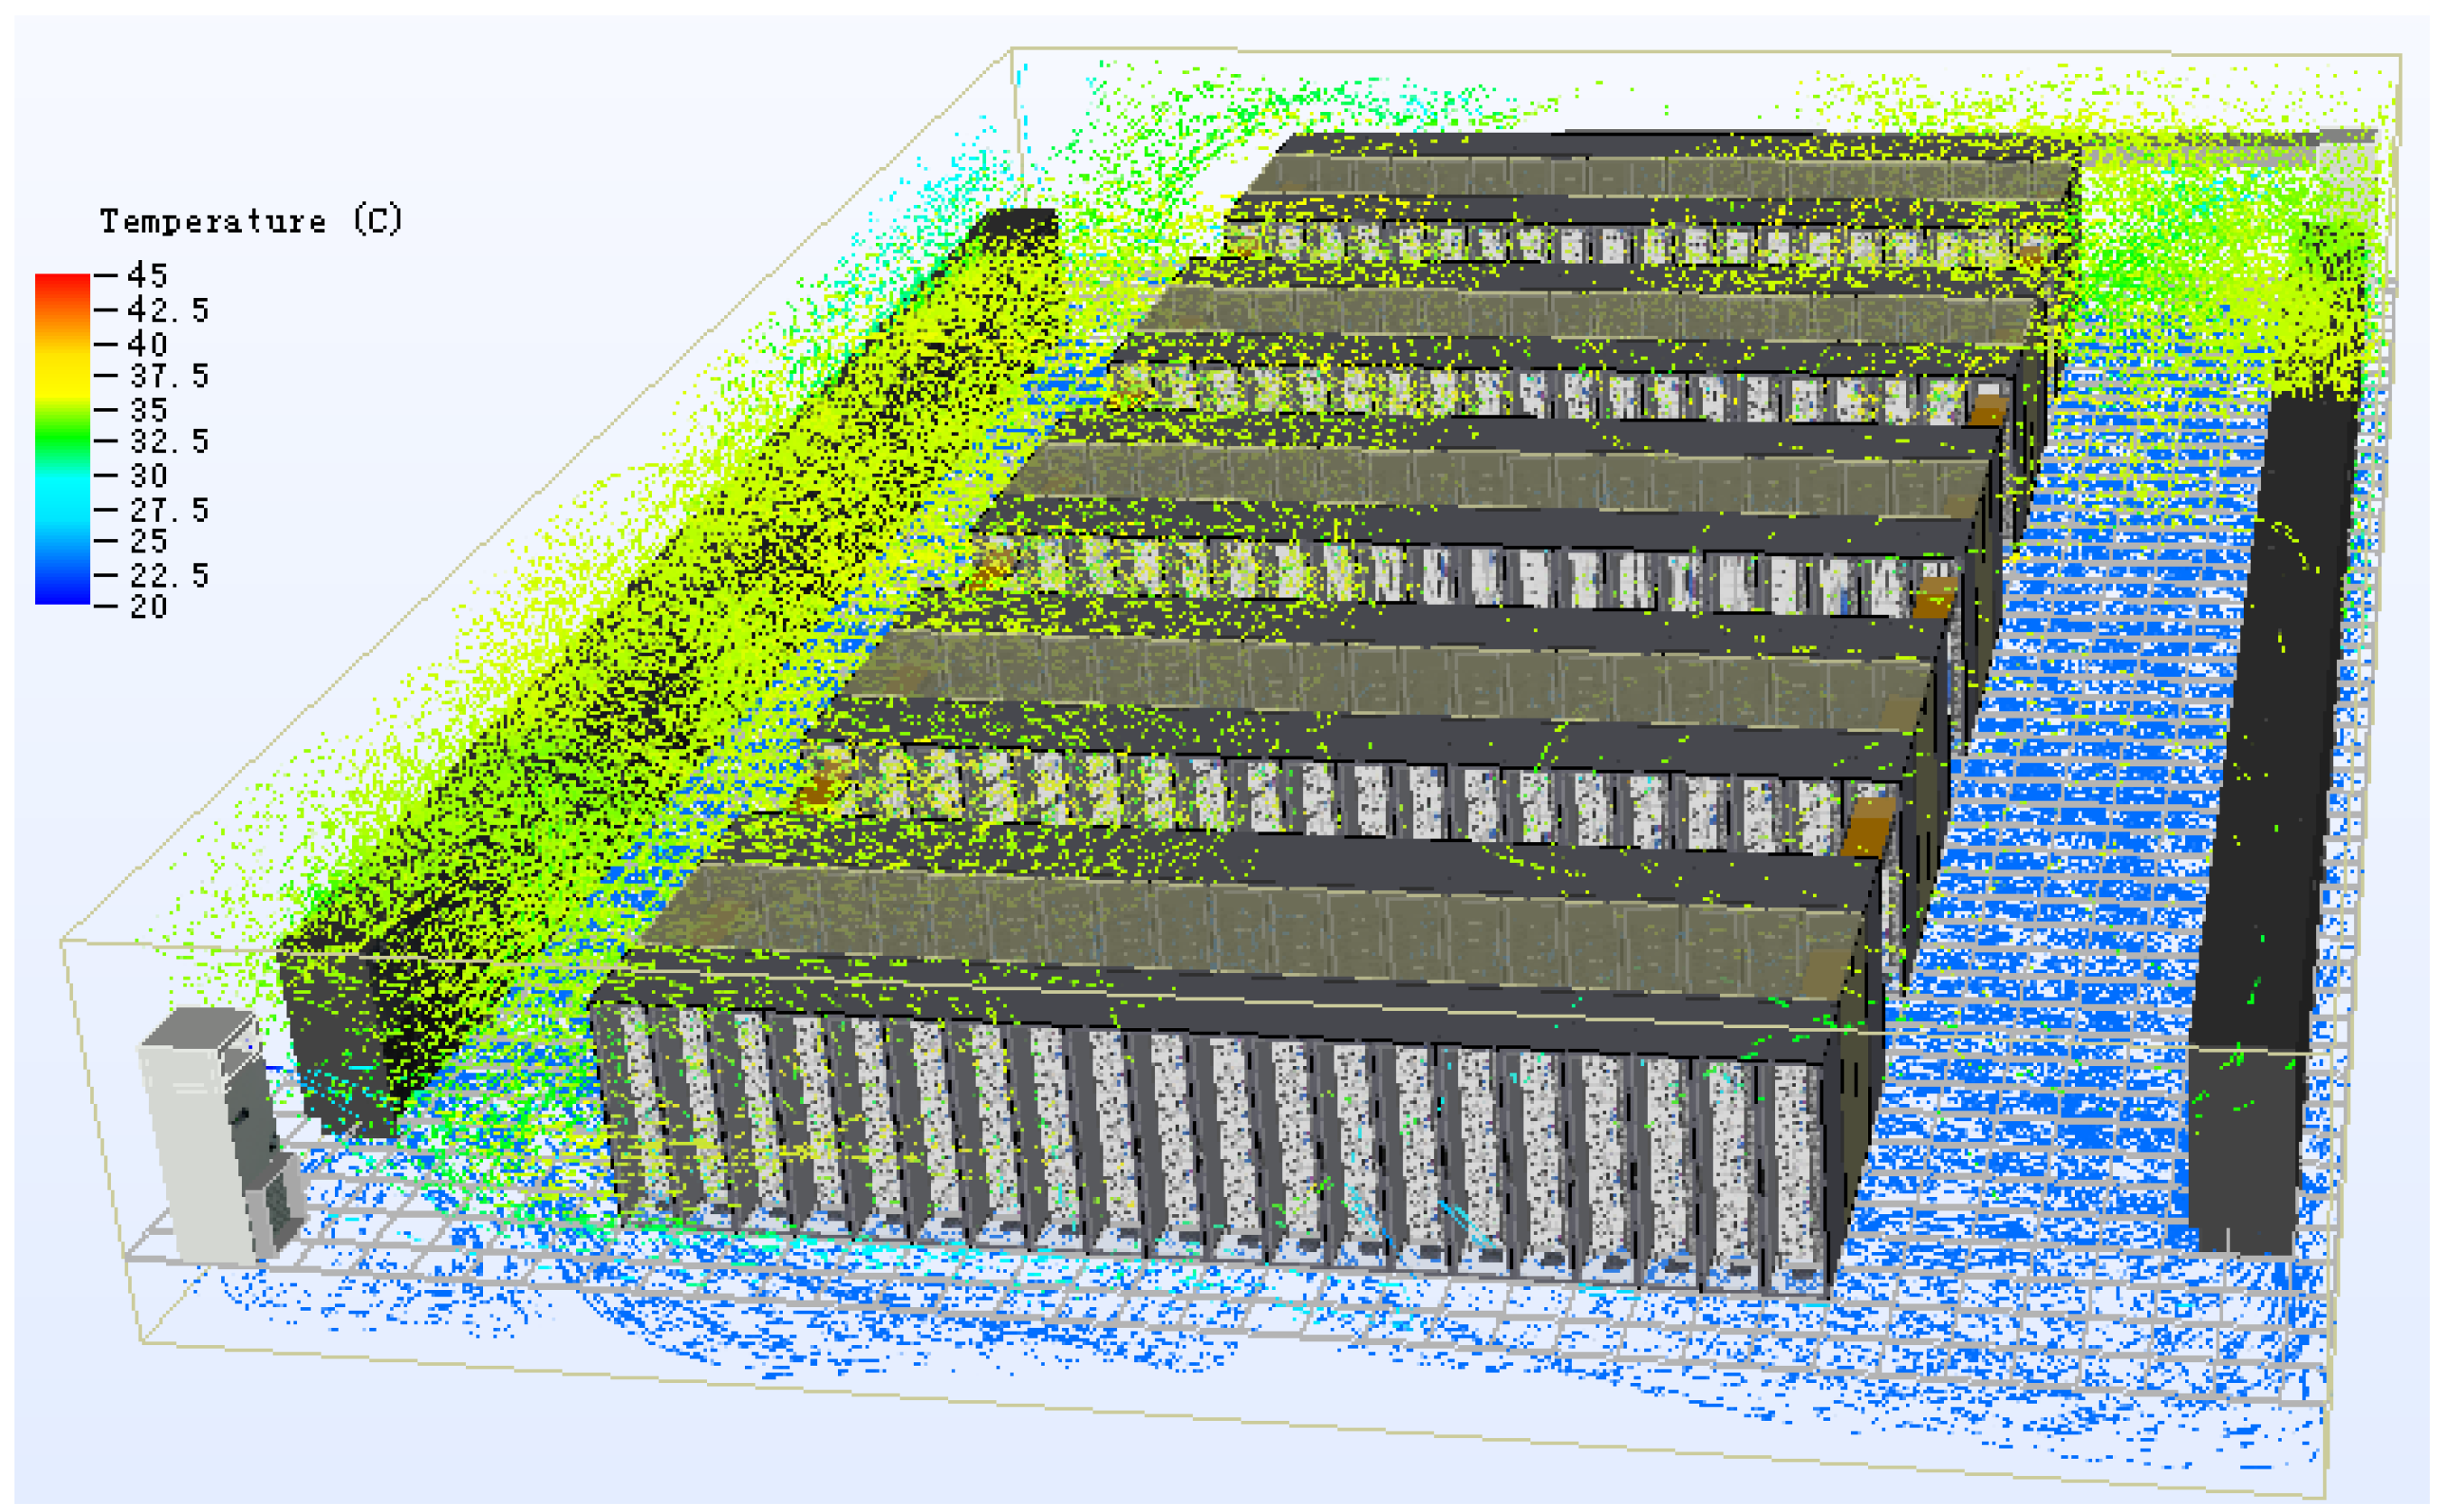
The simplified model has a small deviation from the actual situation of the computer room and has little influence on the CFD simulation of the data center. The error between the simulation results and the design situation is within an acceptable range. The simplified model reduces the calculation amount and greatly improves the calculation speed. This paper focuses on the setting of the roof, wall, floor, air conditioning and IT import and export parameters. The purpose is to determine the rationality of sensors and other layouts and the uniformity of air supply through CFD simulation, so as to make the AI algorithm more accurate. The computer room simulation diagram drawn by CFD software is shown in
Figure 7.
5.2. Experimental Data
The data used in this experiment came from the monitoring platform of a data room in Shenzhen. The data from 10 July 2021 to 10 May 2022 are used as training samples and provided to the algorithm model for training. Data from 10 May 2022 to 10 July 2022 are used as an estimated sample to verify the effect of the algorithm model. The reliability and landability of the algorithm are further verified by training and testing with real data from different time periods.
The data room is equipped with 728 data sampling points (sensors), and each data sampling point (sensor) sampling frequency is 15 min, the sensor technical specifications and description are shown in
Table 1. Data types include outdoor meteorological parameters, air temperature of the cooling outdoor unit, air temperature of the cooling indoor unit, air temperature of the cooling indoor unit, cold aisle temperature, hot aisle temperature, cabinet load, cooling power consumption, and lighting power consumption in the equipment room. In order to avoid the interference of abnormal and missing data reception, it is necessary to preprocess and screen reasonable data before neural network prediction. Missing data are a common and important problem. Missing data can be caused by measurement equipment failure, incomplete data collection, or human error. One of the methods to solve the problem of missing data is interpolation. The data set uses spline interpolation, which builds a continuous interpolation function by fitting multiple low-order polynomial segments between the data points. Spline interpolation has good robustness and smoothness, which can effectively fill in missing data and avoid overfitting problems.
5.3. Experimental Setup
This experiment was conducted under Mint 20, using Python version 3.9.0. The experiment was conducted on a workstation with Intel(R) Xeon(R) Gold 5218 CPU @ 2.30 GHz, 128 G memory and NVIDIA GeForce GTX 2080 Ti graphics card. The model parameter settings as shown in
Table 2 are used in this experiment. Adjusting the settings of the model parameters is a way to improve the model’s performance and learning ability so that it performs better in facing the challenges in the network topology environment. Through iterative interactive training, the understanding and learning of the environment are used to optimize the selection of the distance between the task scheduling server and the data center to achieve the optimal scheduling strategy.
5.4. Experiments and Analysis of Data Center Task Prediction
As shown in the previous section, the prediction accuracy of this experiment is presented using the log root mean square error (log-RMSE) and coefficient of determination (
) evaluation metrics, with smaller log-RMSE and higher
values indicating higher prediction accuracy. The relative errors of layers 1 to 5 in
Table 3 are small and reach the prediction target. The log-RMSE in the table all reach below 0.36, which indicates higher accuracy. As well, the
in the table all reach above 0.97, indicating a better fit.
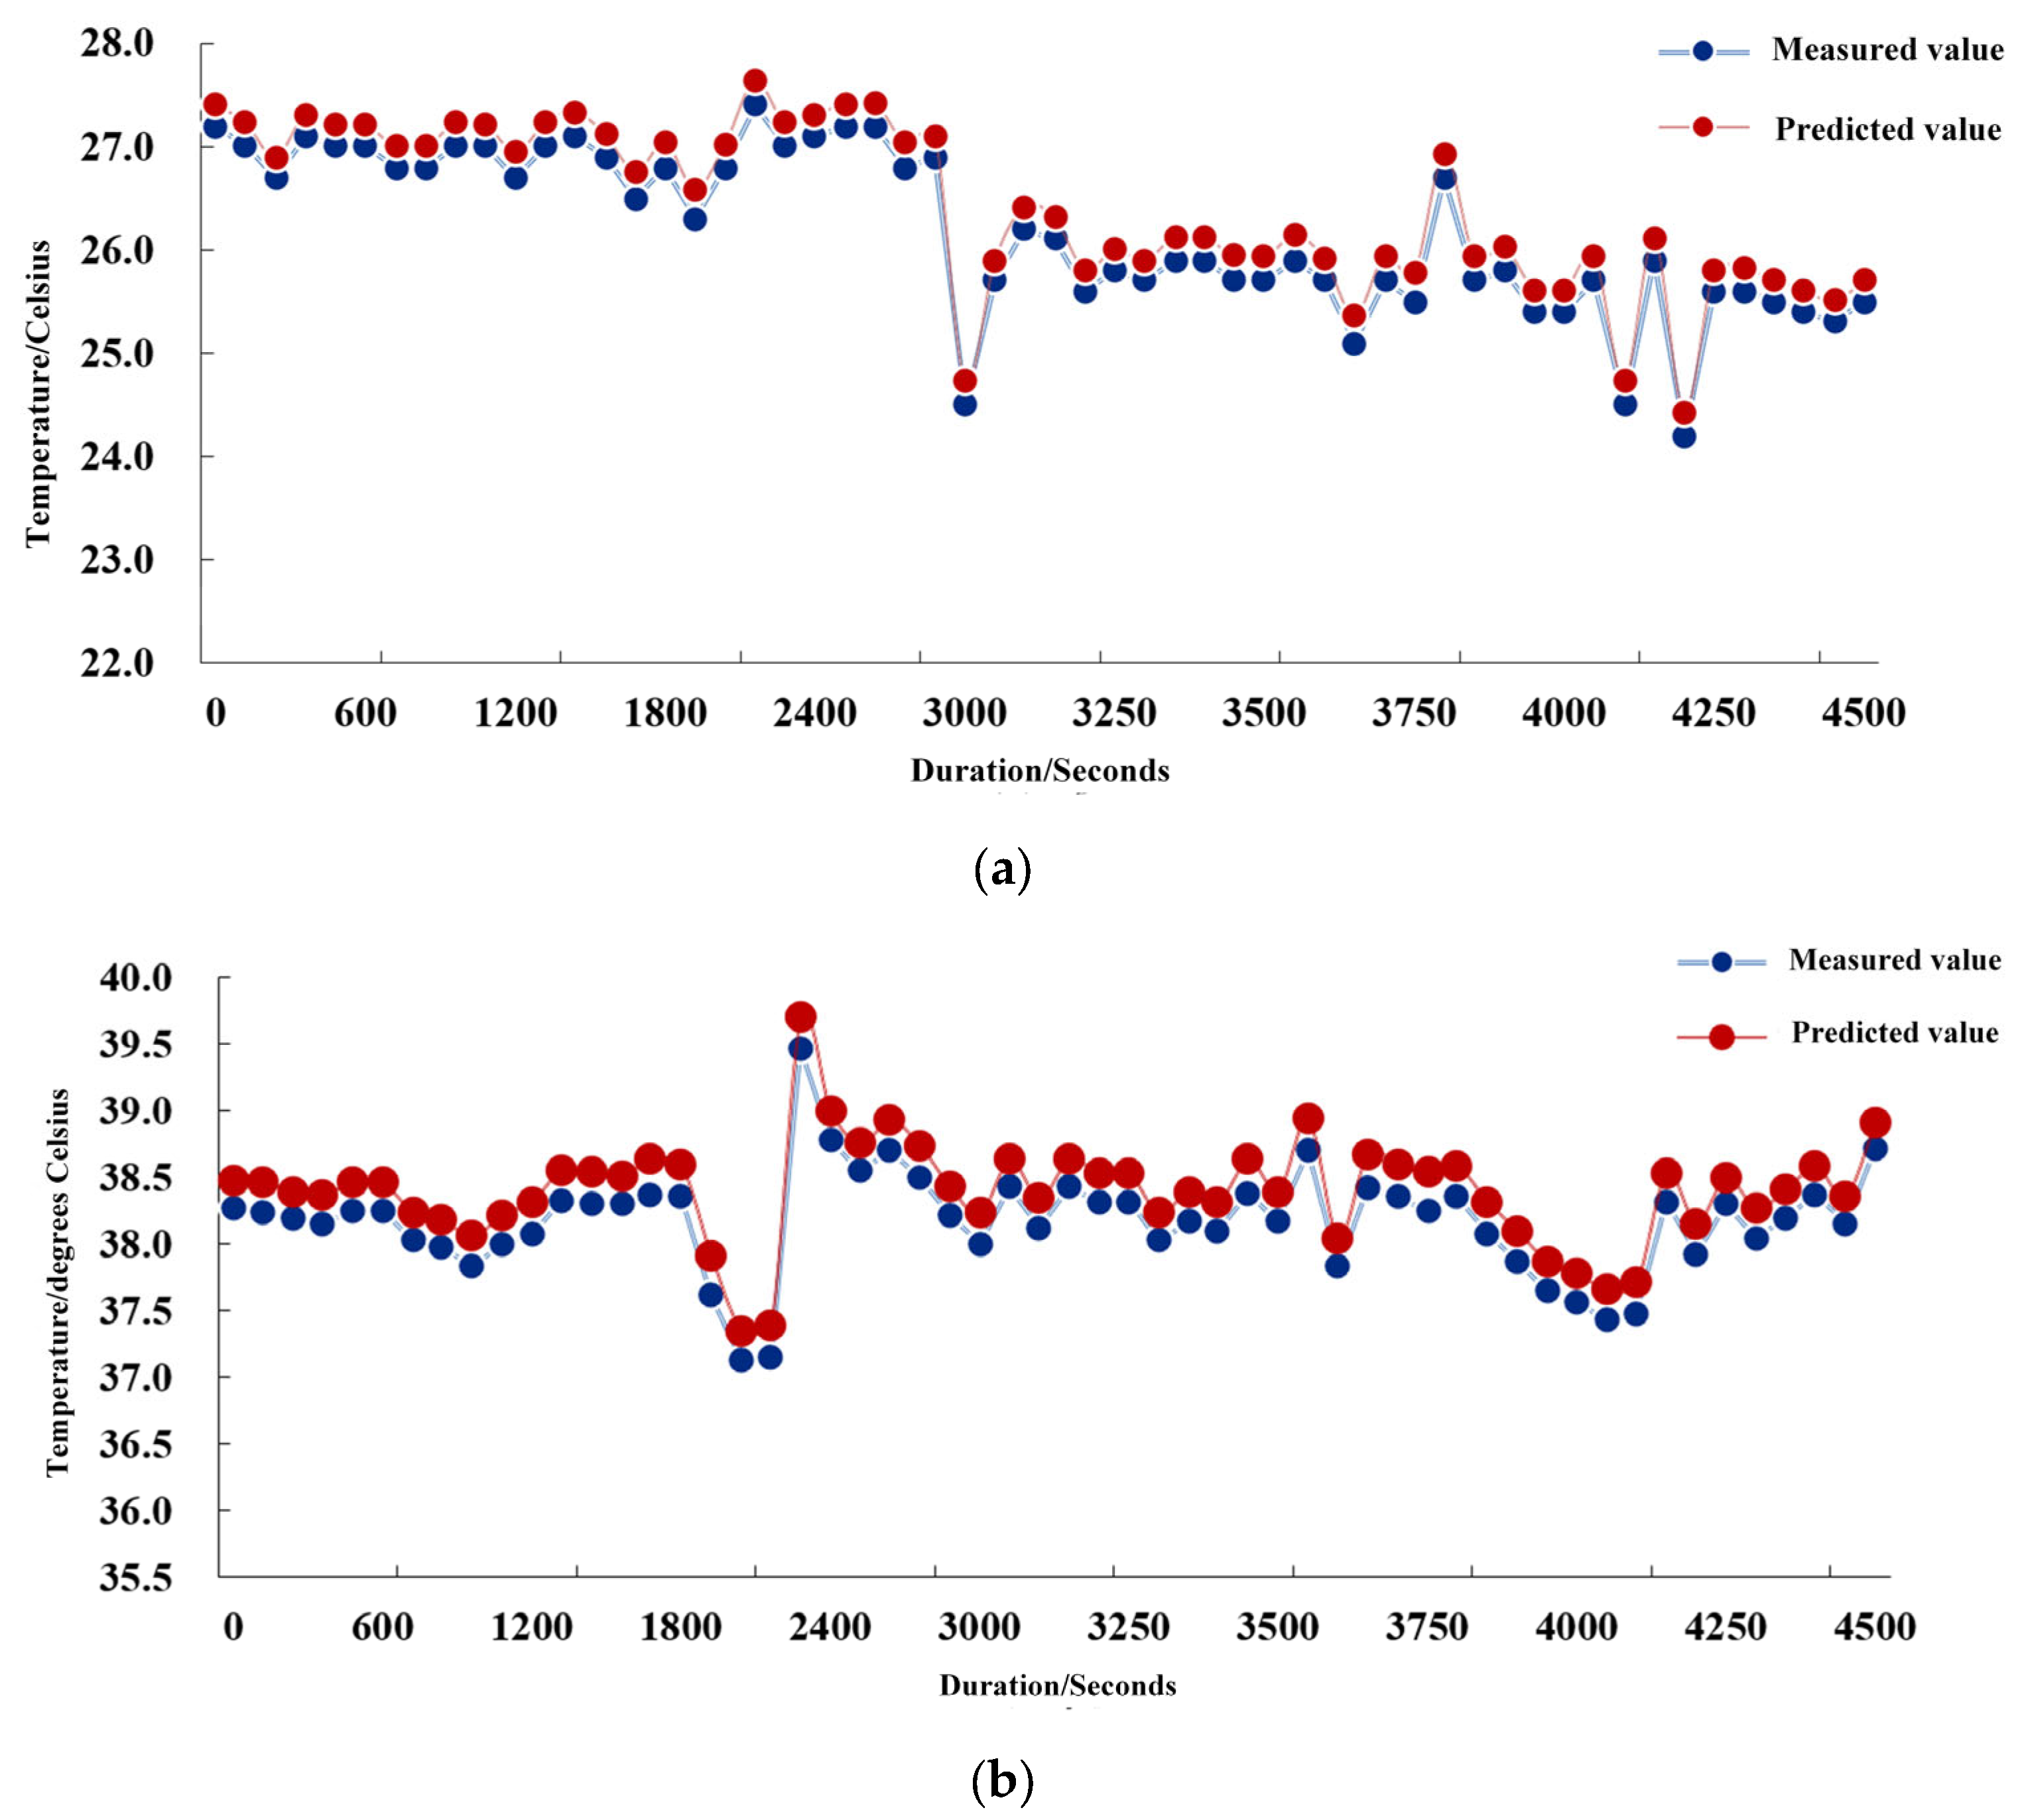
The average values of the supply and return air temperatures were collected and calculated for a 10-min cycle of the air conditioner. From
Figure 8a, it can be seen that the air-conditioning supply air set temperature range is 26 °C ± 1 °C.
Figure 8b shows that the air conditioning return air setting temperature range is 39 °C ± 1 °C. In order to obtain a lower PUE while guaranteeing the normal operation of the IT equipment, its return air temperature as well as the temperature difference between the supply and return air are raised as much as possible to ensure a more energy-efficient cooling system. The error between the real value and the predicted value should be no more than ±0.4 °C. The method obtains an average absolute error of 0.32 °C in the prediction of the supply air temperature and 0.21 °C in the prediction of the return air temperature, which proves that the method can more accurately predict the future temperature of the supply air and the return air temperature.
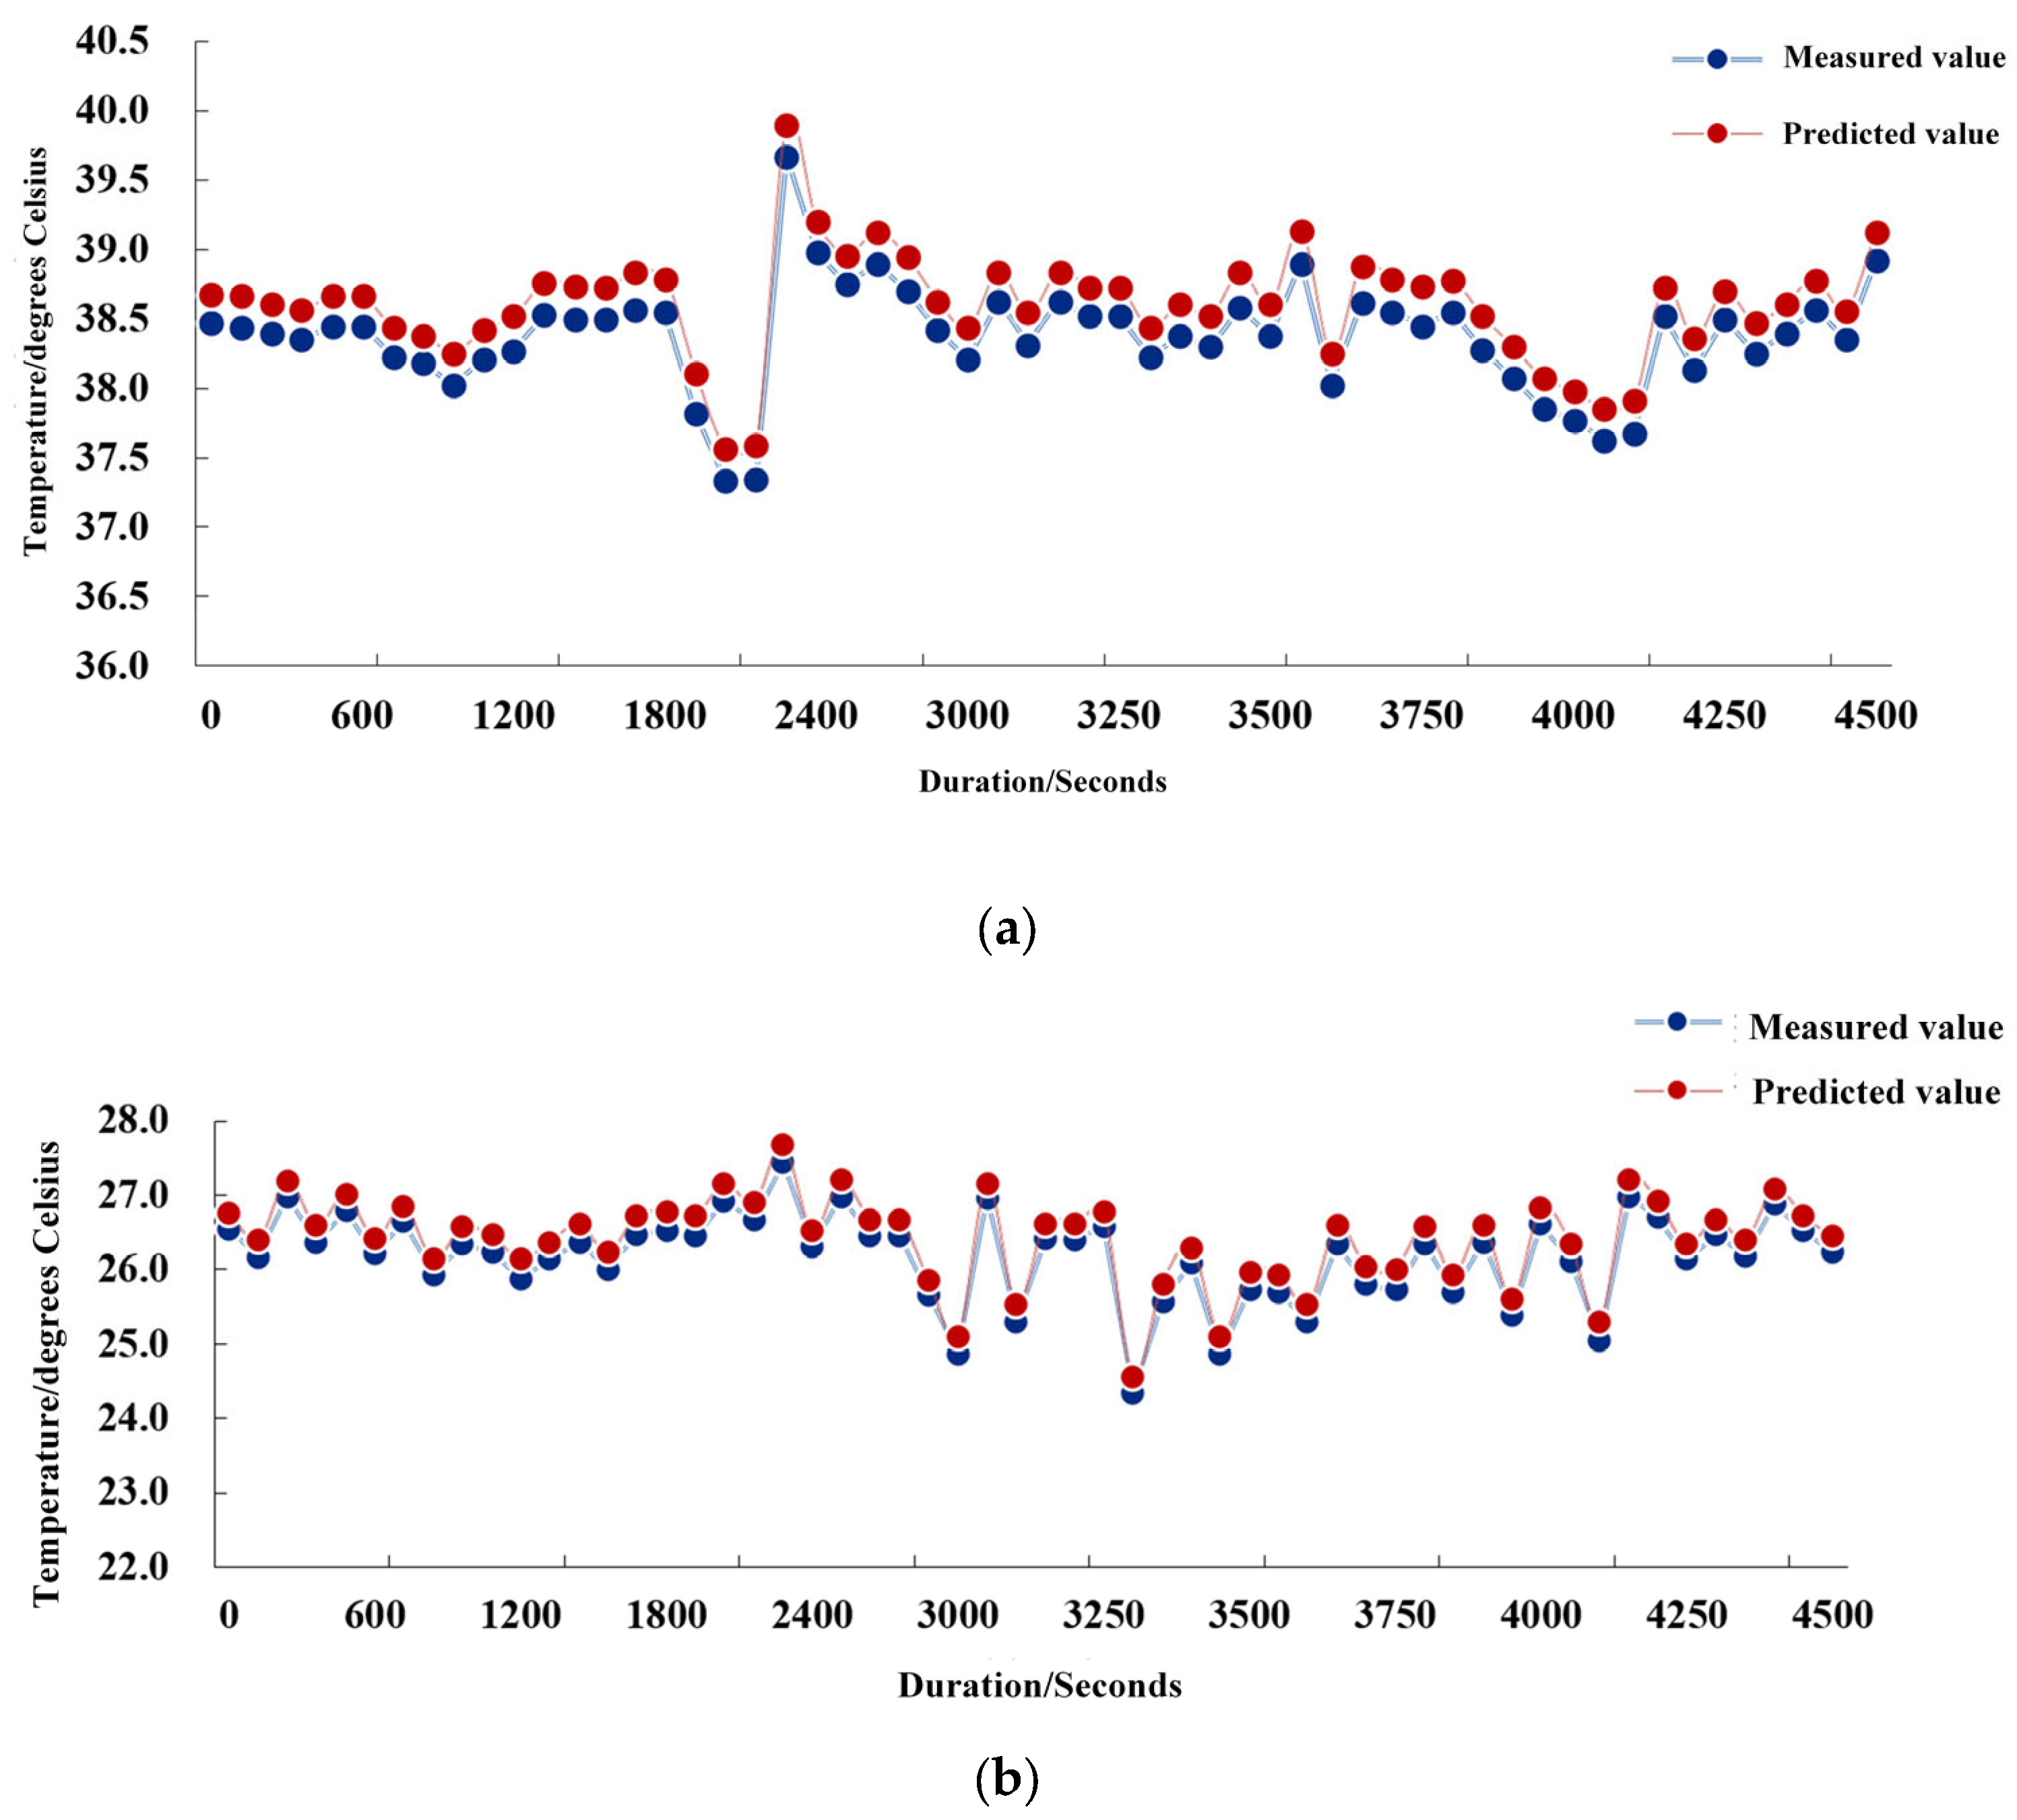
The average of the server’s 10-min hot-channel temperature and cold-channel temperature was collected and calculated. As can be seen in
Figure 9a, the hot channel set temperature range is 39 °C ± 1 °C. From
Figure 9b, it can be seen that the cold channel set temperature range is 27 °C ± 1 °C. In the case of guaranteeing normal operation of IT equipment, in order to obtain a lower PUE, its temperature is raised as much as possible to ensure the higher energy efficiency of the cooling system. Under the circumstance of guaranteeing the normal operation of IT equipment, in order to obtain lower PUE, the temperature difference between the cold channel and the hot channel should be made as small as possible to ensure the higher energy efficiency of the refrigeration system. The error between the true value and the predicted value should be no more than ±0.4 °C. The method obtains an average absolute error of 0.36 °C for the cold channel temperature prediction and 0.19 °C for the hot channel temperature prediction, which proves that the method can more accurately predict the future hot channel temperature and cold channel temperature.
Figure 10 shows the comparison curve between the real and predicted values of some of the IT load variables derived by the algorithm, as the average of the load change of the server after 10 min, where the red curve represents the trend of the IT load (power) over time (per second) predicted by the neural network algorithm, and the blue curve represents the trend of the measured change. From the figure, it can be seen that the error between the real and predicted values of the 200 cabinets in the server room is within ±2 KW, which satisfies the error range of the algorithm and proves that the method can predict the IT power more accurately.
The red curve in
Figure 11 represents the theoretically calculated temperature trend over time (hourly) and the blue curve represents the real-time outdoor temperature trend over time (hourly) for the month of August as measured. It can be seen that as human activities continue to intensify, the actual outdoor temperature is in an upward trend, which poses a greater challenge to energy conservation, so it is necessary to reduce the ambient temperature of its surroundings through spraying.
Power Usage Effectiveness (PUE) is an energy efficiency metric used to measure data centers, and Water Usage Effectiveness (WUE) is a water usage metric used to measure data centers. Lower PUE and WUE values indicate higher energy efficiency in the data center, both of which are as close to 1.0 as possible, enabling more efficient use of energy resources. The application of AI control of the data center ensures that a lower ambient temperature near the entrance of the cooling outdoor cooling module is obtained, guaranteeing that a lower PUE can be obtained even in a high-temperature environment. The red curve in
Figure 12a represents the PUE trend with ambient temperature predicted by the neural network algorithm, and the blue curve represents the measured PUE trend with ambient temperature. As seen in the figure, under the premise of lower outdoor weather temperatures, the PUE can be close to about 1.1, and the highest PUE does not exceed 1.3. Comparative analysis before and after the AI is switched on shows that the energy-saving PUE is predicted to drop by an average of 2.6% for the whole year.
Through the application of AI control in the data center, according to the actual temperature of the outdoor weather and the wet bulb temperature of the automatic adjustment, such as more than 30 degrees to open the spray mode; more than 25 degrees to open the spray mode, and at the same time the difference between the dry and wet bulb temperature is greater than 3 degrees; more than 20 degrees to open the spray mode, and at the same time the difference between the dry and wet bulb temperature is greater than 3 degrees; more than 15 degrees to open the spray mode so that the refrigeration system is in the natural cold mode earlier and other measures to achieve the goal of reducing the ambient temperature near the entrance of the refrigeration outdoor cooling module and water saving and maximize water saving under the premise of guaranteeing the cooling of the refrigeration cooling module. The red curve in
Figure 12b represents the trend of WUE metrics with ambient temperature change by the neural network algorithm, and the blue curve represents the measured trend of WUE metrics with ambient temperature change. As seen in the figure, AI opens the comparative analysis to achieve an average decrease of 2.5% in the data center water-saving WUE.
6. Conclusions
With the development of data centers towards large scale and high density, the problem of energy consumption is becoming more and more prominent. In order to reduce energy consumption and environmental impact, green data centers have become the focus of attention. This paper proposes an intelligent management strategy for energy efficiency in data centers with AI fitting control. Through basic control and model training, the temperature trend is predicted by using a temporal neural network and DQN, and the experiments show that the average absolute error of all kinds of temperature prediction is below 0.4, and the power usage effectiveness and water usage effectiveness are reduced by 2.55% on average, which realizes intelligent control to optimize energy consumption. The strategy can effectively cope with the trend of large-scale and high-density development, provide a sustainable solution for data center operators and researchers, and make an important contribution to the green transformation of the data center industry and environmental protection. The shortcoming of the research in this paper is that the object is limited by the building structure cannot be modified, the selected refrigeration and air conditioning supply type is simple, and only AI verification is done for the main room. In addition, the experimental data set is the static energy consumption data set collected. In real scenarios, user tasks change dynamically, and the characteristics of energy consumption will also change accordingly. Therefore, it is necessary to further consider and study how to conduct intelligent energy efficiency management for data centers in real dynamic scenarios. The future work plans to extend this method to air-conditioning systems, power supply and distribution systems, lighting, and even IT (that is, information equipment, such as servers, storage, networks and other computing infrastructure) and other systems in the distribution room to further improve the efficiency of the entire data center, while reducing the overall energy consumption index, so as to achieve the dual control goal of carbon emissions.


