Article

Investigation of the Proton Exchange Membrane Fuel Cell System Cathode Exhaust Gas Composition Based on Test Bed Measurements

Institute of Thermodynamics and Sustainable Propulsion Systems (ITnA), Graz University of Technology, Inffeldgasse 19, 8010 Graz, Austria
*
Author to whom correspondence should be addressed.
Energies 2023, 16(16), 6057; https://doi.org/10.3390/en16166057
Submission received: 12 July 2023 / Revised: 7 August 2023 / Accepted: 17 August 2023 / Published: 18 August 2023
(This article belongs to the Section D2: Electrochem: Batteries, Fuel Cells, Capacitors)

Abstract

:
Proton exchange membrane fuel cells are gaining increasing importance in vehicle applications. The exhaust gas composition regarding the water and oxygen content and the mass flow are important parameters in fuel cell research (e.g., for designing the test bed, quantifying the hydrogen loss in the exhaust, performing experiments with air pollutants, and monitoring degradation). The exhaust gas composition is also important for vehicle applications (e.g., ensuring safe hydrogen levels in the exhaust). Performing direct measurements of the exhaust mass flow and the relative humidity is challenging due to the high-humidity environment. This article presents a mathematical thermodynamic model used to calculate the exhaust gas mass flow and relative humidity, validated by balancing the gas species composition between cathode inlet and exhaust and by using data measured at the fuel cell system test bed. Four calculation model variations and their analyses are discussed. Furthermore, the exhaust gas composition throughout the fuel cell system operating range is presented. The results of air pollutant experiments provide comprehensive examples for the application of the calculation model. These results demonstrate the suitability of the model for its application in fuel cell system research.

1. Introduction

Proton exchange membrane (PEM) fuel cells can generate electric energy without producing carbon dioxide (CO2) emissions. Since their operation is not influenced by the time of day or weather conditions, they provide a more stable and controllable flow of energy than solar and wind power; therefore, they have a similar potential as batteries to overcome the intermittency problem [1,2]. Fuel cell electric vehicles also play a major role in the decarbonization of the mobility sector [3]. PEM fuel cells are a key technology in vehicle applications, since they only emit heat, liquid water (H2O), oxygen (O2)-reduced air containing water vapor, and small quantities of hydrogen (H2). This research was carried out on the cathode exhaust gas of a low-temperature PEM fuel cell system, which operates at temperatures well below 100 °C. Due to the low temperatures of operation, the water produced is formed predominantly in a liquid state. This liquid water humidifies the membrane, ensuring the required proton conductivity. Excess water is transported through the gas channels in the bipolar plates out of the fuel cell, preventing the cell from flooding, which would cause local fuel starvation and irreversible degradation [4]. Although water is formed at the cathode reaction site, differences in the water concentration causes liquid water to diffuse through the membrane to the anode side. Furthermore, potential gradients cause an electro-osmotic drag which transports water from the anode to the cathode, while pressure differences between the anode and cathode result in further water transport through the membrane. A third water transport mechanism is the thermo-osmosis effect, where temperature gradients induce water transport from the cathode to the anode [5]. The accumulated water on the anode side must be drained periodically to prevent the aforementioned flooding of the cell. In contrast to the cathode side, the water on the anode side is not transported out with the gas stream, since the anode gas is recirculated to reduce H2 losses. Appropriate water management in the fuel cell is crucial, since the membrane should not dry out, and liquid water should not accumulate [6]. External reactant humidification upstream of the fuel cell reactant inlet can help to ensure appropriate membrane humidification, allowing higher fuel cell operating temperatures. This external humidification, however, also increases the system complexity and packaging volume [7]. In general, the thermal management of the fuel cell has a significant influence on the water management, since the ability of a gas mixture to absorb water vapor is determined by its temperature. Higher temperatures also increase the proton conductivity and water uptake of the membrane [8]. The thermal management must consider the temperatures of the liquid coolant and the reactants on the anode and cathode sides.
During fuel cell operation, the rate of liquid water production changes as the fuel cell current changes, affecting the exhaust gas composition. Frequently purging the anode also increases the H2 concentrations in the exhaust. The anode is purged with H2 to flush out nitrogen (N2) that diffuses from the cathode, causing the H2 partial pressure to drop [8]. Depending on the system design, the process of draining the water on the anode side can also increase the H2 exhaust concentration, which was the case in the current study. When considering the cathode side alone, H2 is present due to crossover that takes place through the membrane from the anode side, although its concentration is far lower than the anode purge level. This crossover increases as membrane degradation increases due to membrane thinning and pinhole formation effects [8]. Independent of the anode purge and drain strategies, this H2 crossover represents a source of permanent fuel loss; therefore, it must be taken into account. An increased H2 concentration in the fuel cell exhaust gas represents a potential safety risk, since an ignitable mixture could form.
Ideally, the platinum catalyst inside the fuel cell affects the rate and selectivity of the reaction but is not itself subject to any changes. In reality, however, the catalyst is affected by degradation processes, such as platinum particle growth and the redistribution of platinum particles in the membrane [9]. A process called carbon corrosion can take place inside the fuel cell under certain operating conditions such as start-up and shutdown, during fuel cell flooding, and even under normal fuel cell operation conditions to a small extent [10]. Carbon-containing components such as the carbon support of the platinum catalyst can corrode, resulting in the formation of gaseous CO2 [10]. This CO2 can be measured in the fuel cell exhaust, and its mass quantification is an interesting tool for fuel cell degradation monitoring.
Ambient air pollution poses a risk to the fuel cell durability, since certain gas components such as carbon monoxide (CO) and nitrogen monoxide (NO) can adsorb on the platinum catalyst surface, hindering the oxygen reduction reaction (ORR) and thus reducing the fuel cell performance [11]. When the adsorption on the catalyst surface is not permanent, as is the case with NO, exhaust gas measurements can give insight into the contamination process of the catalyst during fuel cell operation.
To perform an analysis and mass-based quantification of the described individual gas components in the fuel cell exhaust gas, a knowledge of the fuel cell exhaust gas mass flow is required. This allows the researcher to, for example, quantify the H2 loss in the exhaust or the exhausted amount of an air contaminant. Due to the high humidity conditions at the fuel cell cathode exhaust, however, it is challenging to measure the mass flow and relative humidity directly by using sensors, since the presence of water droplets can alter the results.
Several investigations have examined the fuel cell exhaust gas composition and mass flow. Ref. [12] presents a study in which two fuel cell systems are connected in series; hence, the cathode exhaust condition of the first stack represents the entry condition for the second stack. The first system operates without external cathode gas humidification, assuming a dry gas feed with a relative humidity of 0%. The relative humidity of the exhaust is assumed to be 100%. At the same time, the oxygen content in the exhaust is calculated based on a dry gas mixture of N2 and O2. Water transport through the membrane is neglected. Ref. [13] studied the effect of cathode gas recirculation in emergency situations, when the cathode air supply from the ambient needs to be sealed off. In that study, the recirculated cathode exhaust gas was used to humidify the oxygen from a gas tank used to operate the fuel cell. To ensure saturation and avoid water droplets, the excess liquid water was removed in a condenser. The approach presented assumes steady-state operation conditions and neglects membrane water, nitrogen, and oxygen diffusion. In [14], a part of the cathode exhaust gas was recirculated to humidify the inlet gas, replacing an external humidifier. The calculations excluded water and gas transport through the membrane and assumed that the fuel cell exhaust air was saturated with no liquid water, which was removed in the experimental setup by a separator. The research in [15] focused on the oxygen-depleted and dried cathode exhaust air which can be used for airplane tank inerting. The model-based approach includes the calculation of the exhaust oxygen concentration and the water vapor content, assuming full humidification of the exhaust gas and including liquid water separators. In contrast to the previously described studies, this model considers water diffusion across the membrane. In a later work, [16] applied nonlinear model predictive control to a similar cathode exhaust model. The results presented in [15,16] were not verified experimentally, but the models were calibrated based on experimental data. The authors of [17] developed an oxygen balance method and used it to derive the H2 consumption of a fuel cell vehicle. The difference between the cathode inlet and exhaust oxygen flow obtained by applying this method equals the amount of consumed oxygen, which can then be used to calculate hydrogen consumption. These authors also calculated the amount of H2 emissions and experimentally verified the method, showing good results with a low margin of error.
Unlike the approaches taken in the aforementioned studies, the approach taken in this work was to calculate the exhaust gas relative humidity at every time step for the underlying measured data; the exhaust gas was not assumed to be fully saturated at all times. The water vapor transport from the ambient air was taken into account. To verify the suitability of the model and to test the underlying assumptions, gas mass balancing for CO2 and O2 was performed between the cathode inlet and exhaust. In most of the studies referred to above, internal sources and sinks were neglected, such as the water and gas diffusion through the membrane, the effect of increased H2 concentrations in the exhaust on the humid air calculations, or the absorption of gas components in the liquid water present inside the fuel cell. These effects were addressed by using modified models and are discussed in this article to determine if such considerations are worthwhile. Furthermore, the base model was tested at various steady-state current density levels, covering the fuel cell system operating range, and during dynamic fuel cell operation. Dedicated cathode air pollutant experiments were performed at ITnA and published previously [18]. The calculation model described in this publication was used in the current study to support these results. Applying the model in the evaluation of gas impurity studies serves as an application example in fuel cell research.

2. Materials and Methods
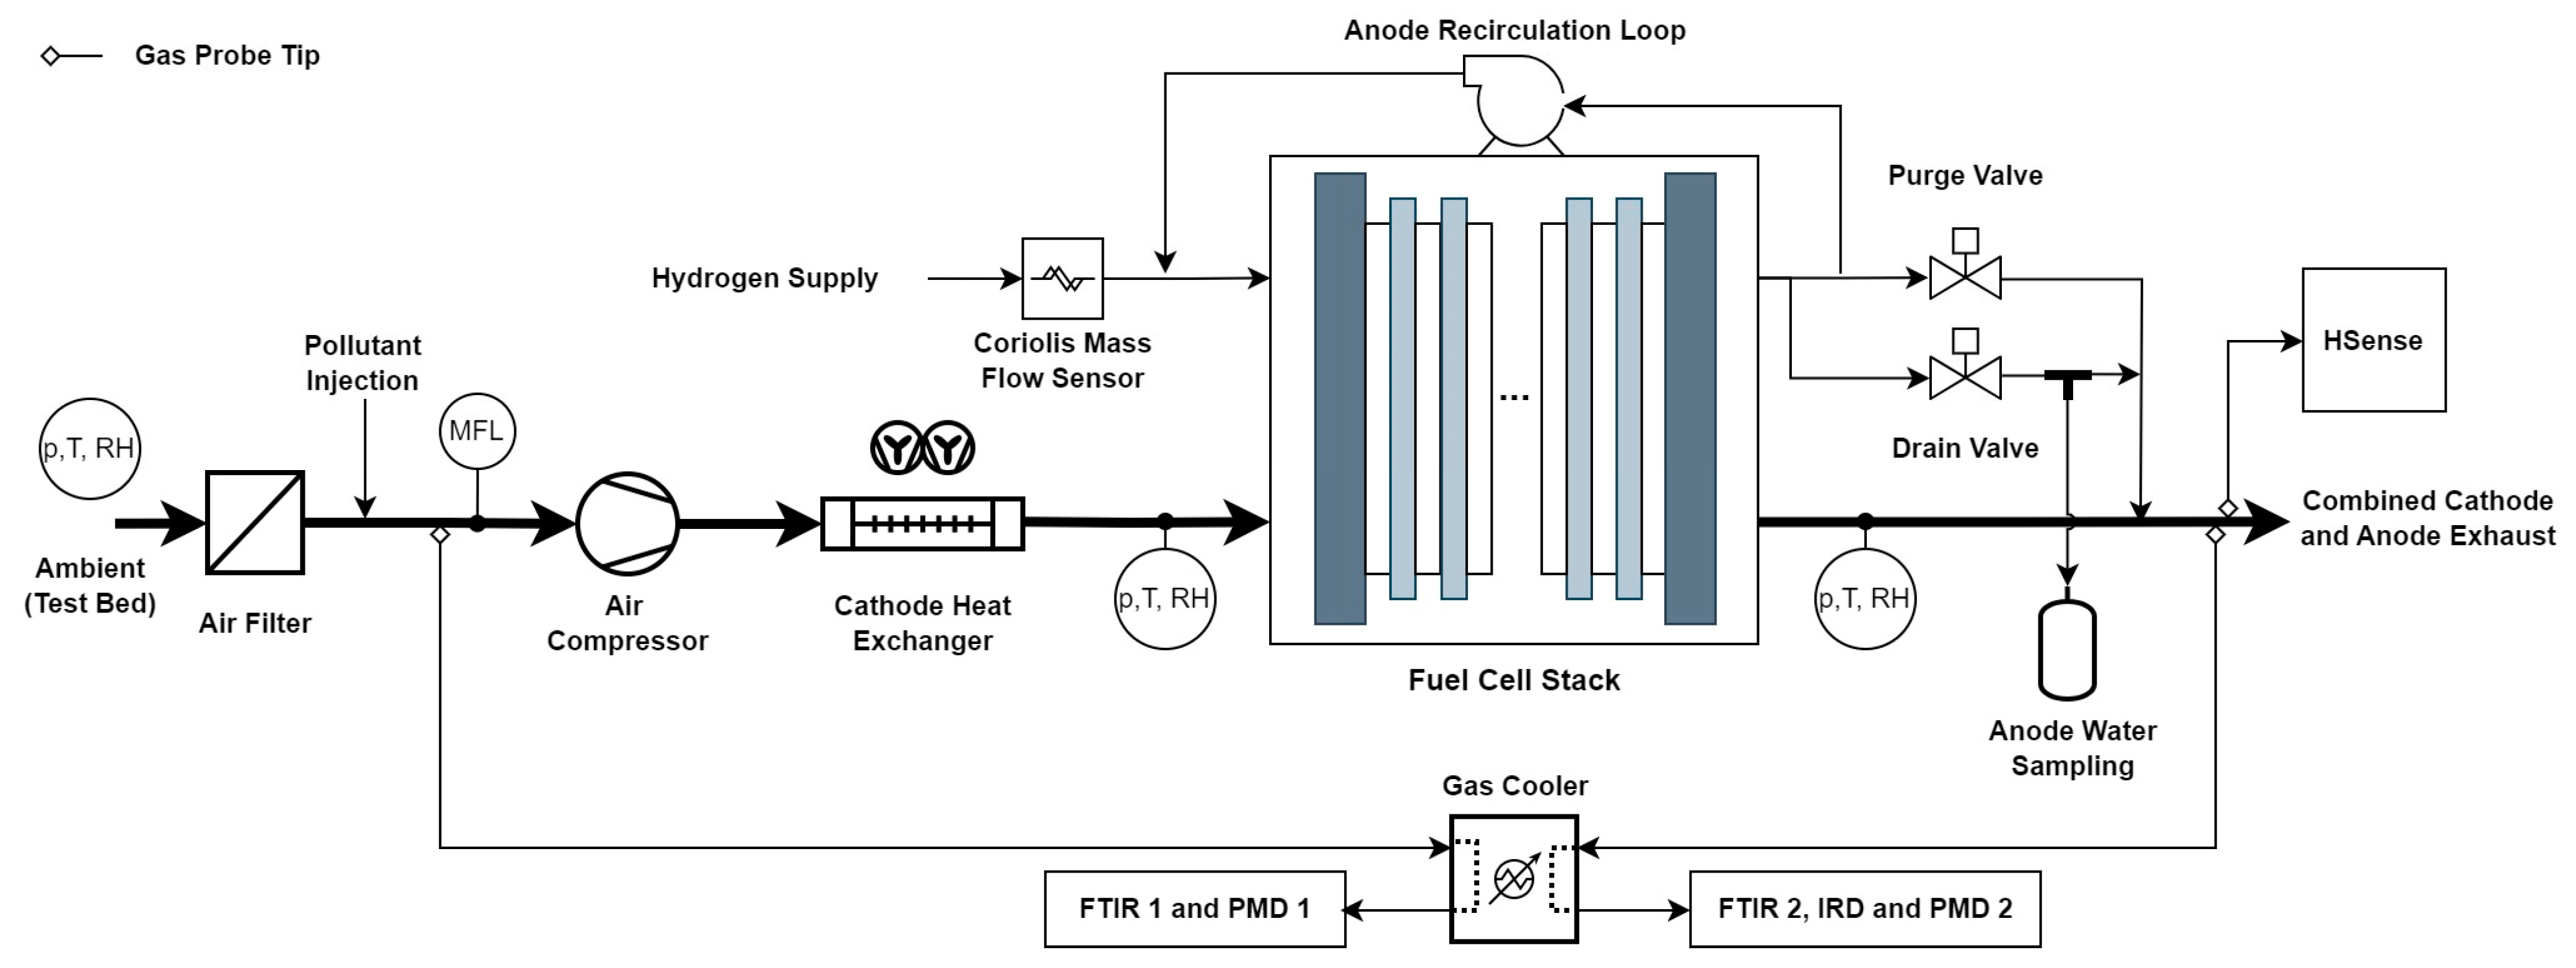
2.1. Test Bed Setup

The fuel cell system used in these experiments delivers a net power of 25 kW and has no external reactant humidification. The nominal operating range extends from 0.32 A/cm2 to 1.22 A/cm2. However, in the experiments, the lower limit was set to 0.04 A/cm2 to evaluate the low-current-density region, and the upper limit was set to 1.08 A/cm2 to avoid extensive high load operation. The system was equipped with a number of sensors, which were either installed by the system manufacturer or added by the research group to the test bed. In this article, only the measuring equipment relevant for the described experiments is presented; further information can be found in [18], which describes the use of the same system.
At the cathode inlet, the pressure (p), temperature (T), and relative humidity (RH) are measured as displayed in Figure 1. Together with the mass flow (MFL) measurement and the gas concentration measurements (FTIR 1 and PMD 1), all parameters at the cathode inlet relevant for this research are known or could be calculated. The air mass flow was measured with an automotive hot-film air mass meter. The ambient cathode air passes through an air filter downstream of the air compressor. In the cathode exhaust, the pressure (p), temperature (T), and relative humidity (RH) are also measured with the limitation that the relative humidity measurement is impaired by the presence of water droplets in the cathode exhaust. These droplets cause the sensor to be permanently wet, even immediately after the fuel cell start, which results in a potentially incorrect measuring signal. Upstream of the anode inlet manifold, a Coriolis mass flow sensor was installed to measure the total hydrogen consumption. The anode was supplied with H2 (purity: 99.999%) from gas bottles.
The gas composition was measured with three analyzer types. The CO2 concentration in the exhaust was measured with an infrared detector (IRD). A paramagnetic detector (PMD) was used to perform the O2 concentration measurement at the cathode inlet and exhaust outlet. The third analyzer type is a Fourier-transform infrared (FTIR) spectroscope, which was also used at the cathode inlet and exhaust outlet. The gas was fed to the analyzers through a gas cooler with two separate branches to reduce the humidity of the exhaust gas. Although the cathode inlet air has a significantly lower humidity than the exhaust gas, the gas cooler was also implemented there to allow the gas analyzers to be switched between the cathode inlet and exhaust side via a valve block (not shown in Figure 1). The gas measuring probe in the exhaust was inserted in the combined anode and cathode exhaust, enabling the detection of the periodic anode purges. Another measuring probe led to the hydrogen sensor (HSense), which applies the electron pulse ionization measuring principle; this has a built-in gas cooler and, therefore, was not linked to the test bed gas cooler shown in Figure 1. The gas measuring equipment used in this research was designed for use at combustion engine test beds with the exception of FTIR 2, which was designed for laboratory gas measuring purposes. Based on the requirements for combustion engine exhaust gas measurement, the standard measuring range of gases such as CO2 is higher than expected for fuel cells. This issue was addressed by using suitable calibration gases.
Several parameters required in this study could not be measured at the test bed and had to be calculated; this calculation process is described in detail in the following sections. Figure 2 provides an overview of the measured and the most important calculated parameters on the fuel cell cathode side. The cathode inlet system S c i has the highest number of directly measured parameters and served as the reference system. The related parameters are denoted with the abbreviation for cathode inlet (ci). S c e denotes the cathode exhaust system similarly, but with more calculated parameters, since fewer sensors could be installed there. The fuel cell cathode inside the stack is denoted S s t a c k , where no direct measurements could be performed. The terms inside the stack system describe the source and sink terms, as indicated by the plus + and minus sign, respectively. The terms in brackets are not considered in the base model but in the subsequent model variations. All terms and abbreviations in Figure 2 are described and referred to in the following sections.

2.2. Gas Measurement

The gas measurement at the fuel cell cathode inlet and in the fuel cell exhaust is of great importance in this research, as it provides the basis for most of the evaluations and calculations.

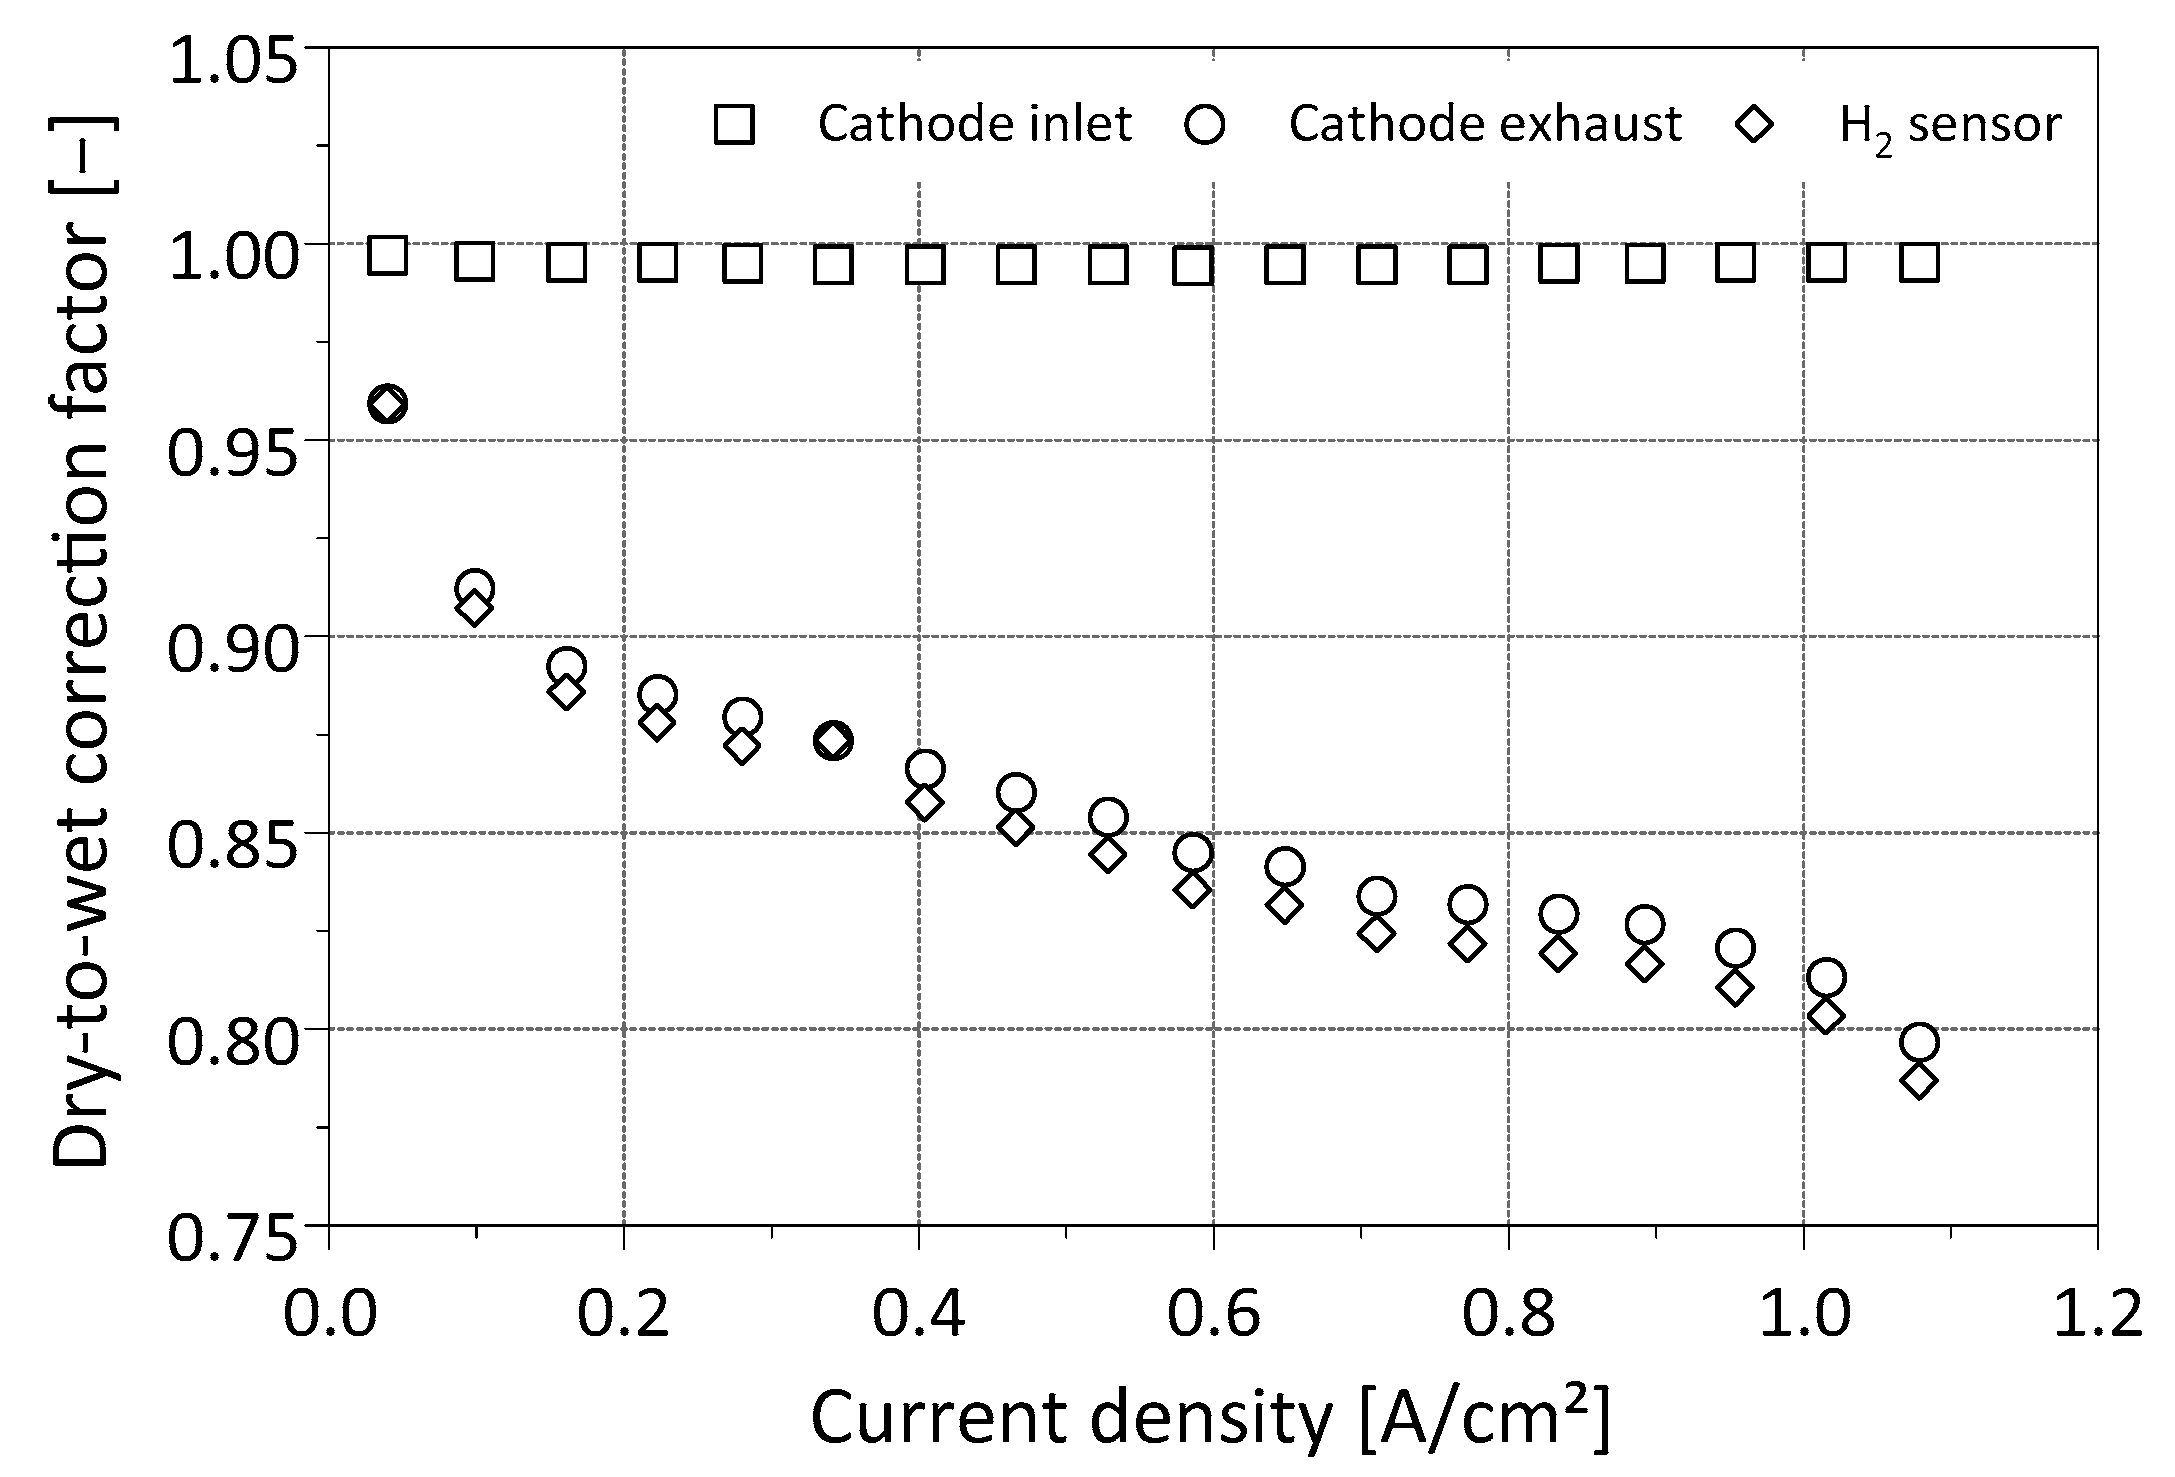
2.2.1. Compensation of Water Condensation in the Gas Cooler

Due to the high water content in the fuel cell system exhaust gas, a gas cooler (set to 1.5 °C) was installed in the piping leading to the gas composition measuring equipment. This was performed to avoid any water accumulation inside the equipment. Due to the condensation of water vapor, the gas composition upstream and downstream of the gas cooler differs, resulting in higher measured concentrations in the relatively drier gas after the gas cooler than are in the wet gas at the fuel cell inlet and exhaust. Therefore, a dry-to-wet correction factor f c x was used to calculate the wet concentrations upstream of the gas cooler, based on [19].
f c x = ν w e t ν d r y = 1 ν H 2 O , U S , c x 1 ν H 2 O , D S , c x
The terms ν w e t and ν d r y are the mole fractions upstream (wet) and downstream (dry) of the gas cooler. The term x in the index represents either the cathode inlet (x = i) or the cathode exhaust (x = e). The mole fractions need to sum up to one, and since only the water mole fraction is changed by the gas cooler, the formula can also be written by including the water mole fraction upstream ν H 2 O , U S , c x and downstream ν H 2 O , D S , c x of the gas cooler. The latter mole fraction is measured by FTIR 1 ( ν H 2 O , D S , c i ) in the cathode inlet and by FTIR 2 ( ν H 2 O , D S , c e ) in the cathode exhaust as a concentration. The water mole fraction upstream of the gas cooler in the cathode inlet gas can be calculated as
ν H 2 O , U S , c i = p H 2 O p c i = R H c i · p v , c i ( T ) p c i .
In Equation (2), the terms R H c i and p c i are measured at the cathode inlet and are the air relative humidity and the total pressure of the humid air, respectively. p H 2 O is the partial pressure of the water vapor. The saturation water vapor pressure p v , c i ( T ) depends on the measured gas temperature and was interpolated from tabulated data. The correction factor does not significantly influence the concentrations in the cathode inlet stream, since the water vapor content in the ambient air is relatively low; therefore, only a small amount of water condenses in the gas cooler. The resulting values over the fuel cell current density operating range can be seen in Figure 3, in which the factor for the cathode inlet is always close to one.
The same calculations are made for the cathode exhaust, although the cathode exhaust relative humidity R H c e was calculated rather than measured by using the equations cited in the following sections. As described in Section 2.1, the H2 sensor (HSense) has an internal gas cooler (gas exiting the HSense below 5 °C). Its water separation capacity was determined by performing a measurement with FTIR 2 inserted downstream of the HSense during an exemplary fuel cell operation. The gained values were then used in the calculations to determine the dry-to-wet correction factor. Figure 3 highlights the fact that the correction factor for the cathode exhaust measurements changes quite significantly over the fuel cell operating range; therefore, this represents an important method which should be applied in fuel cell exhaust gas measurement.
All concentrations and mole fractions mentioned subsequently represent the corrected values using the respective dry-to-wet correction factor.

2.2.2. Gas Mass Calculation

A crucial aspect in this research is the application of gas mass balancing method, which was used to assess the model’s performance. Therefore, the gas mass of an individual gas component had to be calculated both at the cathode inlet and in the exhaust.
m ˙ i = m ˙ c x · M i M c x · ν i
Equation (3) describes the mass flow of an individual gas component m ˙ i with the total mass flow m ˙ c x , the molar mass of the gas component M i , the molar mass of the total inlet or exhaust gas M c x , and the measured concentration converted into the mole fraction of an individual gas component ν i .

2.2.3. Gas Analyzer Comparison

The use of multiple gas analyzers with different operating principles and from various manufacturers is a potential source of deviation in the measurements. Therefore, the analyzers were exposed to calibrating gas to evaluate the relative error between the measured concentrations. This was performed by injecting the calibrating gas into the probe tips in the cathode gas path, as depicted in Figure 1, to which the individual gas analyzers are connected. Therefore, all components downstream of the probe tips, such as the gas cooler, piping, and valves, are included. This has the advantages that possible leaks can be identified, and the time delay caused by the piping lengths can be evaluated.
The CO2 measurements of all relevant gas detectors were comparable, displaying differences of only a few parts per million (ppm). In addition to a 500 ppm CO2 in N2 mixture, ambient air was used for comparison. The difference between the PMD 1 O2 and PMD 2 O2 measurements was more significant, based on measurements with ambient air. Therefore, the PMD 2 value was adjusted to match the PMD 1 concentration. The decision to adjust the PMD 2 value was made because PMD 1 is used at the cathode inlet, which was defined as the reference system in this study.
A further correction to the exhaust gas measurements had to be made due to the influence of the anode purge and drain H2 peaks in the exhaust. As shown in Figure 1, the measuring probe was inserted in the combined anode and cathode exhaust, and the influence of the H2 concentration peaks can be seen in the IRD, PMD 2, and FTIR 2 measurements. Since only the cathode exhaust gas is of interest, and the concentrations there were not expected to change during the anode purge, the measuring signals were post-processed by linear interpolation to exclude the influence of the H2 peaks.

2.3. Mathematical Models

A mathematic model was developed in this research to calculate the fuel cell exhaust gas composition and mass flow. This model was based on test bed data and assumptions regarding unknown parameters. Parameters such as temperature, gas partial pressures, and water formation are not constant inside the fuel cell. To locally resolve these processes, extensive knowledge regarding the design and materials used in the fuel cell is required, but which was not available in this research. Therefore, the fuel cell stack was treated as a black box, and the following generalized assumptions about the processes inside the stack were made:
  • All gases are thermodynamically ideal gases.
  • The cathode inlet air molar mass is based on synthetic air (consisting of N2 and O2 only) and water vapor.
  • The water formed as a product is formed in a liquid state at the reaction site and contacts the cathode gas, enabling water vapor transfer. Therefore, a fully hydrated membrane was assumed, and the possibility of water transport through the membrane to the anode was excluded.
  • All water formed as a product is susceptible to gas absorption and has the same temperature as the cathode exhaust gas.
  • No liquid or gas diffusion through the membrane is considered.
These assumptions are valid for the base model, dubbed Model-A. Three modified models were created based on Model-A and tested individually, followed by a fourth model combining all modifications, as listed in Table 1.

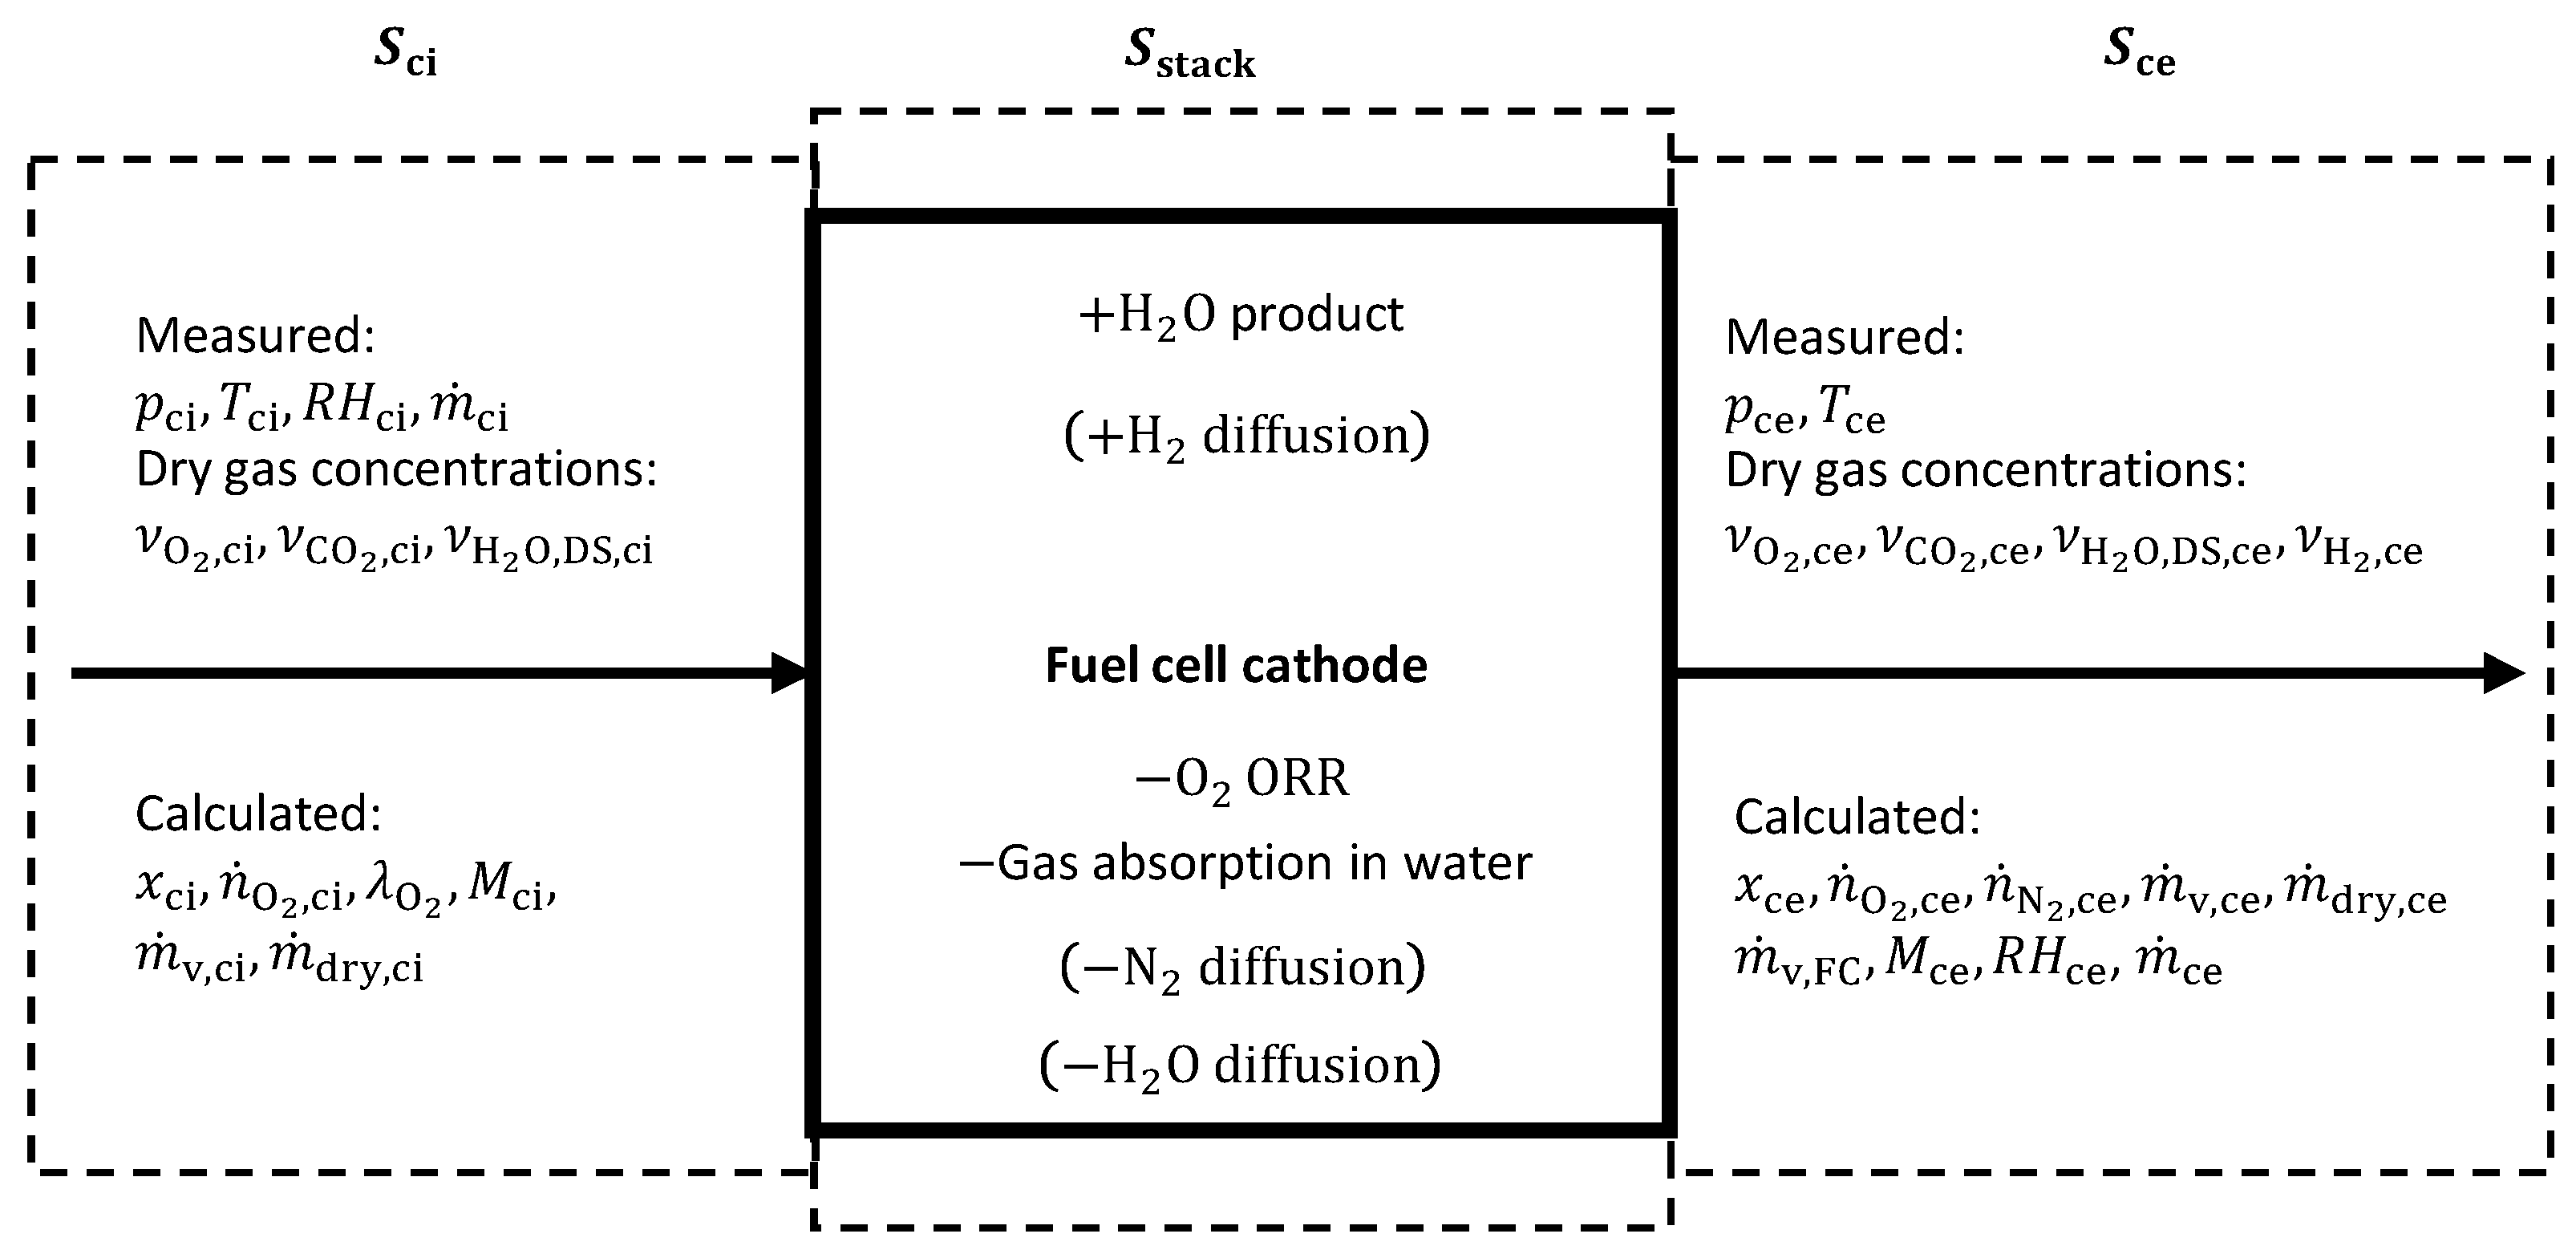
2.3.1. Cathode Inlet Calculations

At the cathode inlet, all parameters necessary to calculate the gas composition were measured or derived from the measured values. The following set of equations follows basic thermodynamic rules. Equation (4) describes the molar flow rate of oxygen at the cathode inlet
n ˙ O 2 , c i = ν O 2 , c i · m ˙ c i M c i
with m ˙ c i being the measured cathode inlet mass flow, hence consisting of dry air and water vapor. M c i is the molar mass of the cathode inlet air, as described in Equation (5)
M c i = 1 ν H 2 O , c i · M a i r , d r y + ν H 2 O , c i · M H 2 O ,
where M H 2 O is the molar mass of water, M a i r , d r y is the molar mass of synthetic air consisting of 79 vol% N2 and 21 vol% O2, and ν H 2 O , c i is the mole fraction of water vapor in the cathode inlet air, as measured by FTIR 1.
The oxygen ratio at the cathode side λ O 2 describes the ratio between the supplied oxygen molar flow rate n ˙ O 2 c i and the consumed amount of oxygen during the ORR n ˙ O 2 , c o n s . .
λ O 2 = n ˙ O 2 , c i n ˙ O 2 , c o n s . = m ˙ O 2 , c i m ˙ O 2 , c o n s .
The fuel cell current depending O2 consumption mass flow m ˙ O 2 , c o n s . in the fuel cell can be calculated with
m ˙ O 2 , c o n s . = I s t a c k · n c e l l s · M O 2 4 · F
where I s t a c k is the measured stack current, n c e l l s is the number of cells in the stack, M O 2 is the molar mass of oxygen, and F is the Faraday constant.
The oxygen ratio is adjusted by the cathode air compressor mass flow and commonly set to values well above one so that sufficient fuel is supplied, and the water produced is transported out of the fuel cell, preventing the membrane from drying out. By combining and modifying Equations (6) and (7) and by making the additional correlations for mixtures of ideal gases, the cathode oxygen ratio is calculated as
λ O 2 = m ˙ c i · 4 · F · ν O 2 , c i M c i · I s t a c k · n c e l l s .
Although the fuel cell system does not have an external cathode gas humidifier, the cathode inlet air is not totally dry due to the presence of water vapor in the ambient air. This water vapor mass flow has to be considered in the calculations, since it reduces the water uptake capacity of the cathode gas inside the fuel cell. Since the fuel cell was operated frequently with only short periods without operation, it was assumed that the membrane did not dry out between the experiments; therefore, the water vapor mass flow at the cathode inlet is not completely consumed to humidify the membrane.
The absolute humidity x c i at the cathode inlet can be calculated as
x c i = m ˙ v , c i m ˙ d r y , c i = M H 2 O M a i r , d r y · R H c i · p v , c i ( T ) p c i R H c i · p v , c i ( T )
The new terms in Equation (9) are the water vapor mass flow m ˙ v , c i and the dry air mass flow m ˙ d r y , c i . The cathode inlet water vapor mass flow m ˙ v , c i can be calculated as
m ˙ v , c i = x c i · m ˙ c i 1 + x c i
and the dry air mass flow as
m ˙ d r y , c i = m ˙ c i m ˙ v , c i

2.3.2. Cathode Exhaust Gas Calculations: Humid Air—Model-A

The amount of water produced during the fuel cell operation m ˙ H 2 O , p r o d . depends on the stack current and can be calculated by using Equation (12).
m ˙ H 2 O , p r o d . = I s t a c k · n c e l l s · M H 2 O 2 · F
This water is transported out of the fuel cell with the cathode gas flow, either as water vapor or liquid water droplets. In this study, a differentiation was made between saturated and non-saturated exhaust gas, which depends on the water vapor uptake capacity of the cathode gas. To assess the condition of the cathode exhaust gas, an estimated absolute humidity x c e , e s t is calculated by using Equation (13), assuming that the whole product water mass is dissolved in the cathode gas as water vapor:
x c e , e s t = m ˙ v , c e m ˙ d r y , c e = m ˙ H 2 O , p r o d . + m ˙ v , c i n ˙ N 2 , c e · M N 2 + n ˙ O 2 , c e · M O 2
with
n ˙ O 2 , c e = n ˙ O 2 , c i · λ O 2 1 λ O 2
and
n ˙ N 2 , c e = 1 ν O 2 , c i ν v , c i · n ˙ c i = n ˙ N 2 , c i .
An estimated relative humidity can be calculated based on x c e , e s t with Equation (16), which is a reformulation of Equation (9) and the indexes of the cathode exhaust (ce). The temperature-dependent calculated saturation vapor pressure is p v , c e ( T ) , and the measured total fuel cell exhaust gas pressure is p c e .
R H c e , e s t = p c e p v , c e ( T ) 1 + M H 2 O M a i r , d r y · 1 x c e , e s t
For the calculation of the estimated exhaust relative humidity R H c e , e s t , dry synthetic air composed of 79 vol% N2 and 21 vol% O2 was assumed, and the parameters M a i r , d r y and p v , c e ( T ) were calculated on this basis. Therefore, the reduced oxygen concentration at the cathode exhaust due to the ORR was neglected.
Based on the estimated exhaust relative humidity R H c e , e s t , a case discrimination was made:
  • Case 1: R H c e , e s t < 1 : The fuel cell exhaust gas is not saturated, and all the water produced is transported out of the fuel cell as water vapor. In this case, the exhaust relative humidity is calculated for every time step; x c e = x c e , e s t .
  • Case 2: R H c e , e s t 1 : The fuel cell exhaust gas is considered to be saturated, with possible presence of liquid water and water vapor. In this case, the exhaust relative humidity is set to one. Values above one are fictitious, because when saturated, the maximum value that can be reached is one; x c e = f R H c e = 1 , calculated based on Equation (9) with the parameters of the cathode exhaust.
The case discrimination is made at every time step for the recorded data. Therefore, the calculation model can be used to cover fuel cell operating states in which the exhaust gas is either saturated or unsaturated. This makes it suitable for performing calculations over the whole operating range of a fuel cell system.
The dry exhaust air mass flow can be calculated as the dry inlet air mass flow, reduced by the ORR oxygen consumption:
m ˙ d r y , c e = m ˙ d r y , c i m ˙ O 2 , c o n s .
And the total gaseous exhaust mass flow is
m ˙ c e = m ˙ d r y , c e + m ˙ v , c e .
This total exhaust gas mass flow is further used for calculating the exhausted gas masses in Equation (3).
Depending on the case, the exhaust water vapor mass flow m ˙ v , c e and liquid water mass flow m ˙ l i q u i d , c e are calculated differently. Furthermore, the molar mass for the cathode exhaust gas has to be calculated, which is required for the calculations shown in Equation (3):
M c e = 1 ν O 2 , c e ν v , c e · M N 2 + ν O 2 , c e · M O 2 + ν v , c e · M H 2 O
The oxygen molar fraction in the exhaust gas can be calculated as
ν O 2 , c e = n ˙ O 2 , c e n ˙ N 2 , c e + n ˙ O 2 , c e + n ˙ v , c e ,
with the exhaust water vapor molar flow rate
n ˙ v , c e = n ˙ N 2 , c e + n ˙ O 2 , c e · p v , c e ( T ) · R H c e p c e p v , c e ( T ) · R H c e .
Based on the calculated absolute humidity x c e , the water vapor mass flow in the exhaust gas is calculated in Equation (22).
m ˙ v , c e = x c e · m ˙ d r y , c e
The exhaust gas water vapor uptake capacity is reduced by the presence of the inlet water vapor mass flow m ˙ v , c i . The water vapor mass flow absorbed in the fuel cell stack, therefore, is calculated as
m ˙ v , f c = m ˙ v , c e m ˙ v , c i .
For Case 1, the liquid exhaust mass flow is zero per definition, since all the water produced is carried out of the fuel cell as water vapor. Case 2, however, has an additional liquid water mass flow due to the saturated or oversaturated exhaust gas and can be calculated as
m ˙ l i q u i d , c e = m ˙ H 2 O , p r o d . m ˙ v , f c .

2.3.3. Cathode Exhaust Gas Calculations: Humid Air—Model-B, including Exhaust Hydrogen

The predominant gas components in the fuel cell cathode exhaust are, by several orders of magnitude, N2 and O2, but the H2 concentration can be in the range of several hundreds to thousands of ppm in the case of a degraded membrane. This concentration originates from the H2 crossover from the anode to the cathode and does not come from the anode purge and drain processes. Therefore, Model-B takes into account the presence of H2 in the humid air calculation, which was derived from the exhaust H2 concentration measurement, excluding the H2 peaks from the anode purge and drain events. A term that allows the H2 influence on the dry gas molar mass to be considered is added to the total exhaust gas molar mass from Equation (19):
M c e = ν N 2 , c e · M N 2 + ν O 2 , c e · M O 2 + ν v , c e · M H 2 O + ν H 2 , c e · M H 2 .
Consequently, the estimated exhaust gas absolute humidity from Equation (13) is changed to
x c e , e s t = m ˙ v , c e m ˙ d r y , c e = m ˙ H 2 O , p r o d . + m ˙ v , c i n ˙ N 2 , c e · M N 2 + n ˙ O 2 , c e · M O 2 + n ˙ H 2 , c e · M H 2 .
The exhaust gas oxygen molar fraction from Equation (20) also changes to
ν O 2 , c e = n ˙ O 2 , c e n ˙ N 2 , c e + n ˙ O 2 , c e + n ˙ v , c e + n ˙ H 2 , c e ,
And Equation (21) is modified to
n ˙ v , c e = n ˙ N 2 , c e + n ˙ O 2 , c e + n ˙ H 2 , c e · p v , c e ( T ) · R H c e p c e p v , c e ( T ) · R H c e .
Finally, the hydrogen exhaust mass flow is added to the dry gas exhaust mass flow from Equation (17)
m ˙ d r y , c e = m ˙ d r y , c i m ˙ O 2 , c o n s . + m ˙ H 2 , c e

2.3.4. Cathode Exhaust Gas Calculations: Humid Air—Model-C, including Membrane Water Diffusion

As described in the introduction, product water can diffuse from the cathode through the membrane to the anode. In this study, the rate of water diffusion was determined empirically by using the anode water sampling flask depicted in Figure 1. The drain water was collected in a representative experiment covering the fuel cell current density range, and the total amount of water produced was measured. Based on these experiments, a relationship between the total product water formation from Equation (12) and the collected anode drain water was derived. The result shows that 10% of all water produced diffuses to the anode. Due to the fact that this value was derived from a full experiment, all water transport mechanisms acting at the membrane are included. In Model-C, the time-based water mass flow was reduced by 10%, thus accounting for the water diffusion across the membrane. Equation (12) is adjusted to
m ˙ H 2 O , p r o d . = I s t a c k · n c e l l s · M H 2 O 2 · F · 0.9 ,
which affects all calculations that include the product water mass flow.

2.3.5. Cathode Exhaust Gas Calculations: Humid Air—Model-D, including Nitrogen Diffusion

The nitrogen diffusion rate through the membrane could not be determined in the experiments. Therefore, the current-dependent values for nitrogen crossover through the membrane to the anode were taken from [20] and adapted to fit the specifications of the system used in the current experiments. The result is a fuel cell stack current-dependent nitrogen molar flow rate to the anode n ˙ N 2 , d i f f . , which reduces the molar flow rate of nitrogen on the cathode exhaust side, thus influencing the exhaust gas composition. Equation (15) changes to
n ˙ N 2 , c e = 1 ν O 2 , c i ν v , c i · n ˙ c i n ˙ N 2 , d i f f . n ˙ N 2 , c i ,
and no longer equals the cathode inlet nitrogen molar flow rate n ˙ N 2 , c i .

2.3.6. Gas Absorption in the Fuel Cell Product Water

The degree of absorption of the gas components O2 and CO2 was investigated since this influences the gas mass balancing. The assumption made in this study was that gas absorption takes place inside the fuel cell on the cathode side when the product water and the gas come into contact. The possibility that further gas absorption occurs in the exhaust pipe downstream of the fuel cell stack up to the measuring probe cannot be fully excluded, but it was assumed that absorption took place mainly at the point of first contact between gas and water inside the fuel cell, where the individual gas concentrations are highest. The possibility of gas absorption in the gas cooler was excluded, because of the small contact area available between the gas and the condensed liquid water inside the gas cooler [19].
The calculations and parameters are derived from [21], and the main equation used to calculate the gas absorption is Henry’s Law:
c O 2 , c i = H ρ H 2 O · p O 2 , c i
The indexes in Equation (32) refer to the calculation of O2 absorption as an example, but the same equation can be used for any gas species. c O 2 , c i denotes the concentration of oxygen in the water produced, p O 2 , c i is the oxygen gas partial pressure derived from the measurements at the cathode inlet, ρ H 2 O is the density of the product water, and H is the Henry solubility. The influence of the water temperature is considered by applying the van’t Hoff equation:
H = H r e f · e s o l H R · 1 T 1 T r e f
The temperature T r e f is the reference temperature (298.15 K), H r e f is the reference Henry constant at T r e f , s o l H is the enthalpy of dissolution, and R is the universal gas constant, all of which are either constant or tabulated in [21]. T is the water temperature, which was not measured in the experiments and was set to the measured value of the cathode exhaust gas temperature.

3. Results and Discussion

The mathematical and thermodynamic models presented in the previous section were validated by balancing gas species between the cathode inlet and exhaust. This process was based on the assumption that certain gases were neither produced nor consumed on the fuel cell cathode side; therefore, mass balancing between the inlet and exhaust could be performed. A gas species suitable for this evaluation is CO2, which is part of the ambient air and is not expected to be produced on the cathode side of the fuel cell under regular operating conditions in significant quantities [10].
Another promising gas species for gas mass balancing is O2, which is also not produced in the fuel cell but is partly consumed during the ORR. Therefore, this current-based oxygen consumption was taken into account using Equation (7) and is considered in all the presented results.

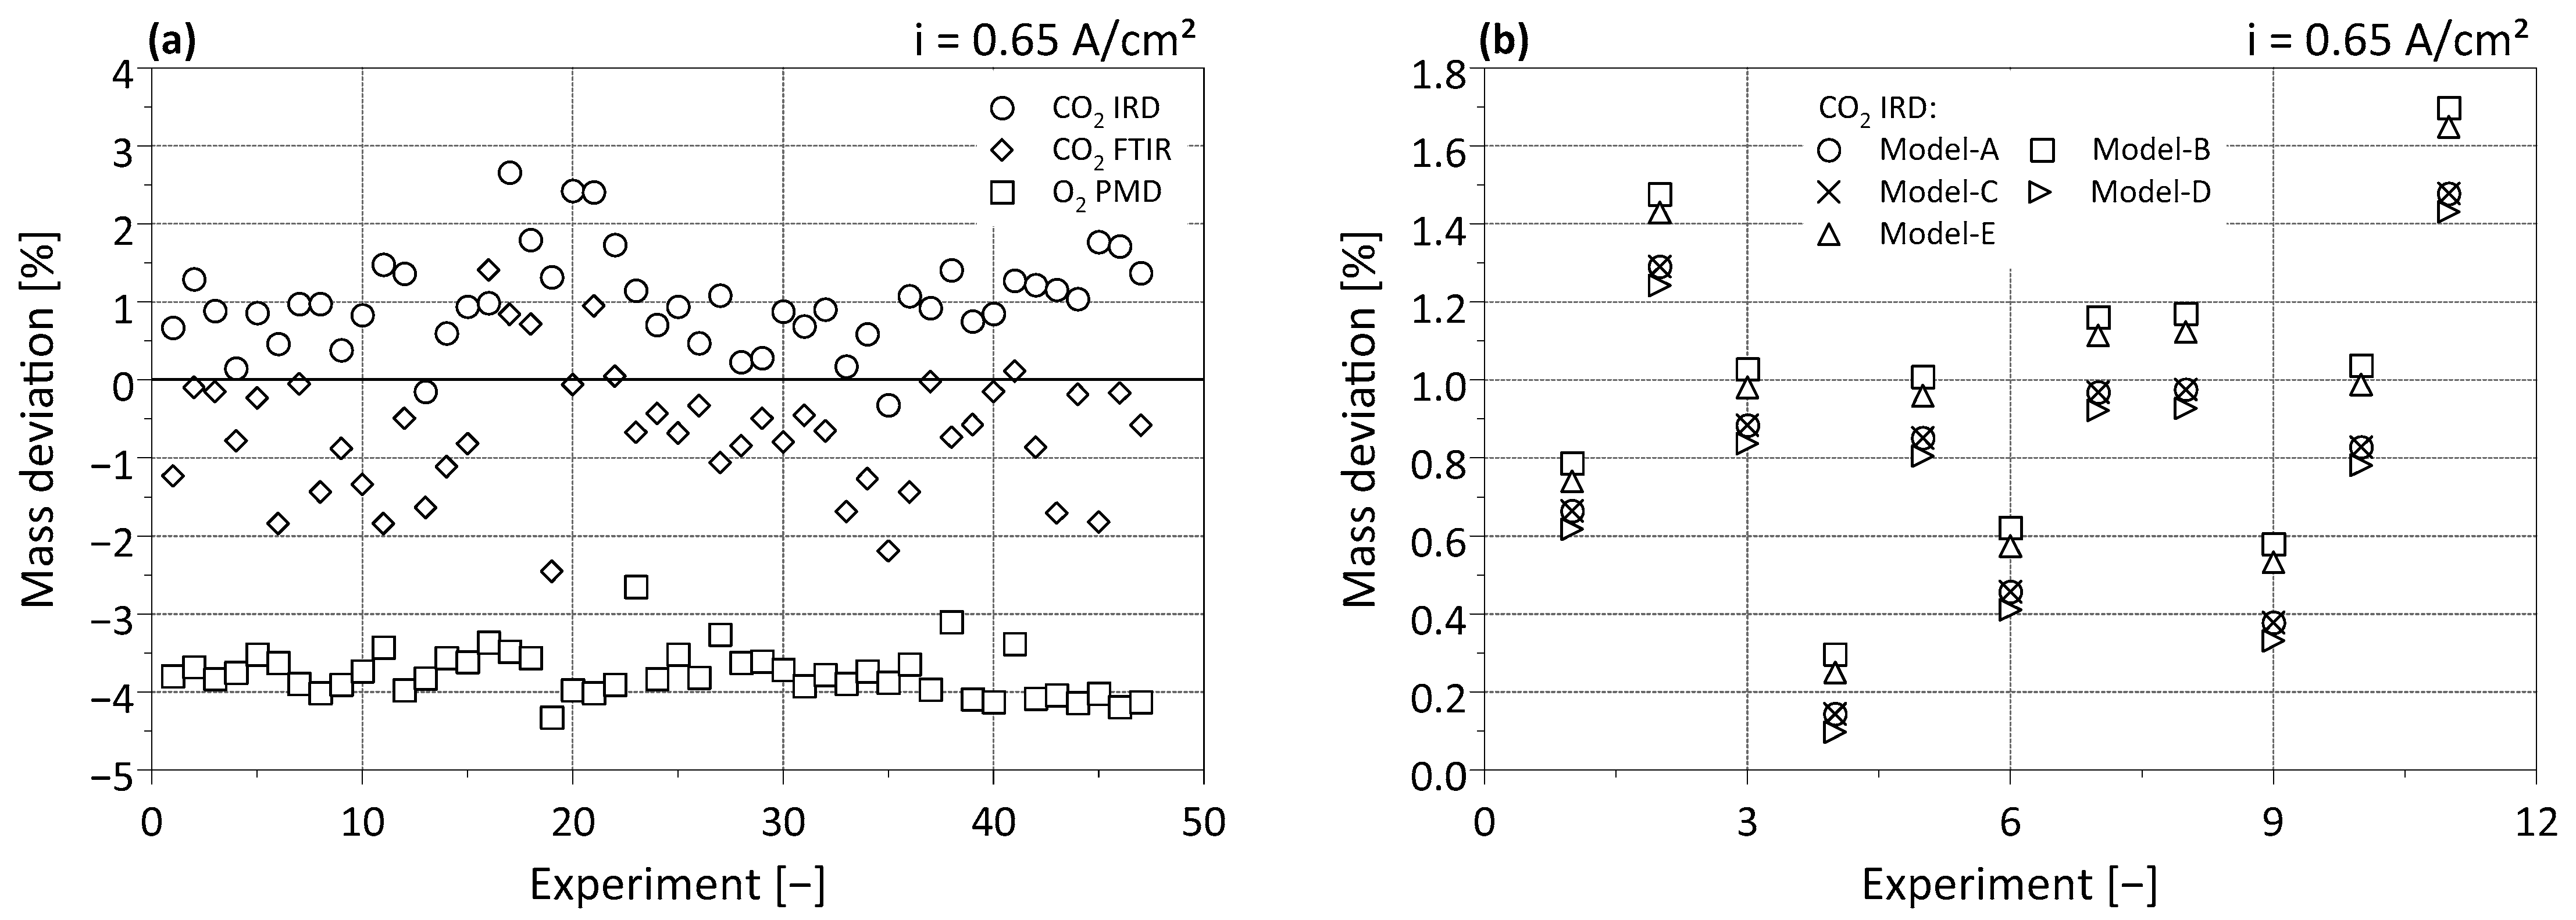
3.1. Model Evaluation

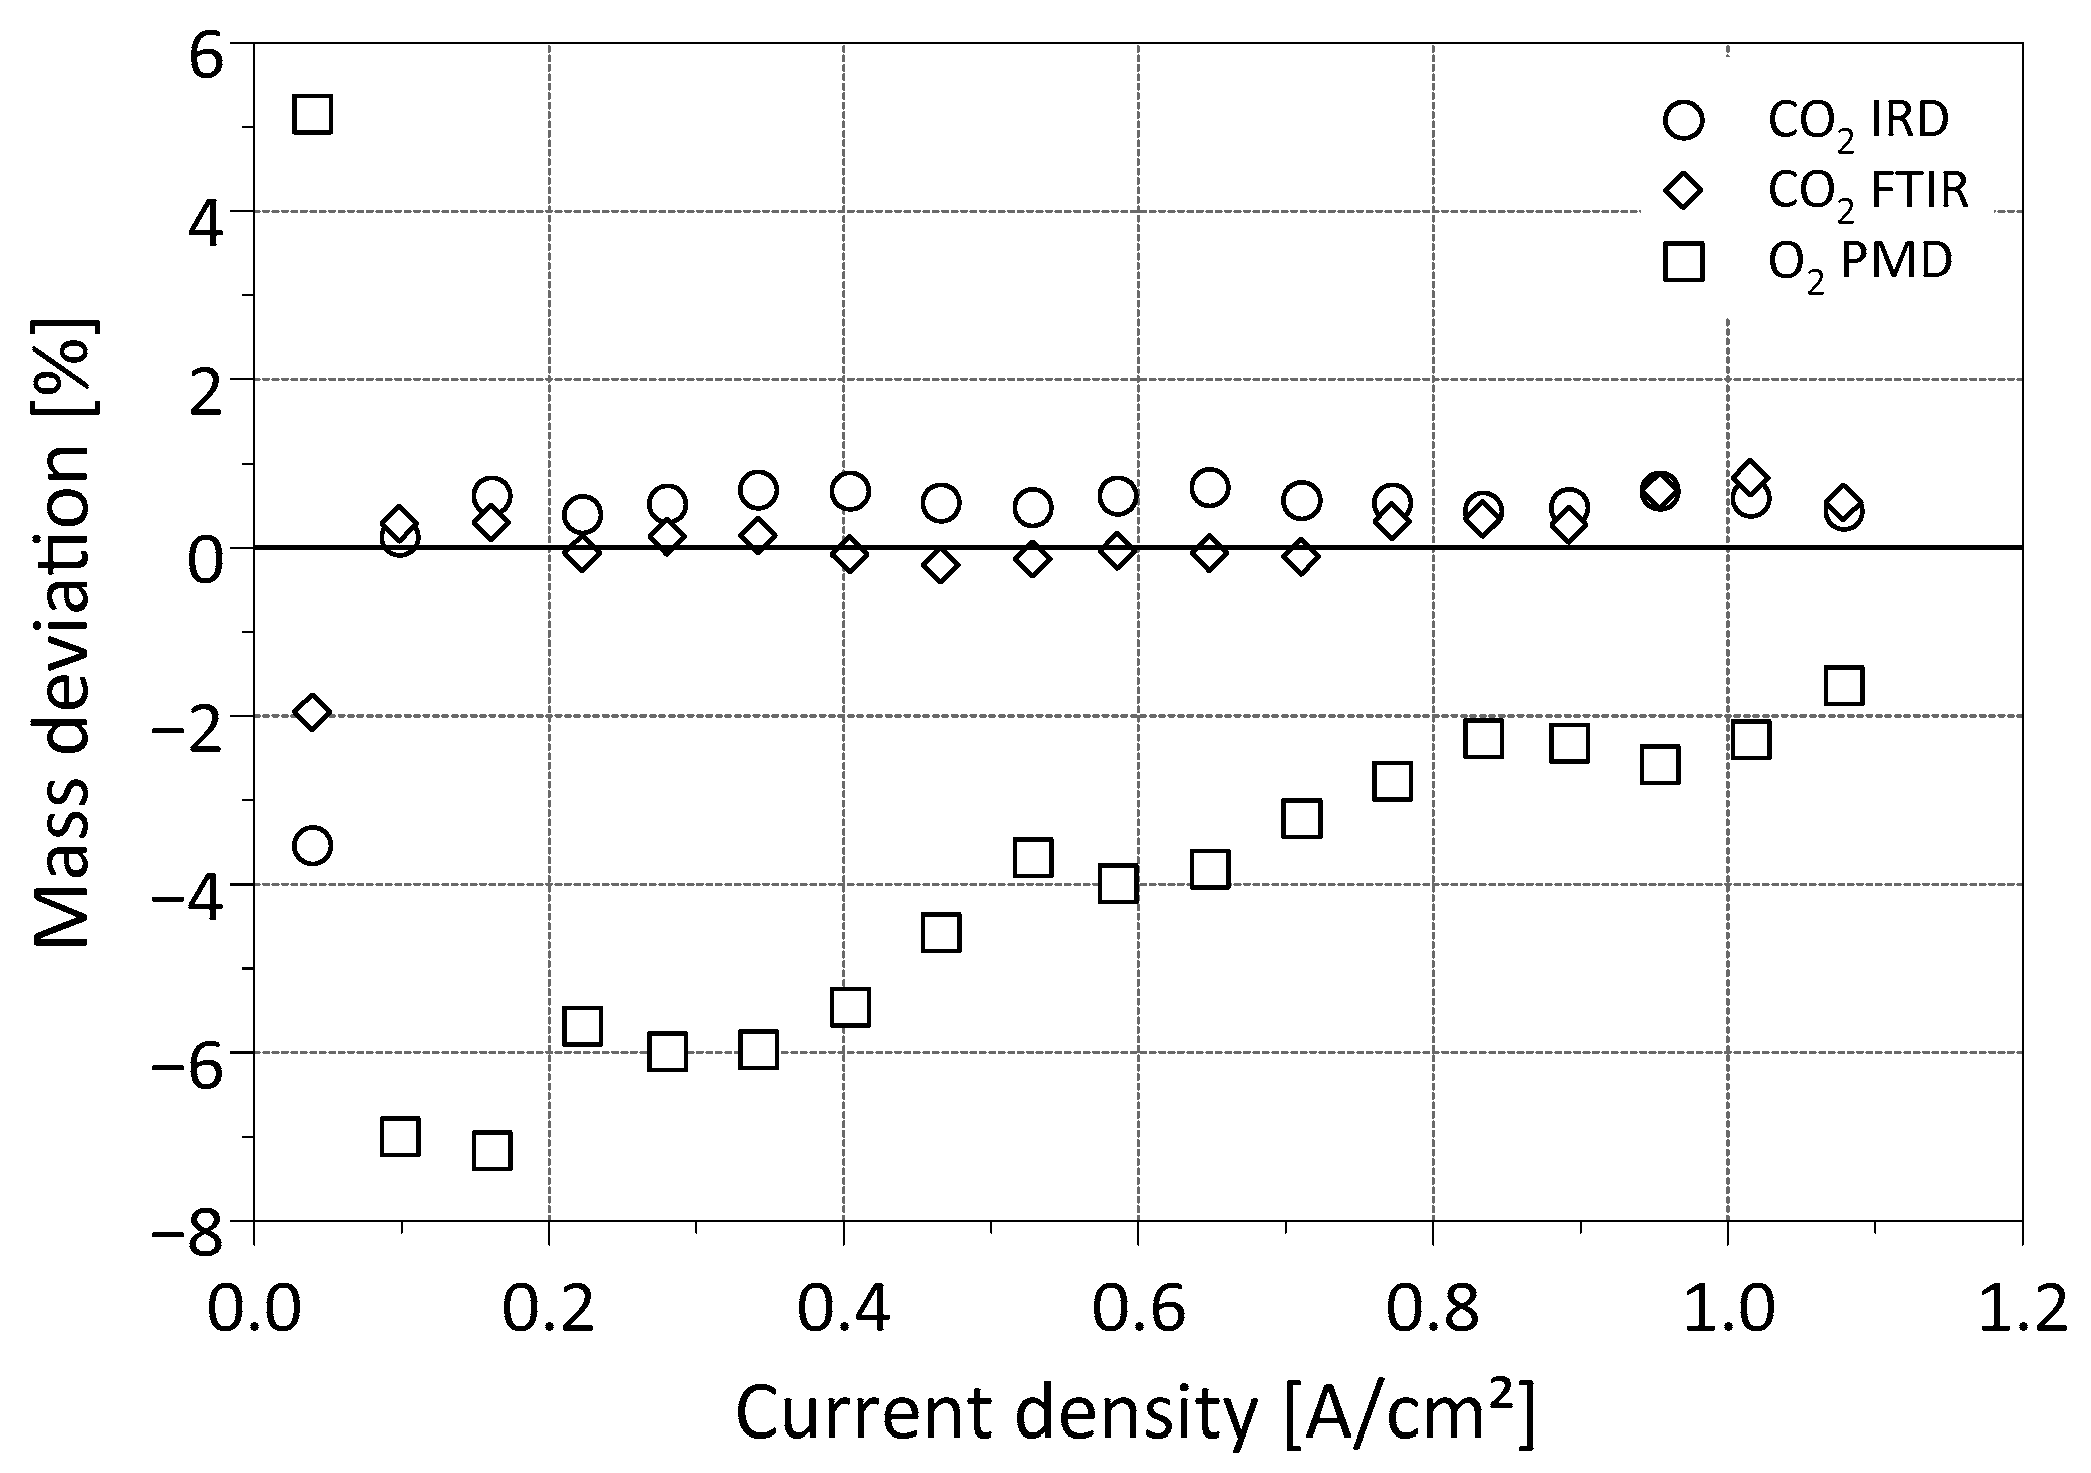
3.1.1. Steady-State Fuel Cell Operation

The models were first tested under steady-state fuel cell operation conditions, since the fuel cell operating parameters are relatively constant and reproducible at constant current densities, which were held for dwell times of several minutes. In the case of Figure 4a,b, the 0.65 A/cm2 current density load point was held constant for 30 min, the last ten minutes of which were used for the calculations. This method ensured that operating parameters such as the temperatures of the reactants and coolant, the water produced, including the membrane humidification, and the resulting cell voltages had reached a stable and reproducible state. Therefore, an isolated performance evaluation of the calculation models was possible.
The results in Figure 4a show the deviation of the O2 and CO2 masses at the constant current density load point between the cathode inlet and exhaust as a percentage of the mass at the cathode inlet, measured with three different analyzers and calculated based on Model-A. Overall, the gas species mass balancing reaches acceptable levels of deviation (i.e., between ±3% in the case of CO2 and above—5% for O2). In particular, the results for O2 all lie within a comparable range (±2%), which implies that the calculation method is stable and reproducible. In the case of CO2 balancing, the results vary between positive and negative values, suggesting that no pronounced CO2 production occurred due to carbon corrosion inside the fuel cell.
The calculation models listed in Table 1 were used on the same base data set from the eleven experiments depicted in Figure 4b, which facilitates a direct comparison. In this evaluation, Model-A is the reference model based on the approach where the stack is treated as a black box. Since detailed information about the fuel cell design and insight into the processes inside the fuel cell stack may not be available, this approach is considered the most applicable one in general fuel cell research since it only requires measuring equipment around the stack. The results for CO2 IRD based on Model-A in Figure 4b are the same as for the first eleven experiments shown in Figure 4a. In these experiments, the mass balancing offset is below 1.8% of the CO2 mass transported into the fuel cell.
Model-B considering the H2 share in the cathode exhaust gas is the most different from Model-A among all models. The increase in the mass balancing offset is mainly caused by the higher dry and total gas mass flows obtained from Equations (18) and (29), which subsequently results in an increased exhausted CO2 mass (Equation (3)).
Model-C considers the membrane water transport and, hence, the change in product water mass flow through the cathode. The effect is, however, negligible compared to that shown in Model-A, since the results of the two models in Figure 4b almost fully overlap. Apparently, slight changes in the product water mass flow do not have a significant influence on the calculation, suggesting that the membrane water diffusion can be neglected in calculations of this nature.
The N2 diffusion through the membrane, described in Model-D, has an influence on the results as shown in Figure 4b, although this influence is not as significant as the H2 mass flow consideration in Model-B. Due to the N2 diffusion to the anode, the N2 mass flow through the cathode changes, reducing the total mass flow at the cathode exit. Therefore, the CO2 mass flow and, hence, the total exhausted CO2 mass are also reduced as compared to Model-A.
Model-E is a combination of all models, which results in values slightly above the ones obtained from the base Model-A; these are mainly influenced by the H2 mass flow consideration as in Model-B.
Based on these experiments, the effect of the gas absorption was also investigated. The influence is marginal, that is, 0.01 percentage points on average. The low effect of gas species absorption in fuel cells was also reported in [22]. Despite its small impact, the gas absorption calculation was performed for all evaluations, and all results are included, as well as those from Figure 4a,b.
Note that the membrane water diffusion in Model-C is quite generalized and based on one representative measurement, neglecting possible changes due to membrane degradation and changes in operating conditions. The nitrogen diffusion in Model-D is derived from [20] and not based on the tested system, which is a potential source of error. The results shown in Figure 4b, therefore, only provide a basis for discussing the influence of membrane transport mechanisms on the exhaust gas calculation and do not allow the most correct calculation model to be identified.
Figure 5 shows the results of gas mass balancing at different current densities but still at steady-state operation, since every current density was kept constant for ten minutes. The calculations were performed for the total ten minutes of dwell time. The goal in these experiments was to evaluate whether the model could be used over the whole fuel cell operating range. The CO2 gas mass balancing based on IRD and FTIR 2 shows comparable results at all current densities except for the lowest current density. At this point, the fuel cell was being operated outside its normal operating range, resulting in non-ideal operating conditions regarding the increased cathode flow and the resulting dehydration of the membrane. The same effect can be seen in the O2 mass balancing shown in Figure 5. Except for the lowest current density, the offset in gas mass balancing decreases as the current density increases. The PMD 2 gas analyzer used may explain the reason for this trend, although the exact reason for the behavior could not be identified. A methodological error in the calculation model can be excluded, since the results for CO2 IRD and FTIR 2 do not show the same trend. Another reason for the load point-dependent change in the gas mass balancing offset could be the O2 diffusion into the membrane, where it reacts to heat and water [23]. Furthermore, the O2 mass balancing calculation contains the calculated oxygen consumption of the fuel cell, which depends on the stack current measurement, a further possible source of deviation.

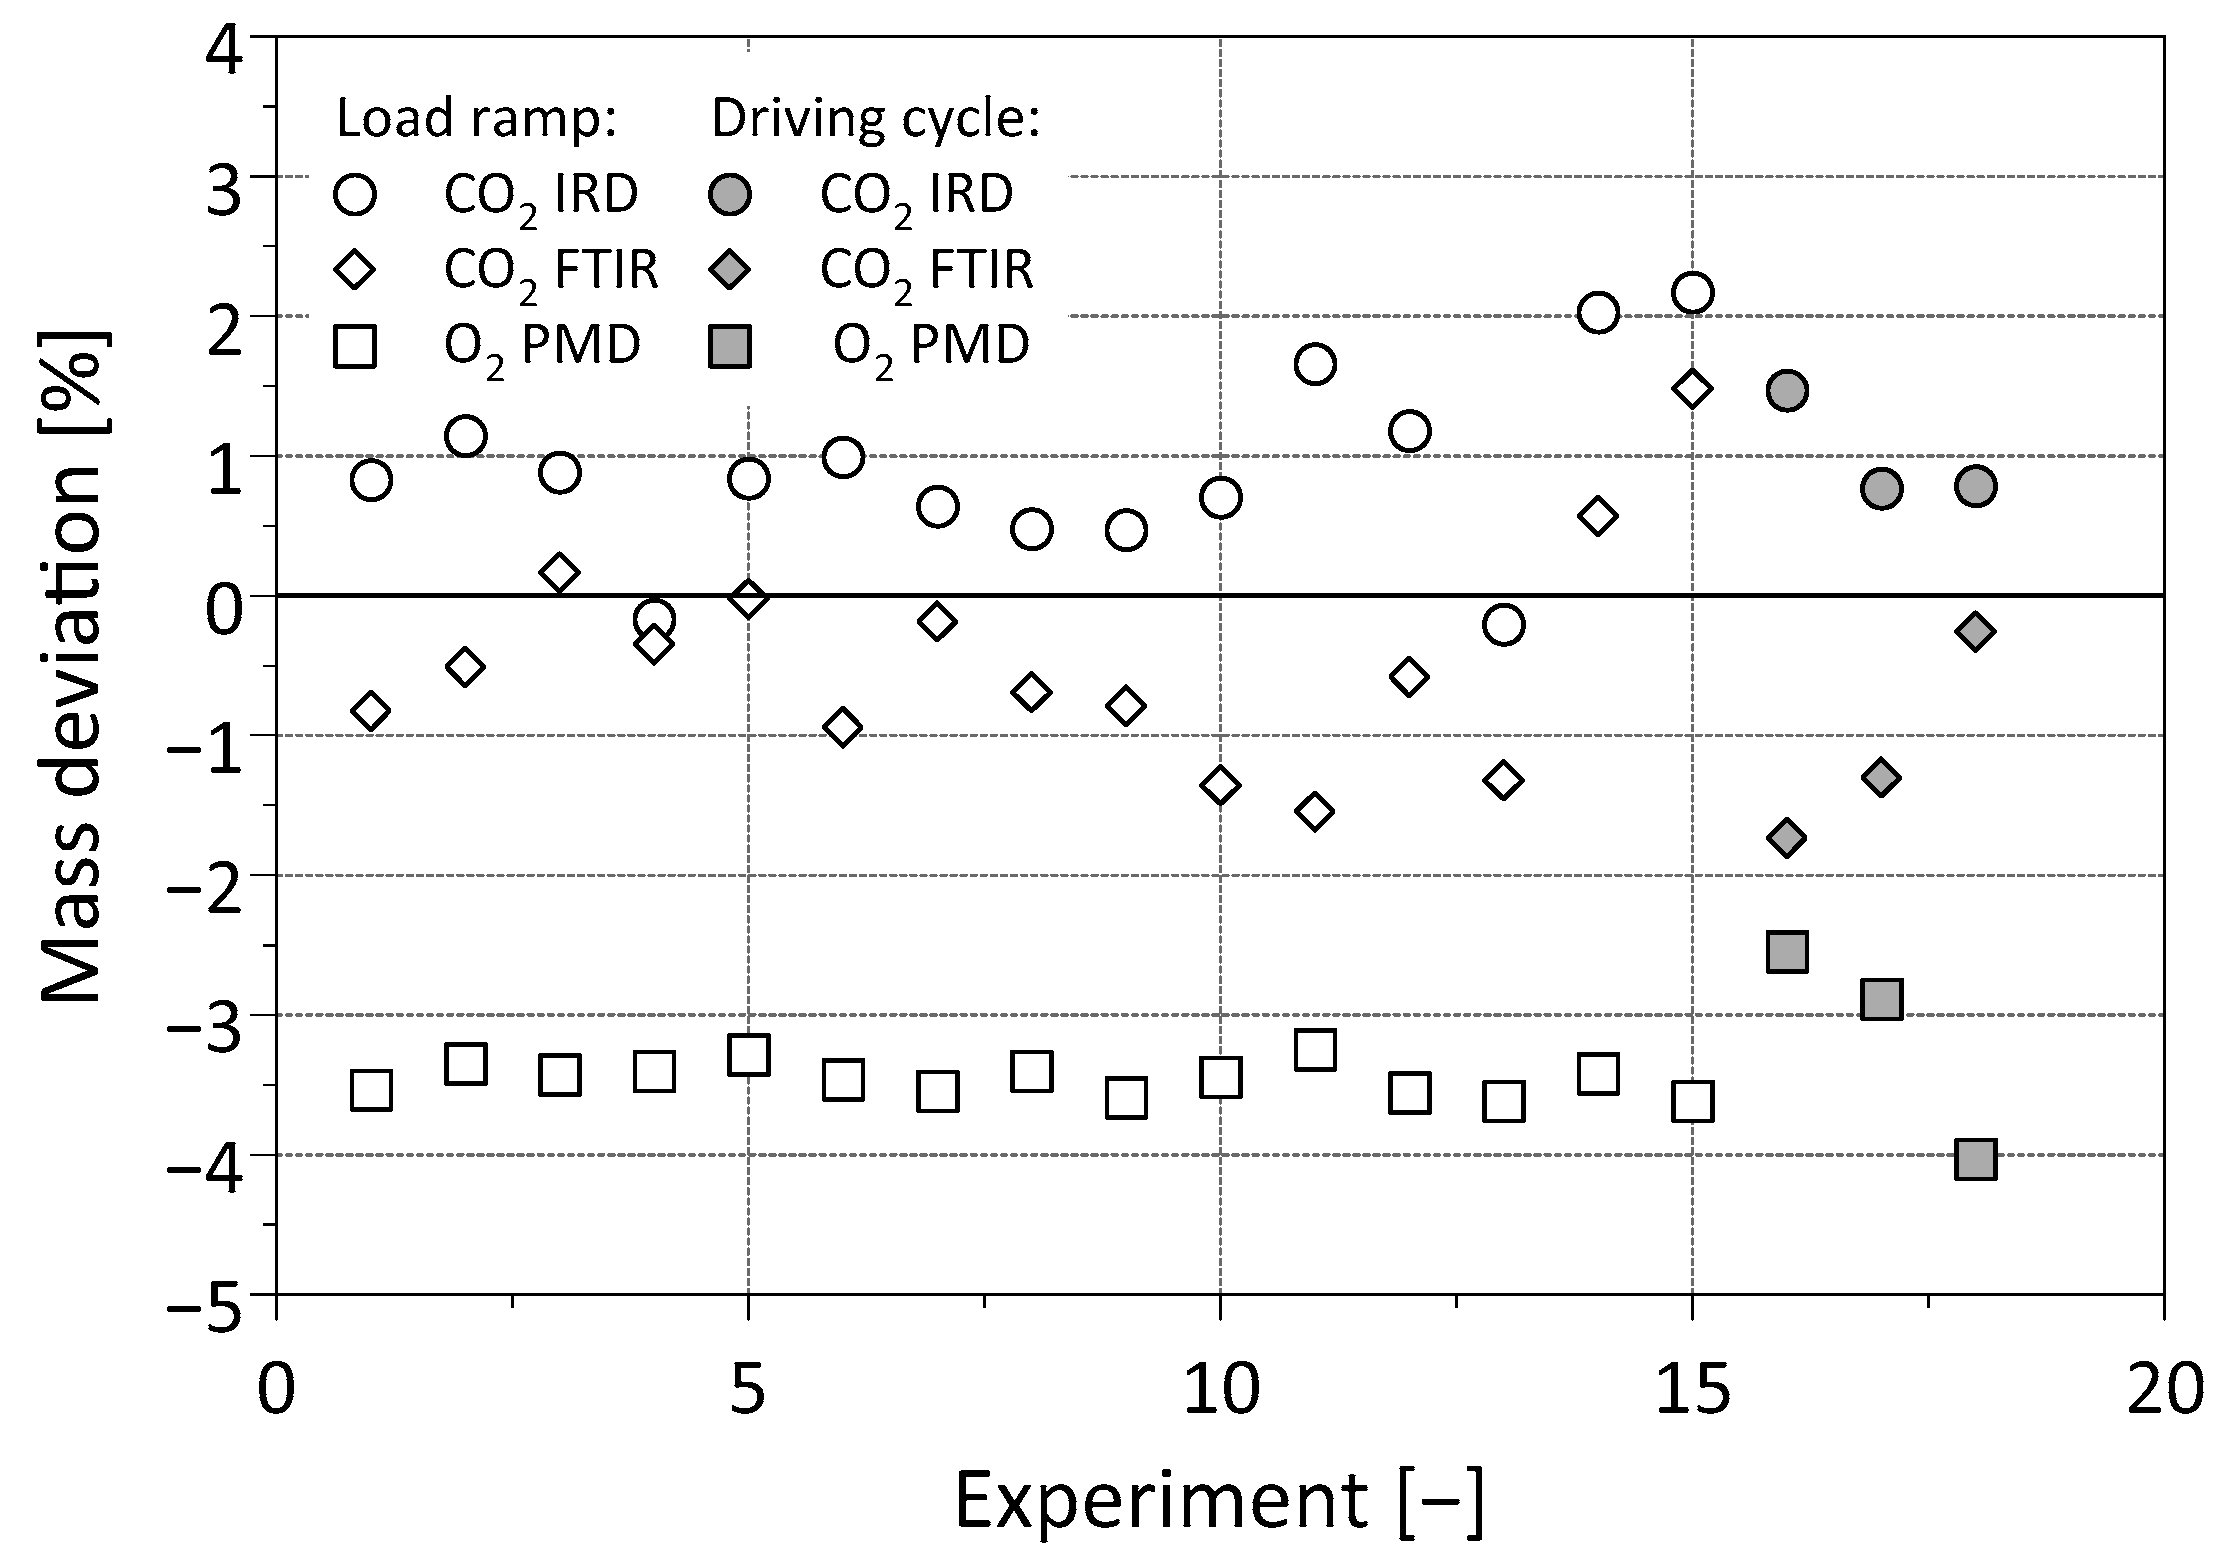
3.1.2. Fuel Cell Operation at Changing Loads

The previous results were all derived at steady-state fuel cell operation at constant current densities. To evaluate the suitability of the calculation model under dynamic fuel cell operation, load ramps and driving cycles were used. The load ramps started at the lowest current density of 0.04 A/cm2, were increased to 1.08 A/cm2, and were decreased again to 0.04 A/cm2, all with a current gradient of 1 A/s. Therefore, the whole operating range was covered by this load ramp, and due to the slow ramp speed, a compromise between steady-state and dynamic operation was found. Each of the two driving cycles had a duration of 45 min and represent the fuel cell system utilized during vehicle operation. The driving cycles are representative for the use of the fuel cell system as a range extender in an electric city bus. The gas mass balancing was performed for the whole load ramp and the total duration of the driving cycles.
The gas mass balancing during the load ramps in Figure 6 shows results comparable to those at a constant current density shown in Figure 4a,b and Figure 5. In the case of CO2 mass balancing, the mass deviation of the results is in the range of ±3%.
The O2 mass balancing results shown here are slightly better than those shown in Figure 4a, due to the previously described load point dependent influence of the PMD 2 analyzer. The load ramp covers the same range as the steady-state operation in Figure 5, resulting in an O2 mass balancing offset which falls roughly within the middle range of the results shown in Figure 5.
The results for the driving cycle evaluations in Figure 6 lie within the same range as all previously described results, indicating that the model can also be applied to dynamic fuel cell operation (up to a ramp speed of ±12 A/s during driving cycles) and can incorporate the current-dependent changes that occur under fuel cell operating conditions.

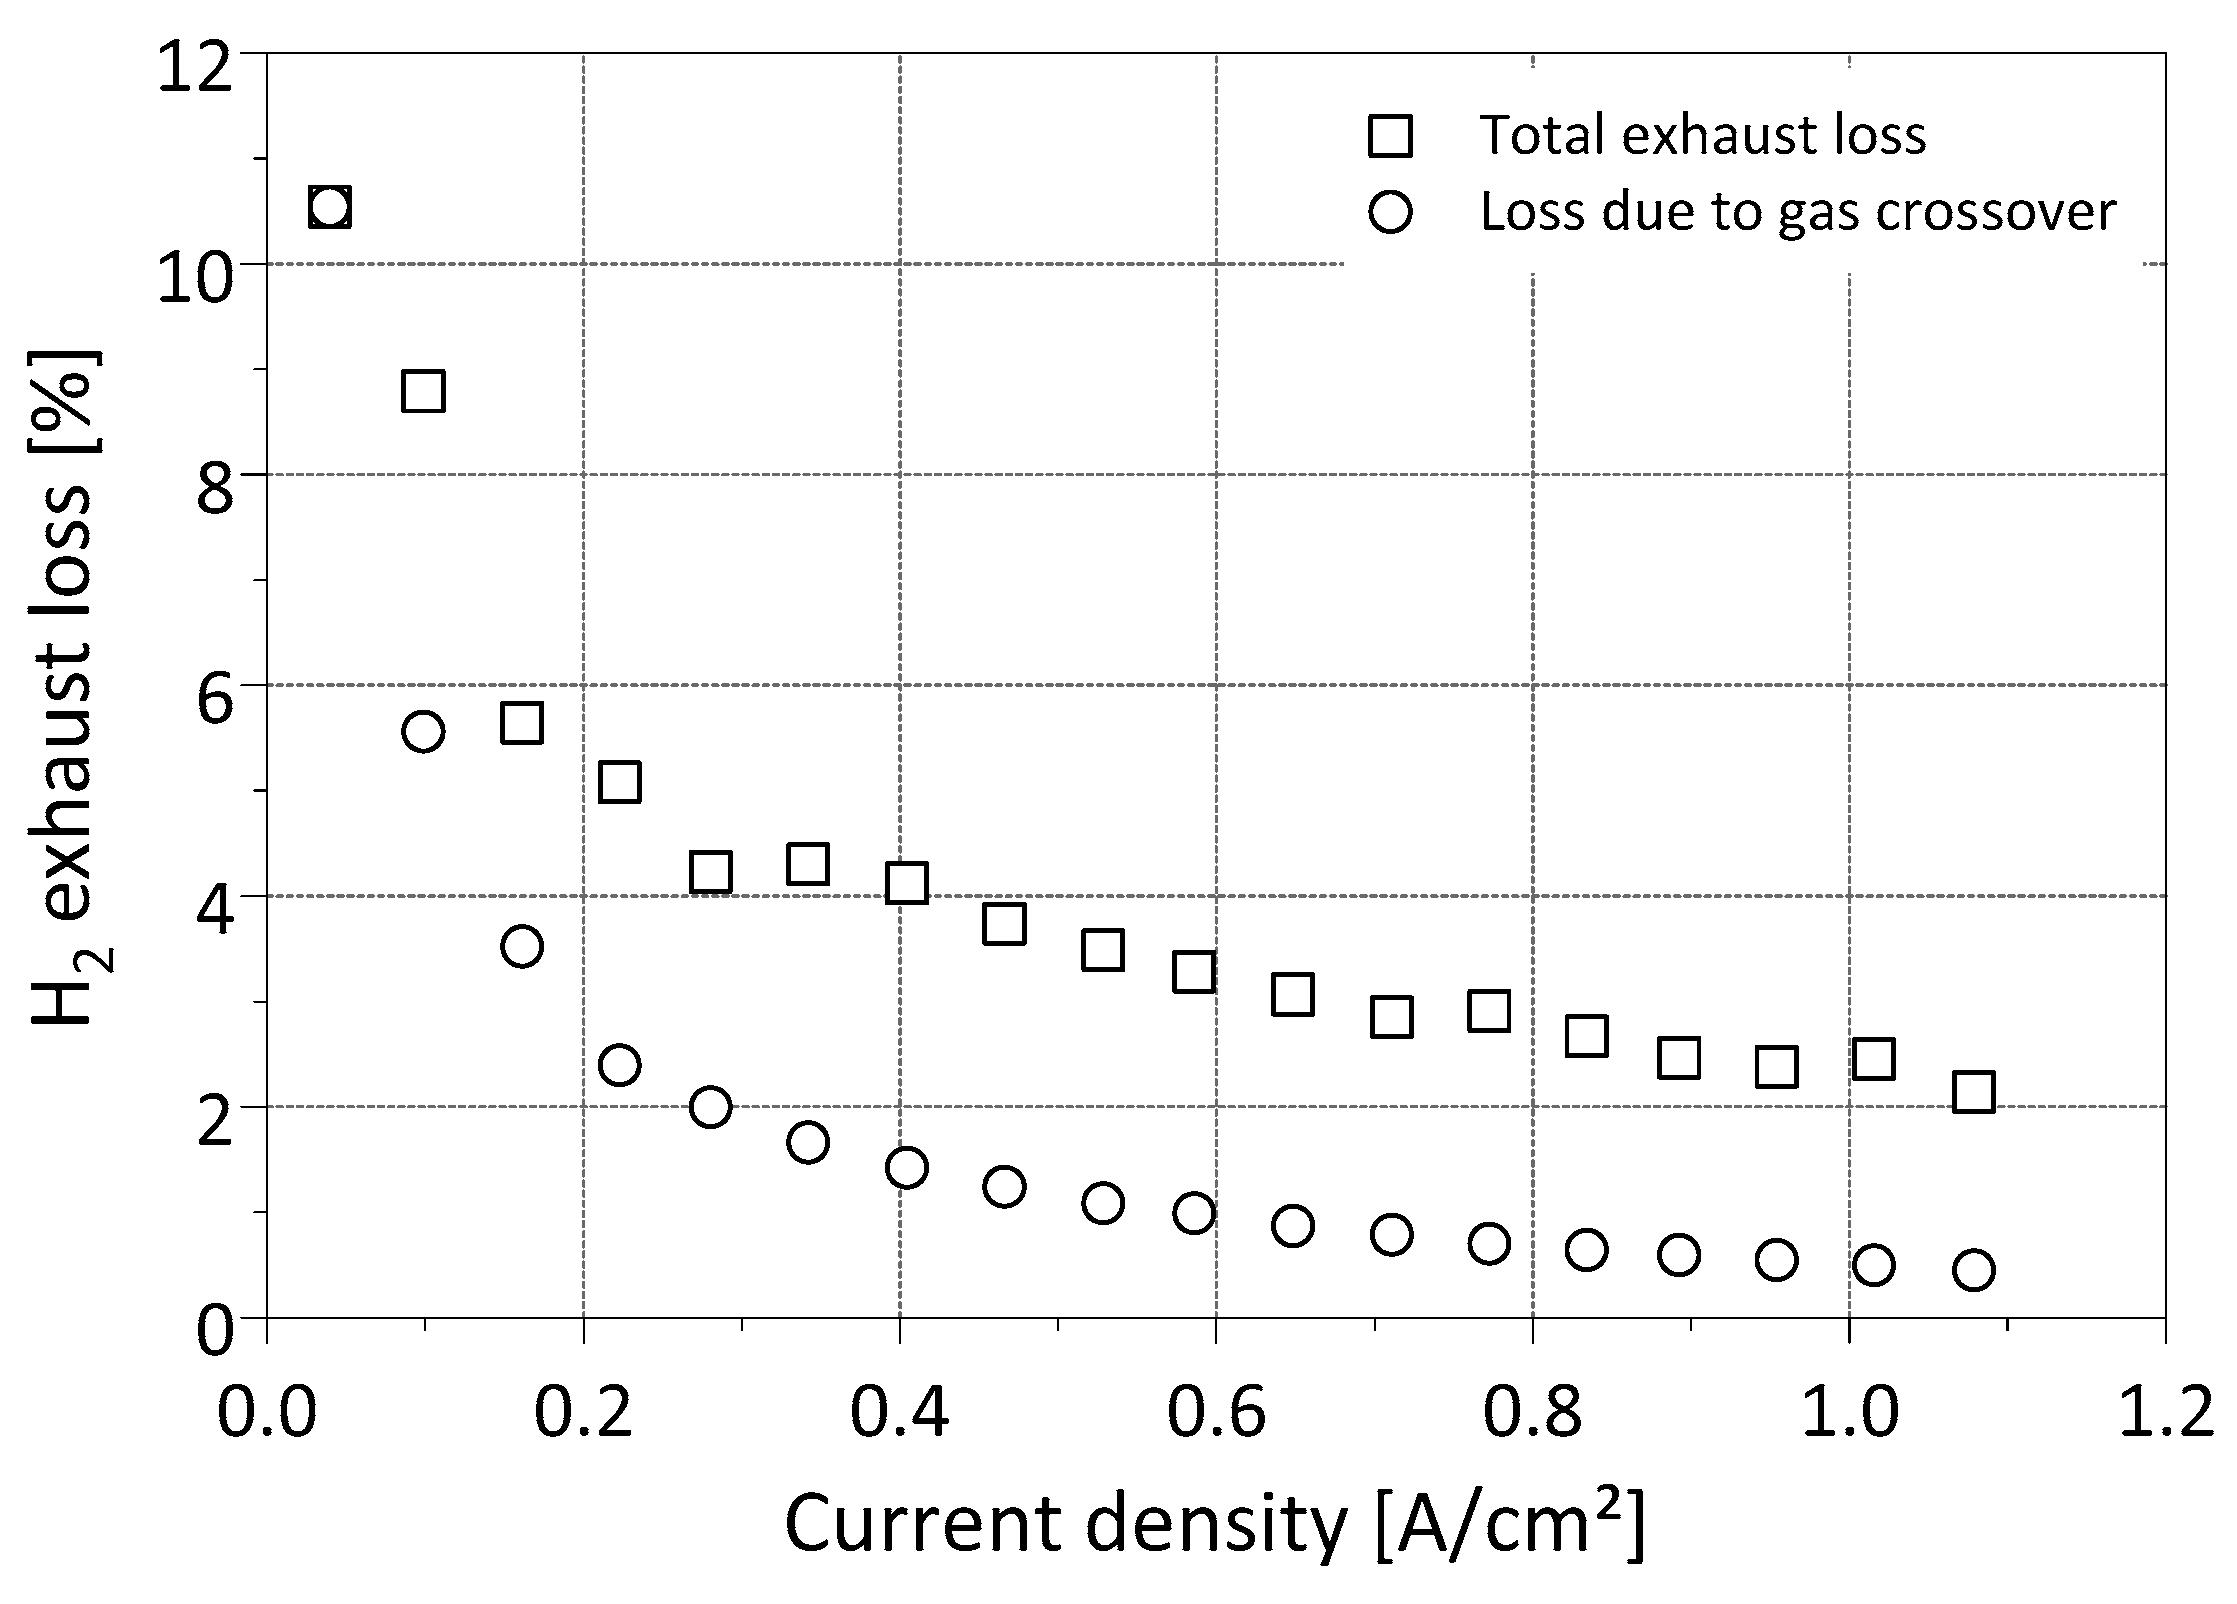
3.2. Exhaust Gas Investigation

The suitability of the presented mathematical models for fuel cell exhaust gas calculation was proved by the gas mass balancing evaluations. Based on these results, further aspects of the fuel cell exhaust gas are analyzed and discussed. The results in Figure 7a,b are derived from steady-state fuel cell operation at various current densities, held constant for ten minutes and based on the same data set as in Figure 5.
Figure 7a shows the calculated relative humidity at the cathode exhaust, based on Equation (16), including the measured relative humidity at the cathode inlet. Note that the tested fuel cell system had no external cathode gas humidification. Furthermore, the relative humidity values above 100% are fictitious, because the relative humidity can only reach a maximum of 100%. Nevertheless, the fictitious relative humidity values are used in this paper to illustrate the degree of oversaturation. At the two lowest current densities used in this evaluation, the cathode exhaust gas is not saturated, implying that the amount of water present under these conditions was not sufficient to fully saturate the gas stream. This also implies that the membrane was at risk of drying out at these operating points. As the current density increases, the cathode gas becomes saturated, and water in liquid state is transported out of the fuel cell as well. The relative humidity of the cathode exhaust decreases again at higher current densities and reaches values close to 100%. Although the amount of water generated at high current densities is high, the elevated gas temperatures allow the gas to uptake an increased amount of water vapor. Under these operating conditions, the thermal management of the fuel cell stack allows conditions to be avoided where the exhaust gas is not saturated and membrane dehydration could occur. Therefore, efficient stack and cathode air cooling are important aspects with regard to fuel cell durability, especially when using systems without external humidification.
The absolute humidity values shown in Figure 7b are calculated with Equation (13) and describe the ratio of water vapor and dry air mass flow, respectively. The determined values increase as the current density increases, showing that the amount of water vapor rises significantly in relation to the dry gas at the cathode exit. This supports the statement made based on Figure 7a, namely that the capacity of the exhaust gas to absorb water vapor is increased at higher current densities and the accompanying higher temperatures.
Figure 7b also shows the ratio of the cathode exhaust to inlet water vapor, which is the model-based calculated exhaust water vapor mass flow divided by the calculated inlet water vapor mass flow. This should underline the difference between the cathode inlet and exhaust gas compositions, showing that the exhaust water vapor mass flow is almost 20 times higher than the water vapor inlet mass flow.
An important aspect regarding fuel cell efficiency is the evaluation of H2 exhaust losses, which are caused by H2 crossover through the membrane from the anode to the cathode and by the anode purge and drain processes. In Figure 8, the losses caused by H2 crossover over the fuel cell current density operating range are described as a percentage of the total hydrogen consumption. The latter was measured with a Coriolis mass flow meter upstream of the fuel cell anode inlet, as depicted in Figure 1. Although the H2 mass flow in the cathode exhaust caused by H2 crossover does not change significantly over the current density range, the share of the loss based on the consumed hydrogen decreases and reaches levels well below 1% at higher current densities. The total H2 exhaust loss shown in Figure 8 is a sum of the anode purge and drain losses and the H2 crossover losses. The effect of the purge and drain becomes the predominant cause for H2 losses as the current density increases, since the purge and drain strategy is based on the ampere hours delivered by the stack.

3.3. Air Contaminant Experiments

3.3.1. NO Contamination

A fuel cell electric vehicle is exposed to air impurities when operating, including NO, which adsorbs onto the cathode platinum catalyst and causes a partly recoverable reduction in cell voltage. This effect was previously investigated at ITnA with the same fuel cell system and test bed setup, and the results were published in [18]. The exhaust gas calculation model presented in this paper can be used for such air impurity experiments with test beds, which can help researchers understand the adsorption and desorption processes that take place on the catalyst.
The gas mass balancing method was used to evaluate how much NO was exhausted as compared to the injected amount. For this evaluation, the gas absorption of NO was considered in the calculations. Figure 9 shows that, at low injected NO masses, only a small amount of NO is exhausted during the injection process, implying that most of the injected NO is adsorbed on the catalyst. When a certain amount of NO builds up in the fuel cell, the exhausted NO mass increases rapidly. This supports the findings cited in [18] that the catalyst becomes saturated once around 250 mg NO mass has been injected. The current densities and injection durations are not described in Figure 9, since the findings cited in [18] reveal the low influence of these parameters.

3.3.2. Mixed Gas Contamination

Following the NO injection experiments, one experiment was performed in which a gas mixture was injected into the cathode gas stream. This gas mixture is used for calibrating engine test bed gas analyzers at ITnA and consists of 500 ppm propane (C3H8, 99.95% purity), 500 ppm carbon monoxide (CO, 99.997% purity), 5% CO2 (99.995% purity), 150 ppm NO (99.5% purity), and N2 (99.999% purity) as the remainder. The injection was performed for 60 s at a constant 0.28 A/cm2 with the preconditioned fuel cell system, and the injection caused a stack-averaged cell voltage drop of at most 50 mV. The results for the gas mass balancing of the mixed gas injection experiment are listed in Table 2.
The CO2 gas mass balancing deviations are comparable with the previously presented results. The difference with regard to the O2 balancing is relatively high compared to the previous results, but still falls within an acceptable range. Unfortunately, propane was not measured in the cathode exhaust, making the mass balancing impossible. The results for the injected NO fit the observations made in Figure 9, showing that the low amount of injected NO is adsorbed onto the cathode catalyst, and none of it is exhausted. The same accounts for the injected amount of CO, where also no mass was exhausted. CO adsorbs onto the platinum catalyst, hindering the ORR and, therefore, causing a decrease in the cell voltage [11]. Therefore, the mass balancing results for CO are plausible, confirming that the presented calculation method and gas mass balancing approach can be used as a suitable tool in fuel cell research.

4. Conclusions

The results for gas mass balancing obtained in this study prove the suitability of the presented mathematical thermodynamic model for calculating the fuel cell exhaust gas mass flow and relative humidity. These findings also indicate that it is permissible to simplify the approach by treating the stack as a black box. The influence of the processes taking place inside the fuel cell stack were evaluated and discussed, such as membrane nitrogen and water diffusion and the presence of hydrogen on the cathode side. The membrane water diffusion was shown to have a negligible effect on the exhaust gas calculation results, but the H2 concentration at the cathode and the membrane nitrogen diffusion had an influence, which should be investigated in the future.
The base calculation model was further evaluated under steady-state and dynamic fuel cell operation conditions, confirming the suitability of the model under these operating conditions. Investigations regarding the relative humidity of the cathode exhaust gas revealed that the gas was not saturated at low current densities and that the humidity reached values close to saturation at the highest levels of current density in the experiments. The latter aspect highlights the importance of the stack thermal management, which influences the water vapor uptake capacity of the cathode gas and plays a role in preventing the membrane from drying out (e.g., at high loads).
An application area for the calculation model and the gas mass balancing could be shown by carrying out cathode gas contamination experiments. The results of the experiments with NO reveal the catalyst saturation above a certain amount of injected NO. Furthermore, the total adsorption of CO and NO onto the cathode catalyst could be shown during the injection of the gas mixture.
Although the resulting differences in gas mass balancing fall within a range of just a few percentage points, the current error of the presented calculation model might still be too high for dedicated carbon corrosion investigations, in which only small amounts of CO2 are expected in the cathode exhaust. It might be beneficial to use more dedicated gas measurement equipment designed for the concentrations expected under fuel cell operation rather than the standard engine test bed gas measurement equipment used in this study, as using this dedicated equipment may yield improved results and increased sensitivity.

Author Contributions

Conceptualization, validation, investigation, data curation and visualization, P.R.; Methodology and formal analysis, P.R., C.F. and S.B.; resources, S.B.; writing—original draft preparation, P.R.; writing—review and editing, C.F., S.B. and H.E.; supervision, project administration and funding acquisition, H.E. All authors have read and agreed to the published version of the manuscript.

Funding

This research was accomplished within the framework of the COMET Project HyTechonomy in the sub-project HyLife. HyTechonomy is a COMET Project within the COMET—Competence Centers for Excellent Technologies—Programme and funded by BMK, BMDW, Province of Styria, and Province of Upper Austria. The COMET Programme is managed by FFG (Austrian Research Promotion Agency). FFG grant number 882510.

Data Availability Statement

The data supporting the findings are included in the article. The raw data are not publicly available due to project confidentiality.

Acknowledgments

The authors thank the colleagues from HyCentA Research GmbH for their support. Supported by TU Graz Open Access Publishing Fund.

Conflicts of Interest

The authors declare no conflict of interest.

References

  1. Sharaf, O.Z.; Orhan, M.F. An overview of fuel cell technology: Fundamentals and applications. Renew. Sustain. Energy Rev. 2014, 32, 810–853. [Google Scholar] [CrossRef]
  2. Zhang, H.; Sun, C.; Ge, M. Review of the Research Status of Cost-Effective Zinc–Iron Redox Flow Batteries. Batteries 2022, 8, 202. [Google Scholar] [CrossRef]
  3. Aguilar, P.; Groß, B. Battery electric vehicles and fuel cell electric vehicles, an analysis of alternative powertrains as a mean to decarbonise the transport sector. Sustain. Energy Technol. Assess. 2022, 53, 102624. [Google Scholar] [CrossRef]
  4. Zhao, J.; Li, X. A review of polymer electrolyte membrane fuel cell durability for vehicular applications: Degradation modes and experimental techniques. Energy Convers. Manag. 2019, 199, 112022. [Google Scholar] [CrossRef]
  5. Abdin, Z.; Webb, C.J.; Gray, E.M. PEM fuel cell model and simulation in Matlab–Simulink based on physical parameters. Energy 2016, 116, 1131–1144. [Google Scholar] [CrossRef]
  6. Migliardini, F.; Unich, A.; Corbo, P. Experimental comparison between external and internal humidification in proton exchange membrane fuel cells for road vehicles. Int. J. Hydrogen Energy 2015, 40, 5916–5927. [Google Scholar] [CrossRef]
  7. Kong, I.M.; Jung, A.; Kim, B.J.; Baik, K.D.; Kim, M.S. Experimental study on the start-up with dry gases from normal cell temperatures in self-humidified proton exchange membrane fuel cells. Energy 2015, 93, 57–66. [Google Scholar] [CrossRef]
  8. Pan, M.; Pan, C.; Li, C.; Zhao, J. A review of membranes in proton exchange membrane fuel cells: Transport phenomena, performance and durability. Renew. Sustain. Energy Rev. 2021, 141, 110771. [Google Scholar] [CrossRef]
  9. Prokop, M.; Drakselova, M.; Bouzek, K. Review of the experimental study and prediction of Pt-based catalyst degradation during PEM fuel cell operation. Curr. Opin. Electrochem. 2020, 20, 20–27. [Google Scholar] [CrossRef]
  10. Zhao, J.; Tu, Z.; Chan, S.H. Carbon corrosion mechanism and mitigation strategies in a proton exchange membrane fuel cell (PEMFC): A review. J. Power Sources 2021, 488, 229434. [Google Scholar] [CrossRef]
  11. Cheng, X.; Shi, Z.; Glass, N.; Zhang, L.; Zhang, J.; Song, D.; Liu, Z.-S.; Wang, H.; Shen, J. A review of PEM hydrogen fuel cell contamination: Impacts, mechanisms, and mitigation. J. Power Sources 2007, 165, 739–756. [Google Scholar] [CrossRef]
  12. Werner, C.; Busemeyer, L.; Kallo, J. The impact of operating parameters and system architecture on the water management of a multifunctional PEMFC system. Int. J. Hydrogen Energy 2015, 40, 11595–11603. [Google Scholar] [CrossRef]
  13. Becker, F.; Pillath, F.; Kallo, J. Cathode Exhaust Gas Recirculation for Polymer Electrolyte Fuel Cell Stack. Fuel Cells 2018, 18, 568–575. [Google Scholar] [CrossRef]
  14. Rodosik, S.; Poirot-Crouvezier, J.-P.; Bultel, Y. Impact of humidification by cathode exhaust gases recirculation on a PEMFC system for automotive applications. Int. J. Hydrogen Energy 2019, 44, 12802–12817. [Google Scholar] [CrossRef]
  15. Schultze, M.; Horn, J. Optimization Approach for Cathode Exhaust Gas Conditioning of a Multifunctional PEM Fuel Cell System for the Application in Aircraft; Deutsche Gesellschaft für Luft-und Raumfahrt-Lilienthal-Oberth eV: Bonn, Germany, 2012. [Google Scholar]
  16. Schultze, M.; Horn, J. Modeling, state estimation and nonlinear model predictive control of cathode exhaust gas mass flow for PEM fuel cells. Control Eng. Pract. 2016, 49, 76–86. [Google Scholar] [CrossRef]
  17. Kuroda, E.; Yano, M. An Oxygen Balance Method: Fuel Consumption Measurement for Fuel Cell Vehicles based on Exhaust Emissions with No Vehicle Modification. Adv. Automob. Eng. 2016, 5, 1000152. [Google Scholar] [CrossRef]
  18. Reithuber, P.; Poimer, F.; Brandstätter, S.; Schutting, E.; Buchberger, S.; Trattner, A.; Eichlseder, H. Experimental Investigation of the Influence of NO on a PEM Fuel Cell System and Voltage Recovery Strategies. Energies 2023, 16, 3720. [Google Scholar] [CrossRef]
  19. Wiegleb, G. Gasmesstechnik in Theorie und Praxis: Messgeräte, Sensoren, Anwendungen, 2nd ed.; Korrigierte und Durchgesehene Auflage; Springer eBook Collection; Springer Vieweg: Wiesbaden, Germany, 2022. [Google Scholar]
  20. Karimäki, H.; Pérez, L.; Nikiforow, K.; Keränen, T.; Viitakangas, J.; Ihonen, J. The use of on-line hydrogen sensor for studying inert gas effects and nitrogen crossover in PEMFC system. Int. J. Hydrogen Energy 2011, 36, 10179–10187. [Google Scholar] [CrossRef]
  21. Sander, R. Compilation of Henry’s law constants (version 4.0) for water as solvent. Atmos. Chem. Phys. 2015, 15, 4399–4981. [Google Scholar] [CrossRef]
  22. St-Pierre, J.; Zhai, Y.; Angelo, M.S. Effect of Selected Airborne Contaminants on PEMFC Performance. J. Electrochem. Soc. 2014, 161, F280–F290. [Google Scholar] [CrossRef]
  23. Kurnia, J.C.; Sasmito, A.P.; Shamim, T. Advances in proton exchange membrane fuel cell with dead-end anode operation: A review. Appl. Energy 2019, 252, 113416. [Google Scholar] [CrossRef]
Figure 1. Schematic depiction of the fuel cell system test bed setup, illustrating the components relevant for this research.
Energies 16 06057 g001
Figure 2. System and parameter overview of the fuel cell cathode side.
Energies 16 06057 g002
Figure 3. Dry-to-wet gas measurement correction factor for the gas concentrations at the fuel cell cathode inlet (FTIR 1, PMD 1) and in the exhaust (FTIR 2, PMD 2, IRD) and for the H2 sensor (HSense).
Energies 16 06057 g003
Figure 4. (a) CO2 and O2 gas mass balancing at constant current density; (b) comparison of the different mathematical models at constant current density based on CO2 measurements.
Energies 16 06057 g004
Figure 5. Cathode gas mass balancing at various current densities at steady-state operation.
Energies 16 06057 g005
Figure 6. Gas mass balancing at load ramps and driving cycles.
Energies 16 06057 g006
Figure 7. (a) Measured relative humidity at the cathode inlet and calculated values for the cathode exhaust—values above 100% are fictious. (b) Calculated absolute humidity at the cathode inlet and exhaust and calculated ratio of exhaust to inlet water vapor mass.
Energies 16 06057 g007
Figure 8. Percentage of hydrogen exhaust loss based on the total hydrogen consumption at different current densities: Total loss including anode purge and drain losses and the losses caused by hydrogen crossover from the anode to the cathode.
Energies 16 06057 g008
Figure 9. Exhausted NO mass over the injected NO mass during experiments.
Energies 16 06057 g009
Table 1. List of the investigated mathematical models and their modifications.
Model IndexModification
Model-ABase and reference model
Model-BModel considering the H2 concentration at the cathode, also in the calculation of the exhaust humid air
Model-CModel including the water diffusion through the membrane
Model-DModel considering the N2 diffusion to the anode, resulting in a reduced N2 concentration at the cathode
Model-EA combination of Model-A, -B, -C, and -D
Table 2. Results for the cathode inlet and exhaust gas mass balancing during the mixed gas injection experiment.
O2 [g]CO2 [mg]CO [mg]C3H8 [mg]NO [mg]
At cathode inlet139.06319017285
Consumed65.77----
Exhausted62.2631270n/a0
Difference−11.03 (−7.93%)−63 (−2%)−17 (−100%)n/a−5 (−100%)
Disclaimer/Publisher’s Note: The statements, opinions and data contained in all publications are solely those of the individual author(s) and contributor(s) and not of MDPI and/or the editor(s). MDPI and/or the editor(s) disclaim responsibility for any injury to people or property resulting from any ideas, methods, instructions or products referred to in the content.

