You are currently on the new version of our website. Access the old version .
EnergiesEnergies
  • Article
  • Open Access

18 August 2023

Assessing Machine Learning Techniques for Intrusion Detection in Cyber-Physical Systems

,
,
,
and
1
Instituto de Computação, Universidade Federal Fluminense, Niteroi 24210-346, Brazil
2
ISEL—Instituto Superior de Engenharia de Lisboa, Instituto Politécnico de Lisboa, 1549-020 Lisboa, Portugal
3
Campus Alegrete, Universidade Federal do Pampa, Bagé 96460-000, Brazil
4
Faculdade de Computação (FACOM), Universidade Federal de Uberlândia, Uberlândia 38400-902, Brazil
This article belongs to the Special Issue Machine Learning and Data Mining Applications in Power and Multi-Energy Systems

Abstract

Cyber-physical systems (CPS) are vital to key infrastructures such as Smart Grids and water treatment, and are increasingly vulnerable to a broad spectrum of evolving attacks. Whereas traditional security mechanisms, such as encryption and firewalls, are often inadequate for CPS architectures, the implementation of Intrusion Detection Systems (IDS) tailored for CPS has become an essential strategy for securing them. In this context, it is worth noting the difference between traditional offline Machine Learning (ML) techniques and understanding how they perform under different IDS applications. To answer these questions, this article presents a novel comparison of five offline and three online ML algorithms for intrusion detection using seven CPS-specific datasets, revealing that offline ML is superior when attack signatures are present without time constraints, while online techniques offer a quicker response to new attacks. The findings provide a pathway for enhancing CPS security through a balanced and effective combination of ML techniques.

1. Introduction

Cyber-physical systems (CPSs) integrate sensing, processing, communication, actuation, and control through networks and physical devices [1,2]. CPSs are subject to diverse attacks that can affect different aspects of human life [3], particularly public infrastructures such as Smart Grids (SG), water treatment, and pipeline gas. CPSs are typically organized in three architectural layers: perception, transmission, and application [1]. The perception layer comprises sensor and actuator devices at the network’s edge, exchanging data with the application layer through the intermediary transmission layer. Due to their resource constraints, perception layer devices are the most vulnerable to attacks [4,5].
As an example of CPS vulnerability, one of the most harmful attacks was performed by the Stuxnet malware that crippled Iran’s Nuclear Program in 2010 [6]; it was designed to attack the Supervisory Control And Data Acquisition (SCADA) system used to control Iranian uranium enrichment centrifuges. Another example is the 2015 blackEnergy cyberattack that disrupted Ukraine’s electricity service, impacting approximately 225,000 users.
The primary security mechanisms to protect CPSs devices from external attacks rely on encryption, firewalls, and antivirus systems. However, these mechanisms cannot avoid all attacks, especially considering that attackers are constantly evolving their strategies. In this context, using Intrusion Detection Systems (IDS) is fundamental for detecting malicious behavior and defending the CPSs from threats. IDSs may employ Machine Learning (ML) techniques to detect malicious activities by relying on training datasets [7,8,9]. However, many studies in the literature still use datasets collected from general internet protocols [5,10,11,12,13]. These datasets are not suitable for intrusion detection in CPSs, as they have little relationship with the actual existing equipment and lack traffic from typical CPS protocols.
The traditional offline ML techniques do not have their models frequently updated when behavior shifts occur. Today, with the increasing emergence of Big Data systems producing a huge volume of heterogeneous data and the tendency to take data processing to the network nodes [14], there is a need to classify attacks in real time from a large flow of data without compromising the hardware resources, such as memory and CPU. Therefore, traditional offline ML techniques may not be suitable for processing events from large data streams. On the other hand, the state-of-art techniques that support online learning processing (online ML) are still not extensively studied. To the best of our knowledge, no prior work has presented a comparison between offline and online ML techniques for intrusion detection in CPS scenarios.
This work presents an assessment of popular ML algorithms for IDSs, covering both online and offline learning techniques under CPS scenarios. Our main contributions are:
  • Assessment of five offline and three online ML algorithms for intrusion detection using traffic from seven datasets related to CPSs;
  • Survey of CPSs datasets. The seven most promising datasets are used for the experiments with the ML algorithms, and numerical results are presented for each of them;
  • Evidence, based on accuracy, precision, recall, and F1-score results, that offline ML is most suitable when attack signatures are available without time constraints;
  • Evidence that online techniques present a greater ability to quickly detect new attacks.
The rest of this work is organized as follows. Section 2 explains the background knowledge needed for this work. Section 3 presents the related work. Section 4 discusses intrusion detection datasets for CPS. Section 5 describes the methodology used in our evaluation. Section 6 describes our experiment with online and offline ML. Finally, Section 7 presents our conclusions and future work.

2. Background

In this section, we describe, for the non-expert, the difference between online and offline ML, as well as briefly describe how they work. We also describe the parameters that can be used in these techniques, the classifiers considered, and the metrics.
Offline and online ML have different main characteristics, which offer advantages depending on the application. In offline ML, the model is trained and tested on a fixed dataset, which must be available ahead of time. Additionally, offline ML typically requires longer training time as it involves processing the entire dataset ahead of time, which can be resource-intensive, often requiring substantial computational resources to train and test the model on large fixed datasets.
One of the disadvantages of offline ML is the lack of ability to detect Concept Drift, a statistical distribution change in the variables or input attributes over time. In other words, the relationship between the attributes and the classes may evolve, making the model trained on old data less accurate or even invalid for making predictions on new data.
On the other hand, online ML creates the model incrementally, updating the model as new data arrive. It operates with immediate responses able to adapt to evolving patterns or changes in the process [15] with the use of change detectors. The model is designed to provide predictions or actions based on the incoming data, facilitating quick decision-making. So, the online ML technique is used to continuously monitor sensor data, identify anomalies, predict failures, and make real-time adjustments to optimize the CPS process. Additionally, it can be more resource-efficient as it learns and trains from streaming data indefinitely without compromising memory or process [16].
An online ML architecture is given in Figure 1: the classification process, which is divided into two stages [15], the loss function, and change detector with the warning or drift flag:
Figure 1. Outline of the online ML with prediction loss function and change detector.
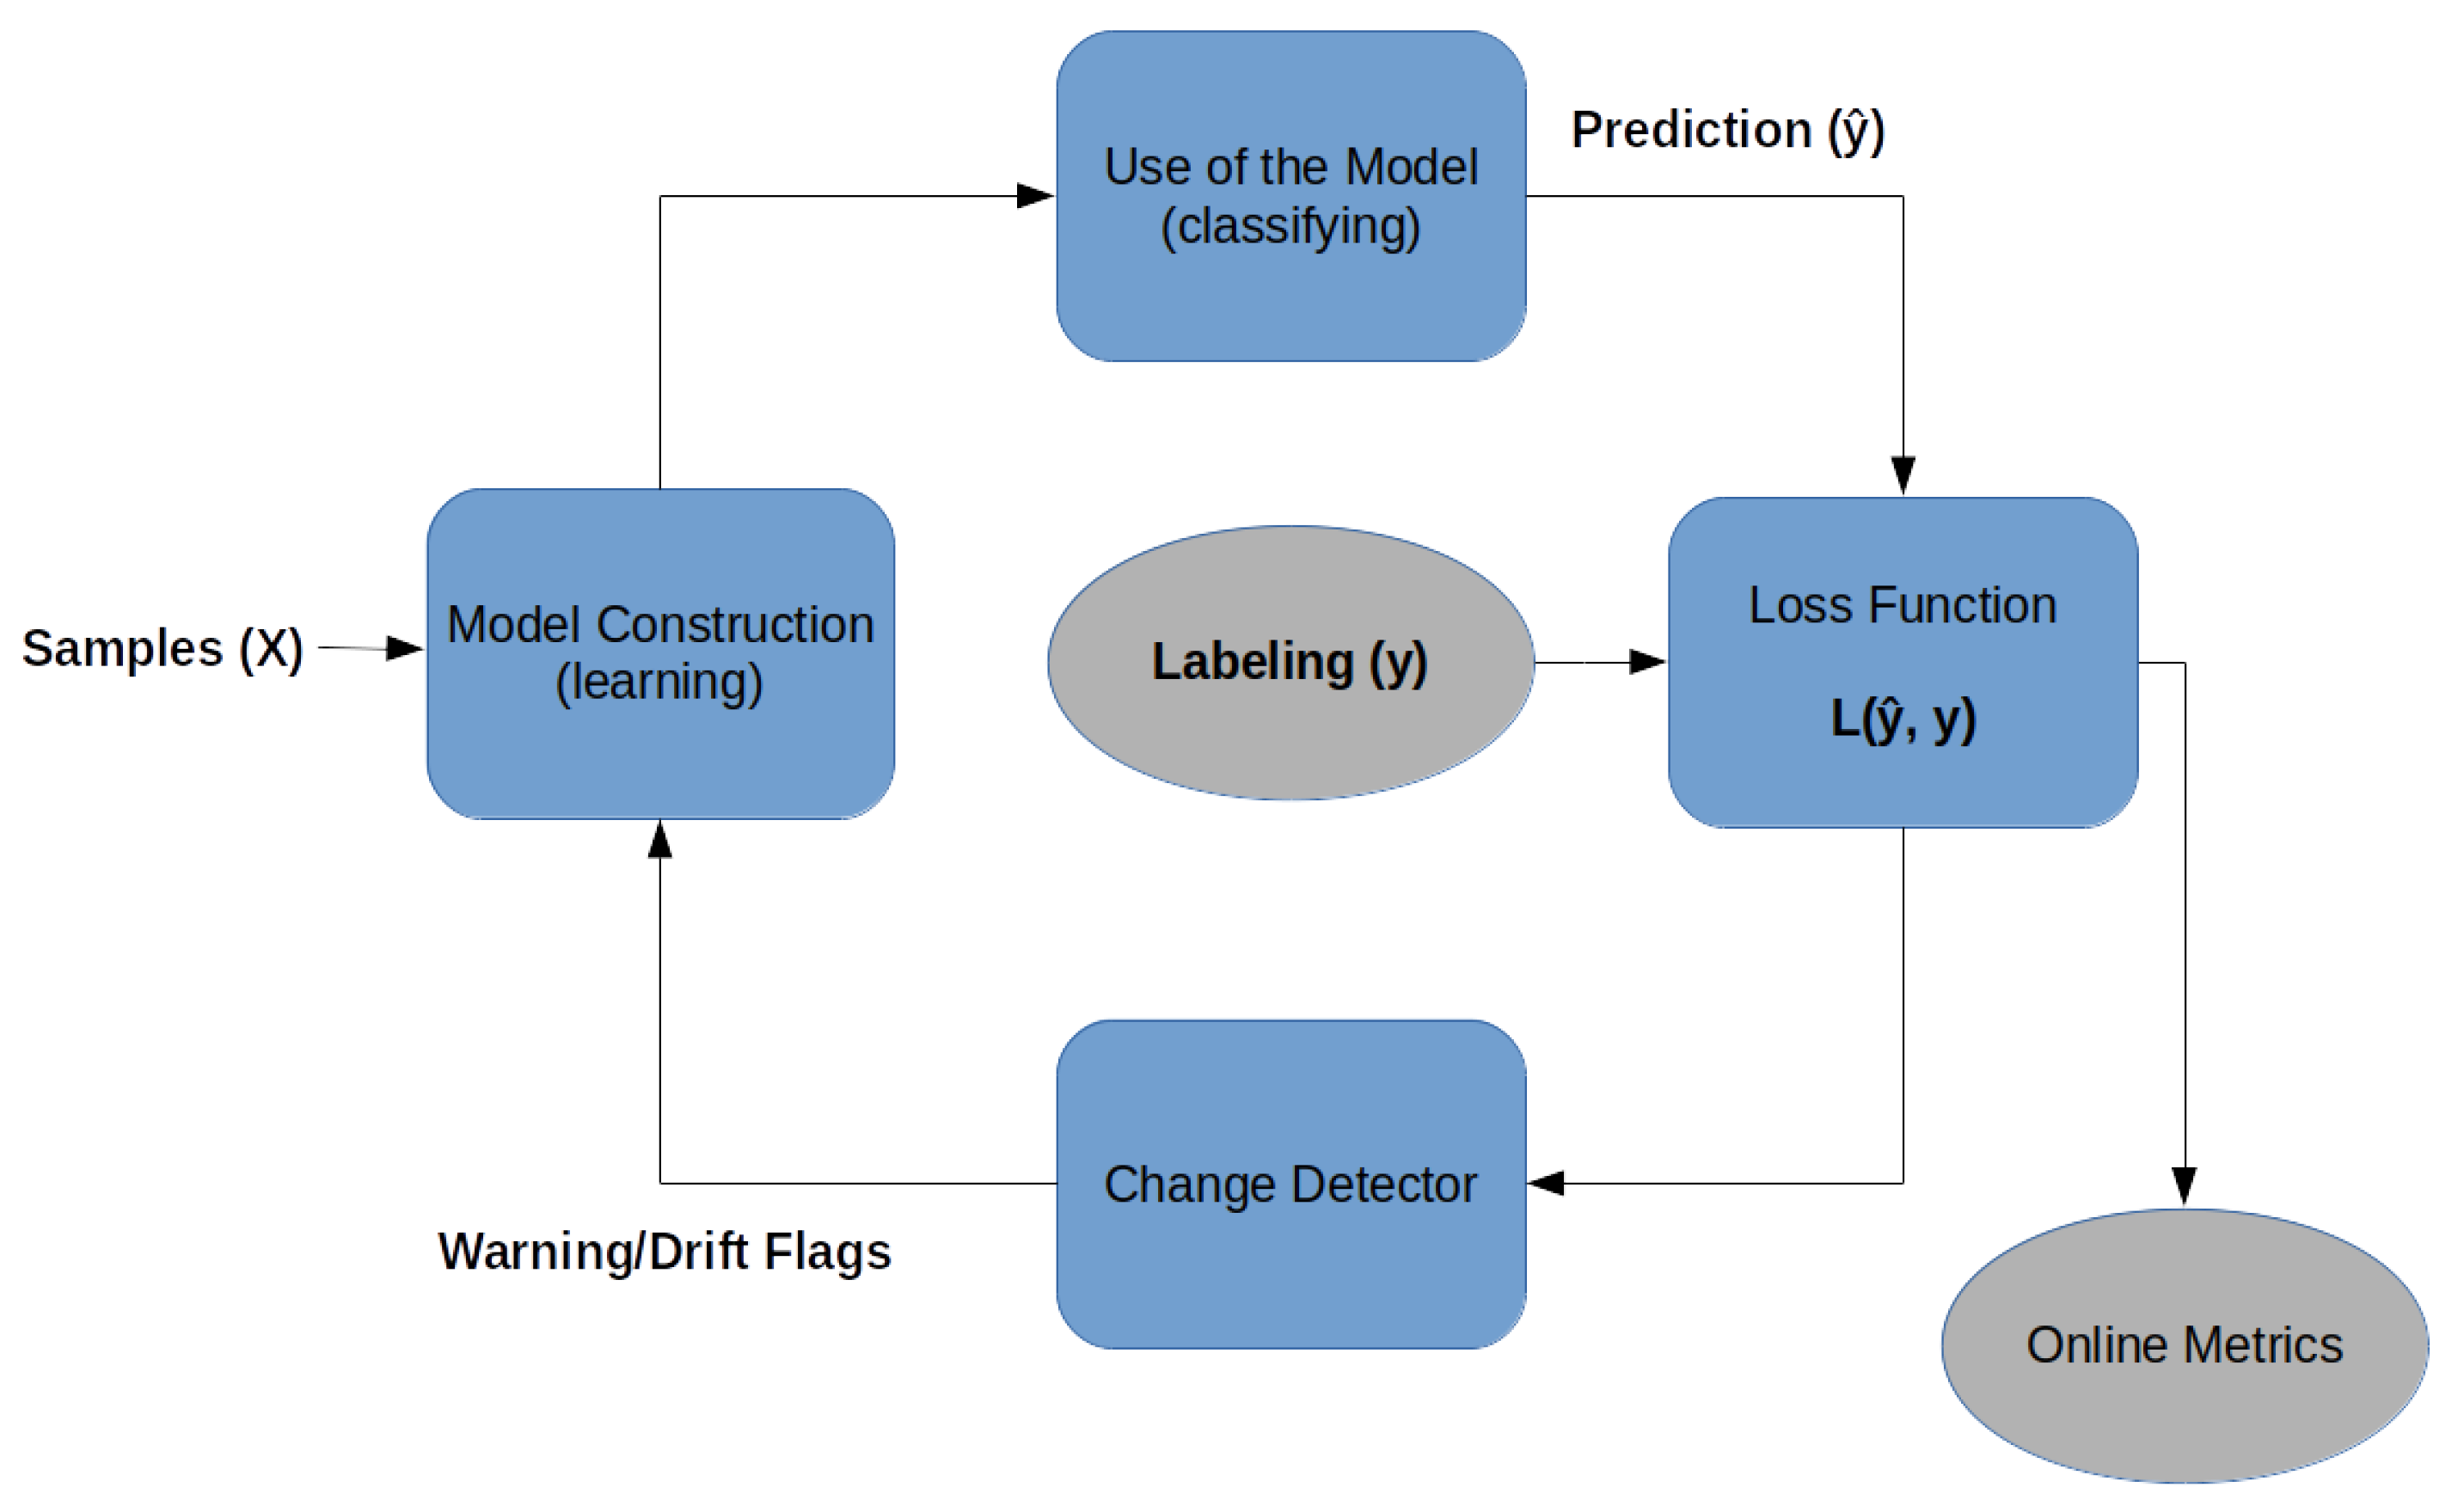
  • Online model construction (learning): each new sample is used to build the model to determine the class with the attributes and values. This model can be represented by classification rules, decision trees, or mathematical formulas. To control the amount of memory used by the model, a forgetting mechanism is used, like a sliding window or fading factor, that discards samples while keeping an aggregate summary/value of these older samples;
  • Use of the model (classifying): it is the classification or estimation of unknown samples using the constructed model. In this step, the model’s performance metrics are also calculated, comparing the known label of the sample y with the classified result of the model (i.e., the predicted label ( y ^ )), for a supervised classification process.
  • Loss function: for each input sample attributes (X), the prediction loss can be estimated as L ( y ^ , y ) . The performance metrics of this method are obtained from the cumulative sum of sequential loss over time, that is, the loss function between forecasts and observed values.
  • Change detector: detects concept drift by monitoring the loss estimation. When change is detected based on a predefined threshold, the warning signal or drift signal is used to retrain the model [17]. Interestingly, as will be shown below, no concept drift was detected in any of the datasets used in this article.
The evaluation of classical learning methods that use finite sets of data, such as cross-validation and training/test techniques, are not appropriate for data streams due to the unrestricted dataset size and the non-stationary independent samples. Two alternatives are more usual for data stream [18]:
  • Holdout: applies tests and training samples to the classification model at regular time intervals (configurable by the user);
  • Prequential: all samples are tested (prediction) and then used for training (learning).
The most suitable methodology for online ML models dealing with concept drift is the prequential method [18,19]. It combines the predictive and sequential aspects with memory window mechanisms, which maintain an aggregated summary of recent samples while discarding older ones in order to process new samples. This approach is based on the notion that statistical inference aims to make sequential probability predictions for future observations, rather than conveying information about past observations.
In online supervised ML the data-predicting process can be conducted in real time through the forecast model (Figure 1) to identify anomalies or failures in an industrial process. The labeling process is provided from CPS sensors after an additional delay. For example, consider a smart grid system where sensors continuously monitor power generation and distribution. In the absence of labeled data in real time, data prediction is crucial to detect anomalies or failures in the grid, thereby alerting operators to potential issues. By employing the labeling from the sensors after a delay, the system can analyze the loss and make corrections to the prediction model. The datasets presented in this article already include their respective classification labels, thereby enabling the use of supervised approaches for both online and offline algorithms.
The following online data stream classifiers will be used in this article because they were the most used in the studied references [20,21]:
  • Naive Bayes (NB) is a probabilistic classifier, also called simple Bayes classifier or independent Bayes classifier, capable of predicting and diagnosing problems through noise-robust probability assumptions;
  • Hoeffding Tree (HT) combines the data into a tree while the model is built (learning) incrementally. Classification can occur at any time;
  • Hoeffding Adaptive Tree (HAT) adds two elements to the HT algorithm: change detector and loss estimator, yielding a new method capable of dealing with concept change. The main advantage of this method is that it does not need to know the speed of change in the data stream.
For the offline ML, we selected five popular classifiers from the literature [16]:
  • Naive Bayes (NB) is available for both online and offline ML versions, making it possible to compare them;
  • Random Tree (RaT) builds a tree consisting of K randomly chosen attributes at each node;
  • J48 builds a decision tree by recursively partitioning the data based on attribute values, it quantifies the randomness of the class distribution within a node (also known as entropy), to define the nodes of the tree;
  • REPTree (ReT) consists of a fast decision tree learning algorithm that, similarly to J48, is also based on entropy;
  • Random Forest (RF) combines the prediction of several independent decision trees to perform classification. Each tree is constructed to process diverse training datasets, multiple subsets of the original training data. The trees are built by randomly chosen attributes used to divide the data based on the reduction in entropy. The results of all trees are aggregated to decide on the final class based on majority or average, across all trees.
Four traditional ML metrics (overall accuracy (Acc); precision (P); recall (R); and F1-score) [1] will be used in this article to evaluate the performance of the classification based on the numbers of true positive (TP), true negative (TN), false positive (FP), and false negative (FN). Those metrics are defined as follows [16,22]:
A c c u r a c y = T P + T N T P + T N + F P + F N
P r e c i s i o n = T P T P + F P
R e c a l l = T P T P + F N
F 1 S c o r e = 2 × P r e c i s i o n × R e c a l l P r e c i s i o n + R e c a l l
In Equation (4), the formula of F1-score has values between 0 and 1. Therefore, we chose to show the F1-score in the graphs as a percentage, along other percentage metrics.

5. Material and Methods

We employ the Waikato Environment for Knowledge Analysis (WEKA) framework for offline ML experiments [37]. We selected 5 popular classifier algorithms (Section 2), however, for conciseness, in the remainder of this paper, only the results of the best and worst performing classifiers in terms of F1-score are included in the graphs. The best and worst classifiers in F1-score for each dataset are shown in Table 3.
Table 3. The best and worst offline ML classifiers in terms of F1-score.
To analyze online ML techniques we employ the Massive Online Analysis (MOA) framework, an environment that includes techniques for online learning from evolving data streams and scaling up the implementation of techniques to real-world dataset sizes [19]. We selected 3 classifier algorithms (Section 2): the Naive Bayes because is available on both online and offline ML techniques; the Hoeffding Tree because of its vast use in the literature (described in Section 3); and the Hoeffding Adaptive Tree which is an evolution of the HT with better metrics. All of the online ML were executed within the prequential method, so the time spent on training and testing can not be divided.
The classification metrics for all online and offline classifiers were (Figure 2) accuracy, precision, recall, and F1-score. The data regarding CPU time and consumed memory are collected at the end of the processing of the entire dataset. Both online and offline techniques are assessed with binary classification, that is, classify only whether the sample belongs to the normal class or any attack class (without identifying the attack class specifically).
Figure 2. Methodology used in our evaluation of offline and online ML methods.
All experiments were performed on a computer with eight 2.80 GHz CPU cores and 32 GB of RAM. Based on the literature [22], the offline classifiers were executed with a 50/50 split between training and testing. This parameter does not apply to online techniques. Figure 2 shows the methodology for the experiments with both online and offline techniques. Similar to many other studies on applications of ML techniques, a single split test was used, and the statistical significance of our methodology relies on the large size of each dataset and not on repeating the experiments with different seeds.

6. Results and Discussion

The experiments described in this section aim to compare the online and offline ML techniques for IDS using CPS datasets described in Section 4 based on the metrics and classifiers listed in Section 2, following the methodology presented in Section 5. This section begins with a concise summary of our findings (Section 6.1), followed by an in-depth analysis of the results and their implications (Section 6.2).

6.1. Summary of Findings

We first present the online classifiers performance over time (Section 6.2.1). Among the online classifiers, the HAT classifier was selected as a reference classifier for further comparison because of its good performance. Nevertheless, the study indicates that offline ML classifiers generally perform better than online classifiers. The discrepancy in performance is more pronounced in unbalanced datasets like BATADAL and Morris-4, which appear more challenging for online methods, suggesting that they struggle with a lack of representative data during the initial learning (training) phase.
Next, in Section 6.2.1, we provide a comparative analysis of offline and online classifiers, highlighting key performance metrics. We emphasize the performance differences across various datasets and explain the implications of these differences. Our findings indicate that the offline decision tree classifiers generally outperform the HAT online ML, primarily because the former uses the complete dataset for learning and is not limited by time and memory resources.
Since the response time to detect attacks is important, we examine the execution time of each technique in Section 6.2.2, addressing the balance between the superior metrics of offline classifiers and the speed of online classifiers. We show that while offline classifiers may yield better detection (superior F1-scores), online classifiers provide the advantage of faster learning times.
We also evaluate the classifiers’ adaptability to new attack occurrences in Section 6.2.3, simulating zero-day attacks on the ERENO dataset. Our study revealed that the best offline classifier struggled to detect new, unknown attacks (zero-day attacks). In particular, it was not successful in identifying new attacks when trained on datasets for different use cases. Conversely, the online HAT classifier demonstrated better performance in handling zero-day attacks, suggesting superior adaptability to novel threats.
We present and discuss our detailed results in Section 6.2.

6.2. Detailed Analysis

6.2.1. Online Classifiers’ Metrics over Time

We can gain insight into the performance of online classifiers by studying how their performance varies over time during the tests. The graphs in Figure 3, Figure 4, Figure 5, Figure 6, Figure 7, Figure 8 and Figure 9 show the evolution of the F1-score of the classifiers for the sequence of samples (i.e., over time) using the reference classifier (HAT). The best and worst offline classifiers in F1-score are also shown for comparison. The worst of the online ML is not shown because of the much worse result when compared with the worst offline ML. Another reason for not using the worst offline is the excess of data in the graphics that would complicate the analysis. The percentages of FN and FP in the figures ( F N f i g u r e and F P f i g u r e ) are extracted from the HAT classifier calculated by Equations (5) and (6), respectively. It is a jumping window where the F N i n t e r v a l and F P i n t e r v a l are the number of errors (FN and FP) present in the interval of d a t a s e t s i z e / 100 samples. They are presented on the secondary vertical axis to allow the identification of bursts of classification errors. The first vertical axis on the left denotes F1-score (between 0 and 1) for HAT online classifiers.
F N f i g u r e = F N i n t e r v a l F N t o t a l + F P t o t a l
F P f i g u r e = F P i n t e r v a l F P t o t a l + F N t o t a l
Figure 3. SWaT’s F1-score evolution through the samples. The metrics of F1-score, recall, and precision appear only after attacks start, that is, only after sample 492,284.
Figure 4. BATADAL’s F1-score evolution through the samples. The metrics of F1-score, recall, and precision appear only after attacks start, that is, only after sample 10,578.
Figure 5. ERENO’s F1-score evolution through the samples; attacks are distributed throughout.
Figure 6. Morris-1’s F1-score evolution through the samples; attacks are distributed throughout.
Figure 7. Morris-3 gas’s F1-score evolution through the samples.
Figure 8. Morris-3 water’s F1-score evolution through the samples.
Figure 9. Morris-4’s F1-score evolution through the samples.
Figure 3 shows the results obtained with the SWaT dataset. Despite more FN peaks, overall there are 1914 (58.3%) FPs and 1369 (41.7%) FNs. The total number of errors represents 0.34% of the samples in the test. By the end of the experiment, HAT had an F1-score 2.77% below the result obtained by RF.
Figure 4 shows the results for the BATADAL dataset. In total, HAT had 201 errors throughout the experiment: FP = 20 and FN = 181. That indicates that the HAT model was not able to learn to identify the occurrence of the attacks. The total errors represent 1.44% of the samples, and the attacks are present in 1.69% of the samples. The HAT F1-score at the end of the experiment is 37% below the F1-score obtained by ReT.
In Figure 5, we see that the ERENO dataset has attacks distributed along the entire range of samples. The 1070 errors obtained with HAT are divided into 516 FPs and 554 FNs. The total number of errors represents 0.018% of the samples in the dataset. The HAT F1-score at the end of the experiment is 0.11% below the F1-score obtained with ReT.
Figure 6 shows that, in the Morris-1 dataset, HAT had a total of 14,202 errors: 6214 of FPs and 7988 of FNs. The total number of errors represents 18.67% of the samples, which is substantially higher than the results obtained with the previous datasets. By the end of the experiment, HAT had an F1-score 6.33% below the F1-score obtained with RF.
In Figure 7, we note that HAT had a total of 1074 errors in the Morris-3 gas dataset: 245 FPs and 829 FNs. The total number of errors represents 1.1% of the samples in the experiment, which is in line with most of the datasets in this evaluation. HAT’s F1-score at the end of the experiment is 0.49% below the result obtained by J48.
For the Morris-3 water dataset (Figure 8), HAT had a total of 4116 errors: 2007 FPs and 2109 FNs. This represents 1.74% of the samples in the dataset. By the end of the experiment, HAT had an F1-score 1.63% below that of ReT.
In Figure 9, HAT had a total of 45,404 errors the Morris-4 dataset: 3149 FPs and 42,255 FNs, corresponding to errors in 15.38% of the samples. In particular, the significant number of FNs indicate that HAT had difficult detecting attacks, classifying most of them as normal. HAT had an F1-score 51.32% below the result obtained by RaT at the end of the experiment.
Through Figure 3, Figure 4, Figure 5, Figure 6, Figure 7, Figure 8 and Figure 9, we noticed the offline decision tree classifiers had better results than the Hoeffding Adaptive Tree online ML because their learning is performed with the complete dataset and without the restriction of time and memory resources. On average, the best offline ML F1-score classifiers outperformed the best online ML F1-score classifier (HAT) by 3.17% in accuracy, 4.38% in precision, 14.81% in recall, and 12.08% in F1-score, while the difference in accuracy is relatively small, we notice that the F1-score, which depends on other metrics (see Equations (1)–(4)), results in a particularly large difference, as can be noted in Figure 10. So, the accuracy is not a good metric for this evaluation, because of the unbalanced datasets (with one class having significantly more instances than the others), the small number of attacks used, as can be seen in Table 2. The use of F1-score is the most suitable to identify the differences in the classifiers’ performance in these unbalanced cases.
Figure 10. Comparison of best offline algorithm and online reference (HAT) in terms of F1-score, recall, and precision for all datasets.
From Figure 10, we can see the differences between the online and offline ML average F1-scores (yellow line). The Morris-4 and BATADAL datasets show the largest performance differences (55% and 20%, respectively), indicating that these two datasets are the most difficult for the online ML methods. The Morris-1 and SWaT datasets show smaller differences (6% and 5%), while the remaining show no significant difference (less than 2%).
Figure 11 shows the evolution of the HAT F1-score results each datasets as more and more instances (samples) are processed; we show a percentage of instances because each dataset has a different number of samples. The worst result was verified in BATADAL, followed by Morris-4, Morris-1, Morris-3 water, SWaT, Morris-3 gas, and ERENO. One of the reasons BATADAL has such bad results is the lack of attacks during most of the initial time. As the dataset is unbalanced, the model does not have enough samples to learn about the attacks.
Figure 11. HAT F1-score of all datasets.

6.2.2. Run Time Performance

As mentioned above, intrusion detection must be performed quickly. Figure 12 summarizes the time it took for offline and online classifiers for each dataset. Overall, the dataset size (number of instances) is directly related to the amount of time spent by both offline ML and online ML. To isolate that factor, we report the average run time spent per instance (log scale) to compare the classifiers for the different datasets.
Figure 12. Offline and online classifiers’ average run time per instance.
In our study, we evaluated various offline classifiers using different datasets, focusing on their performance in terms of F1-score. We found that the top-performing classifiers exhibited an average training time of 530 μs per instance and an average test time of 40.6 μs per instance. This stark difference between training and testing times indicates that the majority of the computational effort in offline classifiers is spent during the training phase, which is approximately 13 times slower than the testing phase. During training, the Random Tree, REPTree, J48, and Random Forest classifiers (the best offline models, as can be seen in Table 3) invest time in generating decision trees to build the learned model. However, the Naive Bayes classifier demonstrates a faster training time compared to the others since it focuses on generating and calculating probabilities for assigning input features to specific classes. It is worth noting that in all models, the testing phase is generally quicker than the training phase as it primarily involves the application of a decision rule to assign inputs to their respective classes. These findings shed light on the time distribution and computational characteristics of the evaluated classifiers, providing insights into their practical usage and efficiency in real-world scenarios.
Therefore, while the best offline classifiers in terms of F1-score had an average of 0.93, 0.12 better than online HAT classifier F1-score, its learning time per instance is 9.78 times larger than that of HAT. So, there is a trade-off between the best metrics of offline classifiers and the faster time of online classifiers. On the other hand, we must comment the delay problems that might happen because of the labeling (Figure 1). If the labeling process has problems, a bigger delay must be inserted after the arrival of the following samples. These malfunctioning might compromise the online ML real-time response and compromise the entire process.

6.2.3. Adaptability to New Attack Occurrences

To compare the performance of online and offline ML techniques, in terms of adaptability to new attacks, an experiment was carried out in WEKA with the ERENO dataset and its attacks’ Use Cases (UC) in sequence. More specifically, the offline REPTree classifier was used to train six models using six “cumulative” training datasets, each referring to a different attack UC, named UC1, UC1-2, UC1-3, UC1-4, UC1-5, and UC1-6. Here, UC1 denotes a training dataset containing only samples from the use case number one, while UC1-X denotes a dataset comprising samples from all UCs from 1 to X. The test is performed on samples of the following X + 1 UC. Each of the six models was then evaluated using, respectively, UC2, UC3, UC4, UC5, UC6, and UC7. The goal of this experiment was to simulate the behavior of the classifiers in handling zero-day attacks (i.e., showing how capable an IDS is of detecting an unknown attack based on the training it received on other attacks). Figure 13 shows the F1-score evolution of the offline REPTree classifier in comparison to the performance of the online HAT classifier executed with the described UCs. The attacks found on each UC are as follows: UC1, Random Replay Attacks; UC2, Inverse Replay Attacks; UC3, Masquerade Attacks-Outage; UC4, Masquerade Attacks-Equipment Damage; UC5, Random Message Injection attacks; UC6, High-Status Number attacks; and UC7, High-Rate Flooding Attack.
Figure 13. ERENO: cumulative F1-score; best offline (RepTree) and online (HAT) classifiers.
The presence of zero-day attacks harmed the offline classifier’s performance, especially for cases UC1/UC2 (trained on UC1 and tested on UC2), UC1-2/UC3, UC1-3/UC4, and UC1-4/UC5. In all those cases, the REPTree, offline’s best classifier in F1-score for this dataset was not able to detect new attacks, as it cannot adapt to changes, which was already expected due to the offline ML characteristic. In the last two cases, UC1-5/UC6 and UC1-6/UC7, the REPTree classifier had good F1-score results, due to the similarities between the last two attacks, UC6 and UC7, and the previous five attack UCs. One of the experiments carried out with this objective uses the Leave-One-Out approach, where training is performed with all Use Cases minus the one that will be used in the test. In Table 4, the values in red show the conjunction between training and testing of the UCs where the accuracy was below the Majority Class and with a low F1-score, the values in green show the conjunction between training and testing where the accuracy was higher than the Majority Class and with high F1-score. The metrics where there is a division by zero in Equations (2) and (4) are shown as “Undef.”.
Table 4. Leave-One-Out test. In red, performance values for the UCs where the accuracy was below the Majority Class and with a low F1-score. In green, performance values for the UCs where the accuracy was above the Majority Class and with a high F1-score.
As shown in Table 4, the Masquerade–Outage, Masquerade–Equipment Damage, and Random Message Injection attacks (UC3, UC4, and UC5, respectively) are not identified by the offline classifier trained with any other UC. These attacks are also pointed out by [22] as the most difficult to detect. The detection of Inverse Replay attacks, UC2, was moderately successful while Random Replay, High-Status Number, and High-Rate Flooding Attacks (UC1, UC6, and UC7, respectively) are easily identified by training with other UCs.
To complement the analysis and find an individual relationship between the Use Cases, another experiment was performed using only the F1-score metric. As can be seen in Table 5, all UC combinations for training and testing were tested. The same conventions (color scheme and Undef.) from Table 4 were used. It can be seen that attacks from UC1 (Random Replay) are easily detected by training the model with data from both UC2 and UC7 (Inverse Replay Attack and High-Rate Flooding Attack, respectively). Attacks from UC2 are easily detected with models trained on UC7, meaning that the Inverse Replay Attacks can be identified by models for the High-Rate Flooding Attack. Similarly, the High-Rate Flooding Attack (UC6) has a strong relationship with the Inverse Replay Attacks (UC2) and Random Message Injection attacks (UC5). Also, the High-Rate Flooding Attack (UC7) has a strong relationship with the Inverse Replay Attacks (UC2) and the Masquerade–Outage (UC3). Hence, we can conclude that the good results obtained by REPTree on UC6 and UC7, in Figure 12, happen because of their correlation with the attacks UC2/UC5 and UC2/UC3, respectively.
Table 5. One-by-one Use Cases test with REPTree F1-score metric. In red, performance values for the UCs where the accuracy was below the Majority Class and with a low F1-score. In green, performance values for the UCs where the accuracy was above the Majority Class and with a high F1-score.

7. Conclusions

The rapidly growing integration of CPS in critical industries underscores an urgent need for effective intrusion detection. By evaluating various online and offline machine learning techniques for intrusion detection in the CPS domain, this study reveals that: (i) when known signatures are available, offline techniques present higher precision, recall, accuracy, and F1-score, whereas (ii) for real-time detection online methods are more suitable, as they learn and test almost 10 times faster. Furthermore, while offline ML’s robust classification metrics are important, the adaptability and real-time responsiveness of online classifiers cannot be overlooked. Thus, a combined approach may be key to effective intrusion detection in CPS scenarios.
The implications of these findings for the field of CPS security and intrusion detection are twofold. First, they highlight the potential for conducing future research to reach a more flexible and robust CPS security mechanism that leverages the strengths of both offline and online techniques. Second, they reinforce the value of machine learning as a powerful tool in the ever-evolving landscape of CPS security.
Our future research will explore new classification techniques, analyze adaptability to emerging threats, and continue to investigate the merits and limitations of online and offline ML techniques. These insights not only contribute to current understanding but also guide the next steps in enhancing CPS security and intrusion detection.

Author Contributions

Conceptualization, V.F.S., C.A., D.P., S.E.Q. and D.M.; software, V.F.S., D.P. and S.E.Q.; writing—original draft preparation, V.F.S.; writing—review and editing, C.A., D.P., S.E.Q. and D.M.; supervision, C.A., D.P. and D.M.; funding acquisition, D.M. All authors have read and agreed to the published version of the manuscript.

Funding

This research was funded in part by CNPq, FAPERJ, and CAPES/PRINT 001 in Brazil and the Laboratory for Physical Sciences in the USA.

Data Availability Statement

All the research data used in the paper is available upon request.

Conflicts of Interest

The authors declare no conflict of interest.

References

  1. Quincozes, S.E.; Passos, D.; Albuquerque, C.; Ochi, L.S.; Mossé, D. GRASP-Based Feature Selection for Intrusion Detection in CPS Perception Layer. In Proceedings of the 2020 4th Conference on Cloud and Internet of Things (CIoT), Niteroi, Brazil, 7–9 October 2020; pp. 41–48. [Google Scholar]
  2. Reis, L.H.A.; Murillo Piedrahita, A.; Rueda, S.; Fernandes, N.C.; Medeiros, D.S.; de Amorim, M.D.; Mattos, D.M. Unsupervised and incremental learning orchestration for cyber-physical security. Trans. Emerg. Telecommun. Technol. 2020, 31, e4011. [Google Scholar] [CrossRef]
  3. Goh, J.; Adepu, S.; Junejo, K.N.; Mathur, A. A Dataset to Support Research in the Design of Secure Water Treatment Systems. In Proceedings of the Critical Information Infrastructures Security, 11th International Conference, CRITIS 2016, Paris, France, 10–12 October 2016; Springer: Cham, Switzerland, 2017; pp. 88–99. [Google Scholar]
  4. Obert, J.; Cordeiro, P.; Johnson, J.T.; Lum, G.; Tansy, T.; Pala, N.; Ih, R. Recommendations for Trust and Encryption in DER Interoperability Standards; Technical Report; Sandia National Lab (SNL-NM): Albuquerque, NM, USA, 2019. [Google Scholar]
  5. Almomani, I.; Al-Kasasbeh, B.; Al-Akhras, M. WSN-DS: A dataset for intrusion detection systems in wireless sensor networks. J. Sensors 2016, 2016, 4731953. [Google Scholar] [CrossRef]
  6. Langner, R. Stuxnet: Dissecting a cyberwarfare weapon. IEEE Secur. Priv. 2011, 9, 49–51. [Google Scholar] [CrossRef]
  7. Kim, S.; Park, K.J. A Survey on Machine-Learning Based Security Design for Cyber-Physical Systems. Appl. Sci. 2021, 11, 5458. [Google Scholar] [CrossRef]
  8. Rai, R.; Sahu, C.K. Driven by Data or Derived Through Physics? A Review of Hybrid Physics Guided Machine Learning Techniques with Cyber-Physical System (CPS) Focus. IEEE Access 2020, 8, 71050–71073. [Google Scholar] [CrossRef]
  9. Mohammadi Rouzbahani, H.; Karimipour, H.; Rahimnejad, A.; Dehghantanha, A.; Srivastava, G. Anomaly Detection in Cyber-Physical Systems Using Machine Learning. In Handbook of Big Data Privacy; Springer International Publishing: Cham, Switzerland, 2020; pp. 219–235. [Google Scholar] [CrossRef]
  10. Lippmann, R.P.; Fried, D.J.; Graf, I.; Haines, J.W.; Kendall, K.R.; McClung, D.; Weber, D.; Webster, S.E.; Wyschogrod, D.; Cunningham, R.K.; et al. Evaluating Intrusion Detection Systems: The 1998 DARPA Off-Line Intrusion Detection Evaluation. In Proceedings of the DARPA Information Survivability Conference and Exposition, Hilton Head, SC, USA, 25–27 January 2000; Volume 2, pp. 12–26. [Google Scholar]
  11. Tavallaee, M.; Bagheri, E.; Lu, W.; Ghorbani, A.A. A Detailed Analysis of the KDD CUP 99 Data Set. In Proceedings of the 2009 IEEE Symposium on Computational Intelligence for Security and Defense Applications, Ottawa, ON, Canada, 8–10 July 2009; pp. 1–6. [Google Scholar]
  12. Sharafaldin, I.; Lashkari, A.H.; Ghorbani, A.A. Toward generating a new intrusion detection dataset and intrusion traffic characterization. ICISSp 2018, 1, 108–116. [Google Scholar]
  13. Moustafa, N.; Slay, J. UNSW-NB15: A Comprehensive Data Set for Network Intrusion Detection Systems (UNSW-NB15 Network Data Set). In Proceedings of the 2015 Military Communications and Information Systems Conference (MilCIS), Canberra, ACT, Australia, 10–12 November 2015; pp. 1–6. [Google Scholar]
  14. Kartakis, S.; McCann, J.A. Real-Time Edge Analytics for Cyber Physical Systems Using Compression Rates. In Proceedings of the 11th International Conference on Autonomic Computing (ICAC 14), Philadelphia, PA, USA, 23–23 July 2014; pp. 153–159. [Google Scholar]
  15. Hidalgo, J.I.G.; Maciel, B.I.; Barros, R.S. Experimenting with prequential variations for data stream learning evaluation. Comput. Intell. 2019, 35, 670–692. [Google Scholar] [CrossRef]
  16. Witten, I.H.; Frank, E. Data mining: Practical machine learning tools and techniques with Java implementations. ACM Sigmod. Rec. 2002, 31, 76–77. [Google Scholar] [CrossRef]
  17. Nixon, C.; Sedky, M.; Hassan, M. Practical Application of Machine Learning Based Online Intrusion Detection to Internet of Things Networks. In Proceedings of the 2019 IEEE Global Conference on Internet of Things (GCIoT), Dubai, United Arab Emirates, 4–7 December 2019; pp. 1–5. [Google Scholar]
  18. Gama, J.; Sebastiao, R.; Rodrigues, P.P. Issues in Evaluation of Stream Learning Algorithms. In Proceedings of the 15th ACM SIGKDD International Conference on Knowledge Discovery and Data Mining, Paris, France, 28 June–1 July 2009; pp. 329–338. [Google Scholar]
  19. Bifet, A.; Holmes, G.; Pfahringer, B.; Kranen, P.; Kremer, H.; Jansen, T.; Seidl, T. Moa: Massive Online Analysis—A Framework for Stream Classification and Clustering. In Proceedings of the First Workshop on Applications of Pattern Analysis, Windsor, UK, 1–3 September 2010; pp. 44–50. [Google Scholar]
  20. Adhikari, U.; Morris, T.H.; Pan, S. Applying hoeffding adaptive trees for real-time cyber-power event and intrusion classification. IEEE Trans. Smart Grid 2017, 9, 4049–4060. [Google Scholar] [CrossRef]
  21. Domingos, P.; Hulten, G. Mining High-Speed Data Streams. In Proceedings of the Sixth ACM SIGKDD International Conference on Knowledge Discovery and Data Mining, Boston, MA, USA, 20–23 August 2000; pp. 71–80. [Google Scholar]
  22. Quincozes, S.E.; Albuquerque, C.; Passos, D.; Mossé, D. ERENO: An Extensible Tool For Generating Realistic IEC-61850 Intrusion Detection Datasets. In Proceedings of the Anais Estendidos do XXII Simpósio Brasileiro em Segurança da Informação e de Sistemas Computacionais, Santa Maria, Brazil, 12–15 September 2022; pp. 1–8. [Google Scholar]
  23. Radoglou-Grammatikis, P.I.; Sarigiannidis, P.G. Securing the smart grid: A comprehensive compilation of intrusion detection and prevention systems. IEEE Access 2019, 7, 46595–46620. [Google Scholar] [CrossRef]
  24. Faisal, M.A.; Aung, Z.; Williams, J.R.; Sanchez, A. Data-stream-based intrusion detection system for advanced metering infrastructure in smart grid: A feasibility study. IEEE Syst. J. 2014, 9, 31–44. [Google Scholar] [CrossRef]
  25. Corrêa, D.G.; Enembreck, F.; Silla, C.N. An Investigation of the Hoeffding Adaptive Tree for the Problem of Network Intrusion Detection. In Proceedings of the 2017 International Joint Conference on Neural Networks (IJCNN), Anchorage, AK, USA, 14–19 May 2017; pp. 4065–4072. [Google Scholar]
  26. Setha, S.; Singha, G.; Chahala, K.K. Drift-Based Approach for Evolving Data Stream Classification in Intrusion Detection System. In Proceedings of the Workshop on Computer Networks & Communications, Goa, India, 30–30 April 2021; pp. 23–30. [Google Scholar]
  27. Dahal, N.; Abuomar, O.; King, R.; Madani, V. Event stream processing for improved situational awareness in the smart grid. Expert Syst. Appl. 2015, 42, 6853–6863. [Google Scholar] [CrossRef]
  28. Desale, K.S.; Kumathekar, C.N.; Chavan, A.P. Efficient Intrusion Detection System Using Stream Data Mining Classification Technique. In Proceedings of the 2015 International Conference on Computing Communication Control and Automation, Pune, India, 26–27 February 2015; pp. 469–473. [Google Scholar]
  29. Priya, S.; Uthra, R.A. Comprehensive analysis for class imbalance data with concept drift using ensemble based classification. J. Ambient. Intell. Humaniz. Comput. 2021, 12, 4943–4956. [Google Scholar] [CrossRef]
  30. Ida Seraphim, B.; Poovammal, E. Adversarial attack by inducing drift in streaming data. Wirel. Pers. Commun. 2022, 127, 997–1021. [Google Scholar] [CrossRef]
  31. Aung, Y.L.; Tiang, H.H.; Wijaya, H.; Ochoa, M.; Zhou, J. Scalable VPN-Forwarded Honeypots: Dataset and Threat Intelligence Insights. In Proceedings of the Sixth Annual Industrial Control System Security (ICSS), Austin, TX, USA, 8 December 2020; pp. 21–30. [Google Scholar]
  32. Taormina, R.; Galelli, S.; Tippenhauer, N.O.; Salomons, E.; Ostfeld, A.; Eliades, D.G.; Aghashahi, M.; Sundararajan, R.; Pourahmadi, M.; Banks, M.K.; et al. Battle of the attack detection algorithms: Disclosing cyber attacks on water distribution networks. J. Water Resour. Plan. Manag. 2018, 144, 04018048. [Google Scholar] [CrossRef]
  33. Hink, R.C.B.; Beaver, J.M.; Buckner, M.A.; Morris, T.; Adhikari, U.; Pan, S. Machine Learning for Power System Disturbance and Cyber-Attack Discrimination. In Proceedings of the 2014 7th International symposium on resilient control systems (ISRCS), Denver, CO, USA, 19–21 August 2014; pp. 1–8. [Google Scholar]
  34. Morris, T.; Gao, W. Industrial Control System Traffic Data Sets for Intrusion Detection Research. In Proceedings of the Critical Infrastructure Protection VIII, 8th IFIP WG 11.10 International Conference (ICCIP 2014), Arlington, VA, USA, 17–19 March 2014; Revised Selected Papers 8. Springer: Cham, Switzerland, 2014; pp. 65–78. [Google Scholar]
  35. Morris, T.H.; Thornton, Z.; Turnipseed, I. Industrial Control System Simulation and Data Logging for Intrusion Detection System Research. In Proceedings of the 7th Annual Southeastern Cyber Security Summit, Huntsville, AL, USA, 3–4 June 2015; pp. 3–4. [Google Scholar]
  36. IEC-61850; Communication Networks and Systems in Substations. International Electrotechnical Commission: Geneva, Switzerland, 2003.
  37. Hall, M.; Frank, E.; Holmes, G.; Pfahringer, B.; Reutemann, P.; Witten, I.H. The WEKA data mining software: An update. ACM SIGKDD Explor. Newsl. 2009, 11, 10–18. [Google Scholar] [CrossRef]
Disclaimer/Publisher’s Note: The statements, opinions and data contained in all publications are solely those of the individual author(s) and contributor(s) and not of MDPI and/or the editor(s). MDPI and/or the editor(s) disclaim responsibility for any injury to people or property resulting from any ideas, methods, instructions or products referred to in the content.

Article Metrics

Citations

Article Access Statistics

Multiple requests from the same IP address are counted as one view.