
Techno-Economic Potential of Wind-Based Green Hydrogen Production in Djibouti: Literature Review and Case Studies

 ,
,
Abstract
:1. Introduction
1.1. Problem Formulation
1.2. Fundamental Contributions and Research Originality
- Estimating the green hydrogen production using wind energy in Nagad (Arta) and Bara Wein (Dikhil) owing to their proximity to the water dam and windy locations;
- Illustrating the performance of the different wind turbines accompanied with various alkaline and PEM electrolyzers;
- Studying how the environment will be ecologically impacted while producing the green hydrogen solutions;
- Analyzing the levelized cost of hydrogen production for the diverse case studies.
2. Literature Review
3. Sites Description and Theoretical Background
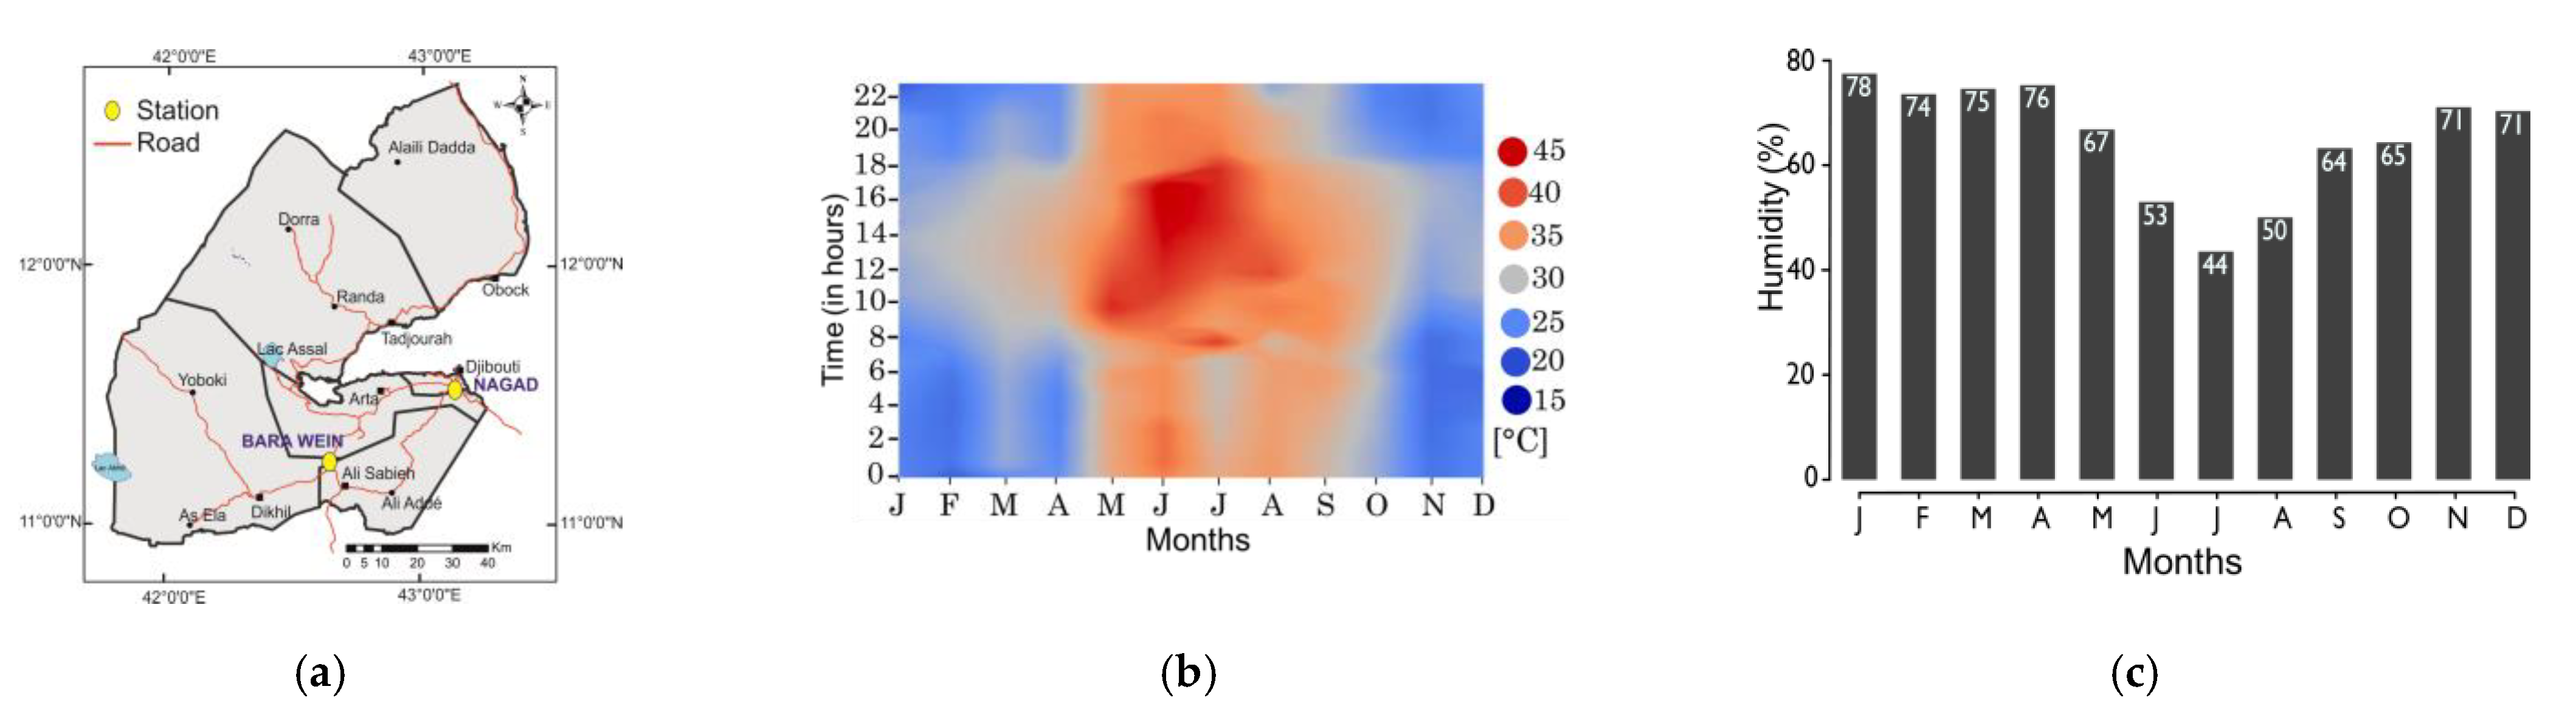
3.1. Site Description
3.2. Theoretical Background
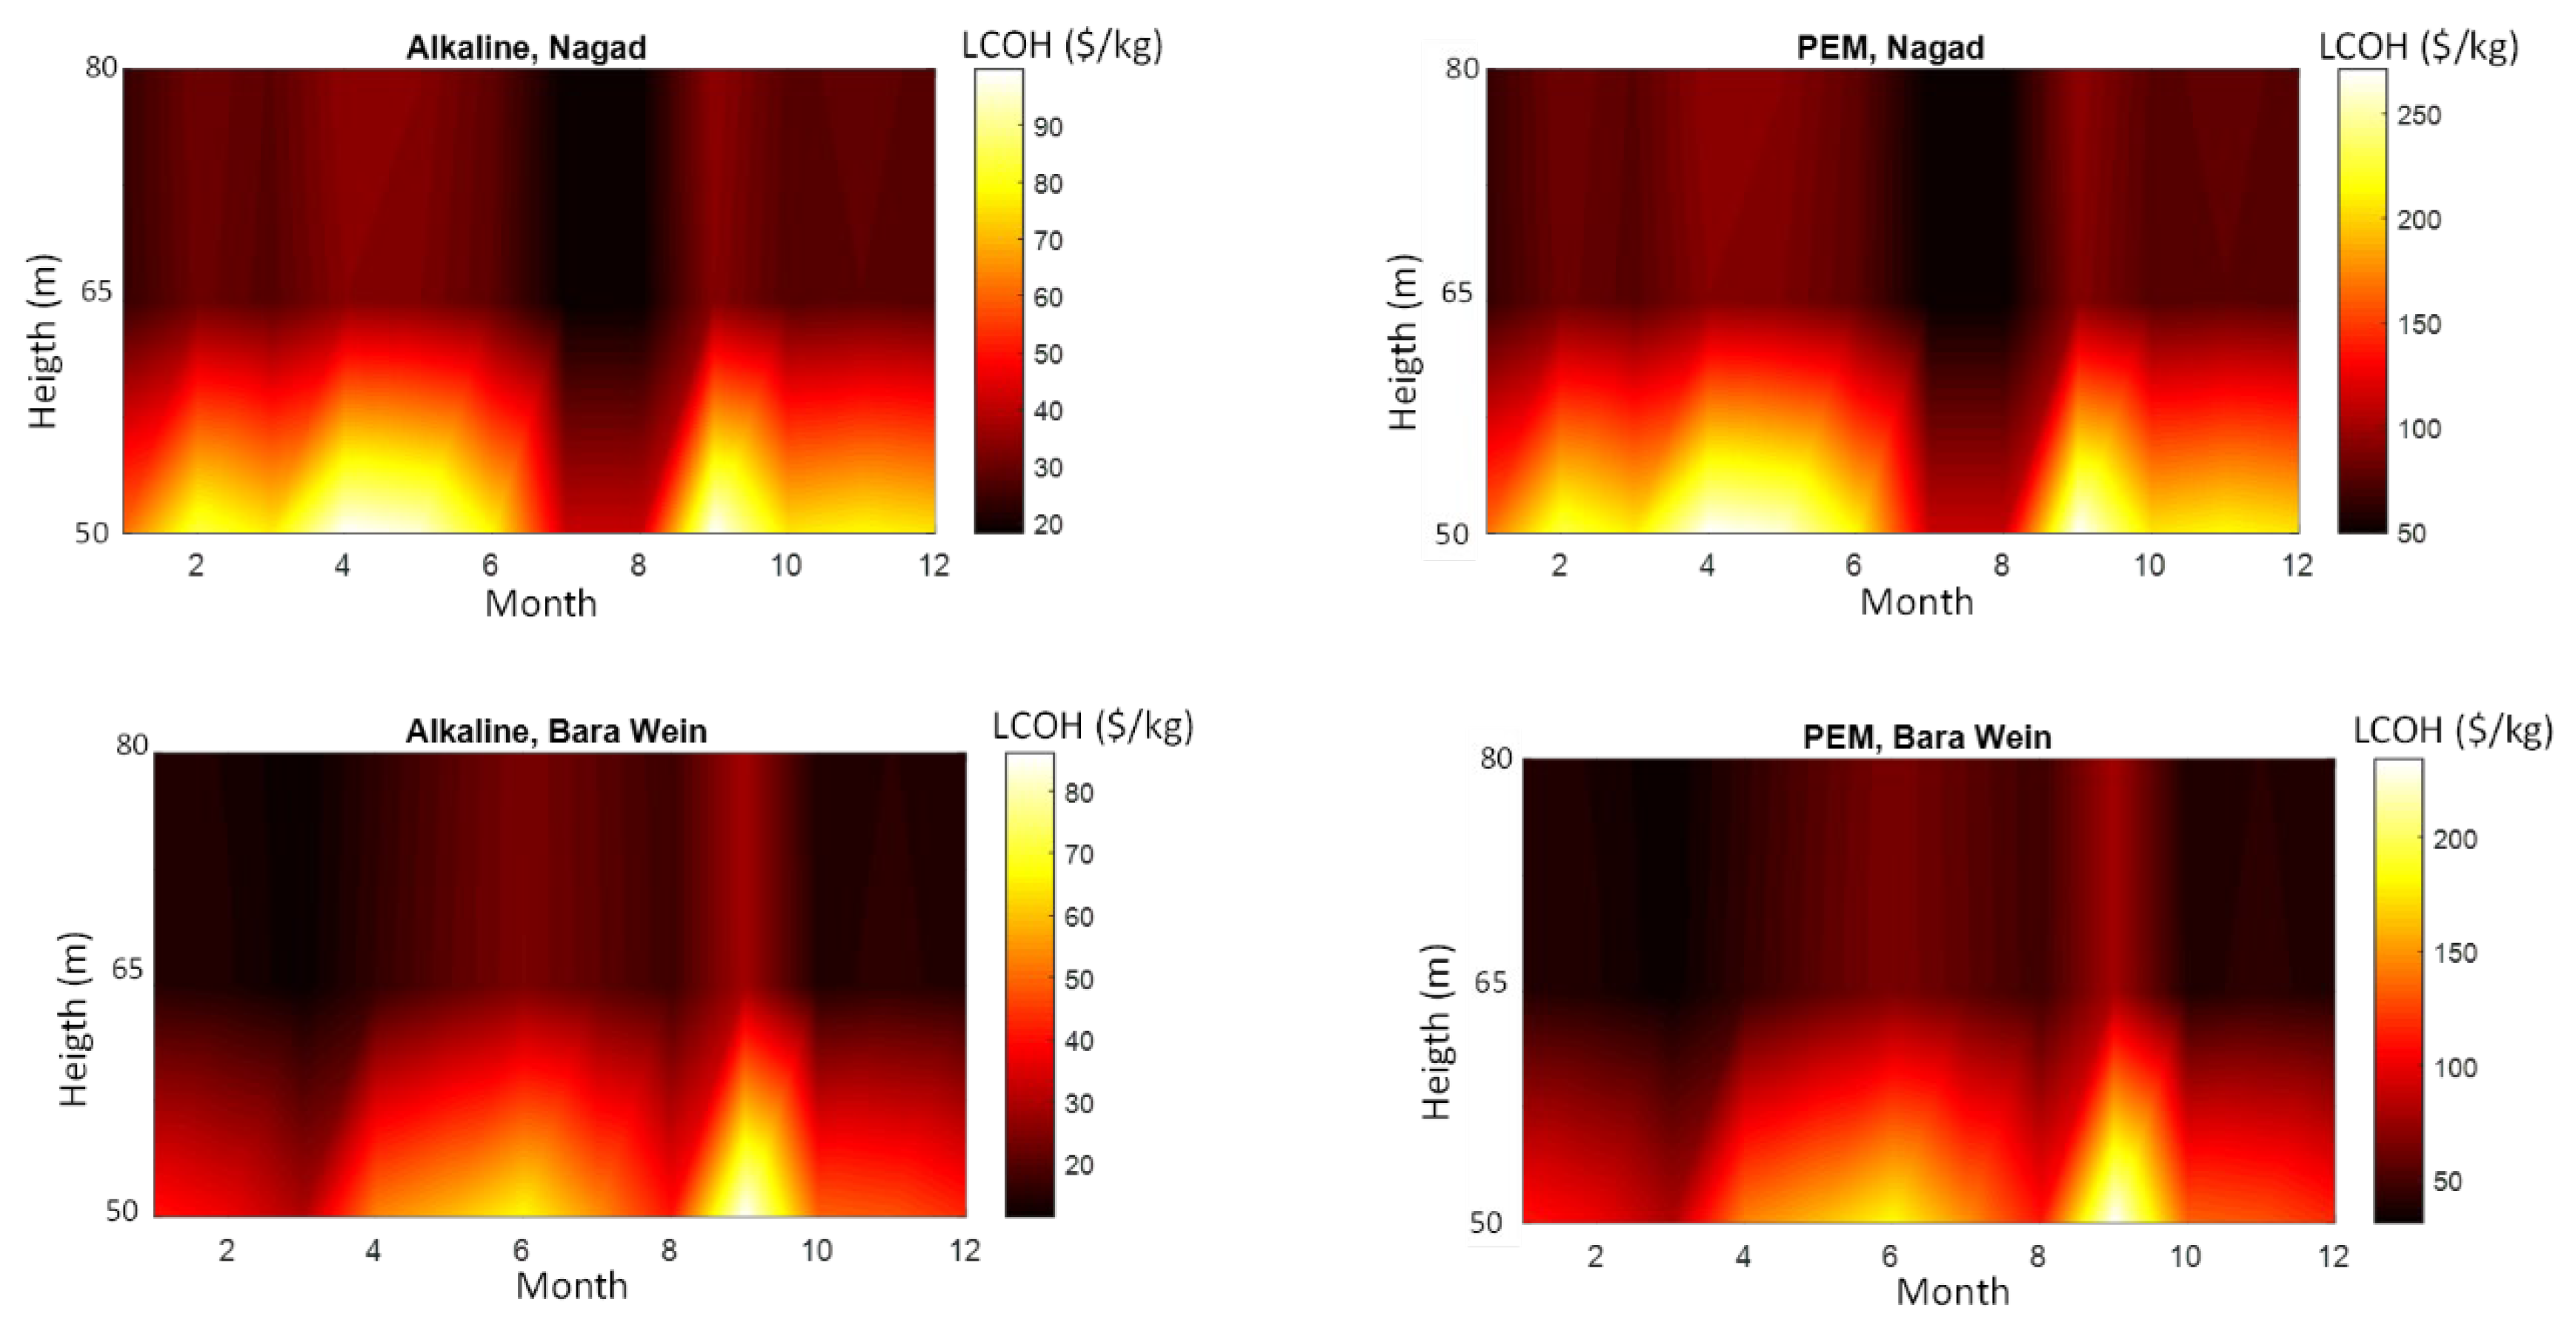
4. Results and Discussion
5. Conclusions, Recommendations and Perspectives
Funding
Acknowledgments
Conflicts of Interest
Nomenclature
| Wind shear coefficient | |
| Gamma function | |
| Efficiency of electrolyzer | |
| Conversion efficiency | |
| Scale parameter of Weibull distribution | |
| Scale parameter at | |
| Capital cost of the electrolyzers | |
| Cost of wind electricity | |
| Capacity factor | |
| Scale parameter at extrapolated height | |
| Comr | Operation, maintenance and repair cost |
| Cu | Unit cost of wind energy |
| Electrolyzer energy consumption | |
| Energy output | |
| Energy pattern factor | |
| Probability density function (PDF) | |
| Cumulative distribution function (CDF) | |
| h | Extrapolated height |
| Initial height | |
| I | Inflation rate |
| Shape parameter of Weibull distribution | |
| Shape parameter at | |
| Shape parameter at extrapolated height | |
| Lt | Lifetime of turbine |
| Million | |
| Amount of hydrogen produced | |
| n | Exponent |
| Average power output | |
| Rated electrical power | |
| r | Interest rate |
| S | Scrap value |
| t | Time |
| T | The operation life of the electrolyzer |
| Wind speed | |
| Wind speed at | |
| Cut-in wind speeds | |
| Cut-off wind speeds | |
| Rated wind speeds | |
| Arithmetic wind speed mean |
Appendix A

| January | February | March | April | May | June | July | August | September | October | November | December | |||
|---|---|---|---|---|---|---|---|---|---|---|---|---|---|---|
| NAGAD | h = 10 m | v (m/s) | 4.7 | 4.00 | 4.00 | 3.38 | 3.39 | 4.00 | 4. 90 | 5.29 | 3.39 | 3.99 | 3.89 | 3.99 |
| c (m/s) | 5.57 | 4.69 | 4.58 | 4.33 | 4.02 | 4.59 | 5.42 | 6.33 | 4.30 | 4.79 | 4.60 | 4.79 | ||
| k (-) | 1.91 | 1.80 | 1.80 | 1.68 | 1.69 | 1.83 | 1.98 | 1.99 | 1.69 | 1.72 | 1.79 | 1.79 | ||
| h = 50 m | v (m/s) | 5.76 | 5.13 | 5.13 | 4.50 | 4.50 | 5.13 | 7.13 | 7.14 | 4.51 | 5.12 | 5.13 | 5.12 | |
| c (m/s) | 7.89 | 7.16 | 7.13 | 6.38 | 6.39 | 7.15 | 9.45 | 9.47 | 6.39 | 7.16 | 7.15 | 7.16 | ||
| k (-) | 2.12 | 2.02 | 2.02 | 1.90 | 1.90 | 2.02 | 2.27 | 2.27 | 1.91 | 2.02 | 2.02 | 2.03 | ||
| h = 65 m | v (m/s) | 5.97 | 5.33 | 5.32 | 4.66 | 4.67 | 5.32 | 7.40 | 7.41 | 4.67 | 5.33 | 5.32 | 5.33 | |
| c (m/s) | 8.57 | 7.80 | 7.77 | 6.98 | 6.99 | 7.79 | 10.19 | 10.21 | 6.99 | 7.80 | 7.79 | 7.81 | ||
| k (-) | 2.18 | 2.08 | 2.08 | 1.95 | 1.95 | 2.07 | 2.33 | 2.33 | 1.95 | 2.08 | 2.07 | 2.08 | ||
| h = 80 m | v (m/s) | 6.15 | 5.48 | 5.47 | 4.80 | 4.80 | 5.48 | 7.61 | 7.63 | 4.81 | 5.48 | 5.47 | 5.49 | |
| c (m/s) | 9.18 | 8.38 | 8.35 | 7.53 | 7.54 | 8.37 | 10.85 | 10.87 | 7.54 | 8.38 | 8.37 | 8.39 | ||
| k (-) | 2.23 | 2.13 | 2.13 | 1.99 | 1.99 | 2.12 | 2.38 | 2.39 | 2.00 | 2.13 | 2.12 | 2.13 | ||
| BARA WEIN | h = 20 m | v (m/s) | 7.04 | 8.05 | 8.06 | 6.87 | 5.46 | 4.77 | 5.22 | 6.00 | 4.27 | 7.31 | 7.06 | 7.35 |
| c (m/s) | 7.88 | 8.94 | 9.50 | 7.65 | 6.16 | 5.39 | 5.90 | 6.78 | 4.82 | 8.10 | 7.87 | 8.17 | ||
| k (-) | 3.05 | 3.60 | 3.90 | 3.37 | 2.42 | 2.03 | 2.12 | 2.17 | 1.98 | 3.72 | 3.34 | 3.46 | ||
| h = 50 m | v (m/s) | 7.75 | 8.86 | 8.87 | 7.56 | 6.01 | 5.25 | 5.74 | 6.60 | 4.70 | 8.05 | 7.77 | 8.09 | |
| c (m/s) | 11.21 | 12.46 | 13.11 | 10.94 | 9.13 | 8.16 | 8.80 | 9.89 | 7.44 | 11.47 | 11.20 | 11.56 | ||
| k (-) | 3.55 | 4.19 | 4.54 | 3.92 | 2.81 | 2.36 | 2.46 | 2.52 | 2.30 | 4.33 | 3.89 | 4.03 | ||
| h = 65 m | v (m/s) | 7.87 | 9.00 | 9.01 | 7.68 | 6.10 | 5.33 | 5.84 | 6.71 | 4.77 | 8.17 | 7.89 | 8.22 | |
| c (m/s) | 12.01 | 13.29 | 13.96 | 11.73 | 9.86 | 8.85 | 9.52 | 10.65 | 8.09 | 12.28 | 12.00 | 12.37 | ||
| k (-) | 3.65 | 4.30 | 4.66 | 4.03 | 2.89 | 2.43 | 2.53 | 2.59 | 2.37 | 4.45 | 3.99 | 4.14 | ||
| h = 80 m | v (m/s) | 7.97 | 9.11 | 9.13 | 7.78 | 6.18 | 5.40 | 5.91 | 6.79 | 4.83 | 8.28 | 7.99 | 8.32 | |
| c (m/s) | 12.72 | 14.03 | 14.71 | 12.43 | 10.51 | 9.47 | 10.16 | 11.32 | 8.69 | 13.00 | 12.71 | 13.08 | ||
| k (-) | 3.73 | 4.40 | 4.77 | 4.12 | 2.96 | 2.48 | 2.59 | 2.65 | 2.42 | 4.55 | 4.08 | 4.23 |
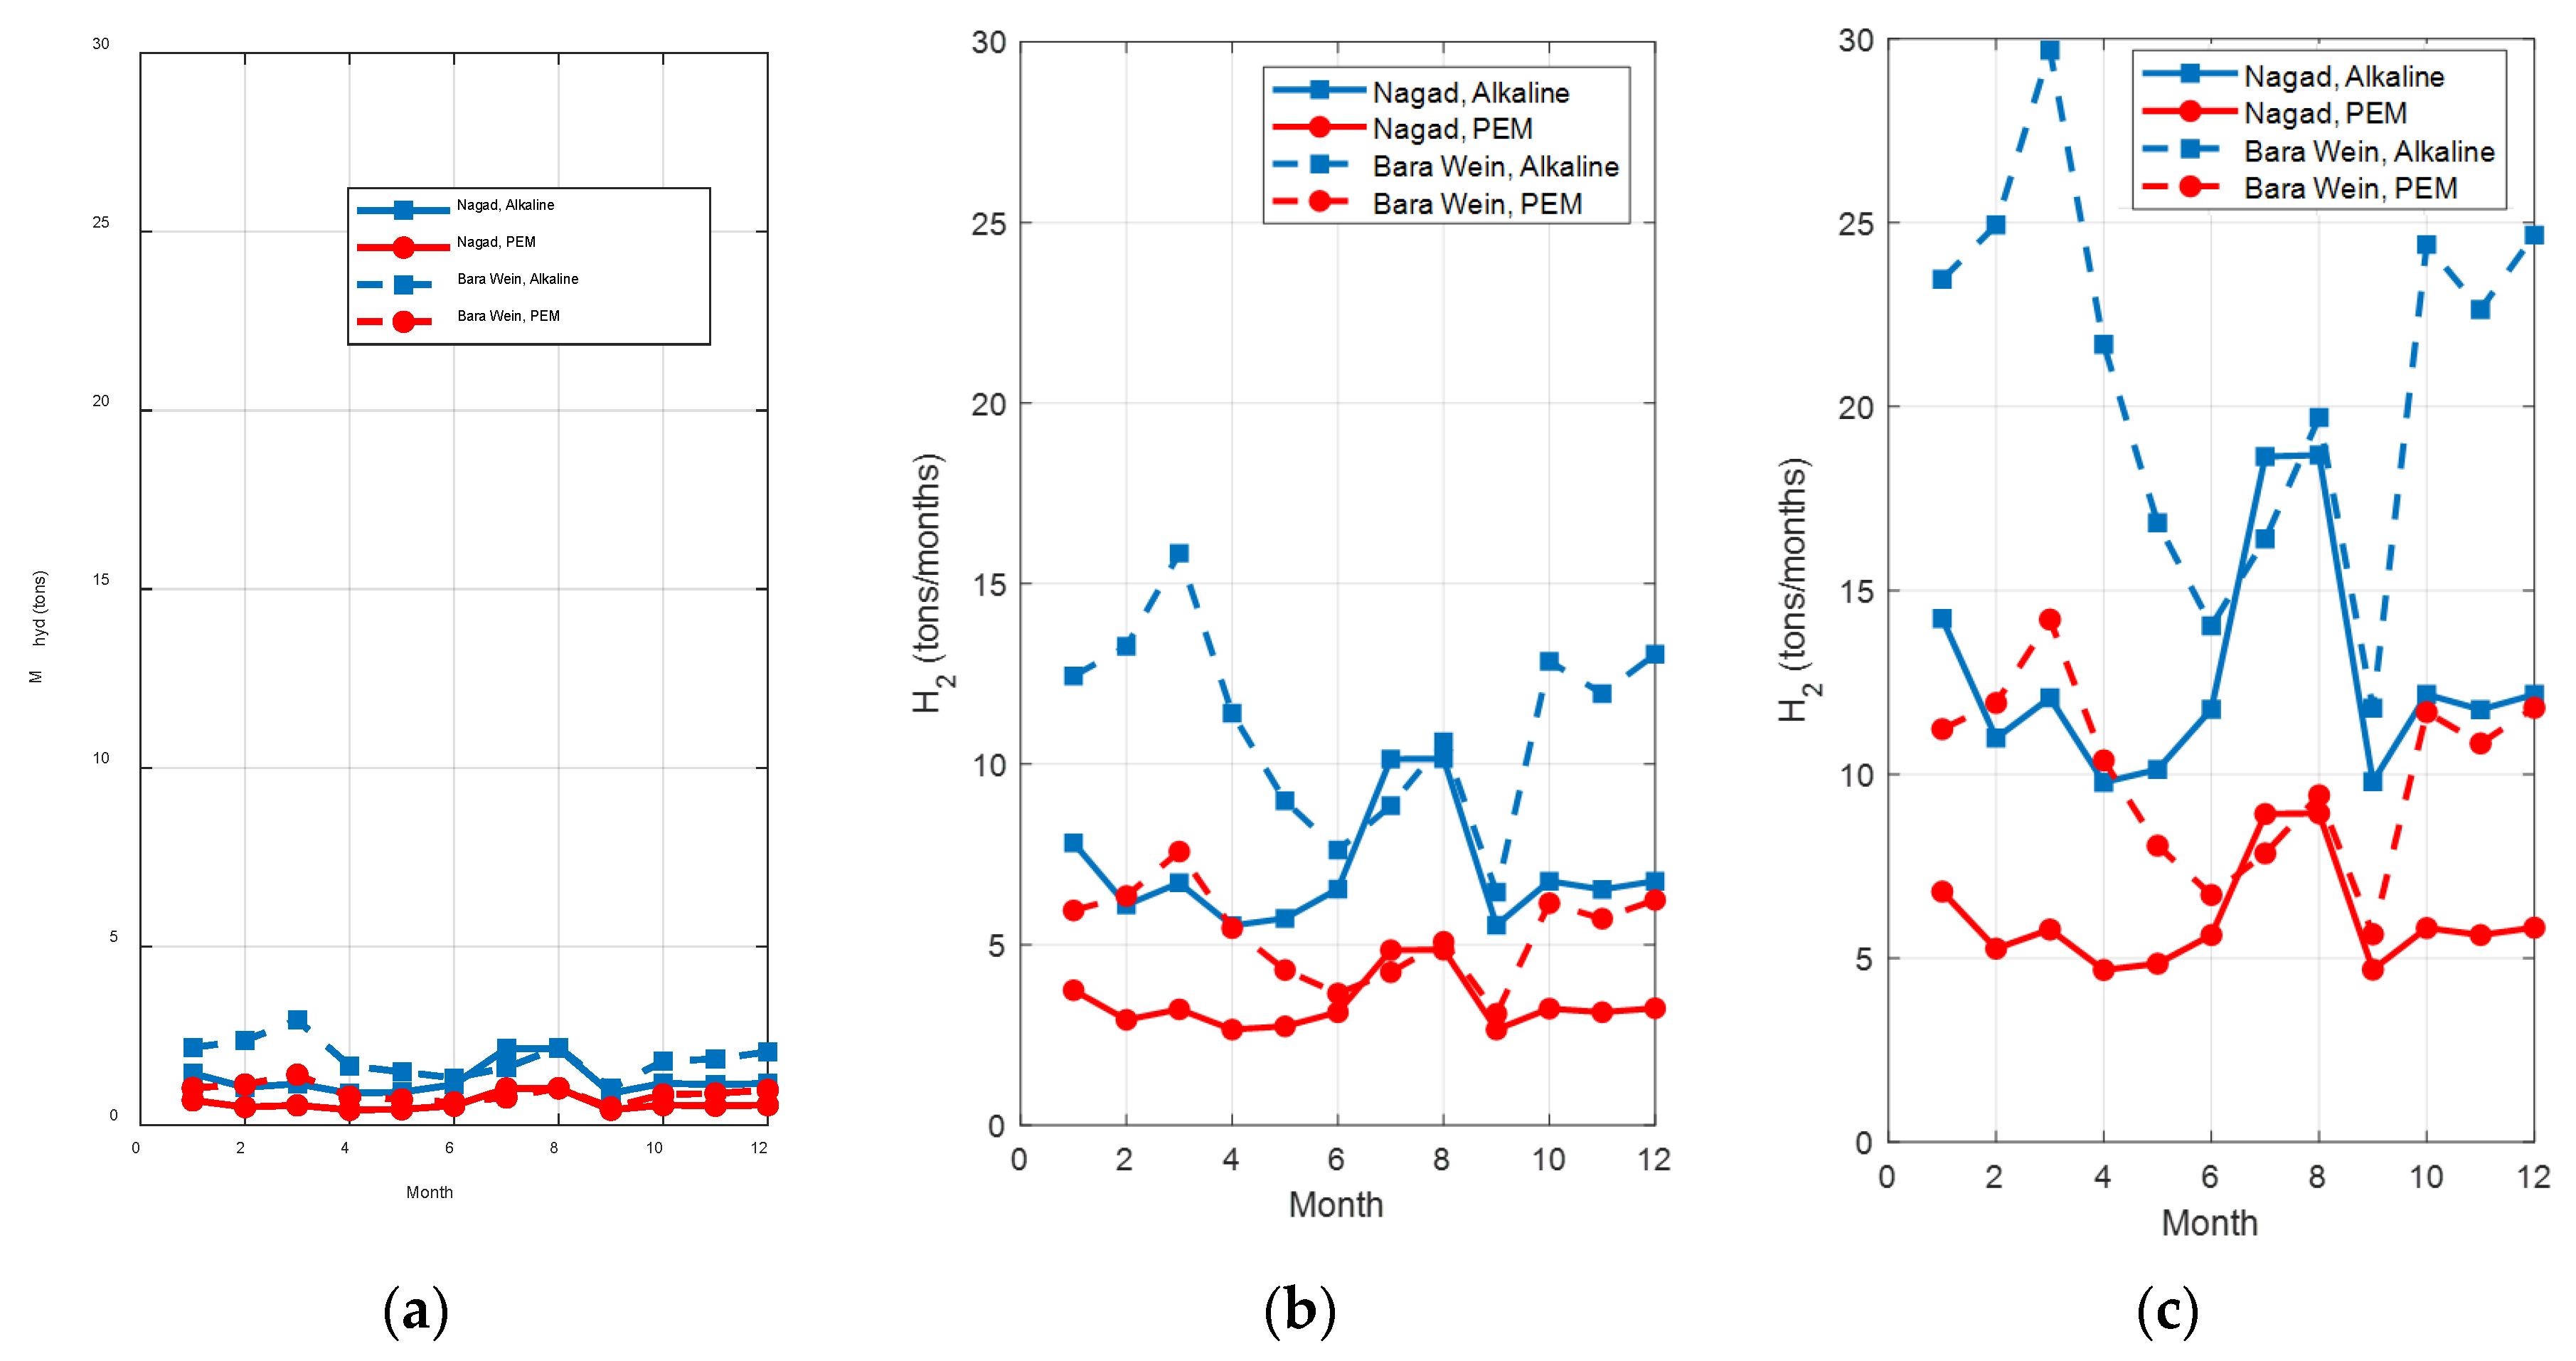
| Sites | Electrolyzer | Wind Turbine | January | February | March | April | May | June | July | August | September | October | November | December | |
|---|---|---|---|---|---|---|---|---|---|---|---|---|---|---|---|
| NAGA NAGAD | Alkaline | Vestas V44 | (tons) | 1.44 | 1.05 | 1.15 | 0.89 | 0.92 | 1.13 | 2.14 | 2.14 | 0.89 | 1.17 | 1.13 | 1.16 |
| LCOH($/kg) | 61.61 | 84.36 | 77 | 99.86 | 96.39 | 78.54 | 41.61 | 41.57 | 99.74 | 76.07 | 78.77 | 76.25 | |||
| De wind 06 | (tons) | 7.82 | 6.10 | 6.71 | 5.53 | 5.73 | 6.54 | 10.14 | 10.15 | 5.54 | 6.76 | 6.53 | 6.76 | ||
| LCOH($/kg) | 23.74 | 30.42 | 27.65 | 33.55 | 32.41 | 28.37 | 18.31 | 18.28 | 33.50 | 27.45 | 28.41 | 27.46 | |||
| Nordex N90 | (tons) | 14.23 | 10.98 | 12.08 | 9.78 | 10.13 | 11.77 | 18.64 | 18.68 | 9.80 | 12.17 | 11.76 | 12.17 | ||
| LCOH($/kg) | 23.96 | 31.05 | 28.26 | 34.84 | 33.66 | 28.96 | 18.29 | 18.25 | 34.79 | 28.01 | 29.00 | 28.02 | |||
| PEM | Vestas V44 | (tons) | 0.69 | 0.50 | 0.55 | 0.42 | 0.44 | 0.54 | 1.02 | 1.02 | 0.42 | 0.56 | 0.54 | 0.55 | |
| LCOH($/kg) | 167.45 | 229.28 | 209.27 | 271.39 | 261.97 | 213.47 | 113.10 | 112.98 | 271.07 | 206.75 | 214.08 | 207.24 | |||
| De wind 06 | (tons) | 3.74 | 2.92 | 3.21 | 2.65 | 2.74 | 3.13 | 4.85 | 4.86 | 2.65 | 3.23 | 3.13 | 3.24 | ||
| LCOH($/kg) | 64.51 | 82.67 | 75.14 | 91.17 | 88.09 | 77.11 | 49.77 | 49.69 | 91.05 | 74.60 | 77.21 | 74.64 | |||
| Nordex N90 | (tons) | 6.81 | 5.26 | 5.78 | 4.68 | 4.85 | 5.63 | 8.92 | 8.94 | 4.69 | 5.82 | 5.63 | 5.83 | ||
| LCOH($/kg) | 65.14 | 84.42 | 76.74 | 94.73 | 91.52 | 78.75 | 49.73 | 49.63 | 94.57 | 76.17 | 78.85 | 76.18 | |||
| BARA WEIN | Alkaline | Vestas V44 | (tons) | 2.17 | 2.37 | 2.94 | 1.66 | 1.49 | 1.32 | 1.61 | 2.17 | 1.03 | 1.79 | 1.85 | 2.05 |
| LCOH($/kg) | 40.92 | 37.48 | 30.19 | 53.49 | 59.30 | 66.98 | 55.01 | 40.93 | 86.05 | 49.62 | 48.03 | 43.22 | |||
| De wind 06 | (tons) | 12.44 | 13.26 | 15.84 | 11.41 | 8.98 | 7.62 | 8.85 | 10.62 | 6.45 | 12.85 | 11.95 | 13.04 | ||
| LCOH($/kg) | 14.92 | 13.99 | 11.72 | 16.26 | 20.67 | 24.36 | 20.97 | 17.48 | 28.76 | 14.44 | 15.53 | 14.24 | |||
| Nordex N90 | (tons) | 23.458 | 24.939 | 29.68 | 21.69 | 16.83 | 14.03 | 16.40 | 19.70 | 11.80 | 24.40 | 22.64 | 24.66 | ||
| LCOH($/kg) | 14.53 | 13.67 | 11.48 | 15.72 | 20.25 | 24.29 | 20.79 | 17.30 | 28.89 | 13.97 | 15.06 | 13.82 | |||
| PEM | Vestas V44 | (tons) | 1.040 | 1.136 | 1.41 | 0.79 | 0.71 | 0.63 | 0.77 | 1.04 | 0.49 | 0.85 | 0.88 | 0.98 | |
| LCOH($/kg) | 111.27 | 101.90 | 82.09 | 145.45 | 161.25 | 182.12 | 149.56 | 111.29 | 233.96 | 134.91 | 130.60 | 117.52 | |||
| De wind 06 | (tons) | 5.95 | 6.35 | 7.58 | 5.46 | 4.30 | 3.65 | 4.24 | 5.08 | 3.09 | 6.15 | 5.72 | 6.24 | ||
| LCOH($/kg) | 40.56 | 38.03 | 31.85 | 44.20 | 56.19 | 66.20 | 56.99 | 47.51 | 78.17 | 39.25 | 42.21 | 38.69 | |||
| Nordex N90 | (tons) | 11.23 | 11.94 | 14.21 | 10.38 | 8.06 | 6.72 | 7.85 | 9.43 | 5.65 | 11.69 | 10.84 | 11.81 | ||
| LCOH($/kg) | 39.52 | 37.17 | 31.23 | 42.74 | 55.05 | 66.05 | 56.53 | 47.05 | 78.55 | 37.99 | 40.94 | 37.59 | |||
References
- Electricity Prices around the World. Available online: https://www.globalpetrolprices.com/electricity_prices/#hl103 (accessed on 13 July 2023).
- Omar, A.I.; David, D.; Vergnault, E.; Virgone, J.; Idriss, A.I. A new set of indicators to evaluate the bioclimatic performance of air-conditioned buildings in a hot and humid climate. J. Build. Eng. 2020, 31, 101350. [Google Scholar] [CrossRef]
- International Renewable Energy Agency. Africa 2030: Roadmap for a Renewable Energy Future. 2015. Available online: www.irena.org/remap (accessed on 13 July 2023).
- INSTAD. Rapport Annuaire Statistique. 2022. Available online: http://www.instad.dj/annstat.html#2019 (accessed on 13 July 2023).
- Dabar, O.A.; Awaleh, M.O.; Waberi, M.M.; Adan, A.-B.I. Wind resource assessment and techno-economic analysis of wind energy and green hydrogen production in the Republic of Djibouti. Energy Rep. 2022, 8, 8996–9016. [Google Scholar] [CrossRef]
- Climate Risk Profile: Djibouti. 2021. Available online: https://climateknowledgeportal.worldbank.org/sites/default/files/2021-02/15722-WB_Djibouti%20Country%20Profile-WEB.pdf (accessed on 24 May 2023).
- Renewable Internal Freshwater Resources per Capita (Cubic Meters)—Djibouti. Available online: https://data.worldbank.org/indicator/ER.H2O.INTR.PC?locations=DJ (accessed on 30 April 2023).
- État d’Avancement des Projets de Résilience à Djibouti. 2022. Available online: https://resilience.igad.int/wp-content/uploads/2023/02/DJIBOUTI_15%C3%A9me-IDDRSI-Rapport_du-CP-1.pdf (accessed on 14 July 2023).
- Catumba, B.D.; Sales, M.B.; Borges, P.T.; Filho, M.N.R.; Lopes, A.A.S.; Rios, M.A.d.S.; Desai, A.S.; Bilal, M.; dos Santos, J.C.S. Sustainability and challenges in hydrogen production: An advanced bibliometric analysis. Int. J. Hydrogen Energy 2023, 48, 7975–7992. [Google Scholar] [CrossRef]
- Qahtan, T.F.; Alade, I.O.; Rahaman, S.; Saleh, T.A. Mapping the research landscape of hydrogen production through electrocatalysis: A decade of progress and key trends. Renew. Sustain. Energy Rev. 2023, 184, 113490. [Google Scholar] [CrossRef]
- Pleshivtseva, Y.; Derevyanov, M.; Pimenov, A.; Rapoport, A. Comparative analysis of global trends in low carbon hydrogen production towards the decarbonization pathway. Int. J. Hydrogen Energy 2023, in press. [Google Scholar] [CrossRef]
- Wilkinson, J.; Mays, T.; McManus, M. Review and meta-analysis of recent life cycle assessments of hydrogen production. Clean. Environ. Syst. 2023, 9, 100116. [Google Scholar] [CrossRef]
- Garcia, G.M.; Oliva, H.S. Technical, economic, and CO2 emissions assessment of green hydrogen production from solar/wind energy: The case of Chile. Energy 2023, 278, 127981. [Google Scholar] [CrossRef]
- Yang, G.; Zhang, H.; Wang, W.; Liu, B.; Lyu, C.; Yang, D. Capacity optimization and economic analysis of PV–hydrogen hybrid systems with physical solar power curve modeling. Energy Convers. Manag. 2023, 288, 117128. [Google Scholar] [CrossRef]
- Kudria, S.; Ivanchenko, I.; Tuchynskyi, B.; Petrenko, K.; Karmazin, O.; Riepkin, O. Resource potential for wind-hydrogen power in Ukraine. Int. J. Hydrogen Energy 2020, 46, 157–168. [Google Scholar] [CrossRef]
- Karayel, G.K.; Javani, N.; Dincer, I. Green hydrogen production potential in Turkey with wind power. Int. J. Green Energy 2022, 20, 129–138. [Google Scholar] [CrossRef]
- Hasan, M.M.; Genç, G. Techno-economic analysis of solar/wind power-based hydrogen production. Fuel 2022, 324, 124564. [Google Scholar] [CrossRef]
- Hassan, Q.; Sameen, A.Z.; Salman, H.M.; Jaszczur, M. Large-scale green hydrogen production via alkaline water electrolysis using solar and wind energy. Int. J. Hydrogen Energy 2023, in press. [Google Scholar] [CrossRef]
- Al-Orabi, A.M.; Osman, M.G.; Sedhom, B.E. Evaluation of green hydrogen production using solar, wind, and hybrid technologies under various technical and financial scenarios for multi-sites in Egypt. Int. J. Hydrogen Energy 2023, in press. [Google Scholar] [CrossRef]
- Nasser, M.; Megahed, T.F.; Ookawara, S.; Hassan, H. Performance evaluation of PV panels/wind turbines hybrid system for green hydrogen generation and storage: Energy, exergy, economic, and enviroeconomic. Energy Convers. Manag. 2022, 267, 115870. [Google Scholar] [CrossRef]
- Ahshan, R.; Onen, A.; Al-Badi, A.H. Assessment of wind-to-hydrogen (Wind-H2) generation prospects in the Sultanate of Oman. Renew. Energy 2022, 200, 271–282. [Google Scholar] [CrossRef]
- Wu, X.; Guo, Y.; Sun, Z.; Xie, F.; Guan, D.; Dai, J.; Yu, F.; Hu, Z.; Huang, Y.-C.; Pao, C.-W.; et al. Fast operando spectroscopy tracking in situ generation of rich defects in silver nanocrystals for highly selective electrochemical CO2 reduction. Nat. Commun. 2021, 12, 660. [Google Scholar] [CrossRef] [PubMed]
- Bicer, Y.; Dincer, I. Clean fuel options with hydrogen for sea transportation: A life cycle approach. Int. J. Hydrogen Energy 2018, 43, 1179–1193. [Google Scholar] [CrossRef]
- Hanley, E.S.; Deane, J.P.; Gallachóir, B.P.Ó. The role of hydrogen in low carbon energy futures—A review of existing perspectives. Renew. Sustain. Energy Rev. 2018, 82, 3027–3045. [Google Scholar] [CrossRef]
- Mukelabai, M.D.; Wijayantha, U.K.; Blanchard, R.E. Renewable hydrogen economy outlook in Africa. Renew. Sustain. Energy Rev. 2022, 167, 112705. [Google Scholar] [CrossRef]
- Guan, D.; Xu, H.; Zhang, Q.; Huang, Y.; Shi, C.; Chang, Y.; Xu, X.; Tang, J.; Gu, Y.; Pao, C.; et al. Identifying A Universal Activity Descriptor and a Unifying Mechanism Concept on Perovskite Oxides for Green Hydrogen Production. Adv. Mater. 2023, e2305074. [Google Scholar] [CrossRef]
- Koholé, Y.W.; Fohagui, F.C.V.; Djiela, R.H.T.; Tchuen, G. Wind energy potential assessment for co-generation of electricity and hydrogen in the far North region of Cameroon. Energy Convers. Manag. 2023, 279, 116765. [Google Scholar] [CrossRef]
- Boudries, R. Techno-economic study of hydrogen production using CSP technology. Int. J. Hydrogen Energy 2018, 43, 3406–3417. [Google Scholar] [CrossRef]
- Almutairi, K.; Dehshiri, S.S.H.; Mostafaeipour, A.; Jahangiri, M.; Techato, K. Technical, economic, carbon footprint assessment, and prioritizing stations for hydrogen production using wind energy: A case study. Energy Strat. Rev. 2021, 36, 100684. [Google Scholar] [CrossRef]
- Rezaei, M.; Naghdi-Khozani, N.; Jafari, N. Wind energy utilization for hydrogen production in an underdeveloped country: An economic investigation. Renew. Energy 2019, 147, 1044–1057. [Google Scholar] [CrossRef]
- Mohsin, M.; Rasheed, A.; Saidur, R. Economic viability and production capacity of wind generated renewable hydrogen. Int. J. Hydrogen Energy 2018, 43, 2621–2630. [Google Scholar] [CrossRef]
- Krishan, O.; Suhag, S. Techno-economic analysis of a hybrid renewable energy system for an energy poor rural community. J. Energy Storage 2019, 23, 305–319. [Google Scholar] [CrossRef]
- Idriss, A.I.; Ahmed, R.A.; Omar, A.I.; Said, R.K.; Akinci, T.C. Wind energy potential and micro-turbine performance analysis in Djibouti-city, Djibouti. Eng. Sci. Technol. Int. J. 2019, 23, 65–70. [Google Scholar] [CrossRef]
- Samy, M.; Barakat, S.; Ramadan, H. Techno-economic analysis for rustic electrification in Egypt using multi-source renewable energy based on PV/ wind/ FC. Int. J. Hydrogen Energy 2019, 45, 11471–11483. [Google Scholar] [CrossRef]
- Fopah-Lele, A.; Kabore-Kere, A.; Tamba, J.G.; Yaya-Nadjo, I. Solar electricity storage through green hydrogen production: A case study. Int. J. Energy Res. 2021, 45, 13007–13021. [Google Scholar] [CrossRef]
- Kotowicz, J.; Jurczyk, M.; Węcel, D. The possibilities of cooperation between a hydrogen generator and a wind farm. Int. J. Hydrogen Energy 2020, 46, 7047–7059. [Google Scholar] [CrossRef]
- Luo, Z.; Wang, X.; Wen, H.; Pei, A. Hydrogen production from offshore wind power in South China. Int. J. Hydrogen Energy 2022, 47, 24558–24568. [Google Scholar] [CrossRef]
- Zhang, S.; Li, K.; Zhu, P.; Dai, M.; Liu, G. An efficient hydrogen production process using solar thermo-electrochemical water-splitting cycle and its techno-economic analyses and multi-objective optimization. Energy Convers. Manag. 2022, 266, 115859. [Google Scholar] [CrossRef]
- Nasser, M.; Megahed, T.F.; Ookawara, S.; Hassan, H. A review of water electrolysis–based systems for hydrogen production using hybrid/solar/wind energy systems. Environ. Sci. Pollut. Res. 2022, 29, 86994–87018. [Google Scholar] [CrossRef]
- Javaid, A.; Javaid, U.; Sajid, M.; Rashid, M.; Uddin, E.; Ayaz, Y.; Waqas, A. Forecasting Hydrogen Production from Wind Energy in a Suburban Environment Using Machine Learning. Energies 2022, 15, 8901. [Google Scholar] [CrossRef]
- Cheng, C.; Hughes, L. The role for offshore wind power in renewable hydrogen production in Australia. J. Clean. Prod. 2023, 391, 136223. [Google Scholar] [CrossRef]
- Delpierre, M.; Quist, J.; Mertens, J.; Prieur-Vernat, A.; Cucurachi, S. Assessing the environmental impacts of wind-based hydrogen production in the Netherlands using ex-ante LCA and scenarios analysis. J. Clean. Prod. 2021, 299, 126866. [Google Scholar] [CrossRef]
- Daher, D.H.; Gaillard, L.; Ménézo, C. Experimental assessment of long-term performance degradation for a PV power plant operating in a desert maritime climate. Renew. Energy 2022, 187, 44–55. [Google Scholar] [CrossRef]
- Sridharan, V.; Broad, O.; Shivakumar, A.; Howells, M.; Boehlert, B.; Groves, D.G.; Rogner, H.-H.; Taliotis, C.; Neumann, J.E.; Strzepek, K.M.; et al. Resilience of the Eastern African electricity sector to climate driven changes in hydropower generation. Nat. Commun. 2019, 10, 302. [Google Scholar] [CrossRef]
- Benti, N.E.; Woldegiyorgis, T.A.; Geffe, C.A.; Gurmesa, G.S.; Chaka, M.D.; Mekonnen, Y.S. Overview of geothermal resources utilization in Ethiopia: Potentials, opportunities, and challenges. Sci. Afr. 2023, 19, e01562. [Google Scholar] [CrossRef]
- Murshed, M.; Ozturk, I. Rethinking energy poverty reduction through improving electricity accessibility: A regional analysis on selected African nations. Energy 2023, 267, 126547. [Google Scholar] [CrossRef]
- Idriss, A.I.; Mohamed, A.A.; Akinci, T.C.; Ahmed, R.A.; Omar, A.I.; Caglar, R.; Seker, S. Accuracy of eight probability distribution functions for modeling wind speed data in Djibouti. Int. J. Renew. Energy Res. 2020, 10, 780–790. [Google Scholar] [CrossRef]
- Ali, B.; Abbas, G.; Memon, A.; Mirsaeidi, S.; Koondhar, M.A.; Chandio, S.; Channa, I.A. A comparative study to analyze wind potential of different wind corridors. Energy Rep. 2023, 9, 1157–1170. [Google Scholar] [CrossRef]
- Barasa, M.; Bogdanov, D.; Oyewo, A.S.; Breyer, C. A cost optimal resolution for Sub-Saharan Africa powered by 100% renewables in 2030. Renew. Sustain. Energy Rev. 2018, 92, 440–457. [Google Scholar] [CrossRef]
- Jang, D.; Kim, J.; Kim, D.; Han, W.-B.; Kang, S. Techno-economic analysis and Monte Carlo simulation of green hydrogen production technology through various water electrolysis technologies. Energy Convers. Manag. 2022, 258, 115499. [Google Scholar] [CrossRef]
- Gebrehiwot, K.; Mondal, A.H.; Ringler, C.; Gebremeskel, A.G. Optimization and cost-benefit assessment of hybrid power systems for off-grid rural electrification in Ethiopia. Energy 2019, 177, 234–246. [Google Scholar] [CrossRef]
- Rapport Annuel. Available online: https://banque-centrale.dj/wp-content/uploads/2019/10/BCD-Rapport-Annuel-2018_Proof-3.pdf (accessed on 24 March 2023).
- Gul, M.; Tai, N.; Huang, W.; Nadeem, M.H.; Yu, M. Assessment of Wind Power Potential and Economic Analysis at Hyderabad in Pakistan: Powering to Local Communities Using Wind Power. Sustainability 2019, 11, 1391. [Google Scholar] [CrossRef]
- Villena-Ruiz, R.; Ramirez, F.J.; Honrubia-Escribano, A.; Gómez-Lázaro, E. A techno-economic analysis of a real wind farm repowering experience: The Malpica case. Energy Convers. Manag. 2018, 172, 182–199. [Google Scholar] [CrossRef]
- Wang, T.; Cao, X.; Jiao, L. PEM water electrolysis for hydrogen production: Fundamentals, advances, and prospects. Carbon Neutrality 2022, 1, 21. [Google Scholar] [CrossRef]
- Bhandari, R.; Shah, R.R. Hydrogen as energy carrier: Techno-economic assessment of decentralized hydrogen production in Germany. Renew. Energy 2021, 177, 915–931. [Google Scholar] [CrossRef]
- Kumar, S.S.; Himabindu, V. Hydrogen production by PEM water electrolysis—A review. Mater. Sci. Energy Technol. 2019, 2, 442–454. [Google Scholar] [CrossRef]
- Zhao, P.; Wang, J.; He, W.; Xia, H.; Cao, X.; Li, Y.; Sun, L. Magnetic field Pre-polarization enhances the efficiency of alkaline water electrolysis for hydrogen production. Energy Convers. Manag. 2023, 283, 116906. [Google Scholar] [CrossRef]
- Lee, B.; Cho, H.-S.; Kim, H.; Lim, D.; Cho, W.; Kim, C.-H.; Lim, H. Integrative techno-economic and environmental assessment for green H2 production by alkaline water electrolysis based on experimental data. J. Environ. Chem. Eng. 2021, 9, 106349. [Google Scholar] [CrossRef]


| References | [32] | [33] | [31] | [34] | [35] | [36] | [37] | [38] | In this Study |
|---|---|---|---|---|---|---|---|---|---|
| Country | India | Djibouti | Pakistan | Egypt | Benin | Poland | South China | West China | Djibouti |
| Assessment of wind speed | ✔ | ✔ | ✔ | ✔ | ✔ | ✔ | ✔ | ||
| Wind power investigation | ✔ | ✔ | ✔ | ✔ | ✔ | ✔ | ✔ | ||
| Techno-economic analysis | ✔ | ✔ | ✔ | ✔ | ✔ | ✔ | ✔ | ✔ | |
| Electrolyzer Alkaline | ** | ✔ | ** | ✔ | |||||
| Electrolyzer PEM | ✔ | ✔ | ✔ | ✔ | ✔ | ||||
| Hydrogen | ✔ | ✔ | ✔ | ✔ | ✔ | ✔ | ✔ | ||
| Hydrogen cost | ✔ | ✔ | ✔ | ✔ | ✔ | ✔ | |||
| Carbon Dioxide emission reduction | ✔ |
| Performances Measures | Equations | No. |
|---|---|---|
| Probability density function [28,48] | (1) | |
| Cumulative distribution function [28,32] | (2) | |
| Energy pattern factor [33] | (3) | |
| Vertical extrapolation of wind speed [32] | with = 0.14 | (4) |
| Weibull shape parameter [31,33] | (5) | |
| Weibull scale parameter [31,33] | (6) | |
| scale parameter at extrapolated height [31,34] | (7) | |
| shape parameter at extrapolated height [34,35] | (8) | |
| Exponent [31] | (9) | |
| Average power output [36,37] | (10) | |
| Capacity factor [36,37] | (11) | |
| Energy output [38] | (12) | |
| Present Value Cost [38] | (13) | |
| Levelized cost of electricity [38,49,50,51] | (14) | |
| Amount of hydrogen produced by wind turbine [31,35,37] | (15) | |
| Levelized cost of hydrogen [31,35,37,38] | with and | (16) |
| Carbon dioxide emission reduction from wind energy [5,52] | (17) |
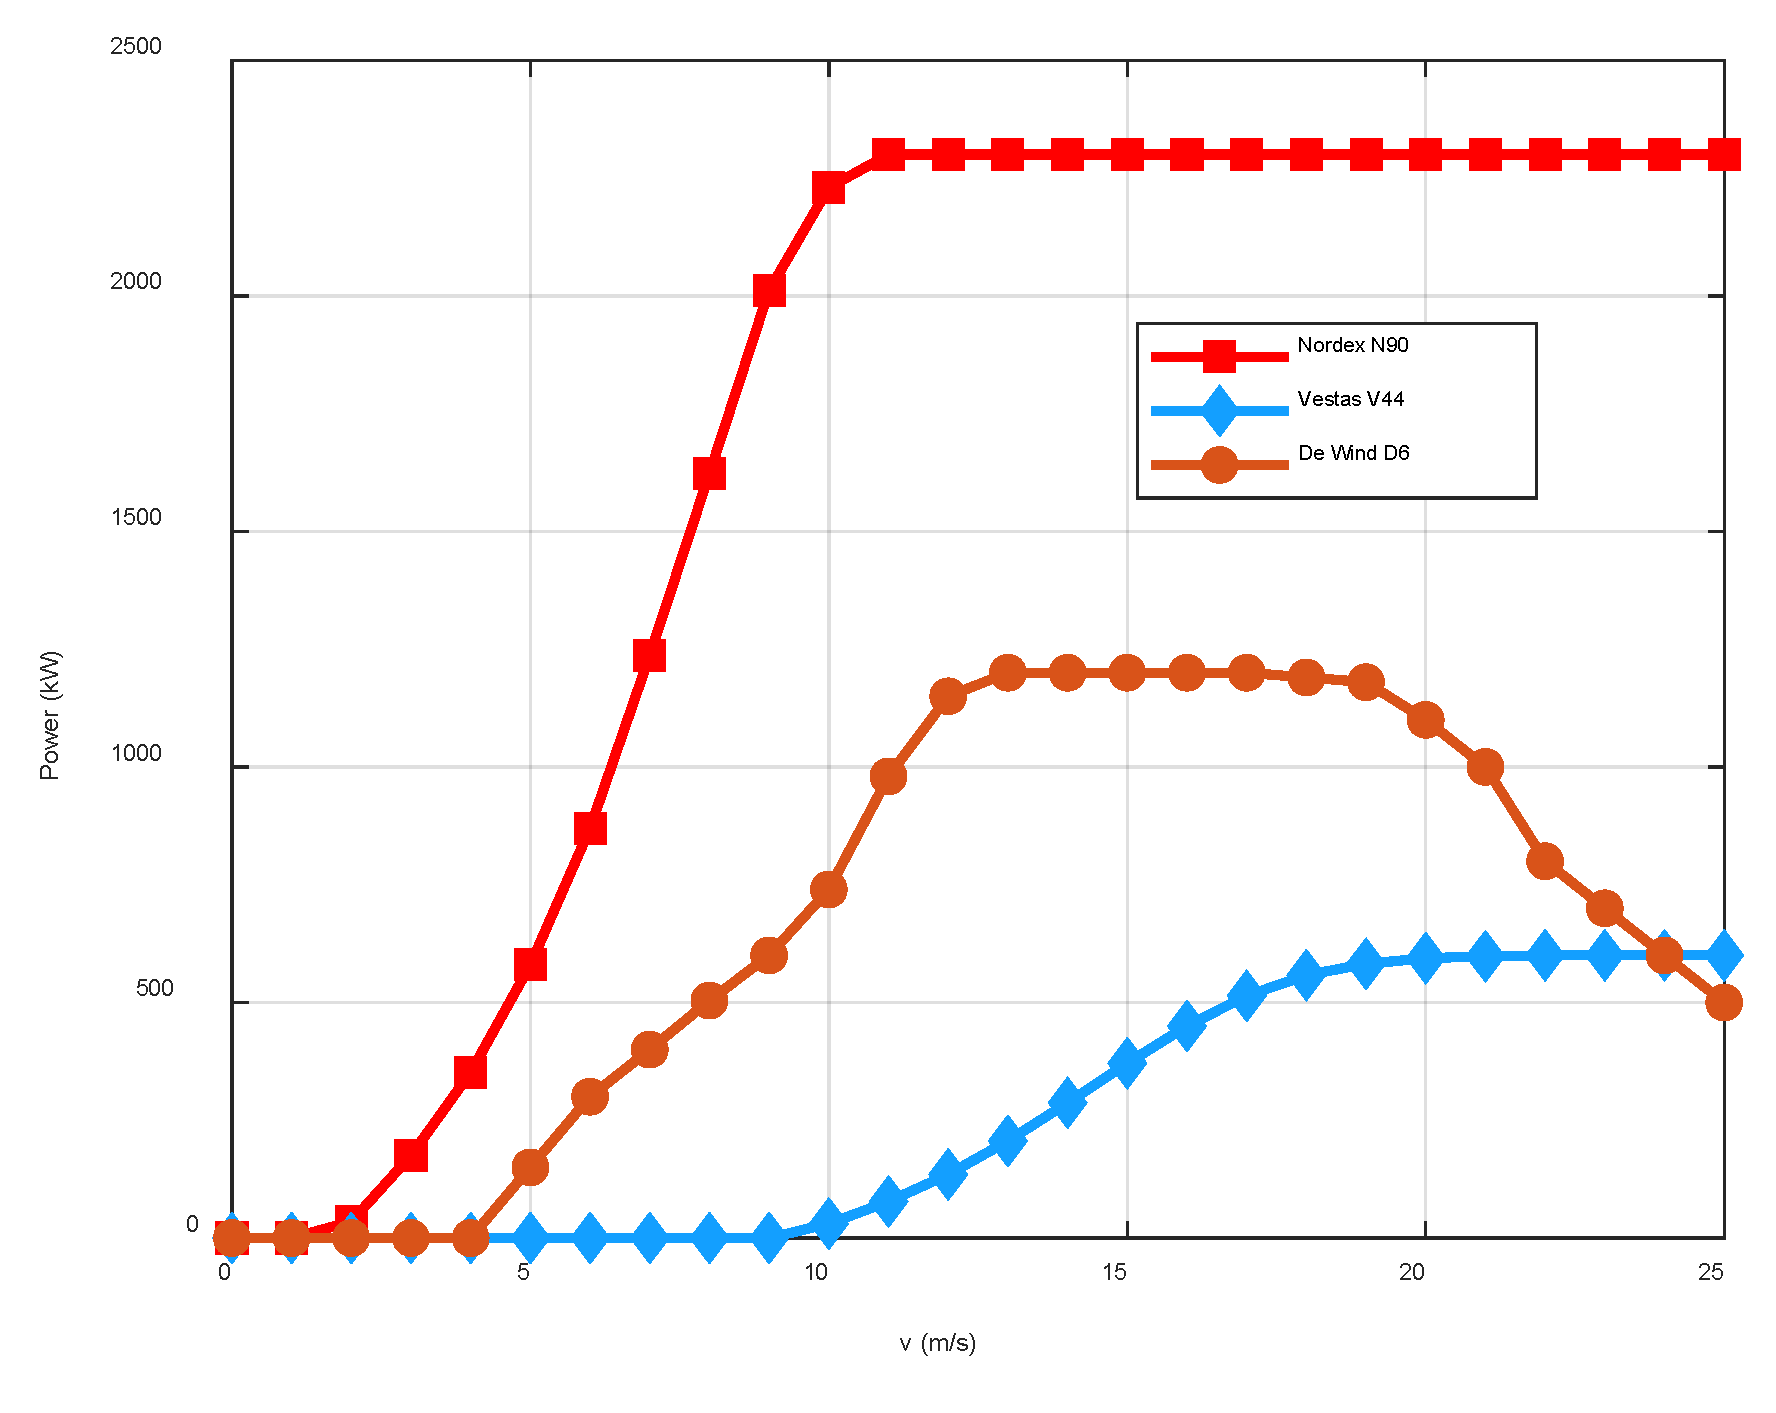
| Turbine Model | Vcut-i | Vrated | Vcut-o | Hub | PeR | Lifetime | Price |
|---|---|---|---|---|---|---|---|
| (m/s) | (m/s) | (m/s) | (m) | (kW) | (yr) | ($) | |
| Vestas V44 | 5 | 17 | 20 | 50 | 600 | 20 | 37,016 |
| De Wind D6 | 2.8 | 12.5 | 25 | 65 | 1250 | 20 | 986,000 |
| Nordex N90 | 4 | 13 | 25 | 80 | 2300 | 20 | 228,000 |
Disclaimer/Publisher’s Note: The statements, opinions and data contained in all publications are solely those of the individual author(s) and contributor(s) and not of MDPI and/or the editor(s). MDPI and/or the editor(s) disclaim responsibility for any injury to people or property resulting from any ideas, methods, instructions or products referred to in the content. |
© 2023 by the authors. Licensee MDPI, Basel, Switzerland. This article is an open access article distributed under the terms and conditions of the Creative Commons Attribution (CC BY) license (https://creativecommons.org/licenses/by/4.0/).
Share and Cite
Idriss, A.I.; Ahmed, R.A.; Atteyeh, H.A.; Mohamed, O.A.; Ramadan, H.S.M. Techno-Economic Potential of Wind-Based Green Hydrogen Production in Djibouti: Literature Review and Case Studies. Energies 2023, 16, 6055. https://doi.org/10.3390/en16166055
Idriss AI, Ahmed RA, Atteyeh HA, Mohamed OA, Ramadan HSM. Techno-Economic Potential of Wind-Based Green Hydrogen Production in Djibouti: Literature Review and Case Studies. Energies. 2023; 16(16):6055. https://doi.org/10.3390/en16166055
Chicago/Turabian StyleIdriss, Abdoulkader Ibrahim, Ramadan Ali Ahmed, Hamda Abdi Atteyeh, Omar Abdoulkader Mohamed, and Haitham Saad Mohamed Ramadan. 2023. "Techno-Economic Potential of Wind-Based Green Hydrogen Production in Djibouti: Literature Review and Case Studies" Energies 16, no. 16: 6055. https://doi.org/10.3390/en16166055
APA StyleIdriss, A. I., Ahmed, R. A., Atteyeh, H. A., Mohamed, O. A., & Ramadan, H. S. M. (2023). Techno-Economic Potential of Wind-Based Green Hydrogen Production in Djibouti: Literature Review and Case Studies. Energies, 16(16), 6055. https://doi.org/10.3390/en16166055