1. Introduction
The Green Deal pact aims to decarbonize the European Union’s energy system to reduce greenhouse gas emissions. According to the statistics, the energy system (electricity, heat, cold, gas, solid, and liquid fuel) [
1] is responsible for 75% of greenhouse gas emissions [
2]. The first step is to integrate systems at European level and invest in renewable energy [
3,
4].
In Romania, most of the electricity produced in 2022 was from green sources according to the Green Deal [
5]. Coal electricity production [
6] accounted for only 19% of the total energy production. Carbon neutrality can be achieved by exploiting all available green energy sources [
7]. At the same time, clean energy sources (wind, sun, and water) that can be converted into electricity have a variable component: availability [
8,
9,
10]. This means we can produce electricity when we have the raw material. And yet it is not all about producing electricity. Simultaneously, we must have a balance between what we produce and what we consume. The objective of this work is to study how the energy production capacities in Romania will work according to the energy production in 2022. Under the targets set by the Green Deal, coal power plants should be phased out by 2025. However, due to energy instability in Europe, this is likely to be delayed.
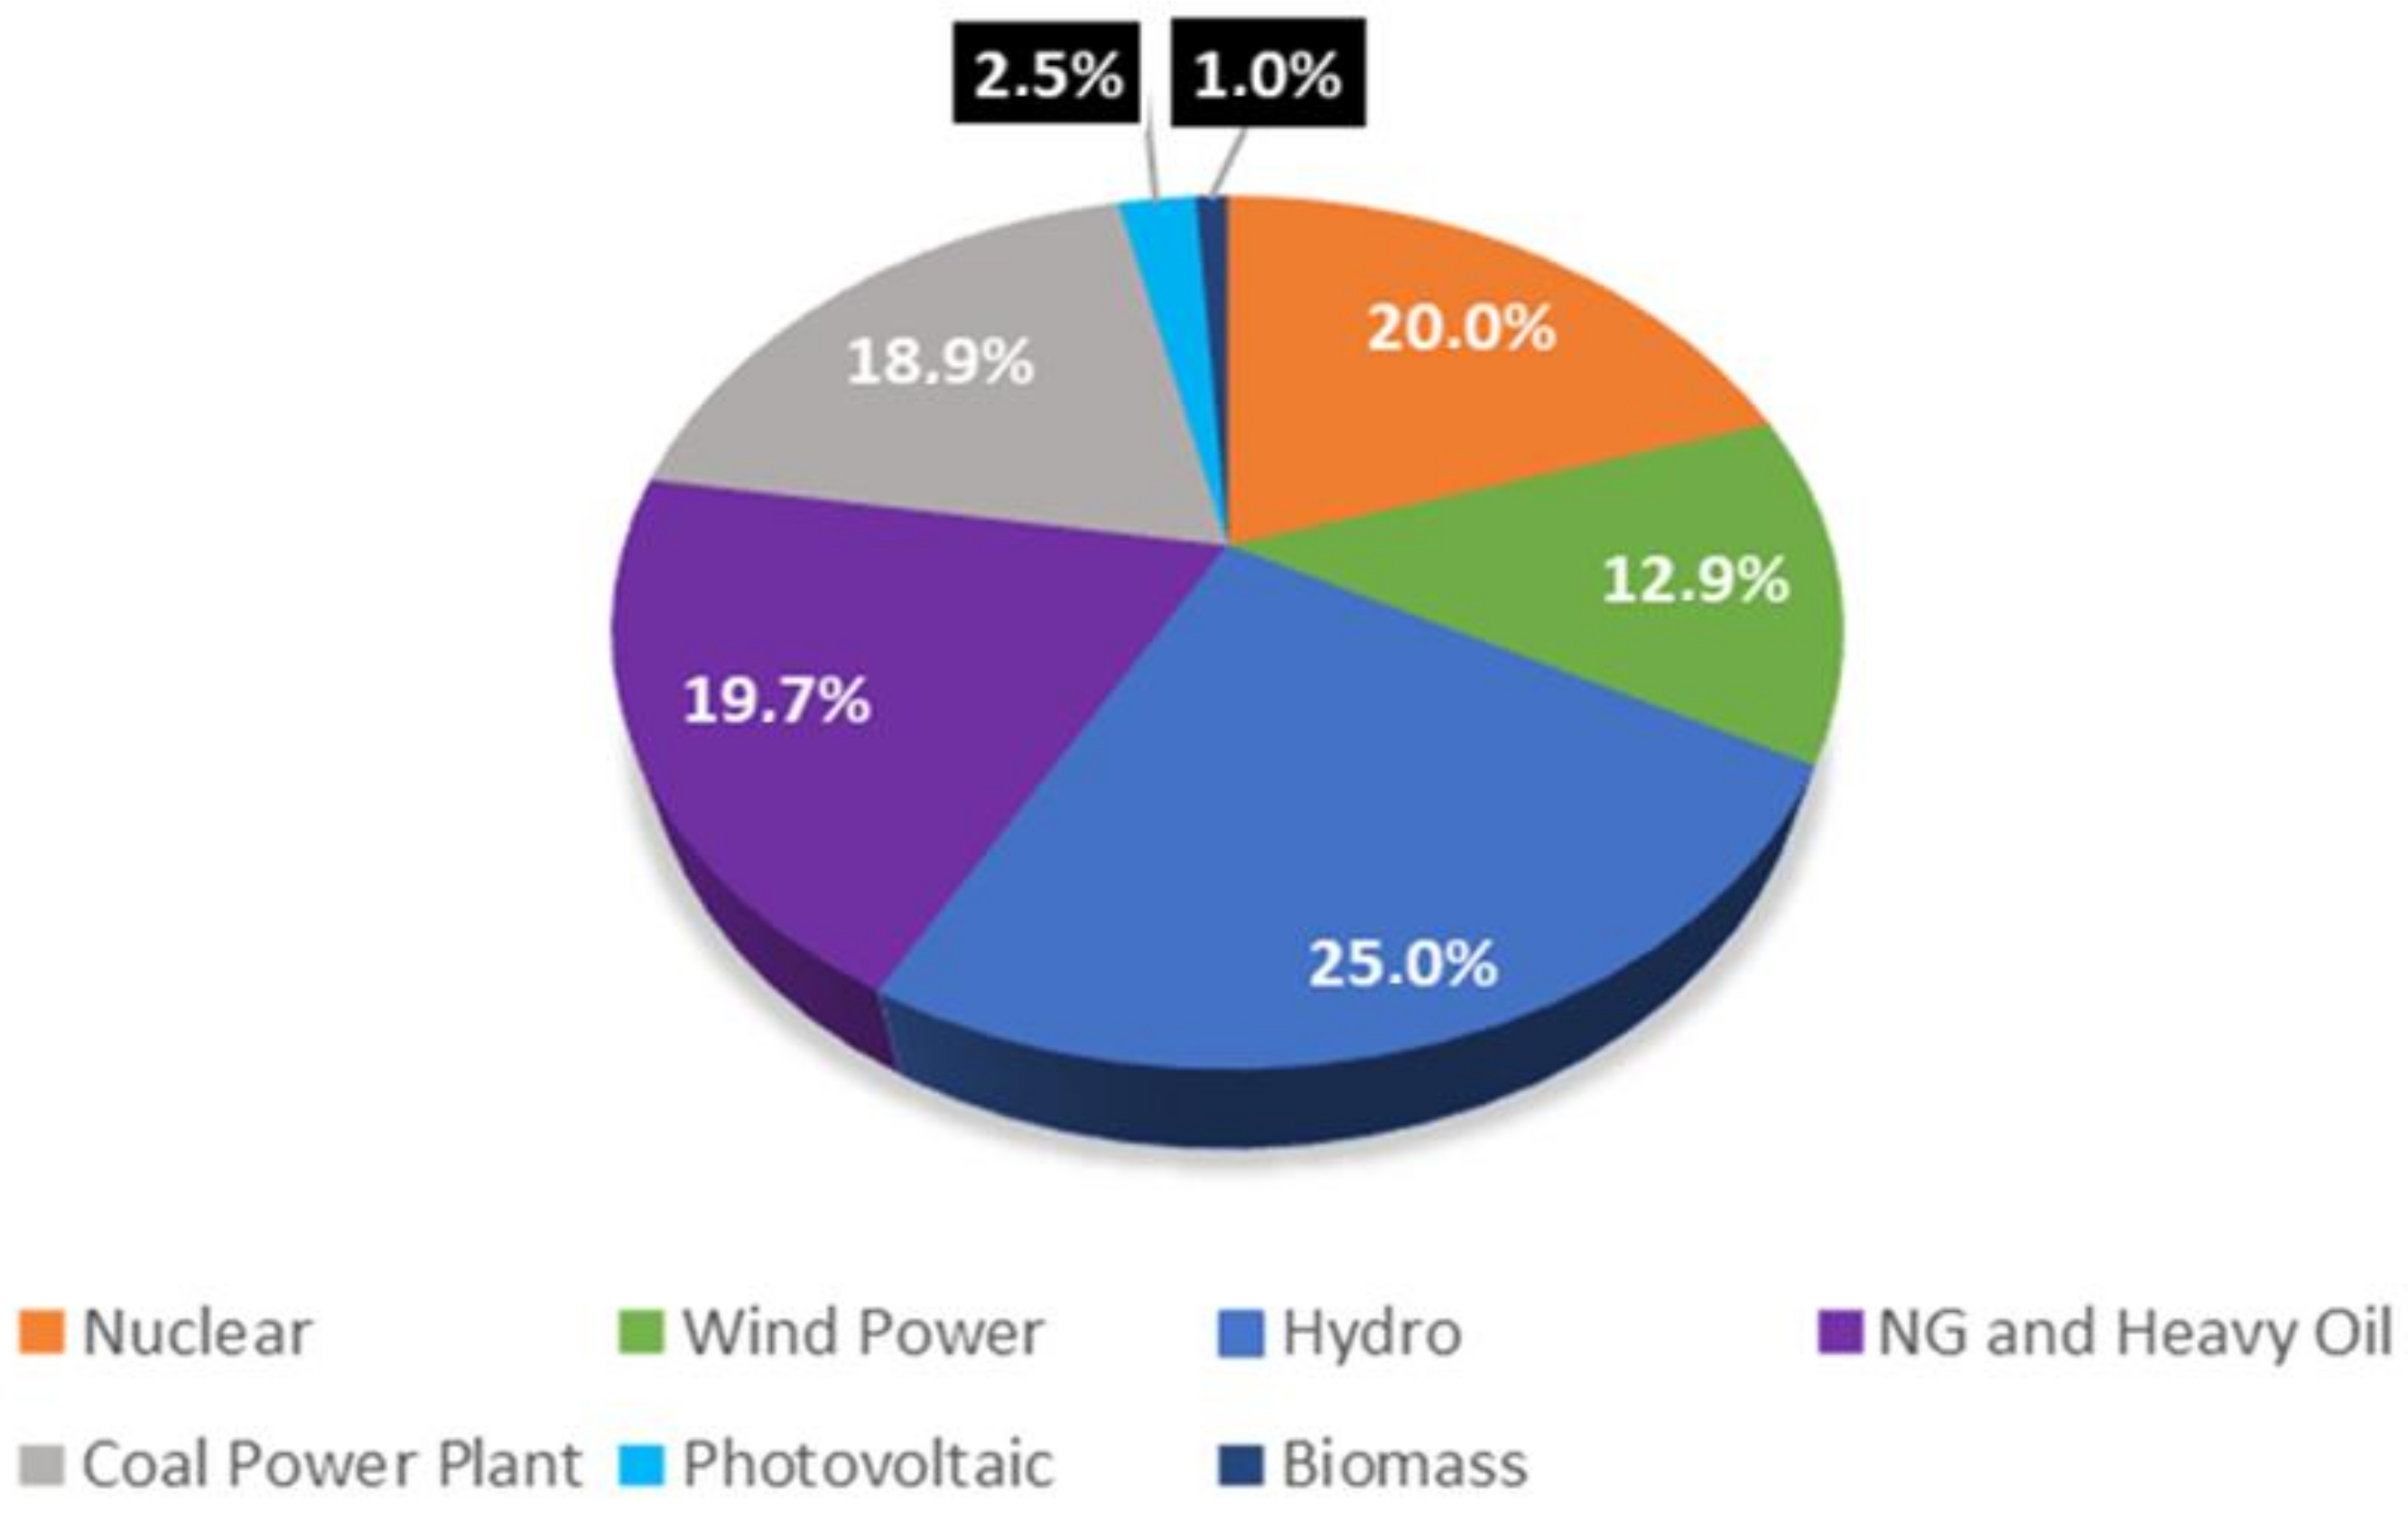
The electricity produced in Romania in 2022 uses five main groups of resources: hydro, nuclear, and hydrocarbons (natural gas and heavy oil). Energy produced with photovoltaic panels represents only 2%, while energy production using biomass represents only 1% of the total energy produced. The share of these sources can be seen in
Figure 1. The Green Deal regulations classify nuclear and natural gas electricity as green in addition to wind, solar, and other renewable energy.
Following the armed conflict between Russia and Ukraine—a conflict that has shaken not only Europe but the entire world—the European Union has imposed a series of eco-nomic sanctions against Russia [
11]. The embargo on hydrocarbon (oil and natural gas) has led to accelerated inflation. The fuel prices have risen to double its price, followed by electricity and gas, due to this unfortunate event, whose major consequences has impacted the domestic consumer [
12]. According to Trading Economics [
13], shortly after the implementation of the embargo, the price of natural gas in Europe increased by 150% (February 2022), the conflict has advanced, and in August the highest price was recorded at 339 EUR/MWh, representing a 277% increase compared to January. At the same time, the European Union has been looking for methods to supplement NG needs and cap prices [
14,
15]. Thus, in December, there was a 23% increase compared to January 2022.
According to
Figure 1, the largest energy producer in Romania using hydropower as a primary energy source is Hidroelectrica. Hydropower plants have a maximum installed capacity of 6.2 GW, but energy production is generally at half that.
The second largest electricity producer in Romania is Nuclearelectrica. It operates two CANDU nuclear reactors using natural uranium. Each reactor has an installed electrical capacity of 706 MW and a lifetime of 30 years. The no. one unit at Cernavoda was commissioned in 1996. In 2026, the unit will reach the end of its operational life and will need to be upgraded to run for another 30 years. With the shutdown of reactor number 1, the energy produced by the plant drops to 0.7 GW, requiring additional electricity generation. However, the planned outage for modernization is 2 years. Furthermore, reactor number 3 is expected to be commissioned from 2030 and reactor 4 from 2031.
Hydrocarbon electricity (natural gas and heavy oil) has a very high share of 19.7% of total energy, while coal-fired electricity accounts for 18.9%. However, it should be noted that one of the most modern cogeneration thermal power plants [
16,
17] was completed in 2012 in Brazi. This unit has an installed power of 860 MW, representing more than 10% of the country’s needs.
The electricity produced by wind turbines represents 12.9% of the electricity produced. The variable operating profile of wind turbines is analysed in the second part of the paper. In the cold months, these produced more than 2.5 GW instantaneous power, with a monthly average of more than 1 GW.
2. Analysis of Electricity Production and Consumption
The second part of this paper focuses on a detailed analysis of how energy is produced depending on the primary source and consumer demand. The statistics are reported for 2022 [
18].
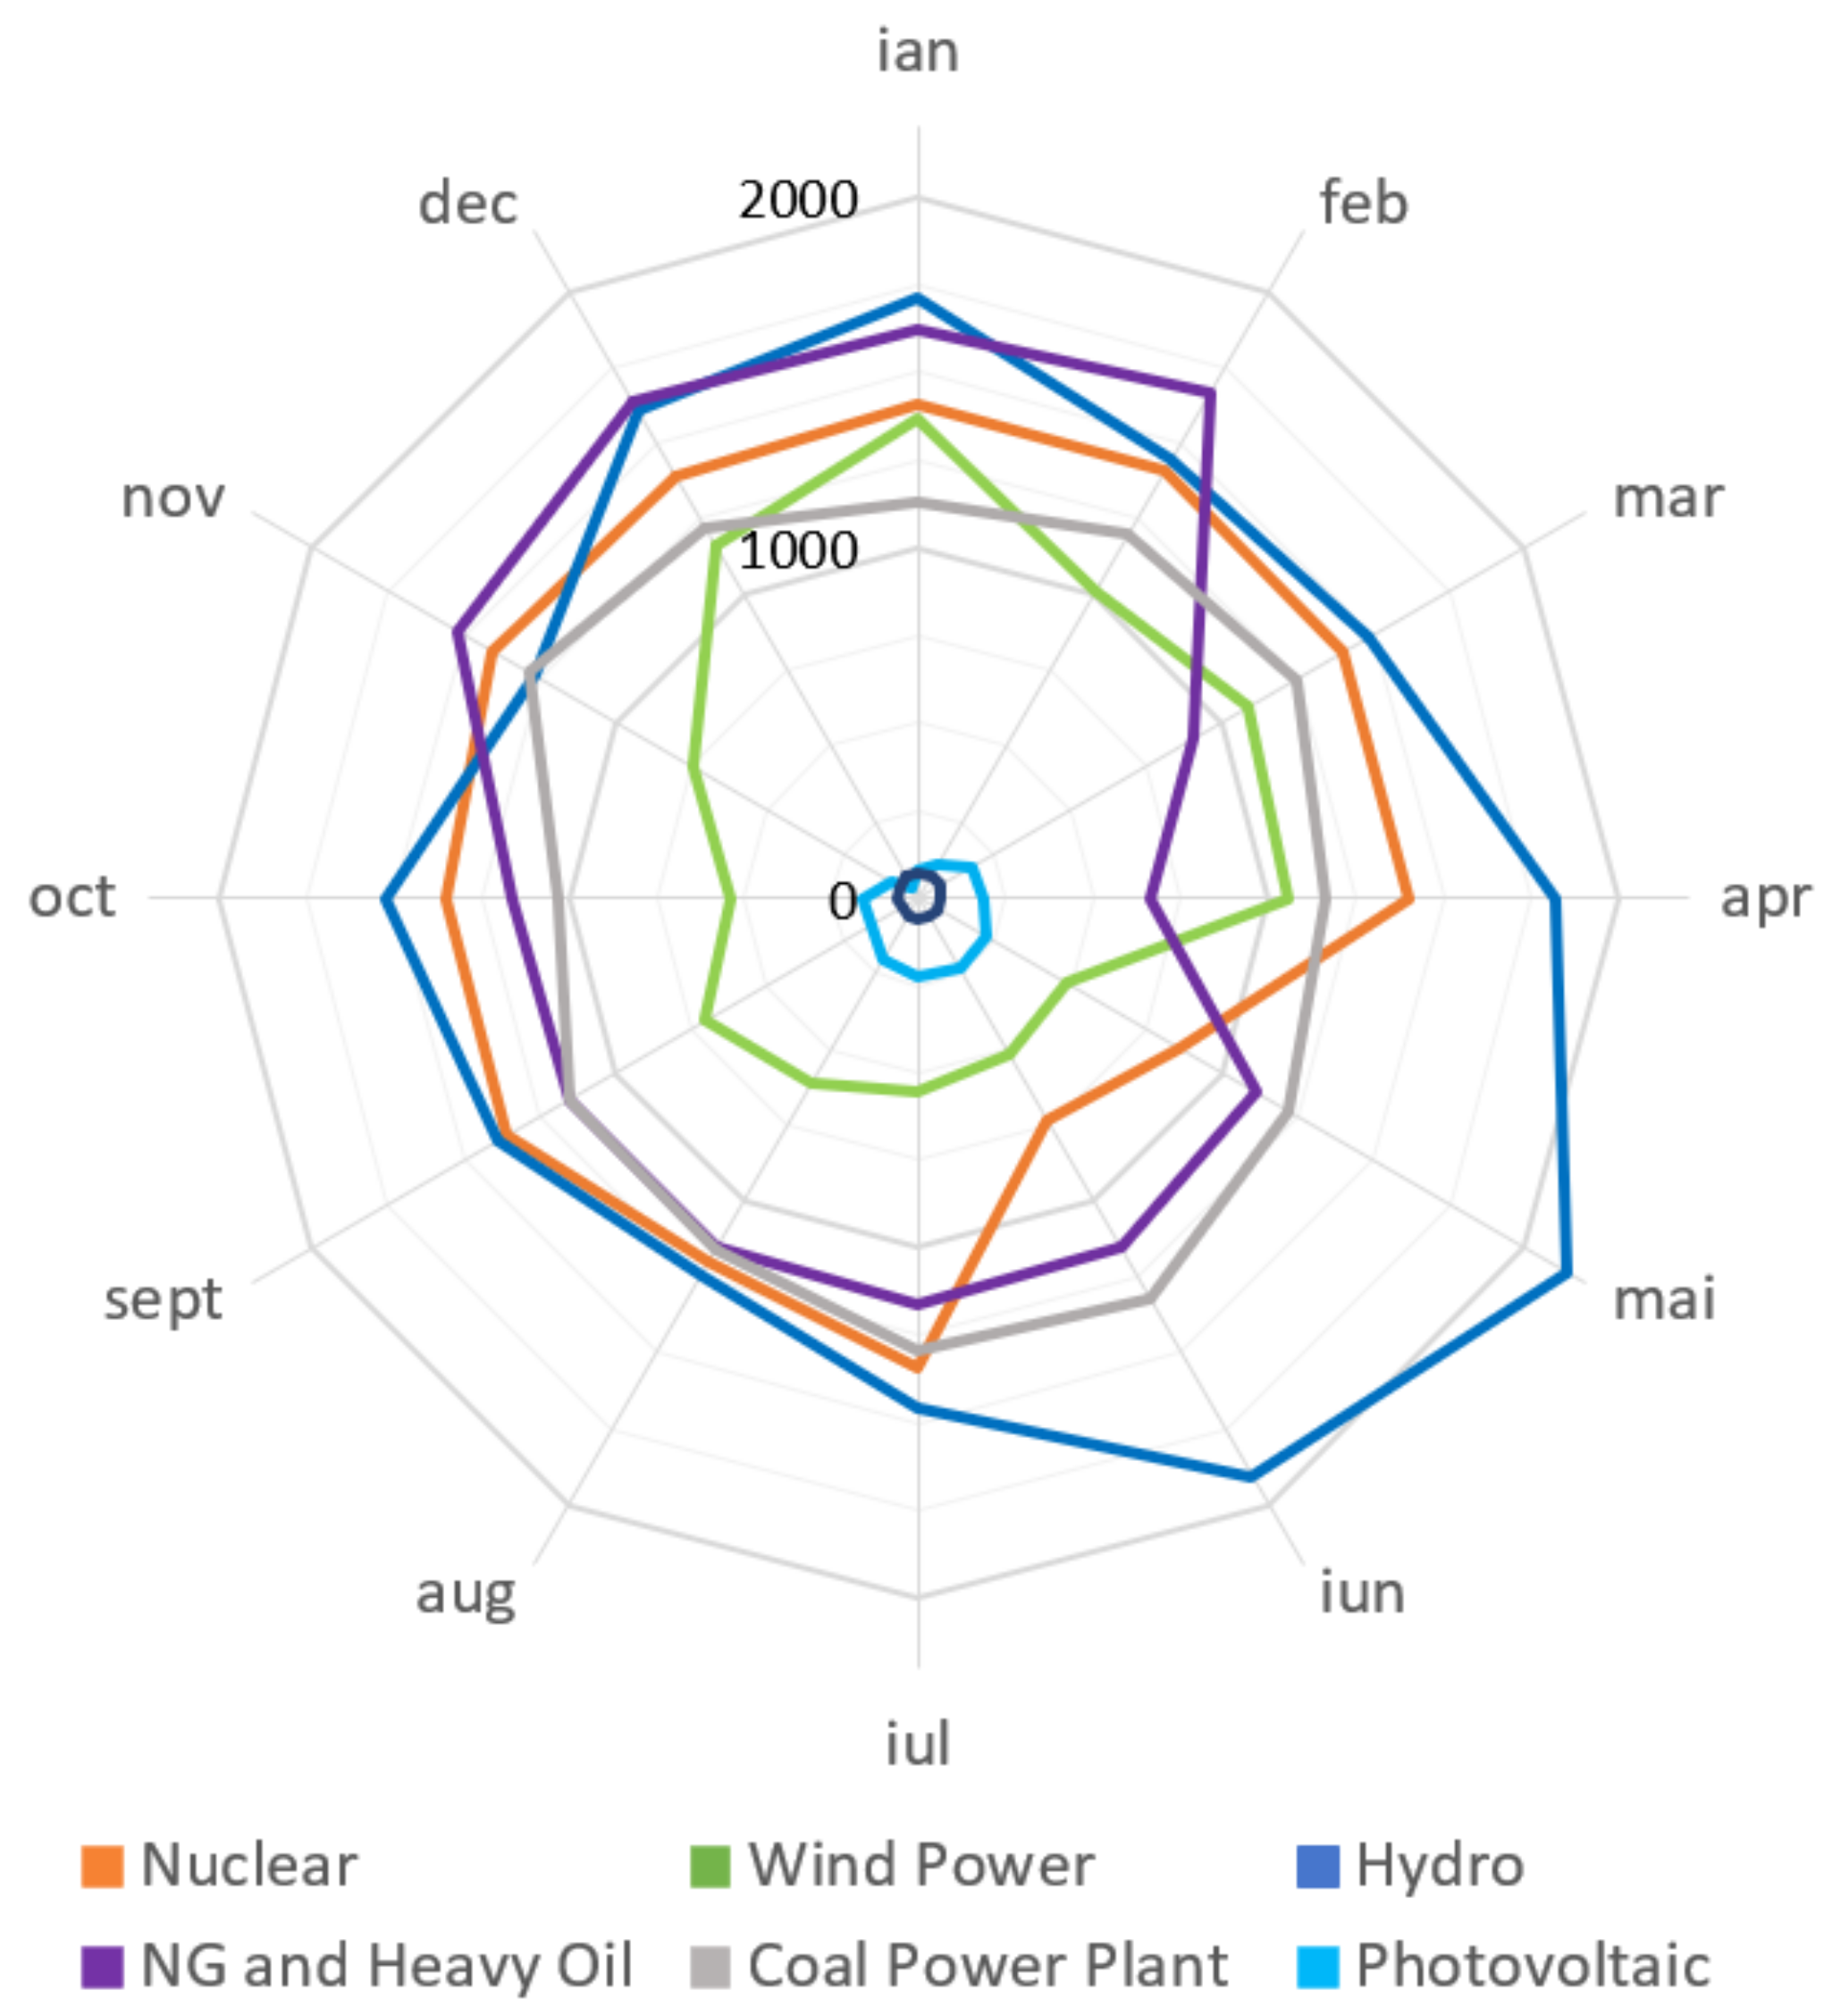
As we can see on the radar graph (
Figure 2), the maintenance of the equipment is programmed so that we can always supply the electricity needs.
The figure shows the average monthly power output of electricity producers (average power per month). In the period March–April, the amount of energy produced by NG was reduced due to the scheduled revision of the Brazi power plant. In May–June, the nuclear reactor number 1 went into scheduled maintenance, and a good part of the power requirements was provided by the hydro and NG plants. Due to the drought, in June, the hydro production decreased. A focus of attention is on the coal-fired power plants that have operated relatively consistently with an instantaneous power of 1250 MW (±20%). Further on, we will analyse the variations of electricity production using coal according to the main parameter, the customer’s need.
As far as green electricity is concerned, we can say that wind-generated electricity production makes a significant contribution from the second part of November to the end of April. Electricity production from wind farms is 2 to 3 times higher in the cold season than in the warm season. Electricity production based on solar farms in the cold season (October to March) is minimal.
On the other hand, the consumer must have electricity at the contracted parameters at any time of the day. Further on, the profile of the energy consumer in Romania will be analysed. Considering the large variations in consumption between night and day,
Figure 3 shows the electricity consumption for January 2022. The red line marks consumption, the green line marks the electricity production, and the yellow line represents the electricity import (negative import = export). Production tries to track consumption, minimizing the import of electricity.
As regards the electricity consumption on the 1st and 2nd of January, there are small variations between night and daytime consumption. When people have started their working schedule, a significant difference in electricity consumption between day and night of about 2–3 GW can be clearly observed. In addition, during the day there is a further increase at the end of the working schedule, when people return home. After that, consumption decreases gradually. These variations represent more than 25% of the electricity produced. Due to these large variations, it is found that electricity is exported at night, and imported during the day, although efforts are being made to balance the production profile with that of the consumer.
3. Analysis of the Electricity Producer Profile
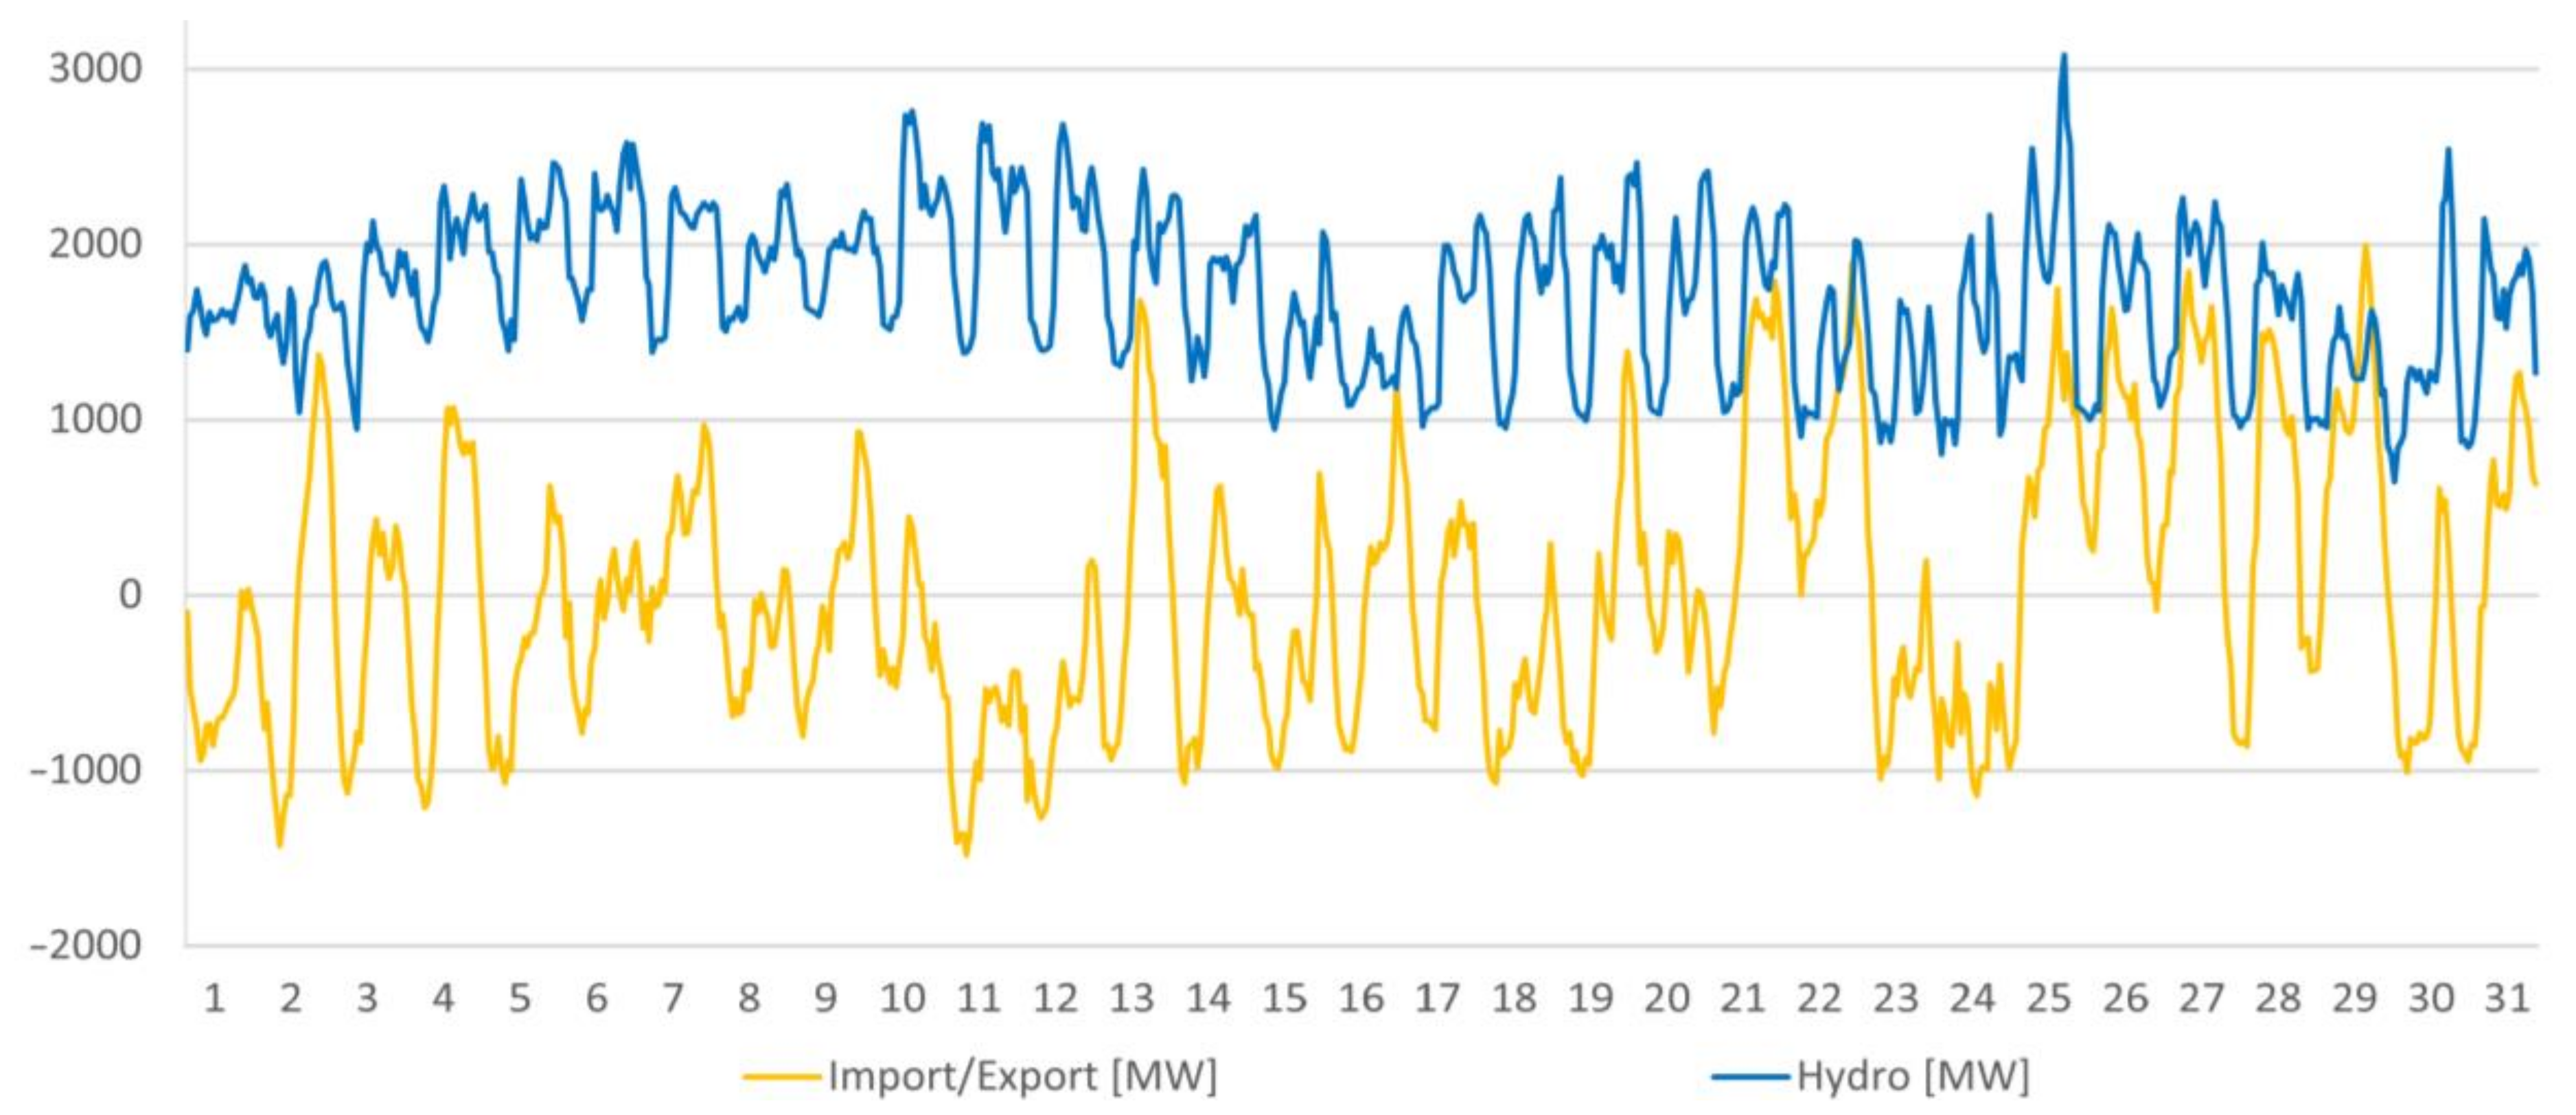
In this part of the paper, we will analyse how electricity is produced from the main energy sources. In Romania, most of the electricity is produced with the help of hydropower. Due to the variable profile, we will present the energy production for one month (January 2022). In
Figure 4, we can see that the energy produced by hydropower plants is not constant. We can see that production in January varies by 1000–1500 MW between night and day. This helps to balance the grid. Daytime electricity production can increase in some situations by up to 250% (from 1000 MW to 2000–2500 MW).
According to data from the largest green hydropower producer, i.e., Hidroelectrica, it additionally offers system services such as:
58.05% of the required secondary regulation power band,
79.07% of the fast-growing tertiary reserve requirement, and
26.26% of the fast tertiary reserve requirement on a decrease of 100% of the reactive energy service, ensuring the stability of the National Energy System [
19].
National Energy Regulatory Authority defines the secondary regulation as the frequency/power regulation at the imposed grid in a maximum of 15 min. The fast-rising tertiary reserve is the power reserve provided by generating sets that can be synchronized and charged to the imposed load in a maximum of 30 min.
Figure 5 shows the operating profile of the Cernavoda nuclear power plant over the entire period under analysis (1 year). The CANDU reactors installed at Cernavoda allow the extraction of nuclear fuel and the introduction of a new fuel pallet during reactor operation. Thus, we can see that the two reactors have always worked close to full capacity. The power outages are represented by planned shutdowns of reactor 1 for maintenance operations. It can also be observed that the power generation is at a constant regime without considering the need of the grid, being useful to maintain the band consumption without variations.
Figure 6 shows the operating regime of hydrocarbon power plants (natural gas and heavy oil). It should be noted that during the maintenance period of the Brazi power plant (March 2022) no changes in the profile of the energy producer were registered. This is primarily due to the old technologies used for electricity generation.
The benefits of the Brazi cogeneration power plant are undeniable compared to conventional ones. It has an efficiency of 57%, compared to the average of 30% for power plants in Romania. The CO
2 emissions of the power plant are 0.35 t CO
2/MWh less than half of a conventional coal plant [
20], which produces electricity with emissions of about 0.8 t CO
2/MWh. In addition, system services are offered such as: high flexibility (high speed of increase in electricity produced); fast ramp-up (half the time required by other power plants) [
21]; and the variations depending on the consumer demand are 400 MW during the operation of the Brazi power plant. In this situation, the reduced power of 400 MW represents the technological minimum of efficient operation of the plant (somewhere around 50% of the nominal power). However, the 400 MW reduction in operation covers 20% of the difference in consumption between night and day.
While analysing the operating profile of coal power plants (
Figure 7), it can be stated that these plants have relatively constant production, with variations of maximum 100 MW depending on the consumer profile. Most of the large variations in active power are represented by the shutdown and restart of the units. These variations represent about 5% of the difference in consumption between night and day.
In recent years, investments have been made in the installation and development of wind farms, especially in the Dobrogea area.
Figure 8 shows the operating profile of wind turbines in Romania for a single month, due to the large variations in electricity production in a relatively short time. It can be noticed that the import–export variations are generated by the variations of the energy produced by the wind turbines. It is also observed that the fluctuations can go from one extreme to another. More precisely, in 24 h it is possible to go from 0 MW production to more than 2500 MW. All this depends on the availability of the “raw material”, the wind.
Further on, we will review the profile of electricity generation in the summer period, specifically July (
Figure 9). During summer, the energy produced by wind turbines is low, half as much as during the cold months. During these months, peaks of up to 2000 MW were recorded.
During the hot season, wind turbines have a low production, while photovoltaic panels achieve maximum production due to the high solar radiation values. Thus, in
Figure 10, the national grid injection profile of photovoltaic panels can be seen. The production is not steady but varies according to the solar exposure. Electricity production increases gradually; in summer, it starts at 6 o’clock, and overlaps with the increasing trend of consumption [
22]. However, the maximum peak of energy produced barely reaches 750 MW, while consumer demand during the day increases by 2000 MW compared to electricity consumption at night.
In the cold season, under the best conditions, solar radiation reaches half the values recorded in summer. However, the electricity produced by solar panels peaks at 500 MW on sunny days, as shown in
Figure 11. Electricity production on cloudy days is close to zero. Even if the solar radiation is half in the cold season compared to the warm season, large amounts of energy can be produced on sunny days because the operating parameters of the photovoltaic panels are dependent on the temperature of the photovoltaic cells. Therefore, the maximum production values are recorded over a short period of time due to the low exposure of the panels to solar radiation.
4. Electricity Distribution in Romania
Figure 12 drafts the main electricity transmission and distribution grids in Romania. The map also shows the availability of the transmission networks in case new power plants/farms are to be installed. The red line shows 400 kV power lines, and the green line shows 220 kV power lines. The black colour shows 110 kV power lines. In area A, there is a route represented with blue lines corresponding to a voltage of 750 kV. It should be mentioned that the dotted lines represent overhead power lines to be built in the coming years. Thus, for area A, even if we have the highest density of networks now, it does not allow the installation of new electricity production capacities. It should be mentioned that area A is connected to the nuclear power plant of Cernavoda with a production capacity of 1500 MWh. Also, here are the largest wind farms in Romania with an installed capacity of about 3000 MW, while photovoltaic systems total an installed capacity of about 110 MW.
Nevertheless, by 2030, it is expected that new electricity transmission grids and power transformation stations will be built, which will allow the installation of new generation capacities with a maximum power of 3000 MW in area A. These investments are vital as this area is a strategic one in terms of renewable energy production using the wind and sun as we have seen in [
23,
24] studies. According to
Figure 13, it can be observed that the highest wind availability is in the mountain area (green colour—central) and the Dobrogea area (South-East) where we have a wind availability between 5000 and 4000 h per year [
25,
26].
Given the shape of the relief, the Dobrogea area allows a much easier installation of wind turbines compared to the mountainous area. According to
Figure 14, the Romanian coastal area has the highest availability of sunshine in Romania, being a very good area to install floating photovoltaic panels [
27]. At the same time, in addition to the high availability, the Romanian coastal area also has a solar irradiance that can reach values of over 900 W/m
2 in summer [
22]. However, the impossibility of transmitting energy [
28] from this area will limit investments in renewable energy. At the same time, it should be considered that it is possible that a large amount of energy produced in this area (especially by wind turbines [
29]) will be exported due to the impossibility of transporting energy to other areas of the country. The paper analysed the amount of electricity produced and consumed, but not the parameters of electricity quality.
5. Results and Discussion
The transition to green energy is a path in which we will all have to focus to reduce the effects of global warming. Under these conditions, the transition must follow the needs of the consumer to be able to supply permanent electricity at the contracted standards. Given these facts, strategic investments must be made in green sources, even if the costs are not always the lowest. Nuclear reactors can be used for constant band power consumption. The construction of the two nuclear reactors (3 and 4) at Cernavoda can successfully replace the coal power plants in Romania, which have produced on average less than 1500 MW. Energy-wise they can be replaced, but there are cases where the power plants provide heat for neighbouring towns, provide jobs for local people including the mining sector. At the same time, power distribution problems can occur if new plants are built in other locations.
Cogeneration power plants using natural gas are the most modern low carbon hydrocarbon power generation facilities that can provide system services compared to conventional natural gas, coal, or heavy oil power plants. Nevertheless, while this article is being written, Europe is going through an energy crisis, especially a hydrocarbon crisis.
Now we have reached 100% green energy sources. During the cold season, electricity consumption is higher than in the hot season because extra electricity is used for lighting and heating (electric heating or using heat pumps). Given these conditions, wind turbines perform very well, producing peak power of up to 2.5 GW. The difficulty is the availability of the raw material, wind. Most of the wind farms are in the Dobrogea area, where the highest values of onshore wind are recorded. The Romanian coastal area should be considered for the realization of nearshore and offshore wind farms where the raw material is more “generous”, and electricity could be produced without disruptions.
Electricity produced using solar farms can supplement the consumer’s needs during the daytime in the summer season if the installed power is tripled. These farms can be installed in strategic areas with high solar radiation or in areas where the power system needs electricity injection to reduce transport losses.
However, the two 100% green energy sources introduce very large imbalances in the grid, as energy is produced not when it is needed but when the raw materials are available, i.e., wind and sun. Solar panels connected to the grid produce a phenomenon called the duck curve [
31], which further stresses the country’s energy grid by creating a steep slope of electricity needs. This phenomenon happens because as the electricity demand increases, the amount of electricity produced by photovoltaic panels decreases.
Figure 15 shows that energy requirements (red line) on a summer day are not consistent and vary every hour. If we subtract the energy produced by the photovoltaic panels from the energy demand, we see the electricity demand of the grid (the other electricity producers must produce the necessary amount—the orange colour). The problem is the speed at which the electricity demand increases. Normally it would take about 2.5 h to supplement 302 MW. Instead, we need to supplement the decrease in production of photovoltaic panels. Thus, we need to supplement production by about 821 MW in 5 h, and of these, 603 MW must be injected gradually in 3 h. Therefore, the equipment must provide an increase of 200 MW/h. If a Pumped Storage Hydropower system with an installed capacity of 300 MW and a storage capacity of more than 1000 MWh (depending on the size of the reservoirs) would be used, then the grid’s electricity requirements become as smooth as the green line. The blue dotted line represents the hourly amount produced by the PV system in Romania and the green dotted line and the brown dotted line represent the amount of energy used by the PSH system. If hydropower plants would manage those fluctuations now, investments in renewable energy (especially wind and solar) will make storage systems necessary for a proper functioning of the national energy system.
One of the most versatile sources of electricity generation that can produce electricity constantly or according to the customer’s needs is hydropower. It is a resource that must be exploited to the full. However, hydropower plants can suffer from insufficient river flows. Even under these conditions, electricity production can be managed.
Lastly, it should be considered that investments in renewable energy in strategic areas in terms of resources (sun, wind, and water) may be limited by the inability of the electricity distribution network in places with consumers. Exporting energy to neighbouring countries such as Ukraine or Bulgaria should only be considered as a backup solution when there is an overproduction of electricity. In addition, the disconnection of variable profile power generation sources (solar and wind farms) from the grid should be avoided when electricity production exceeds the forecast. Investment in electricity storage systems is recommended, otherwise, investments in renewable energy power farms become unprofitable.
The paper aims to raise the alarm that investments in strategic areas in terms of wind and solar availability are not viable without investments in the energy distribution system. Moreover, intermittent power generation without energy storage (batteries or Pumped Storage Hydropower) unbalances the energy system. The high regulating capacity that hydropower plants can achieve (50% of the demand), and a policy of energy export can balance the system for the time being. If the development of the energy system towards green energy does not include storage systems, we may find ourselves like Poland when they decided to decouple photovoltaic parks due to the imbalance produced in the energy grid.
6. Conclusions
Nuclear power is a source of ascertained energy production without load fluctuations on generators. Coal-fired power plants must be closed under the Green Deal. Those could be replaced by one or two nuclear reactors or co-generation power plants running on natural gas. Modern natural gas power plants help balance the national system by being able to take about 20% (400 MW) of the night day difference in consumption (much of this difference is made up by the Brazi natural gas powerplant alone).
Electricity produced from 100% green sources is still being developed in Romania and financed by various European programmes. The electricity produced by photovoltaic panels helps to compensate for the increase in electricity needs during the day. Summer electricity production starts with the increase in the consumer’s electricity needs providing peaks of a few hours during the summer up to 650 MW taking 32.5% of the daytime night demand (average for July is 223 MW). The big problem is represented by the routine of the population and the rapid increase in electricity consumption after 4 PM correlated with the massive decrease in the photovoltaic panels’ electricity production to zero. All this requires compensation from hydro and natural gas plants coupled with an overpriced energy import. Thus, the development of storage must be put first to make better use of green energy.
Electricity produced from hydropower represents the top electricity production in Romania with an annual share of 25%. The high regulating capacity helps to compensate 50% of the active power requirement during the day compared to the night.
After the analysis, it can be concluded that investments in green energy in strategic areas may be useless if the problem of electricity transmission is not solved. At the same time green energy can become a problem if we do not teach the population to manage electricity consumption and if we do not invest in energy storage solutions at the macro level. Even if electricity consumption is expected to increase soon (recommended for electric home heating), it is likely to remain constant due to ongoing energy efficiency measures and the reduction of the amount of energy used in the industrial sector through efficiency and forced shutdown.


