Article

Experimental Study on the Influence of Incoming Flow on Wind Turbine Power and Wake Based on Wavelet Analysis

1
School of Energy and Power Engineering, Lanzhou University of Technology, Lanzhou 730050, China
2
School of Chemistry and Chemical Engineering, Lanzhou Jiaotong University, Lanzhou 730070, China
3
Gansu Provincial Technology Centre for Wind Turbines, Lanzhou 730050, China
4
Wind Power Division, Zhuzhou Electric Locomotive Research Institute Co., Zhuzhou 412000, China
*
Author to whom correspondence should be addressed.
Energies 2023, 16(16), 6003; https://doi.org/10.3390/en16166003
Submission received: 26 June 2023 / Revised: 27 July 2023 / Accepted: 13 August 2023 / Published: 16 August 2023
(This article belongs to the Section A3: Wind, Wave and Tidal Energy)

Abstract

:
Taking a wind farm in the Qinghai–Tibet Plateau as the experimental site, the ZephiR Dual Mode (ZDM) LiDAR and ground-based laser LiDAR were used to scan the incoming flow and wake of the wind turbine separately. Based on wavelet analysis, the experimental study was conducted on the influence of different incoming wind speeds on the power and wake of the wind turbine. It is found that the incoming wind speeds have a great influence on the wind turbine power, and the fluctuation frequency of the wind speed is obviously higher than that of the power, that is, the scale effects of turbulence are magnified. The rotation of the wind wheel can accelerate the collapse of the large-scale turbulent structures of the incoming flow, and large-scale vortices continue to collapse into small-scale vortices, that is, the energy cascade evolution occurs. And in the wake diffusion process, the dissipation degree of the upper blade tip vortex is greater than that of the lower blade tip vortex caused by the rotation of the wind turbine. Under the same incoming flow conditions, due to the influence of tower and ground turbulence structure, the energy level connection phenomenon of the measuring points below the hub height is stronger than that above the hub height, and it weakens with the increase of the measuring distance. That is, the energy cascade of the measuring points below the hub height at 1.5 D (D is the diameter of the wind wheel) of the wake is weaker than that at 1 D of the wake. With the increase of the measuring distance of the wake, the influx of the external flow field further aggravates the momentum exchange and energy transport between the vortex clusters, that is, the influence of the external flow field gradually increases in the wake vortex pulsation.

1. Introduction

In recent years, wind energy has developed rapidly in the world, and large-scale wind farms have especially received widespread attention. However, with the increase in the number of wind turbines in the wind field, the wind speed characteristics of the original flow have varying degrees of influence on the power output of the wind turbine and the dynamic change of the wake flow field, and the problems of the wind turbine caused are beginning to be highlighted, so the research on the wind characteristics of the incoming flow is particularly important. Therefore, many scholars have performed a lot of research on the influence of incoming flow on the power [1,2,3,4] and wake [5,6,7,8] of wind turbines. Wind data were measured for a 300-kW wind turbine using both a nacelle anemometer installed in it and a nine-beam nacelle LiDAR, and then compared. The relationship between the wind turbine power and the rotor equivalent wind speed was expounded according to the observation of the wind profile by LiDAR [9]. Jiang et al. [10] used Fluent software to simulate different wind fields and compared the power output characteristics of wind turbines under different wind fields. BOT [11] measured the wind speed distribution before and after the wind turbine through the laser wind LiDAR installed on the nacelle of a 2.5 MW wind turbine. But he did not analyze the reasons for its distribution in detail. Shin et al. [12] measured the changes in the wind condition in the wake area of the wind turbine with distance and wind direction through a nacelle LiDAR installed on a 3 MW wind turbine, and quantitatively evaluated the changes of wind speed, turbulence intensity, and power at multiple distances from 0.9 D to 4.8 D of the wake. Apt [13] and Jin et al. [14] studied the potential spectrum relationship of the wind turbine power fluctuation with the incoming flow-through experiments, and proposed that when wind power plants are deployed on a large scale, filling power must be provided to compensate for the wind power fluctuation. Liu et al. [15] used the power spectrum analysis method to find that there is a certain power law relationship between the incoming flow and the wind turbine’s active power in the power spectrum and gave the explanation and theoretical proof in the wind tunnel experiment. However, the articles of Apt and Liu did not clearly explain the specific relationship between the incoming wind speed and the output power. The effects of turbulence intensity and incoming flow on the wind turbine power were studied in detail by wind tunnel experiments and two-dimensional PIV techniques [16,17]. Krishnamurthy et al. [18] used single scan Doppler LiDAR to measure the wake characteristics of the wind turbine under different atmospheric conditions, proposed a new algorithm based on the Gaussian model to measure downwind wake characteristics, and analyzed the wake characteristics of the wind turbine in detail according to this algorithm. Yang et al. [19] used remote sensing technology to measure the incoming flow of a 3.6 MW horizontal axis wind turbine, and revealed the influence of atmospheric boundary layer turbulence scale on the power fluctuation of the large horizontal axis wind turbine. Wu et al. [20,21,22,23] carried out field tests on different topography and surface roughness by using a Pulse Coherent Doppler LiDAR (PCDL), revealing the loss of wind speed along the longitudinal dimension, wake size, turbulent energy dissipation rate, and its influence on the wake length of the unit. Gao et al. [24] carried out comparative experimental measurements of the wind turbine wake in three wind farm regions with different complexity by laser Doppler LiDAR and discussed three wake interaction conditions of separate, full, and half wakes, respectively. Hou et al. [25] studied wake turbulence characteristics of the wind turbine using the large eddy simulation method. Zhang et al. [26] studied the influence of low-level jets on the operation and wake of the wind turbine based on the principle of plane wall jets. Through the measurement of wind turbine wake by ground scanning LiDAR, Hegazy et al. [27] evaluated the influence of wake interference on wake additional turbulence and power loss. Based on the working principle of static LiDAR, Kumer et al. [28] carried out an experimental analysis of the wake and frequency of a single wind turbine from the view of atmospheric stability. In terms of blade dynamics, Tüfekci et al. [29] focused on the quasi-static stress and modal analyses of a rotor blade by using classical and nonlocal elasticity approaches. After that, he and other scholars [30] studied the dynamic modeling and analysis of wind turbine blades. And for this purpose, a novel three-dimensional analytical straight beam model for blades was formulated. Meng et al. [31] proposed the equivalent rotating wedge beam model for composite wind turbine blades, and studied the centrifugal stiffening effect on the structural characteristics of large wind turbine blades comprehensively. Blasques et al. [32] presented a novel framework for the structural design and analysis of wind turbine blades and established its accuracy.
It is rare to study the temporal and spatial variation of power and wake of large wind turbines in low-temperature plateau areas under different incoming flow conditions from the point of the outfield. In order to clearly reveal the occurrence time, influence intensity, wake response time, influence position, and intensity of the wind turbine output power fluctuation caused by the incoming wind speed in the outfield, based on the previous studies, this paper uses two different types of LiDAR to carry out outfield experiments on a wind farm in the Qinghai–Tibet Plateau. Simultaneous measurement is conducted of the incoming flow and wake of a wind turbine. Part of the experimental data is selected at different positions of the incoming flow and wake. With the help of Matlab software (https://ww2.mathworks.cn/products/matlab.html), the selected experimental data are analyzed by wavelet transform and time domain and frequency domain. The relationship between the incoming turbulence of the wind turbine and the corresponding power and wake energy spectrum is found in the wavelet transform analysis.
In the following, Section 2 provides the materials and methods used in the experimental data processing. The main results are presented in Section 3, the influence of the turbulence structure of the incoming flow on the power of the wind turbine and the wind speed at different heights of the wake is discussed from the point of view of time and space. The conclusions of the experimental research and analysis are summarized in Section 4.

2. Materials and Methods

2.1. The Theoretical Base of Wavelets

Wavelet analysis is a commonly used mathematical tool in the analysis of turbulent coherent structures, which has a wide range of practicability [33,34,35]. Its advantage is that the wavelet analysis can effectively decompose the signal into the frequency domain and time domain information, which is very beneficial to the dominant mode of resolution and time evolution and makes the signal processing more accurate and flexible. Wavelet analysis can also adapt to different scales of signal processing, making the signal processing more precise and comprehensive. At the same time, wavelet analysis can further remove the detailed information in the signal through threshold processing and other methods, making the signal processing more accurate and reliable. Therefore, wavelet transform is often known as the mathematical microscope because it can achieve multiresolution analysis through expansion and translation operations. In engineering and scientific research, wavelet analysis has been successfully applied to the study of intermittent and nonstationary characteristics of turbulence in the atmospheric boundary layer, meandering and drainage, gravity waves, and so on [36,37,38,39]. In this paper, the wavelet transform analysis can be used to understand the influence of incoming flow on power and wake in time and space.

2.1.1. Wavelet Transform

Wavelet transform is a localized analysis of time (space) and frequency. After the basic wavelet ψ t   is stretched and translated, a cluster of functions is obtained by an inner product of different scales a with the signal f t . According to the characteristics of wavelet change [40,41,42], the continuous wavelet transform method is selected in this paper.
ψ a , b t = a 1 / 2 ψ t b a , ψ L 2 R L 1 R , a , b R ,   a 0
where ψ   is the basic wavelet; ψ a , b is the analytical wavelet; a is the stretching factor and its function is to change the shape of the wavelet; b is the translation factor and its function is to change the wavelet displacement.
For any signal f L 2 R ,
W f a , b = f , ψ a , b = a 1 / 2 + f t ψ t b a d t ¯
where   W f a , b is the integral wavelet; ψ t ¯ is the conjugate function of ψ t ; f , ψ a , b is the inner product of f and ψ a , b ;   f is the frequency corresponding to different scales. a and b are continuous variables, which are called continuous wavelet transform (CWT).

2.1.2. Wavelet Spectrum

The wavelet spectrum is a two-dimensional image or contour map. The abscissa is time or space, and the ordinate is frequency or scale. Then, the frequency has the following relationship with its corresponding scale.
f a = f c · f s a
where   f a   is the corresponding frequency of scale a ;   f c is the wavelet center frequency;   f s   is the sampling frequency.
According to Equation (3), the wavelet energy can be expressed as a function of time and frequency, where the low frequency represents the large scale. A Morlet wavelet can not only provide unique phase information between signal components in two orthogonal spaces, but also provide amplitude information similar to real wavelet transform, which is widely used in the identification of turbulent structures in turbulence analysis [33,34,43]. Thus, this paper chooses Morlet as the mother wavelet for pulsation signal analysis.

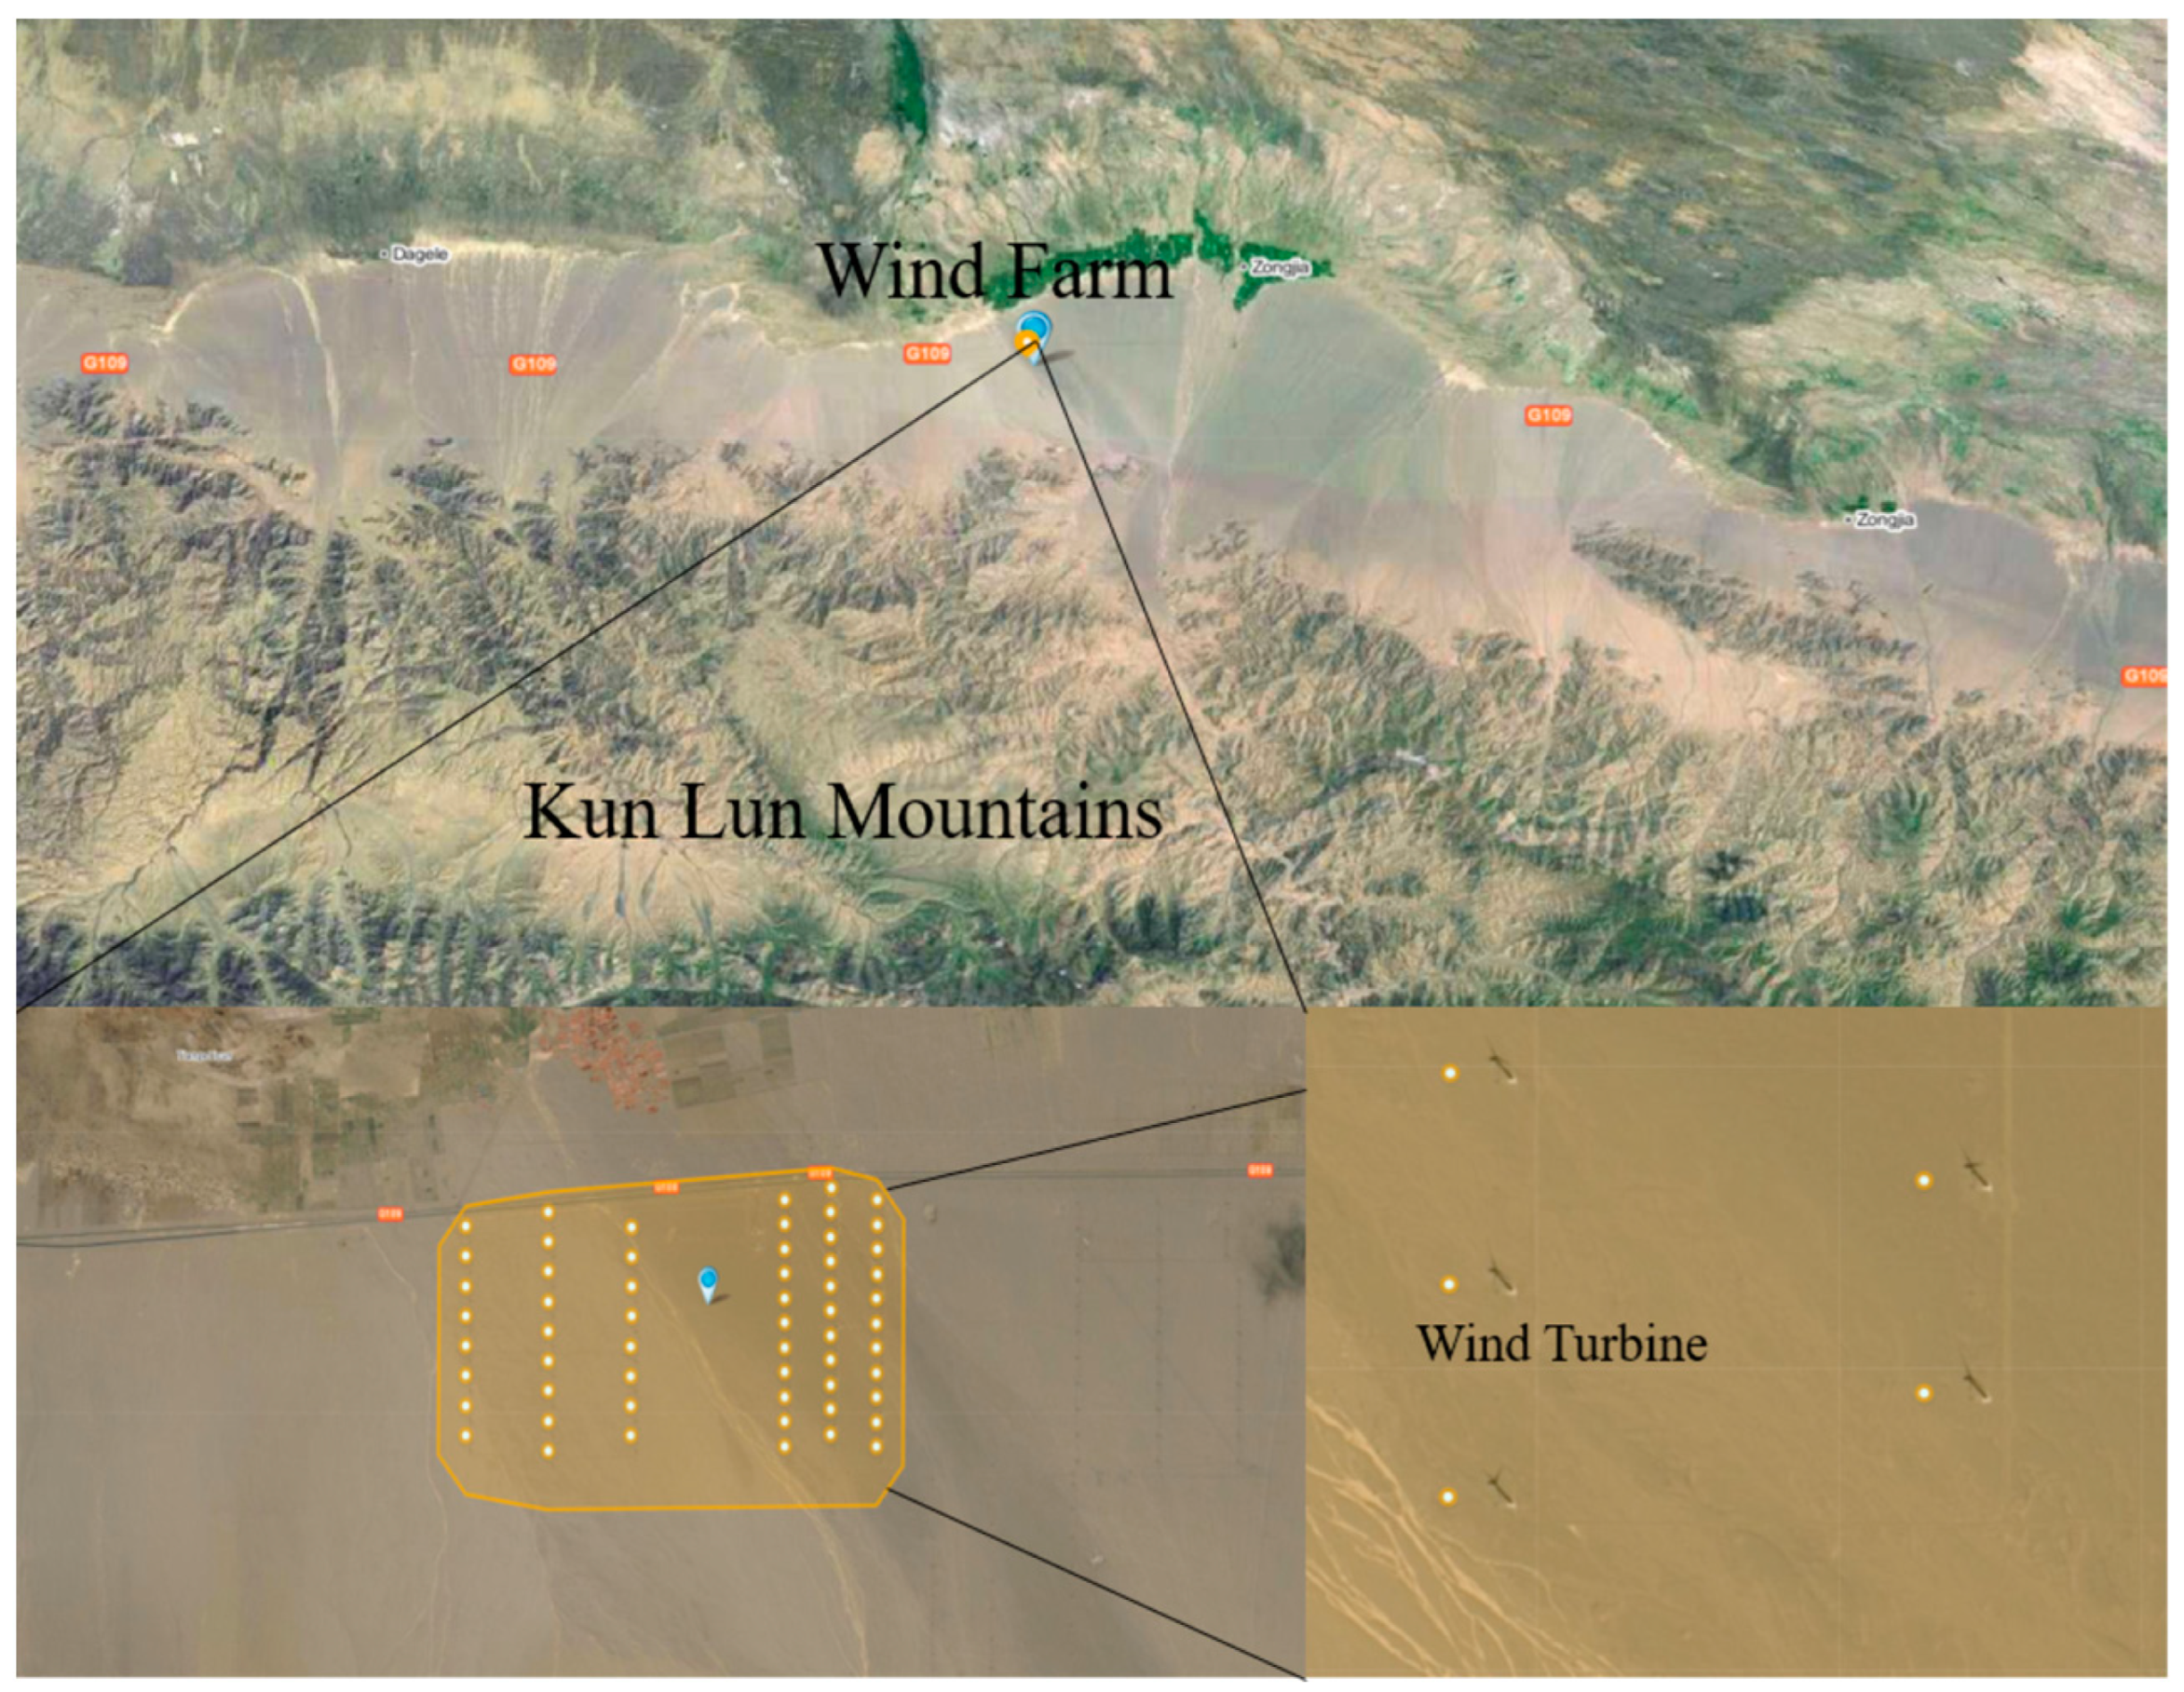
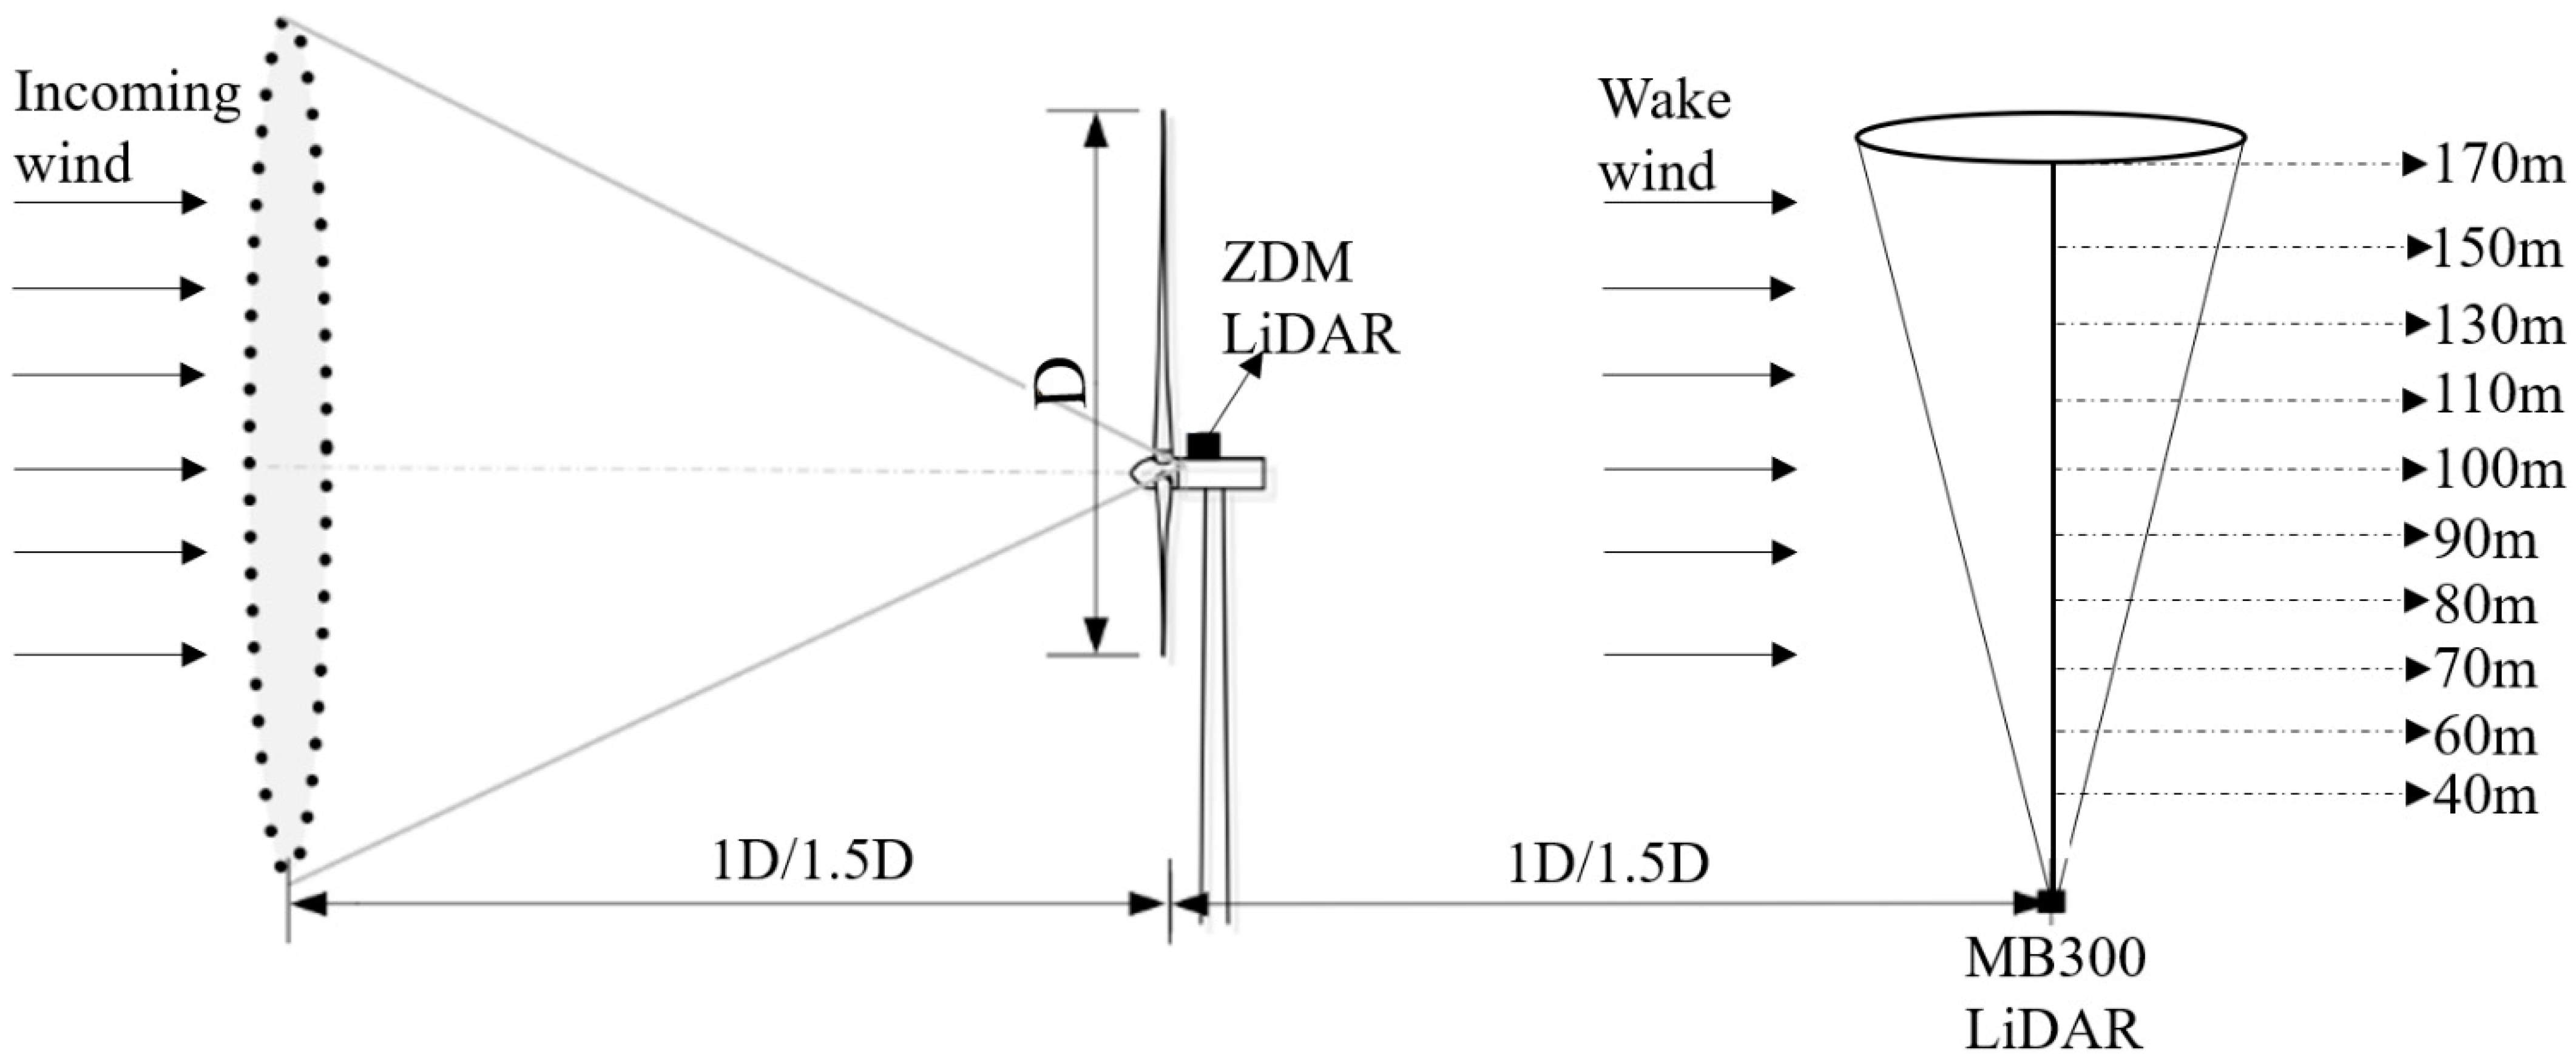
2.2. The Experimental Setup

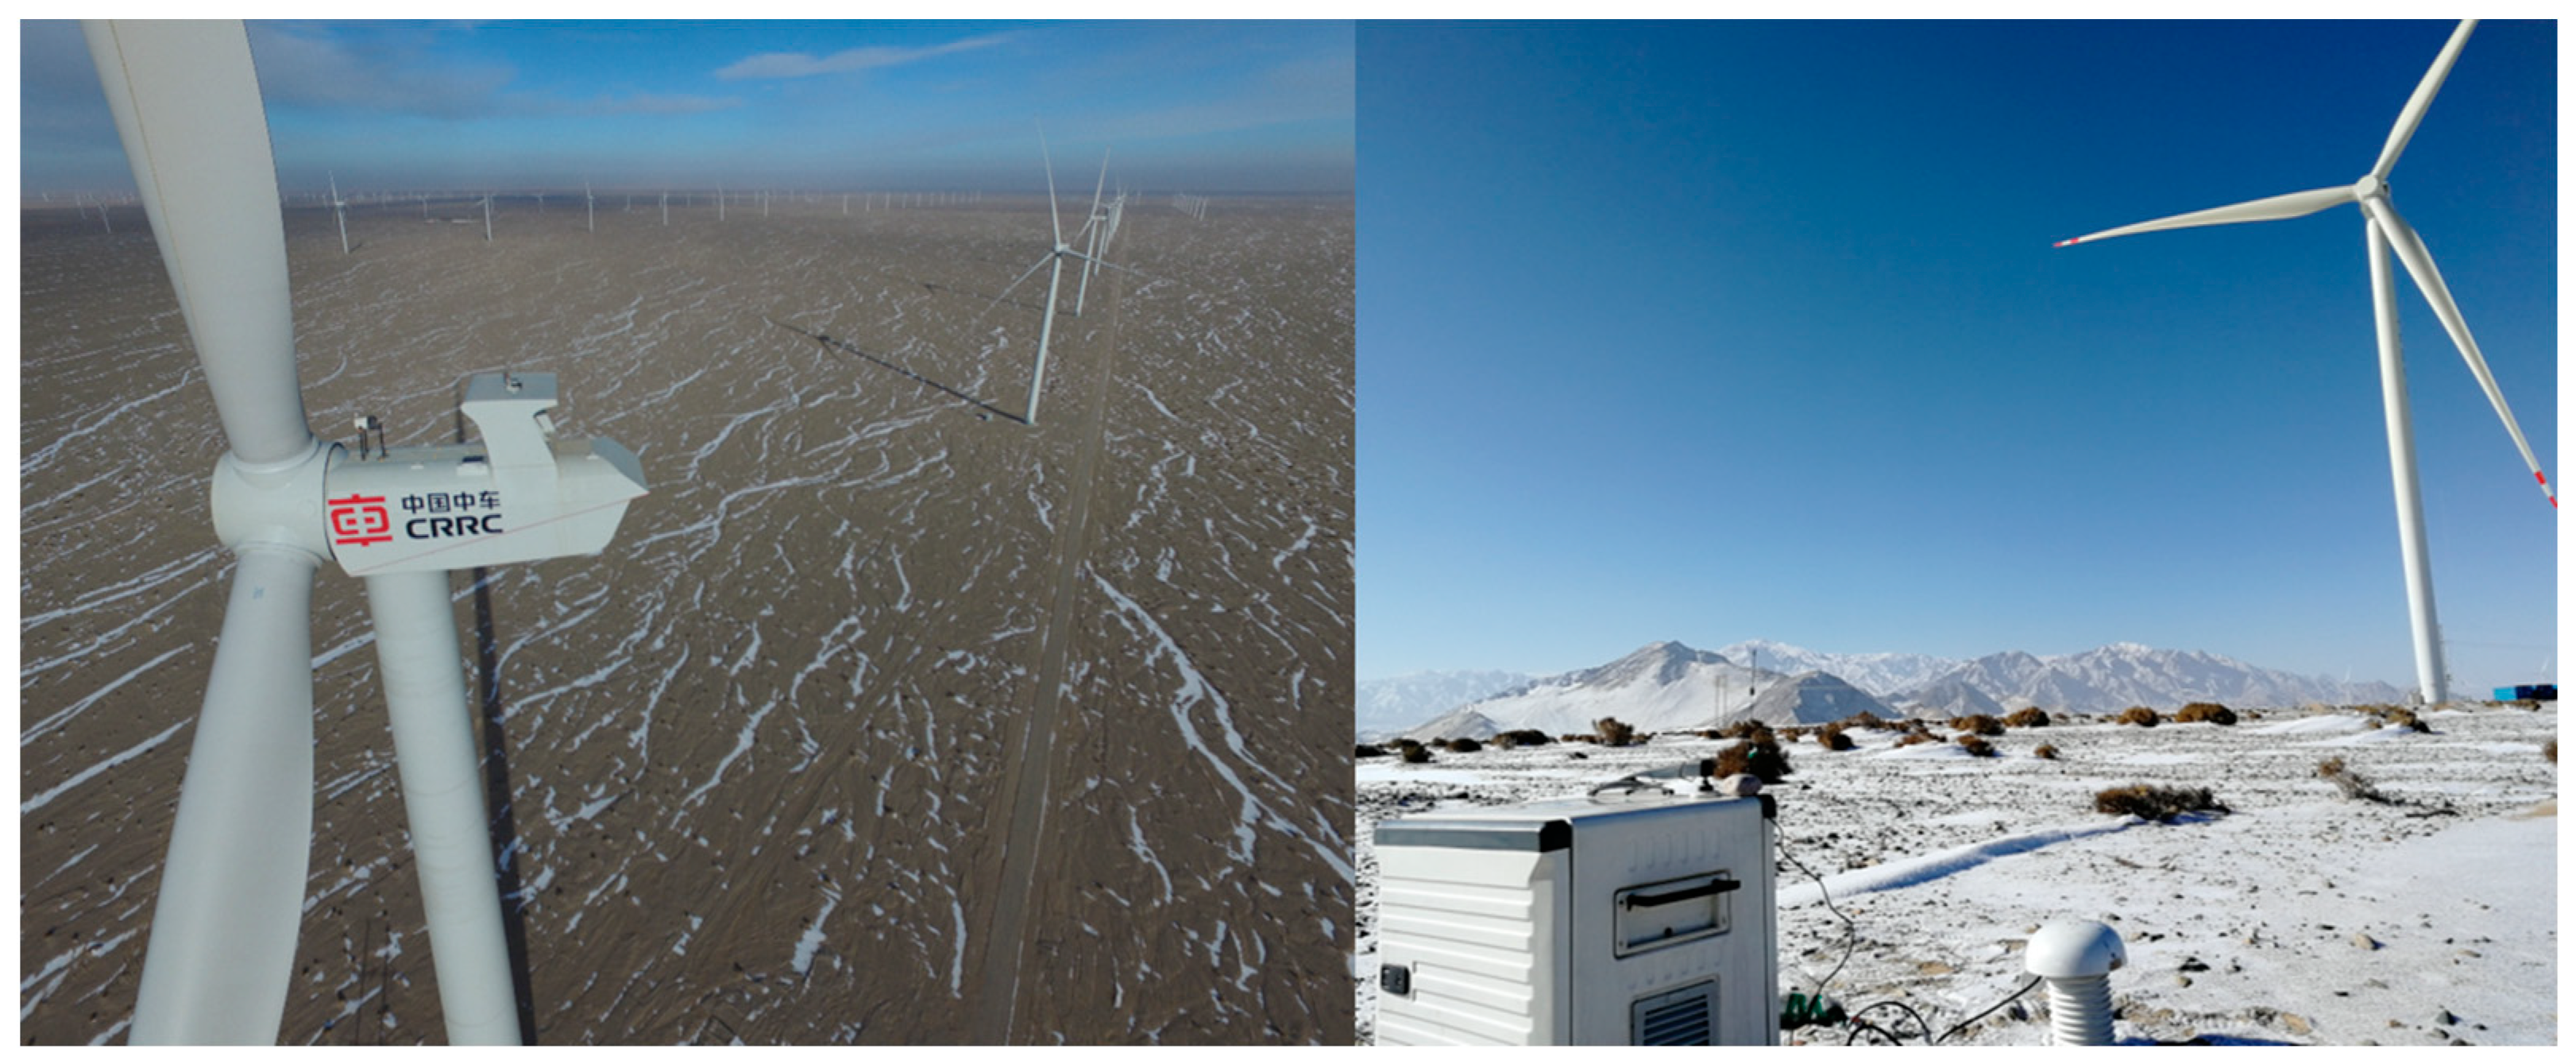
2.2.1. Experimental Equipment

The work of this paper is a field wind measurement project of a wind farm in the northeast of the Qinghai–Tibet Plateau and southeast of the Qaidam Basin. It is illustrated in Figure 1, and the altitude range is 2910–2980 m. There are towering and precipitous hills and mountains to the south of the wind farm and meadow swamp Gobi to the north, and the terrain inclines from the southeast to the northwest. The data of wind resources show that the prevailing wind direction is WNW, the annual average air density is about 0.925 kg/m2, and the wind speed is mainly concentrated at 7–11 m/s.
In this paper, the field measurements were conducted from December 2018 to January 2019 and the measured data are selected from 26 December to 22 January. The main experimental equipment is a 3.3 MW horizontal axis wind turbine whose diameter is 146 m and the center height of the wheel hub is 100 m, a ZephiR Dual Mode (ZDM) LiDAR, and a ground-based MB300 LiDAR. The specific parameters of the two kinds of LiDAR are shown in Table 1.
Figure 2 shows the rose chart of the incoming flow and wake wind speeds and directions over a period of time (about 3 h), which was drawn using the data measured by ZDM LiDAR and MB300 LiDAR. It can be seen that the wind direction of the incoming flow and the wake are basically the same; the main wind direction is WNW. Although the direction of the incoming flow wind deflects in a small range, it has little influence on the wind direction of the wake. There is a slight difference in the wind speed range between the incoming flow and the wake, but it can also show that the measurement results of the two are basically the same, thus ensuring the accuracy of the wake measurement, and it can also be seen that the wind speed and direction are consistent with the statistical data of wind resources.

2.2.2. Experimental Arrangement

The specific experimental schemes of the ZDM LiDAR (which is installed on the top of the engine room and should be coincident with the wind turbine axis and parallel to the horizontal line) and the ground-based MB300 LiDAR (which is placed on the ground directly behind the wind turbine and the azimuth corresponds to the north direction) are shown in Figure 3 and Figure 4. The ZDM LiDAR was used to measure the cross-section wind speed information at 1 D and 1.5 D in front of the wind wheel with the vertical height of 100 m of the wind turbine’s incoming flow. The ground-based MB300 LiDAR and its RHI scanning mode were used to measure the wind information at 1 D and 1.5 D behind the wind wheel with vertical heights of 40 m, 60 m, 70 m, 80 m, 90 m, 100 m, 110 m, 130 m, 150 m, and 170 m of the wind turbine wake. The data measured by the ZDM and MB300 are incorporated into the data acquisition and monitoring (SCADA) system to realize data synchronous recording.

3. Results and Analysis

3.1. Data Selection

Because the winter wind speed in this area was concentrated at 7–11 m/s, the incoming flow data in this wind speed range and the corresponding wind turbine output power and wake are mainly selected in the experiment. Some experimental data of two measurements are listed in Table 2. According to the outfield wind turbine measured results of ZDM LiDAR, the measurement range of wind turbine influence is within 1.5 D, and the influence of upstream wind turbine wake can be weakened when 1.5 D is selected. And to compare the influence of the incoming wind speed at 1.5 Dand 1 Din front of the wind turbine on the output power and wake of the wind turbine, the incoming flow part is mainly the 10 min average value of downwind speed, shear index, and wind deviation error in front of the wind wheel 219 m (1.5 D) and 109.5 m (1 D) with the height of 100 m. The temperature and pressure are the 10 min average measured by the ZDM LiDAR weather station, and the measuring height is 100 m. In the wake part, the 10 min average wind speed at the different downstream positions of the wind turbine is selected, and there are ten wind speed values at ten heights under each average incoming wind speed.

3.2. The Effect of Incoming Flow on Power and Wake Is Analyzed Based on the Wavelet Analysis

The Morlet wavelet was selected as the mother wave of wavelet analysis, and the wave number is 5. The wind speed time history data under the above two conditions are analyzed, and the influence of turbulence structure on the wind turbine power and wake is described from a view of time and space.

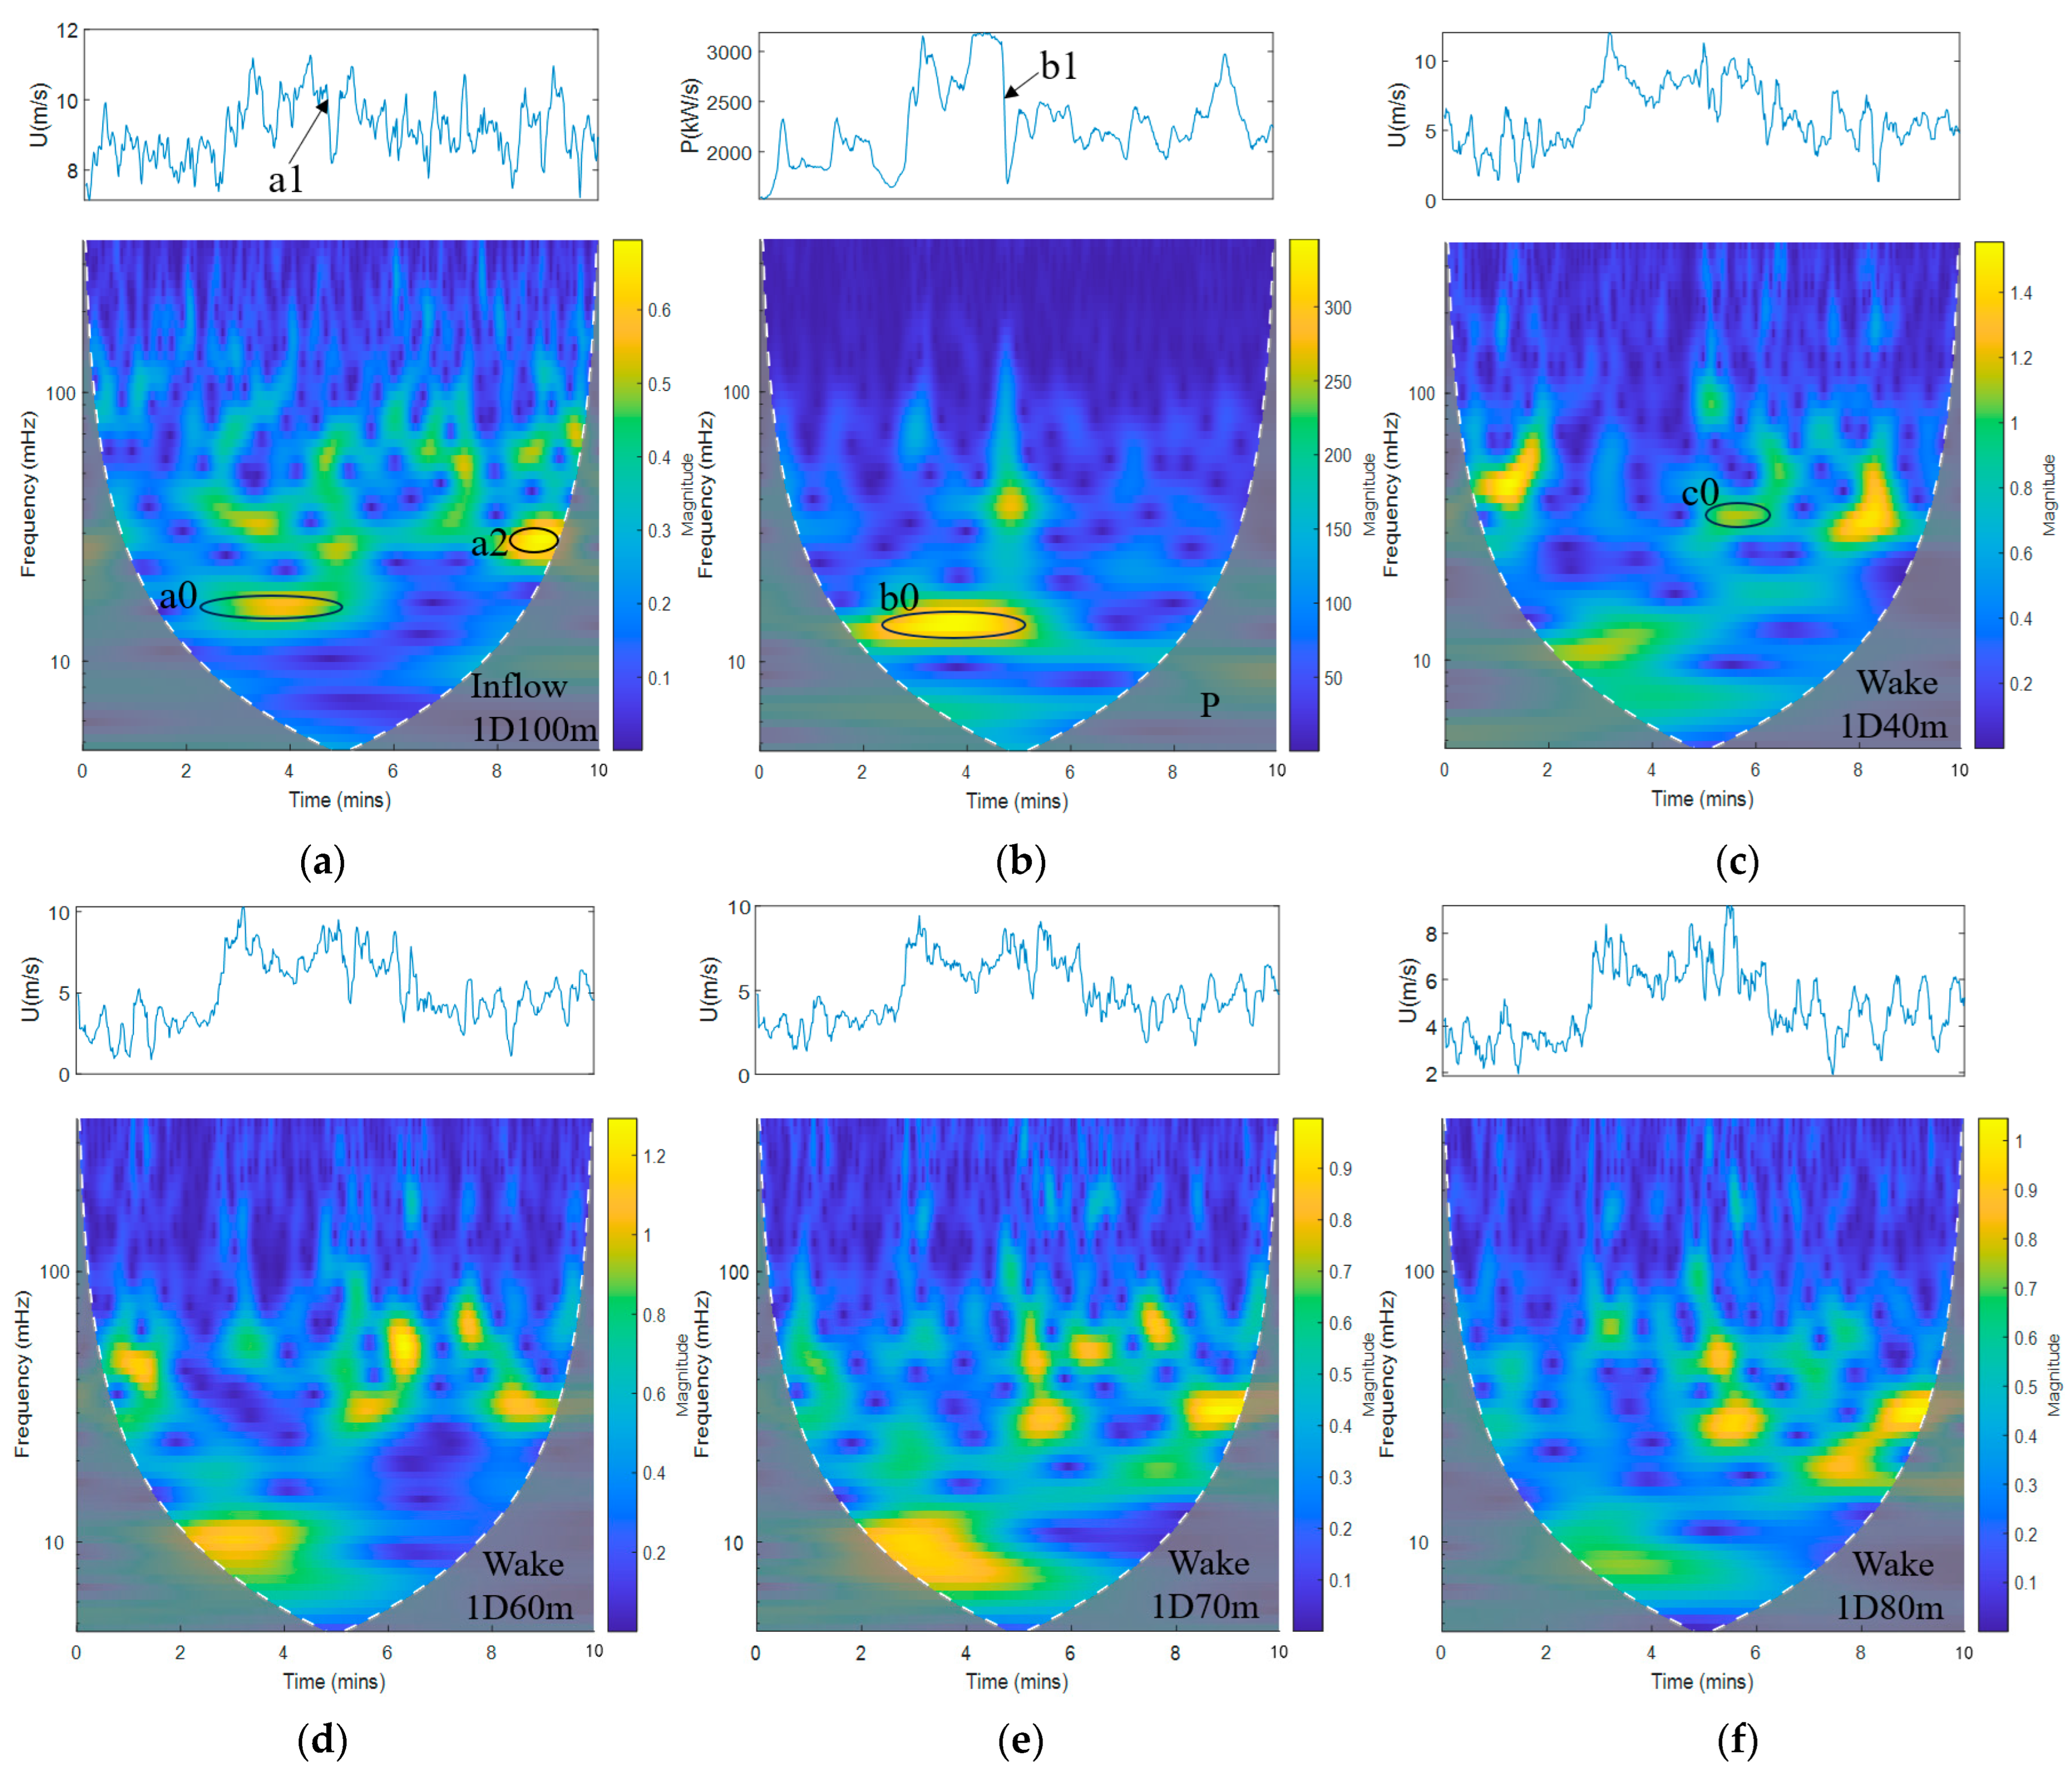
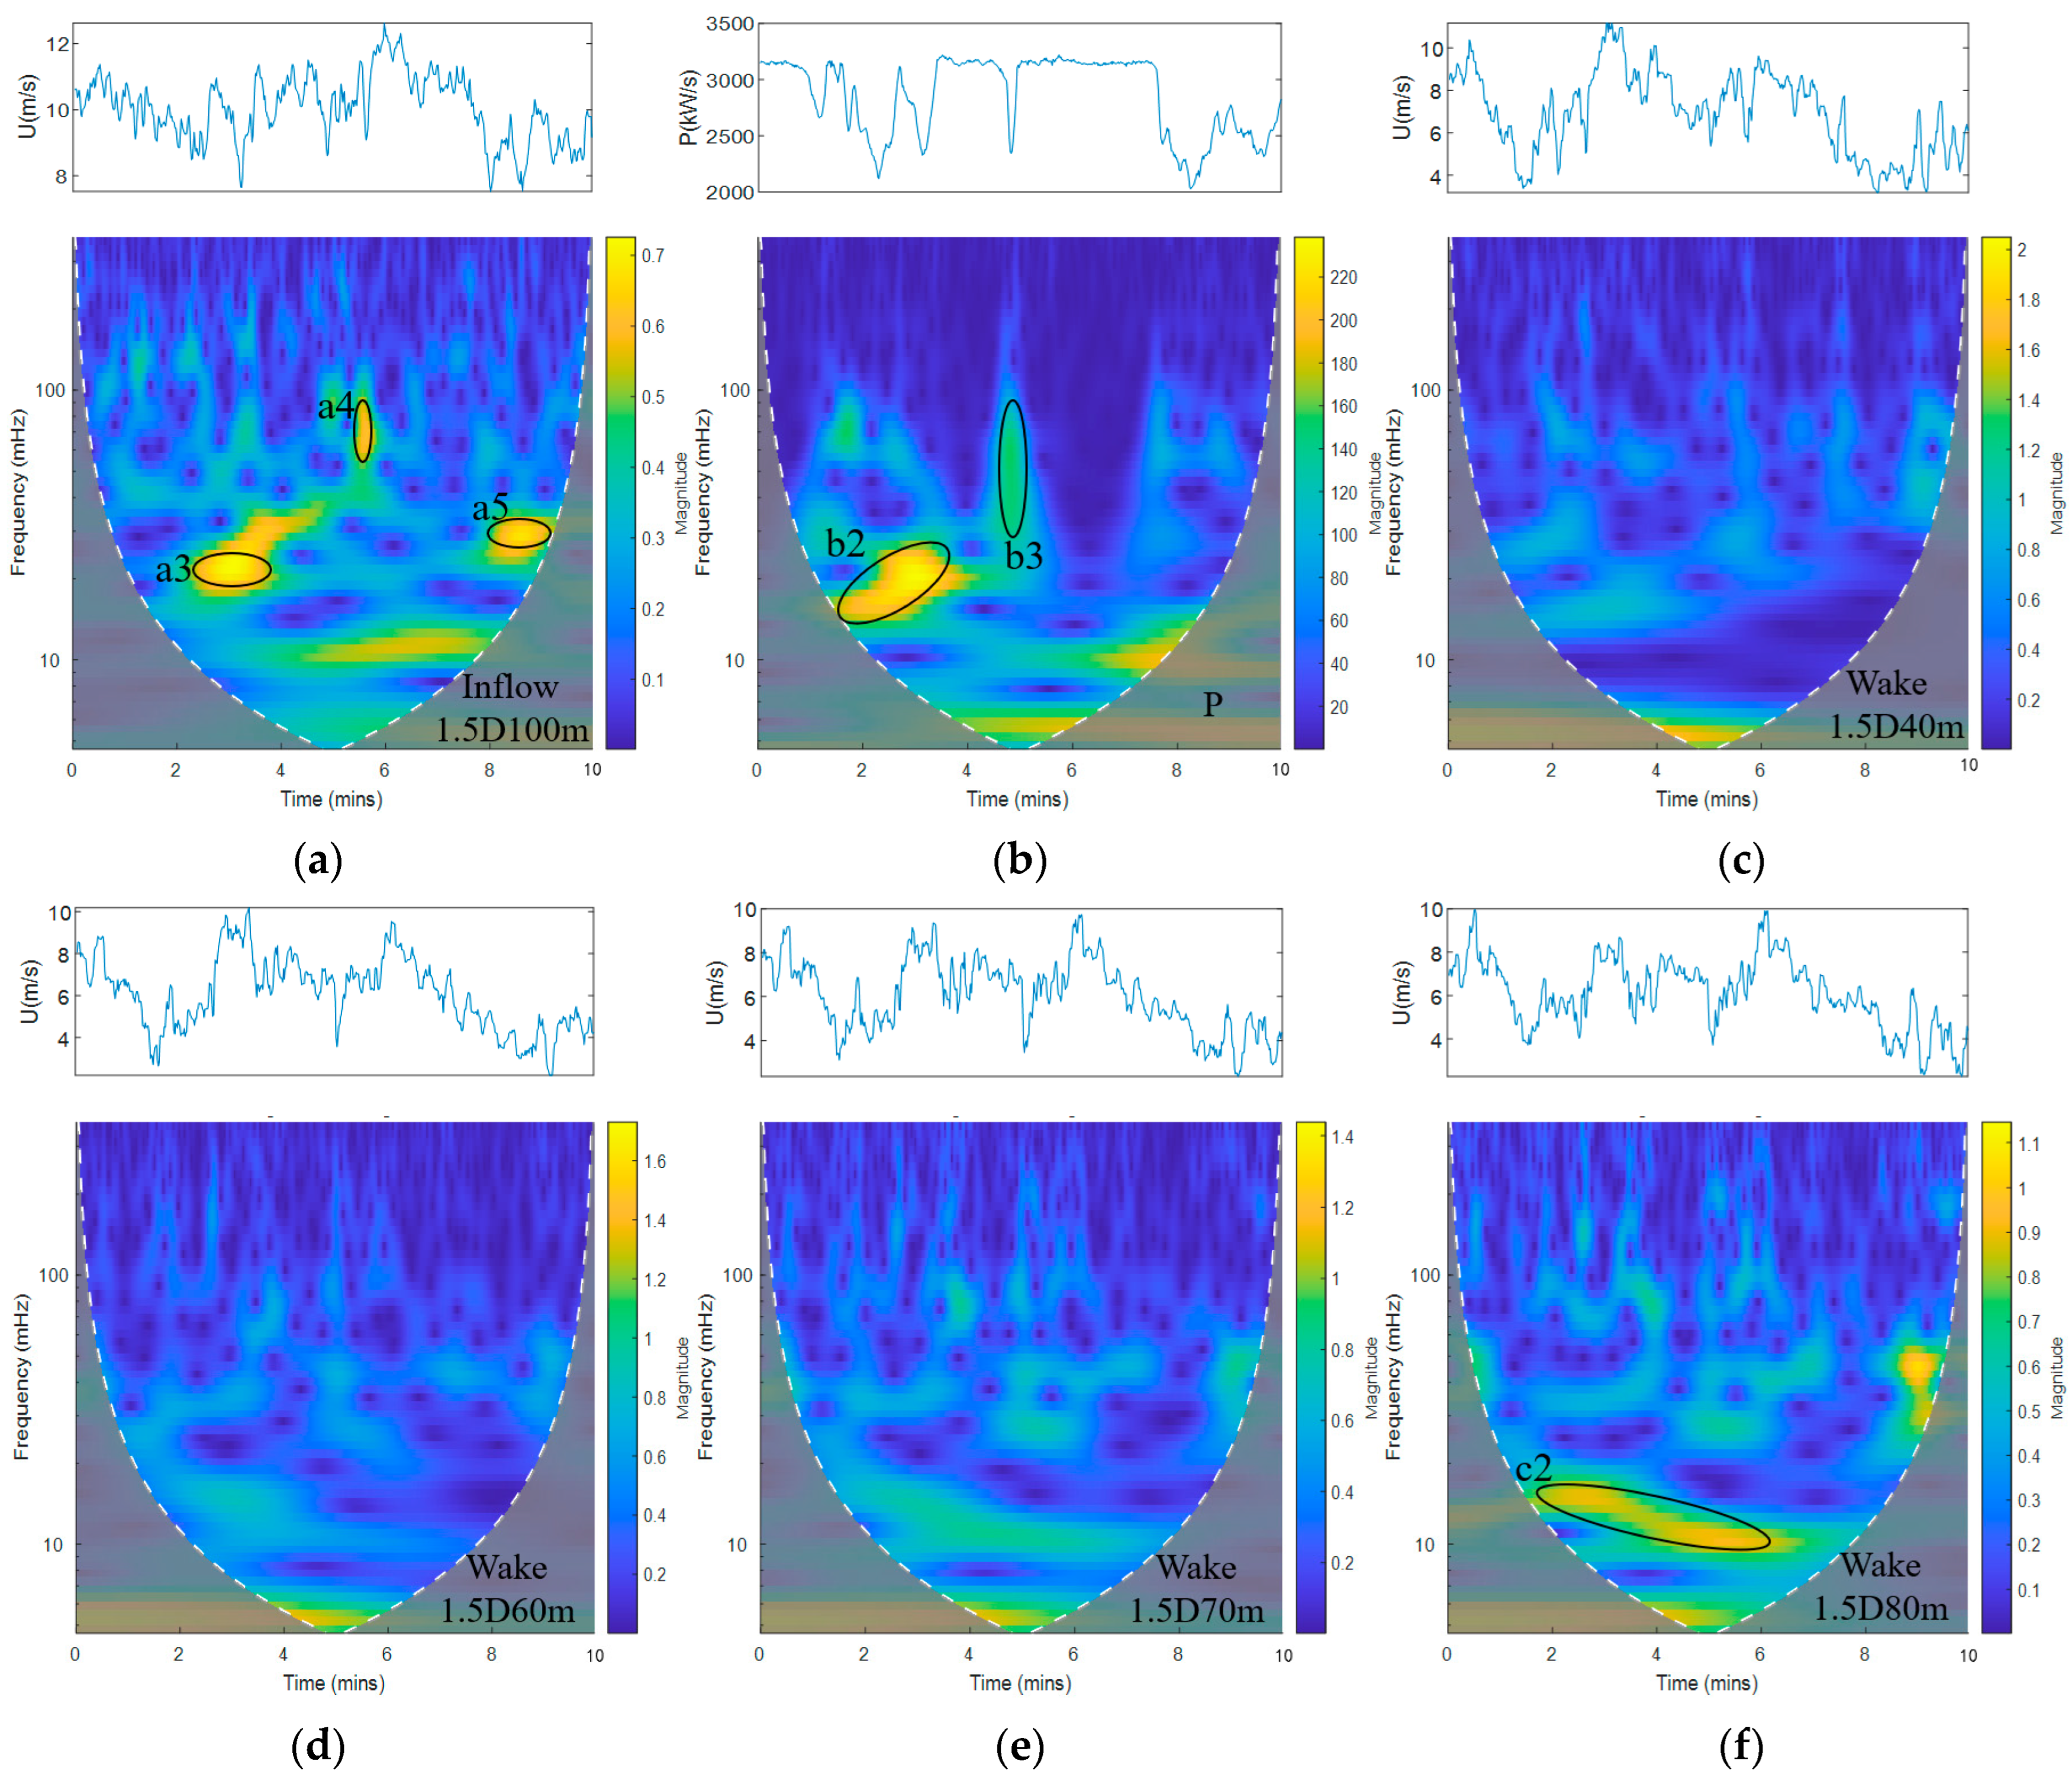
3.2.1. Effect of the Incoming Flow of 9.134 m/s on Power and Wake of the Wind Turbine

The cloud map of time frequency characteristics is shown in Figure 5, which is based on the relevant data in Table 2. With the help of Matlab software, the output power of the wind turbine generator is obtained when the sampling frequency is fixed at 1 Hz, the average rotating speed of the wind turbine is 9.072 rpm, and the average incoming wind speed is 9.134 m/s in front of the wind wheel 1 D with the height of 100 m for l0 min. And the output power of the wind turbine generator, the wavelet analysis results of the wind turbine wake at 1 D behind the wind wheel with vertical heights of 40 m, 60 m, 70 m, 80 m, 90 m, 100 m, 110 m, 130 m, 150 m, and 170 m, and the corresponding time history data are shown in Figure 5.
  • Power fluctuation analysis
From the wavelet analysis results of the incoming wind speed in Figure 5a, it can be seen that when the incoming flow time is 2 min 10 s, which begins to decrease, a large-scale turbulent pulsation occurs with a duration of about 3 min and a frequency of 16 MHz. However, from the results of power wavelet analysis at the same time as Figure 5b, it can be seen that when the incoming flow time is 2 min 20 s, the output power of the wind turbine (corresponding to b0 in the power graph) begins to decrease and a large-scale turbulent pulsation appears with a duration of about 3 min and a frequency of 12 MHz at the same time. It shows that the power change here is caused by the decrease of wind speed at a0 of the incoming flow, and then it can be seen that when the turbulent flow causes large-scale fluctuation of wind turbine power and acts on the wind wheel, the fluctuation frequency of power is less than that of wind speed, that is, the scale effect of turbulence will be magnified. But the small-scale turbulence structure at a2 in Figure 5b does not fluctuate significantly in the power diagram, which indicates that the delayed response of the wind turbine will filter out the high-frequency and small-scale turbulence in the incoming flow. On the other hand, due to the combined action of the turbulence structure at the incoming flow a1 and the delayed response controlled by the pitch control of the wind turbine, the output power of the wind turbine (corresponding to b1 in Figure 5b) decreases sharply and fluctuates continuously.
b.
Wake fluctuation analysis
From the results of wavelet analysis of wake at different heights in Figure 5c–l, it can be seen that there are more high-frequency bright lines in the wake below the height of the wind turbine hub, and the wavelet energy is larger, that is, the continuous small-scale turbulent coherent structure increases. It shows that compared with the incoming flow, the small-scale turbulent flow increases in the wake at the same time. This phenomenon shows that the rotation of the wind turbine will accelerate the collapse of the large-scale turbulent structure of the incoming flow at the blade tip, hub, and tower, and the large-scale vortices continue to collapse into small-scale vortices, that is, the energy level co-evolution process occurs. On the other hand, the phenomenon of energy level connection above the wheel hub height also occurs, but the energy level connection degree is obviously lower than that below the wheel hub height; this is because the measuring points below the wheel hub height are also seriously affected by the tower and ground turbulence structure at the higher incoming wind speed. The tower will produce a tower shadow effect; when the wind turbine blade rotates through the tower, the blade tip vortex is destroyed by the tower, and the tip wake tends to shift downward. And the closer it is to the ground, the more the wake vortex is affected by the ground turbulence structure. Therefore, the wake vortex shows the energy level connection phenomenon under the combined action of the tower and the ground turbulence structure, and this phenomenon is higher than that above the hub height. Furthermore, the large-scale structure turbulence in the incoming flow evolves into a small-scale structure. In addition, the central vortex of the wind turbine hub gradually loses its coherence in the process of wake shedding, which will also increase the high-frequency small-scale vortex mass in the wake and aggravate the degree of vortex dissipation. It corresponds to d0, e0, and f0 in Figure 5g–i, and in terms of the increasing degree of vortex mass, it is the most intense at the hub center e0, followed by f0, and d0 is the weakest. The different dissipation degrees of the three vortices indicate that they may also be affected by factors such as external flow field, tower, and so on. And at this time, the vortex dissipation caused by the infiltration of the micro-mass in the external flow field near the hub center is larger than that produced by the tower in the wake. In the wake diffusion process, the dissipation degree of the upper blade tip vortex is greater than that of the lower blade tip vortex caused by the rotation of the wind turbine, which corresponds to c0 and i0 in Figure 5c–l, and i0 > c0. The reason is similar to the vortex mass dissipation in the hub center, mainly because the rotation of the turbine will aggravate the vortex dissipation, which will enhance the interaction between the wind shear layer and the external boundary layer in the wind turbine wake, which aggravates the momentum exchange and energy transport of high-frequency multiscale vortices between the wind turbine wake and the external flow field. This momentum exchange and energy transport phenomenon at the upper blade tip is obviously larger than that at the lower blade tip, so, here, i0 > c0. Under the action of the larger external flow field, this phenomenon further intensifies the dissipation of multiscale eddy current microclusters generated by relatively high-velocity upper blade tips. From Figure 5c–h, it can also be seen that the frequency of the light pattern measured below the wheel hub height is mainly concentrated between 40 MHz and 80 MHz, while according to the definition of vortex scale, the scale of the corresponding vortex at 40 MHz is about 160 m, close to the diameter of the wind wheel, 146 m, so it can be inferred that the main reason for the increase in the number of lines in this part of the frequency range is that the rotation of the wind wheel shortens the motion cycle of the larger-scale turbulence structure and becomes a relatively small-scale flow. When the incoming flow is 4 min 36 s, the large-scale turbulent vortex structure at a1 has different effects on the different heights of 1 D downstream, especially at g0, h0, and i3, which are significantly affected by the incoming turbulence. And the frequency increases with the increase of height, resulting in the increase of high-frequency small-scale vortices in the wake.

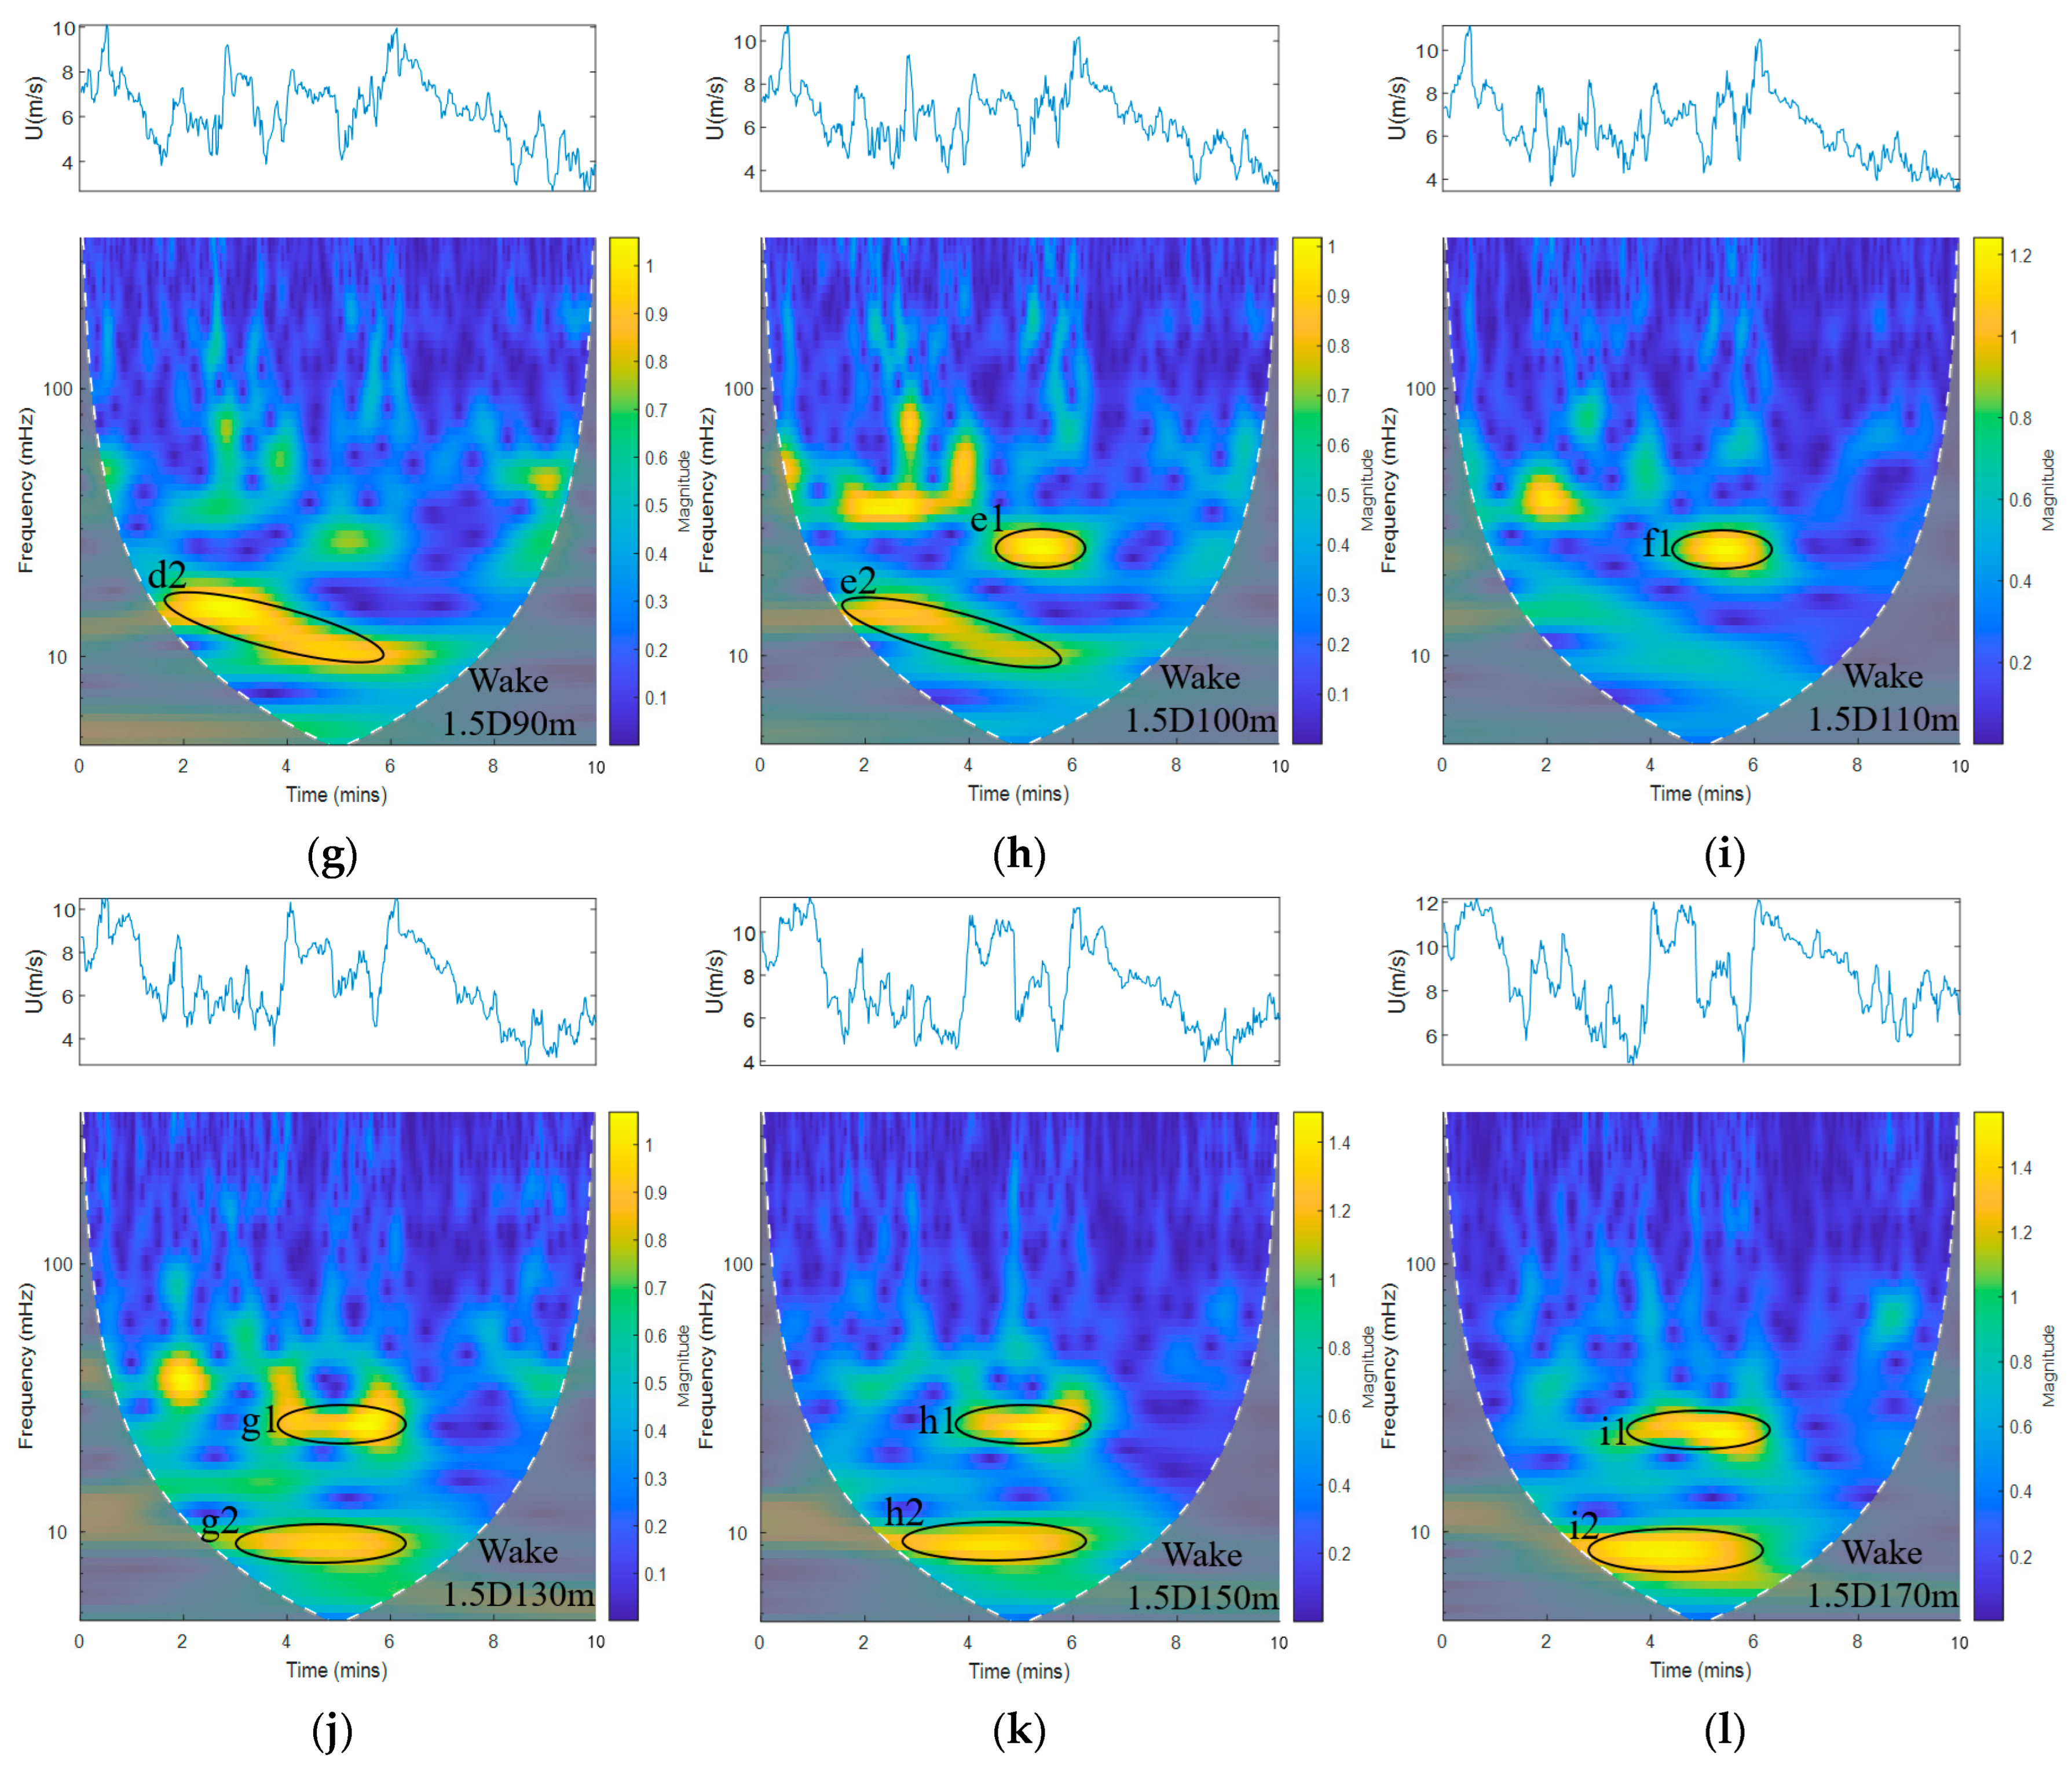
3.2.2. Effect of the Incoming Flow of 10.042 m/s on Power and Wake of the Wind Turbine

The cloud map of time frequency characteristics is shown in Figure 6, which is also based on the relevant data in Table 2. With the help of Matlab software, the output power of the wind turbine generator is obtained when the sampling frequency is fixed at 1 Hz, the average rotating speed of the wind turbine is 10.565 rpm, and the average incoming wind speed is 10.042 m/s in front of the wind turbine 1.5 D with the height of 100 m for 10 min. And the output power of the wind turbine generator, the wavelet analysis results of the wind turbine wake 1.5 D behind the wind wheel with vertical heights of 40 m, 60 m, 70 m, 80 m, 90 m, 100 m, 110 m, 130 m, 150 m, and 170 m, and the corresponding time history data are shown in Figure 6.
  • Power fluctuation analysis
From the wavelet analysis results of the incoming wind speed in Figure 6a, it can be seen that when the incoming flow time are 2 min 20 s, 5 min 40 s, and 8 min, there are some points with higher energy spectrum, such as a2, a3, and a4. However, there is no point with high general energy density in the similar frequency position on the wavelet analysis result of the wind turbine output power in Figure 6b. That is to say, the turbulence of the incoming flow at this scale has no significant effect on the output power of the wind turbine. However, when the time is 1 min 40 s, the b2 point in Figure 6b has a higher energy spectrum, and the maintenance time is about 2 min 30 s, that is, large-scale fluctuations have been maintained during this period of time. From the point of view of the occurrence time, the reason for the large-scale fluctuation of output power is not caused by the fluctuation of the incoming flow at 1.5 D in front of the wind turbine. In addition, compared with the power wavelet analysis under the condition of the incoming flow in front 1 D of the wind turbine, we find that the frequency domain of the distribution at the b3 position is very wide. However, such a strong fluctuation is not found in the wavelet analysis diagram of the incoming flow in Figure 6a. This shows that b3 is also not affected by the incoming wind speed, but by the pitch control of the wind turbine.
b.
Wake fluctuation analysis
From the wavelet analysis of the wake at different heights in Figure 6c–l, bright stripes also appear in the wake below the hub height at 1.5 D behind the wind turbine, such as the strong turbulence pulsations at about c2, d2, and e2 in Figure 6f–h. The main reason is the joint action of the rotation of the wind wheel and the tower. But compared with the measuring points below the hub height of the 1 D wake of the wind turbine, the number of bright stripes at 1.5 D of the wake below the wheel hub height is significantly lower than that of measuring points at 1 D of the wake below the wheel hub height. And this phenomenon is more obvious at the measuring points below the vertical height of 80 m. That is, there is no obvious turbulent fluctuation below the vertical height of 80 m. This shows that the measuring points at 1.5 D of the wake below the wheel hub height are less affected by wind wheel rotation, tower, and ground roughness than at 1 D of the wake. From Figure 6h–l, it can be found that the energy level connection phenomenon of the measuring points at 1.5 D of the wake above the wheel hub height will also occur. And this phenomenon is obviously higher than the measuring points at 1 D of the wake above the wheel hub height, such as when affected by the incoming flow at about a2, there are strong turbulent fluctuations at the wake e1, f1, g1, h1, and i1. And the phenomenon of f1 appears about 10 s earlier than e1, g1 appears about 10 s earlier than f1, h1 appears about 10 s earlier than f1, and i1 appears about 10 s earlier than h1. This is because the wind speed increases gradually with the increase of the height of the measuring point. However, this phenomenon is not obvious in the wake wavelet analysis results under 1 D incoming wind speed. It shows that with the increase of the measuring distance of the wake, the influx of the external flow field further aggravates the momentum exchange and energy transport between the vortex clusters, that is, the influence of the external flow field gradually increases. From the point of view of the maintenance time, the duration of turbulent pulsation at each measurement point at 1.5 D of the wake above the hub height gradually increases with the increase of the measuring point height, but all of them end at about 6 min. Comparing Figure 5 and Figure 6, we can see that the bright fringes in the high-frequency region in the wavelet analysis of the different heights of the wind turbine wake at 1 D are obviously more than those at 1.5 D of the wake. This phenomenon shows that the vortex mass pulsation caused by the rotation of the wind turbine is dominant at 1 D of the wake, while there is less vortex mass pouring in from around the external flow field. In the wavelet analysis of different measurement point heights at 1.5 D of the wind turbine wake, there are significantly more bright stripes located in the low-frequency region than those at 1 D of the wake, as shown in Figure 6j–l in positions such as g2, h2, and i2. This phenomenon shows that with the increase of the measuring distance downstream of the wind turbine, larger and stronger vortex mass may come from other heights in the external flow field and continue to pour into the wake region, so that the turbulent kinetic energy in the low-frequency region of the wake gradually occupies a dominant position.

4. Conclusions

In this paper, by taking a 3.3 MW wind turbine as the experimental research object and using LiDAR testing technology to study the impact of different inflow conditions on wind turbine power and wake in the Qinghai–Tibet Plateau region through wavelet analysis, the following conclusions are drawn.
(1)
When the turbulent flow acts on the wind turbine, it can cause large-scale fluctuation of wind turbine power. The fluctuation frequency of power is less than that of wind speed, that is, the scale effect of turbulence will be magnified. Due to the combined action of the turbulence structure caused by the sudden change of the incoming wind speed and the delayed response of the pitch control of the wind turbine, the output power of the wind turbine decreases sharply and fluctuates continuously.
(2)
The rotation of the wind turbine causes the blade tip vortex to gradually lose its coherence in the shedding process and gradually diffuse in the wake, thus increasing the high-frequency small-scale vortex mass in the wake and aggravating the vortex mass dissipation.
(3)
With the increase of the measurement distance, the bright stripes in the high-frequency region of the wind turbine wake gradually evolve to the low-frequency bright stripes, that is, the vortex mass pulsation generated by the wind turbine wheel rotation in the wake gradually weakens, while the position of the vortex flowing into the wake region at other heights of the external flow field gradually increases.
(4)
In this experiment, the measuring positions of incoming flow and wake are relatively simple, so the influence of incoming flow at different positions on the different positions of wake and power will be further researched by increasing the measuring positions in the future.

Author Contributions

Conceptualization, H.N. and C.Y.; methodology, H.N. and C.Y.; software, H.N.; validation, H.N. and Y.W.; formal analysis, H.N.; investigation, H.N. and Y.W.; writing—original draft preparation, H.N.; writing—review and editing, H.N.; project administration, C.Y.; funding acquisition, C.Y. All authors have read and agreed to the published version of the manuscript.

Funding

This research was funded by the National Natural Science Foundation of China (grant number: 12062012) and Gansu Provincial Wind Turbine Research Special Fund (grant number: 09-071904).

Data Availability Statement

The data presented in this study are available on request from the corresponding author.

Acknowledgments

The authors would like to express sincere appreciation to the editor and the anonymous reviewers for their valuable comments and suggestions for improving the presentation of the manuscript.

Conflicts of Interest

The authors declare no conflict of interest.

References

  1. Huang, C.; Yan, J.; Zhang, D.; Zhong, Y. Analysis of the effect of slope on the power characteristics of wind turbines in hillside terrain. Energy Rep. 2022, 8, 352–361. [Google Scholar] [CrossRef]
  2. Ahmadi, M.; Yang, Z. On wind turbine power fluctuations induced by large-scale motions. Appl. Energy 2021, 293, 116945. [Google Scholar] [CrossRef]
  3. Liew, J.; Urbán, A.; Andersen, S. Analytical model for the power–yaw sensitivity of wind turbines operating in full wake. Wind Energy Sci. 2020, 5, 427–437. [Google Scholar] [CrossRef]
  4. Vergaerde, A.; Troyer, T.; Standaert, L.; Kluczewska-Bordier, J.; Pitance, D.; Immas, A.; Silvert, F.; Runacres, M. Experimental validation of the power enhancement of a pair of vertical-axis wind turbines. Renew. Energy 2020, 146, 181–187. [Google Scholar] [CrossRef]
  5. Cillis, G.; Cherubini, S.; Semeraro, O.; Leonardi, S.; Palma, P. The influence of incoming turbulence on the dynamic modes of an NREL-5MW wind turbine wake. Renew. Energy 2022, 183, 601–616. [Google Scholar] [CrossRef]
  6. Han, Y.; Wang, J.; Li, X.; Jin, K.; Yang, B.; Dong, X.; Wen, C. Experimental study of turbulence intensity on the wake characteristics of a horizontal-axis wind turbine. Energy Source Part A Recovery Utilizat. Environment. Eff. 2022, 4, 9545–9563. [Google Scholar] [CrossRef]
  7. Uchida, T.; Gagnon, Y. Effects of continuously changing inlet wind direction on near-to-far wake characteristics behind wind turbines over flat terrain. J. Wind Eng. Ind. Aero. 2022, 220, 104869. [Google Scholar] [CrossRef]
  8. Ma, J.; Li, X.; Lü, W.; Huo, D.; Wu, Y.; Wang, J. Effects of yaw on wake expansion and tip-vortex dissipation of wind turbine blades based on high-frequency PIV. Trans. Chin. Soc. Agri. Eng. 2019, 11, 57–62. [Google Scholar]
  9. Hirokazu, K.; Yoshihiro, K.; Tetsuya, K. Wind Profile and Power Performance Measurements Using a Nine-beam Nacelle Lidar. Am. J. Mech. Eng. 2018, 2, 75–82. [Google Scholar]
  10. Jiang, H.; Zhang, Y.; Chen, J.; Li, C. Study on the Effect of Vertical Staggered Wind Turbine on the Performance of Downstream Wind Turbine. J. Eng. Therm. Energy Power 2022, 05, 107–114. [Google Scholar]
  11. Bot, E. Flow Analysis with Nacelle-Mounted LiDAR; ECN: Sint Maartensvlotbrug, The Netherlands, 2016; p. 16041. [Google Scholar]
  12. Shin, D.; Ko, K. Experimental study on application of nacelle-mounted LiDAR for analyzing wind turbine wake effects by distance. Energy 2022, 243, 123088. [Google Scholar] [CrossRef]
  13. Apt, J. The spectrum of power from wind turbines. J. Power Sour. 2007, 169, 369–374. [Google Scholar] [CrossRef]
  14. Jin, Y.; Ji, S.; Chamorro, L. Spectral energy cascade of body rotations and oscillations under turbulence. Phys. Rev. E 2016, 94, 063105. [Google Scholar] [CrossRef]
  15. Liu, H.; Jin, Y.; Tobin, N.; Chamorro, L. Towards uncovering the structure of power fluctuations of wind farms. Phys. Rev. E 2017, 96, 063117. [Google Scholar] [CrossRef]
  16. Adaramola, M.; Krogstad, P. Experimental investigation of wake effects on wind turbine performance. Renew. Energy 2011, 36, 2078–2086. [Google Scholar] [CrossRef]
  17. Hong, J.; Toloui, M.; Chamorro, L.; Guala, M.; Howard, K.; Riley, S.; Tucker, J.; Sotiropoulos, F. Natural snowfall reveals large-scale flow structures in the wake of a 2.5-MW wind turbine. Nat. Com. 2014, 5, 4216. [Google Scholar] [CrossRef]
  18. Krishnamurthy, R.; Reuder, J.; Svardal, B.; Fernando, H.; Jakobsen, J. Offshore wind turbine wake characteristics using scanning Doppler lidar. Energy Procedia. 2017, 137, 428–442. [Google Scholar] [CrossRef]
  19. Yang, C.; Wang, Y.; Li, S.; Yang, H. Experimental study on influence of inflow turbulence integral scale on power fluctuation of horizontal axis wind turbine. Acta Ener. Solaris Sinica 2021, 8, 408–413. [Google Scholar]
  20. Wu, S.; Liu, B.; Liu, J.; Zhai, X.; Feng, C.; Wang, G.; Zhang, H.; Yin, J.; Wang, X.; Li, R.; et al. Wind turbine wake visualization and characteristics analysis by Doppler lidar. Opt. Express 2016, 10, A762–A780. [Google Scholar] [CrossRef]
  21. Zhai, X.; Wu, S.; Liu, B. Doppler lidar investigation of wind turbine wake characteristics and atmospheric turbulence under different surface roughness. Opt. Express 2017, 12, A515–A529. [Google Scholar] [CrossRef] [PubMed]
  22. Wu, S.; Yin, J.; Li, R.; Wang, X.; Liu, B.; Liu, J. Observations and analysis of turbulent wake of wind turbine by coherent Doppler lidar. EPJ Web Confer. 2016, 119, 14007. [Google Scholar] [CrossRef]
  23. Feng, C.; Liu, B.; Wu, S.; Liu, J.; Li, R.; Wang, X. Characterization of a wind turbine wake evolving over an intertidal zone performed with dual-lidar observations. Atmos. Meas. Tech. Discuss. 2017, 23, 1–19. [Google Scholar]
  24. Gao, X.; Chen, Y.; Xu, S.; Gao, W.; Zhu, X.; Sun, H.; Yang, H.; Han, Z.; Wang, Y.; Lu, H. Comparative experimental investigation into wake characteristics of turbines in three wind farms areas with varying terrain complexity from LiDAR measurements. Appl. Energy 2022, 307, 118182. [Google Scholar] [CrossRef]
  25. Hou, Y.; Wang, J.; Wang, Q.; Wang, X. Studay on wake turbulence characteristics of wind turbine base on large eddy simulation. Acta Ener. Solaris Sinica 2015, 36, 1818–1824. [Google Scholar]
  26. Zhang, X.; Yang, C.; He, P.; Zhang, Y.; Jin, R. Influences of the heights of low-level jet on aerodynamic loads of horizontal axis wind turbine. Chin. Soc. Elec. Eng. 2019, 39, 2980–2986. [Google Scholar]
  27. Hegazy, A.; Blondel, F.; Cathelain, M.; Aubrun, S. LiDAR and SCADA data processing for interacting wind turbine wakes with comparison to analytical wake models. Renew. Energy 2022, 181, 457–471. [Google Scholar] [CrossRef]
  28. Kumer, V.; Reuder, J.; Svardal, B.; Sætre, S.; Eecen, P. Characterisation of single wind turbine wakes with static and scanning WINTWEX-W LiDAR data. Energy Procedia 2015, 80, 245–254. [Google Scholar] [CrossRef]
  29. Tüfekci, M.; Rendu, Q.; Yuan, J.; Dear, J.; Salles, L.; Cherednichenko, A. Stress and modal analysis of a rotating blade and the effects of nonlocality. 10B: Structures and Dynamics (GT2020-14821). In Proceedings of the ASME Turbo Expo 2020: Turbomachinery Technical Conference and Exposition, Virtual, Online, 21–25 September 2020; Volume V10BT26A0081–V10BT26A008-12. [Google Scholar]
  30. Tüfekci, M.; Genel, Ö.; Tatar, A.; Tüfekci, E. Dynamic analysis of composite wind turbine blades as beams: An analytical and numerical study. Vibration 2021, 4, 1. [Google Scholar] [CrossRef]
  31. Meng, H.; Jin, D.; Li, L.; Liu, Y. Analytical and numerical study on centrifugal stiffening effect for large rotating wind turbine blade based on NREL 5 MW and WindPACT 1.5 MW models. Renew. Energy 2022, 183, 321–329. [Google Scholar] [CrossRef]
  32. Blasques, J.; Bitsche, R.; Fedorov, V.; Lazarov, B. Accuracy of an efficient framework for structural analysis of wind turbine blades. Wind Energy 2016, 19, 1603–1621. [Google Scholar] [CrossRef]
  33. Baars, W.; Talluru, K.; Hutchins, N.; Marusic, I. Wavelet analysis of wall turbulence to study large-scale modulation of small scales. Exp. Fluids 2015, 56, 188. [Google Scholar] [CrossRef]
  34. Bulusu, K.; Plesniak, M. Shannon Entropy-Based Wavelet Transform Method for Autonomous Coherent Structure Identification in Fluid Flow Field Data. Entropy 2015, 17, 6617–6642. [Google Scholar] [CrossRef]
  35. Kanani, A.; Silva, A. Application of continuous wavelet transform to the study of large-scale coherent structures. Environ. Fluid Mech. 2015, 15, 1293–1319. [Google Scholar] [CrossRef]
  36. Rees, J.; Staszewski, W.; Winkler, J. Case study of a wave event in the stable atmospheric boundary layer overlying an Antarctic Ice Shelf using the orthogonal wavelet transform. Dynamics. Atm. Oc. 2001, 34, 245–261. [Google Scholar] [CrossRef]
  37. Durden, D.; Nappo, C.; Leclerc, M.; Duarte, H.; Zhang, G.; Parker, M.; Kurzeja, R. On the impact of wave-like disturbances on turbulent fluxes and turbulence statistics in nighttime conditions: A case study. Biogeosciences 2013, 10, 8433–8443. [Google Scholar] [CrossRef]
  38. Cava, D.; Mortarini, L.; Giostra, U.; Richiardone, R.; Anfossi, D. A wavelet analysis of low-wind-speed submeso motions in a nocturnal boundary layer. Q. J. Roy. Meteor. Soc. 2017, 143, 661–689. [Google Scholar] [CrossRef]
  39. Sun, J.; Mahrt, L.; Nappo, C.; Lenschow, D. Wind and temperature oscillations generated by wave–turbulence interactions in the stably stratified boundary layer. J. Atmos. Sci. 2015, 72, 1484–1503. [Google Scholar] [CrossRef]
  40. Li, D.; Hu, J.; Yu, J.; Guo, T.; Jiao, X.; Li, R. Spatiotemporal evolution of turbulence structure in wake of horizontal-axis wind turbine. J. Lanzhou Univ. Tech. 2020, 46, 64–69. [Google Scholar]
  41. Simonovski, I.; Boltežar, M. The norms and variances of the Gabor, Morlet and general harmonic wavelet functions. J. Sound Vib. 2003, 264, 545–557. [Google Scholar] [CrossRef]
  42. Tomac, I.; Lozina, Ž.; Sedlar, D. Extended Morlet-Wave damping identification method. Int. J. Mech. Sci. 2017, 127, 31–40. [Google Scholar] [CrossRef]
  43. Toge, T.; Pradeep, A. Experimental investigation of stall inception of a low speed contra rotating axial flow fan under circumferential distorted flow condition. Aerosp. Sci. Technol. 2017, 70, 534–548. [Google Scholar] [CrossRef]
  44. IEC61400-12-1:2017; Power Performance Measurements of Electricity Producing Wind Turbines/Remote Sensing Devices Like Sodar & Lidar Measurements. International Electrotechnical Commission (IEC): London, UK, 2017.
Figure 1. Topographic map of the experimental wind farm.
Energies 16 06003 g001
Figure 2. The rose chart of the incoming flow and wake wind speeds and directions. (a) The rose chart of the wind turbine incoming flow wind speeds and directions (1.5 D in front of the wind wheel). (b) The rose chart of the wind turbine wake wind speeds and directions (1.5 D behind the wind wheel).
Energies 16 06003 g002
Figure 3. Installation diagram of the outdoor experimental unit.
Energies 16 06003 g003
Figure 4. Schematic diagram of field experiment measurement.
Energies 16 06003 g004
Figure 5. Wavelet analysis of the incoming wind speed and power at the front 1 D of the wind turbine and the wake at 1 D behind the wind turbine at the same time. (a) Wavelet analysis of the incoming wind speed. (b) Wavelet analysis of the wind turbine power. (c) Wavelet analysis at 40 m vertical height of the wake. (d) Wavelet analysis at 60 m vertical height of the wake. (e) Wavelet analysis at 70 m vertical height of the wake. (f) Wavelet analysis at 80 m vertical height of the wake. (g) Wavelet analysis at 90 m vertical height of the wake. (h) Wavelet analysis at 100 m vertical height of the wake. (i) Wavelet analysis at 110 m vertical height of the wake. (j) Wavelet analysis at 130 m vertical height of the wake. (k) Wavelet analysis at 150 m vertical height of the wake. (l) Wavelet analysis at 170 m vertical height of the wake.
Energies 16 06003 g005aEnergies 16 06003 g005b
Figure 6. Wavelet analysis of the incoming wind speed and power at the front 1.5 D of the wind turbine and the wake at 1.5 D behind the wind turbine at the same time. (a) Wavelet analysis of the incoming wind speed. (b) Wavelet analysis of the wind turbine power. (c) Wavelet analysis at 40 m vertical height of the wake. (d) Wavelet analysis at 60 m vertical height of the wake. (e) Wavelet analysis at 70 m vertical height of the wake. (f) Wavelet analysis at 80 m vertical height of the wake. (g) Wavelet analysis at 90 m vertical height of the wake. (h) Wavelet analysis at 100 m vertical height of the wake. (i) Wavelet analysis at 110 m vertical height of the wake. (j) Wavelet analysis at 130 m vertical height of the wake. (k) Wavelet analysis at 150 m vertical height of the wake. (l) Wavelet analysis at 170 m vertical height of the wake.
Energies 16 06003 g006aEnergies 16 06003 g006b
Table 1. Selection of LiDAR-related parameters.
ZDM LiDARMB300 LiDAR
ParametersDescriptionParametersDescription
Measure distance (m)10~300Measure distance (m)40~300
Measuring the number of layers (C: Number of layers)10CMeasuring the number of layers (C: Number of layers)12C
sampling frequency (HZ)50sampling frequency (HZ)1
Wind speed accuracy (m/s)0.1Wind speed accuracy (m/s)0.1
Wind direction accuracy (°)0.5Wind direction accuracy (°)1
Wind speed range (m/s)1~80Wind speed range (m/s)0~75
Temperature range (°C)−40~50Temperature range (°C)−40~50
AuthenticationIEC61400-12-1:2017 [44]AuthenticationIEC61400-12-1:2017
Table 2. Experimental measurement data.
Incoming Wind Speed
(m/s)
Temperature
T (°C)
Pressure
(mbar)
Wind Shear
Index
Wind Deviation Error
(°)
Upstream LocationDownstream LocationOutput Power
(kW)
Turbulence
9.134−12.356980.2091−1.831 D1 D1141.40.1
10.042−11.556970.11580.1261.5 D1.5 D2861.00.11
Disclaimer/Publisher’s Note: The statements, opinions and data contained in all publications are solely those of the individual author(s) and contributor(s) and not of MDPI and/or the editor(s). MDPI and/or the editor(s) disclaim responsibility for any injury to people or property resulting from any ideas, methods, instructions or products referred to in the content.

