Article

Three-Dimensional CFD Simulation of a Proton Exchange Membrane Electrolysis Cell

by
Giuseppe Corda
*,
Antonio Cucurachi
,
Stefano Fontanesi
and
Alessandro d’Adamo
*
Dipartimento di Ingegneria “Enzo Ferrari”, Università degli Studi di Modena e Reggio Emilia, Via Vivarelli 10, 41125 Modena, Italy
*
Authors to whom correspondence should be addressed.
Energies 2023, 16(16), 5968; https://doi.org/10.3390/en16165968
Submission received: 11 July 2023 / Revised: 2 August 2023 / Accepted: 7 August 2023 / Published: 13 August 2023
(This article belongs to the Topic Modeling, Optimization, and Control of Energy Systems)

Abstract

:
The energy shift towards carbon-free solutions is creating an ever-growing engineering interest in electrolytic cells, i.e., devices to produce hydrogen from water-splitting reactions. Among the available technologies, Proton Exchange Membrane (PEM) electrolysis is the most promising candidate for coping with the intermittency of renewable energy sources, thanks to the short transient period granted by the solid thin electrolyte. The well-known principle of PEM electrolysers is still unsupported by advanced engineering practices, such as the use of multidimensional simulations able to elucidate the interacting fluid dynamics, electrochemistry, and heat transport. A methodology for PEM electrolysis simulation is therefore needed. In this study, a model for the multidimensional simulation of PEM electrolysers is presented and validated against a recent literature case. The study analyses the impact of temperature and gas phase distribution on the cell performance, providing valuable insights into the understanding of the physical phenomena occurring inside the cell at the basis of the formation rate of hydrogen and oxygen. The simulations regard two temperature levels (333 K and 353 K) and the complete polarization curve is numerically predicted, allowing the analysis of the overpotentials break-up and the multi-phase flow in the PEM cell. An in-house developed model for macro-homogeneous catalyst layers is applied to PEM electrolysis, allowing independent analysis of overpotentials, investigation into their dependency on temperature and analysis of the cathodic gas–liquid stratification. The study validates a comprehensive multi-dimensional model for PEM electrolysis, relevantly proposing a methodology for the ever-growing urgency for engineering optimization of such devices.

1. Introduction

The increasing focus on climate change and global warming has induced governments of industrialised countries to radically review future energy production and management strategies. Decarbonisation and environmental sustainability policies aim at promoting the research and development of alternative technologies, combining increasing energy demand with a net reduction of environmental impact. The use of renewable energy sources (RES) is a long-term strategy, requiring not only the capacity of RES to fulfil the energy production request but also the development of energy storage technologies, shaving the peaks of energy overproduction [1,2]. Energy chemical storage in the form of hydrogen production unveils several possibilities, being an energy buffer and carrier that can be used both as storage as well as in almost every application to replace fossil fuels. However, hydrogen must be produced in its molecular form (H2), which is extremely rare in nature, and hence it must be obtained by the separation of hydrogen-containing compounds (e.g., water or methane). The achievement of short-term decarbonisation requires not only the development of technologies to produce massive amounts of hydrogen, but also a shift in the leading technology away from the to-date ubiquitous use of Steam Methane Reforming (SMR) and coal gasification, which jeopardise both the decarbonisation and energy independence goals. The electrolysis of water powered by RES-derived electricity is the only way to produce carbon-free hydrogen, also named “Green Hydrogen”. This process is characterized by sustainability and high efficiency and production volumes. Among the available technologies, the Proton Exchange Membrane Electrolyser Cell (PEMEC) is the most suitable to accommodate the highly unstable and fluctuating energy supply from RES overproduction to store it in the form of hydrogen, although technology advances are still needed to lower the specific cost of hydrogen production and to improve the profitability of PEM-based electrolysis plants [3].
A water electrolyser is an electrochemical device that splits water molecules into gaseous hydrogen and oxygen, thus directly converting electrical into chemical energy. Its operation is based on a complex interaction between fluid/thermal and electrochemical processes, such as the multi-phase flow field’s evolution of the reactants supply and the removal of products from the reaction sites, with a direct effect on the electrochemical reaction rate and the required energy for the process. Also, the interaction of multiple parts requires a fundamental understanding of how the different materials interact with transport processes, such as heat rejection and the current of charges (both electric and ionic). A detailed knowledge of such aspects allows optimizing PEMEC design, thus reducing the amount of required catalyst or the formation of local stresses, for improved PEMEC economy with minimal degradation issues.
Numerical simulation is a powerful tool that allows the study and quantifying of all the mentioned phenomena [4]. This can be done on different levels, from zero-dimensional models [5,6] to more complex three-dimensional ones. Multi-dimensional Computational Fluid Dynamic (CFD) models belong to the last class, allowing the simulation of the interaction of the heat/fluid/current transport and the distribution of each variable, thus complementing experiments for difficult to measure quantities. Given the analogy with the physics involved in fuel cells operation, CFD has been recently used to deepen the understanding of the operation of Proton Exchange Membrane Fuel Cells (PEMFC) [7]. However, the number of simulation studies on PEMEC is noticeably lower, hence leaving a critical knowledge gap on the topic. Among the available studies, Nie et al. [8] published a 3D-PEMEC model based on a mixture multi-phase approach [9]. The study refers to the anodic water flow and the two-phase flow field in the channel is analysed in terms of pressure and velocity distribution, to improve the design of bipolar plates. However, the electrochemical reaction is replaced by a constant and uniform oxygen production along the MEA/channel interface. They concluded that parallel configuration is not an optimal design for bipolar plates, because of the high non-uniformity of the oxygen concentration. Ruiz et al. [10] developed a high-temperature PEMEC model operating above 100 °C, studying the impact of three different channel configurations on the cell performance (parallel, single- and multi-path serpentine). They analysed the thermal field, the distribution of pressure in the channels, the current density, and the molar fraction of hydrogen within the cell, asserting that the multi-path serpentine design shows the best performance. In this work, all the components of a PEMEC are considered, and mass and heat transfer within each media and the electrochemical kinetics at the electrodes are taken into account. However, due to the high working temperature, the presence of the liquid phase is completely neglected, so they adopt a single-phase approach. Similarly, Toghyani et al. [11,12,13] developed a single-phase 3D-CFD model finalised to study different channel configurations, obtaining results in line with [10] and confirming that the multi-serpentine design leads to the best performance. Porous media were modelled with a macro-homogeneous approach, i.e., replacing the complex porous micro-structure with statistical parameters (e.g., porosity, etc.). Despite the operating temperature being 353 K, the presence of liquid water is critically neglected, justified by considering the anodic two-phase flow as being more important at current densities higher than that considered. Ma et al. [14] proposed a 3D-CFD study of a triple serpentine PEMEC based on the mixture multiphase model, considering the development of flow, thermal, and electrochemical fields. Several processes are considered, such as electro-osmotic drag, membrane water diffusivity, and water evaporation. However, catalyst layers (CLs) are not directly modelled and they are replaced by a reacting interface. As commonly done in PEMFC models [15], this modelling simplification reduces the computational cost, but it also introduces a relevant simplification of the electrode physics [16]. Lafmejani et al. [17] used a Volume of Fluid (VOF) multi-phase model, numerically tracking the inter-phase surface and aiming at simulating the superficial motion. This was used to describe the unsteady gas/liquid anodic flow, including the gas bubbles morphology and the gas/liquid superficial interaction. Results provide a detailed description of the two-phase distribution in the channel, although modelling assumptions include isothermal processes, the neglect of capillary effects in porous media, phase transition, and electrochemistry. Another valuable VOF study of PEMEC is in [18] where an iterative procedure links the two-phase VOF method to the 3D full-cell model. The anodic gas/liquid phase evolution is studied utilizing the VOF method, obtaining the volume fraction distribution at the channel/electrode interface and using this information as a boundary condition for the full-cell model, resolving the oxygen pressure equation in the porous medium. Nevertheless, the computational cost is very high due to the reduced time step required.
The present work presents a modelling methodology for the three-dimensional fluid-dynamic simulation of a PEMEC. The model is a non-isothermal and multi-physics approach to simulate the multi-phase flows (using the mixture multi-phase model) in the domain of a PEMEC. The study relevantly extends the use of a recently developed macro-homogeneous model of CLs [19], applied here to the reproduced PEMEC model and experimental data from [14] for several voltages and at two temperature levels, thus allowing us to exhaustively elucidate all the crucial phenomena at the basis of PEMEC operation. The 3D modelling of these devices allows for a comprehensive view of the concurring processes (e.g., distribution of the gas phase, temperature field, etc.), and their respective effects on cell performance, thus quantifying hard to measure quantities. This promotes the use of the presented model as a key step of the design and optimization phases of these devices.

2. Mathematical Modelling

The mixture multi-phase model (MMP) method is used in this study to consider the presence of multiple phases, where it is assumed that these are miscible and at equilibrium, and that their motion can be simulated as that of a unique continuum. Continuity, momentum, and energy equations are solved for the Eulerian mixture (e.g., the mixture density ρ m or mixture velocity vector u ¯ m are considered), and the phase subdivision is handled by a dedicated transport equation for the volume fraction [20,21,22]. The governing equations for the MMP model (Equations (1)–(6)) are synthesised in Table 1, together with the region-dedicated source term specification. In this study, the governing equations are simplified using the following modelling assumptions:
  • Laminar flow regime, because of the low fluid velocity both in channels and porous diffusion media. The calculated Reynolds number in the examined cases is approximately 1000 in the channels, confirming this assumption.
  • Ideal gases behaviour, given the relatively low pressure and temperature.
  • The gravitational force is not considered.
  • The gas diffusion layer (GDL) and CL are treated as isotropic and homogeneous porous media, characterized by effective permeability, uniform porosity, and tortuosity.
  • Butler–Volmer kinetics govern the electrochemical reaction at the anode and cathode.
  • The membrane is an impermeable solid medium, and the water flux is modelled by sorption reactions at the interfaces adjacent to CLs.
  • The simulations are steady state since the objective is to analyse the time-independent cell’s performance at different voltages, aiming at understanding its stationary operation and numerically reproducing the polarization curve.

2.1. Porous Media Modelling

The chosen modelling approach involves neglecting the complex fibrous structure of the material, which is substituted by a macro-homogeneous approach. This allows consideration of the co-presence of both a liquid and a solid phase, and dedicated variables are introduced with this aim, such as porosity, tortuosity, permeability, etc. For the calculation of tortuosity, the equation proposed in [23] is used:
τ = 1 + 0.72 1 ε ( ε 0.11 ) 0.54
As discussed in [19], the flow resistance exerted by the porous medium is expressed in Equation (8), where a viscous and an inertial contribution are present. Given the low velocities involved, the inertial term can be neglected, whereas the viscous term of the n-th phase is calculated as in Equation (9) [19].
f ¯ p = ( P ¯ v i s + P ¯ i n | u ¯ m | ) · u ¯ m
P ¯ v i s = μ ( n ) K K r l · I ¯  
where μ ( n ) , K , and K r l are the dynamic viscosity, the material permeability, and the relative permeability, respectively. Equation (10) with k = 4 is used to calculate the latter, in agreement with [24].
K r l , n = α ( n ) k
The contribution of capillary force is considered through a vector source term in the momentum equation, formulated as in Equation (11), including the gas–liquid surface tension (σ) and the fluid/wall contact angle ( θ c = 110 ° ) and expressing the momentum exerted by the gradient of the capillary pressure. Here it is determined using a Leverett’s function because of the lack of experimental data, although it has been derived for largely different porous media (homogeneous solid and sandy beds) as discussed in [25].
f ¯ U ( n ) = α ( n ) α ( m ) σ · c o s ( θ c · π 180 ) · ε τ · [ 1.417 · ( 1 α ( n ) ) 2.120 · ( 1 α ( n ) ) 2 + 1.263 · ( 1 α ( n ) ) 3 ]

2.2. Membrane Modelling

The polymeric membrane is modelled as an impermeable solid electrolyte, preventing the crossover of fluids and allowing ion current. The ionic conductivity is calculated using the correlation proposed by Springer et al. [26] (Equation (12), justified by the analogy with PEMFC where the same perfluorosulfonic polymer (DuPont® Nafion, New Castle, DE, USA) is used. Differently than in PEMFC technology, where reactant humidification techniques are mandatory for sufficient power generation [27], in the PEMEC simulation the membrane water content ( λ ) is imposed at λ = 22 , i.e., a fully hydrated condition. This is justified by the massive presence of liquid water in contact with the membrane. This same assumption is made in [14].
σ e f f = ( 0.5139 λ 0.326 ) · exp [ 1268 ( 1 303 1 T ) ]

2.3. Electrochemical Modelling

The electrolysis reaction in a PEMEC develops in two separate half-reactions. Water molecules ( H 2 O ) react on the anodic electrode (Equation (13)), producing protons ( H + ), electrons ( e ), and molecular oxygen ( O 2 ), whereas at the cathode electrons and ions combine (Equation (14)) to produce molecular hydrogen ( H 2 ).
H 2 O 2 H + + 2 e + 1 2 O 2
2 H + + 2 e H 2
The voltage to be applied to sustain the PEMEC reactions depends both on the open-circuit potential ( E O C V ) and on several potential losses as in Equation (15), i.e., η a c t , c , η a c t , a (cathodic and anodic activation overpotentials), η c o n c (concentration overpotential), and η o h m (ohmic overpotential). Open-circuit voltage and activation overpotentials are calculated as in Equations (16)–(18) [28,29,30], where α a / c are the charge transfer coefficients (symmetrical and equal to 1), F is the Faraday constant, R the ideal gas constant, i the current density, and i 0 , a / c the anodic/cathodic exchange current density.
V c e l l = E O C V + η a c t , c + η a c t , a + η c o n c + η o h m
E O C V = 1.229 0.9 · 10 3 ( T 298.15 ) + R T 2 F l n ( p H 2 p O 2 1 / 2 p H 2 O )
η a c t , a = R T α a F a r c s i n h ( i 2 i 0 , a )
η a c t , c = R T α c F a r c s i n h ( i 2 i 0 , c )
Exchange current densities are calculated as indicated in [14] to ensure validation (Equations (19) and (20)), whereas the ohmic overpotential is obtained by the thermal power dissipated by the Joule effect ( Q ˙ o h m ) and the current ( I ) in the different components of the cell (Equation (21)).
i 0 , a = 2.83792 · 10 7 exp ( 28 , 920.95 8.314 ( 1 T 1 303.15 ) )
i 0 , c = 2.15 · 10 2 exp ( 17 , 000 8.314 ( 1 T 1 303.15 ) )
η o h m = Q ˙ o h m , B P + Q ˙ o h m , G D L + Q ˙ o h m , C L + Q ˙ o h m , m e m I = Q ˙ o h m , t o t I
Finally, the cathodic/anodic volumetric current densities ( j c / a ) are calculated using Butler–Volmer equations (Equations (22) and (23)), depending on the specific active area of the catalyst ζ [1/m].
j c = ζ ·   i 0 , c · [ e ( α a F η c R T ) + e ( α c F η c R T ) ]
  j a = ζ · i 0 , a · [ e ( α a F η a R T ) e ( α c F η a R T ) ]
The CL is modelled adopting a macro-homogeneous approach, which is implemented in the commercial CFD code SIMCENTER STAR-CCM+, licensed by SIEMENS DISW, via user-coding. This approach allows the three-dimensional modelling of the CL, which is represented as a finite-thickness part, and it ensures the development of electrochemical reactions on the unresolved internal surface. Despite not being geometrically detailed, it is estimated by means of average parameters, as reported in [19]. The solid phase of the CL consists of both an ionomeric solid phase, equivalent to that used for the membrane and deputed to ion transport, and an electronic solid phase, represented by carbon-supported platinum and used for the electron transport.

3. 3D-CFD Model

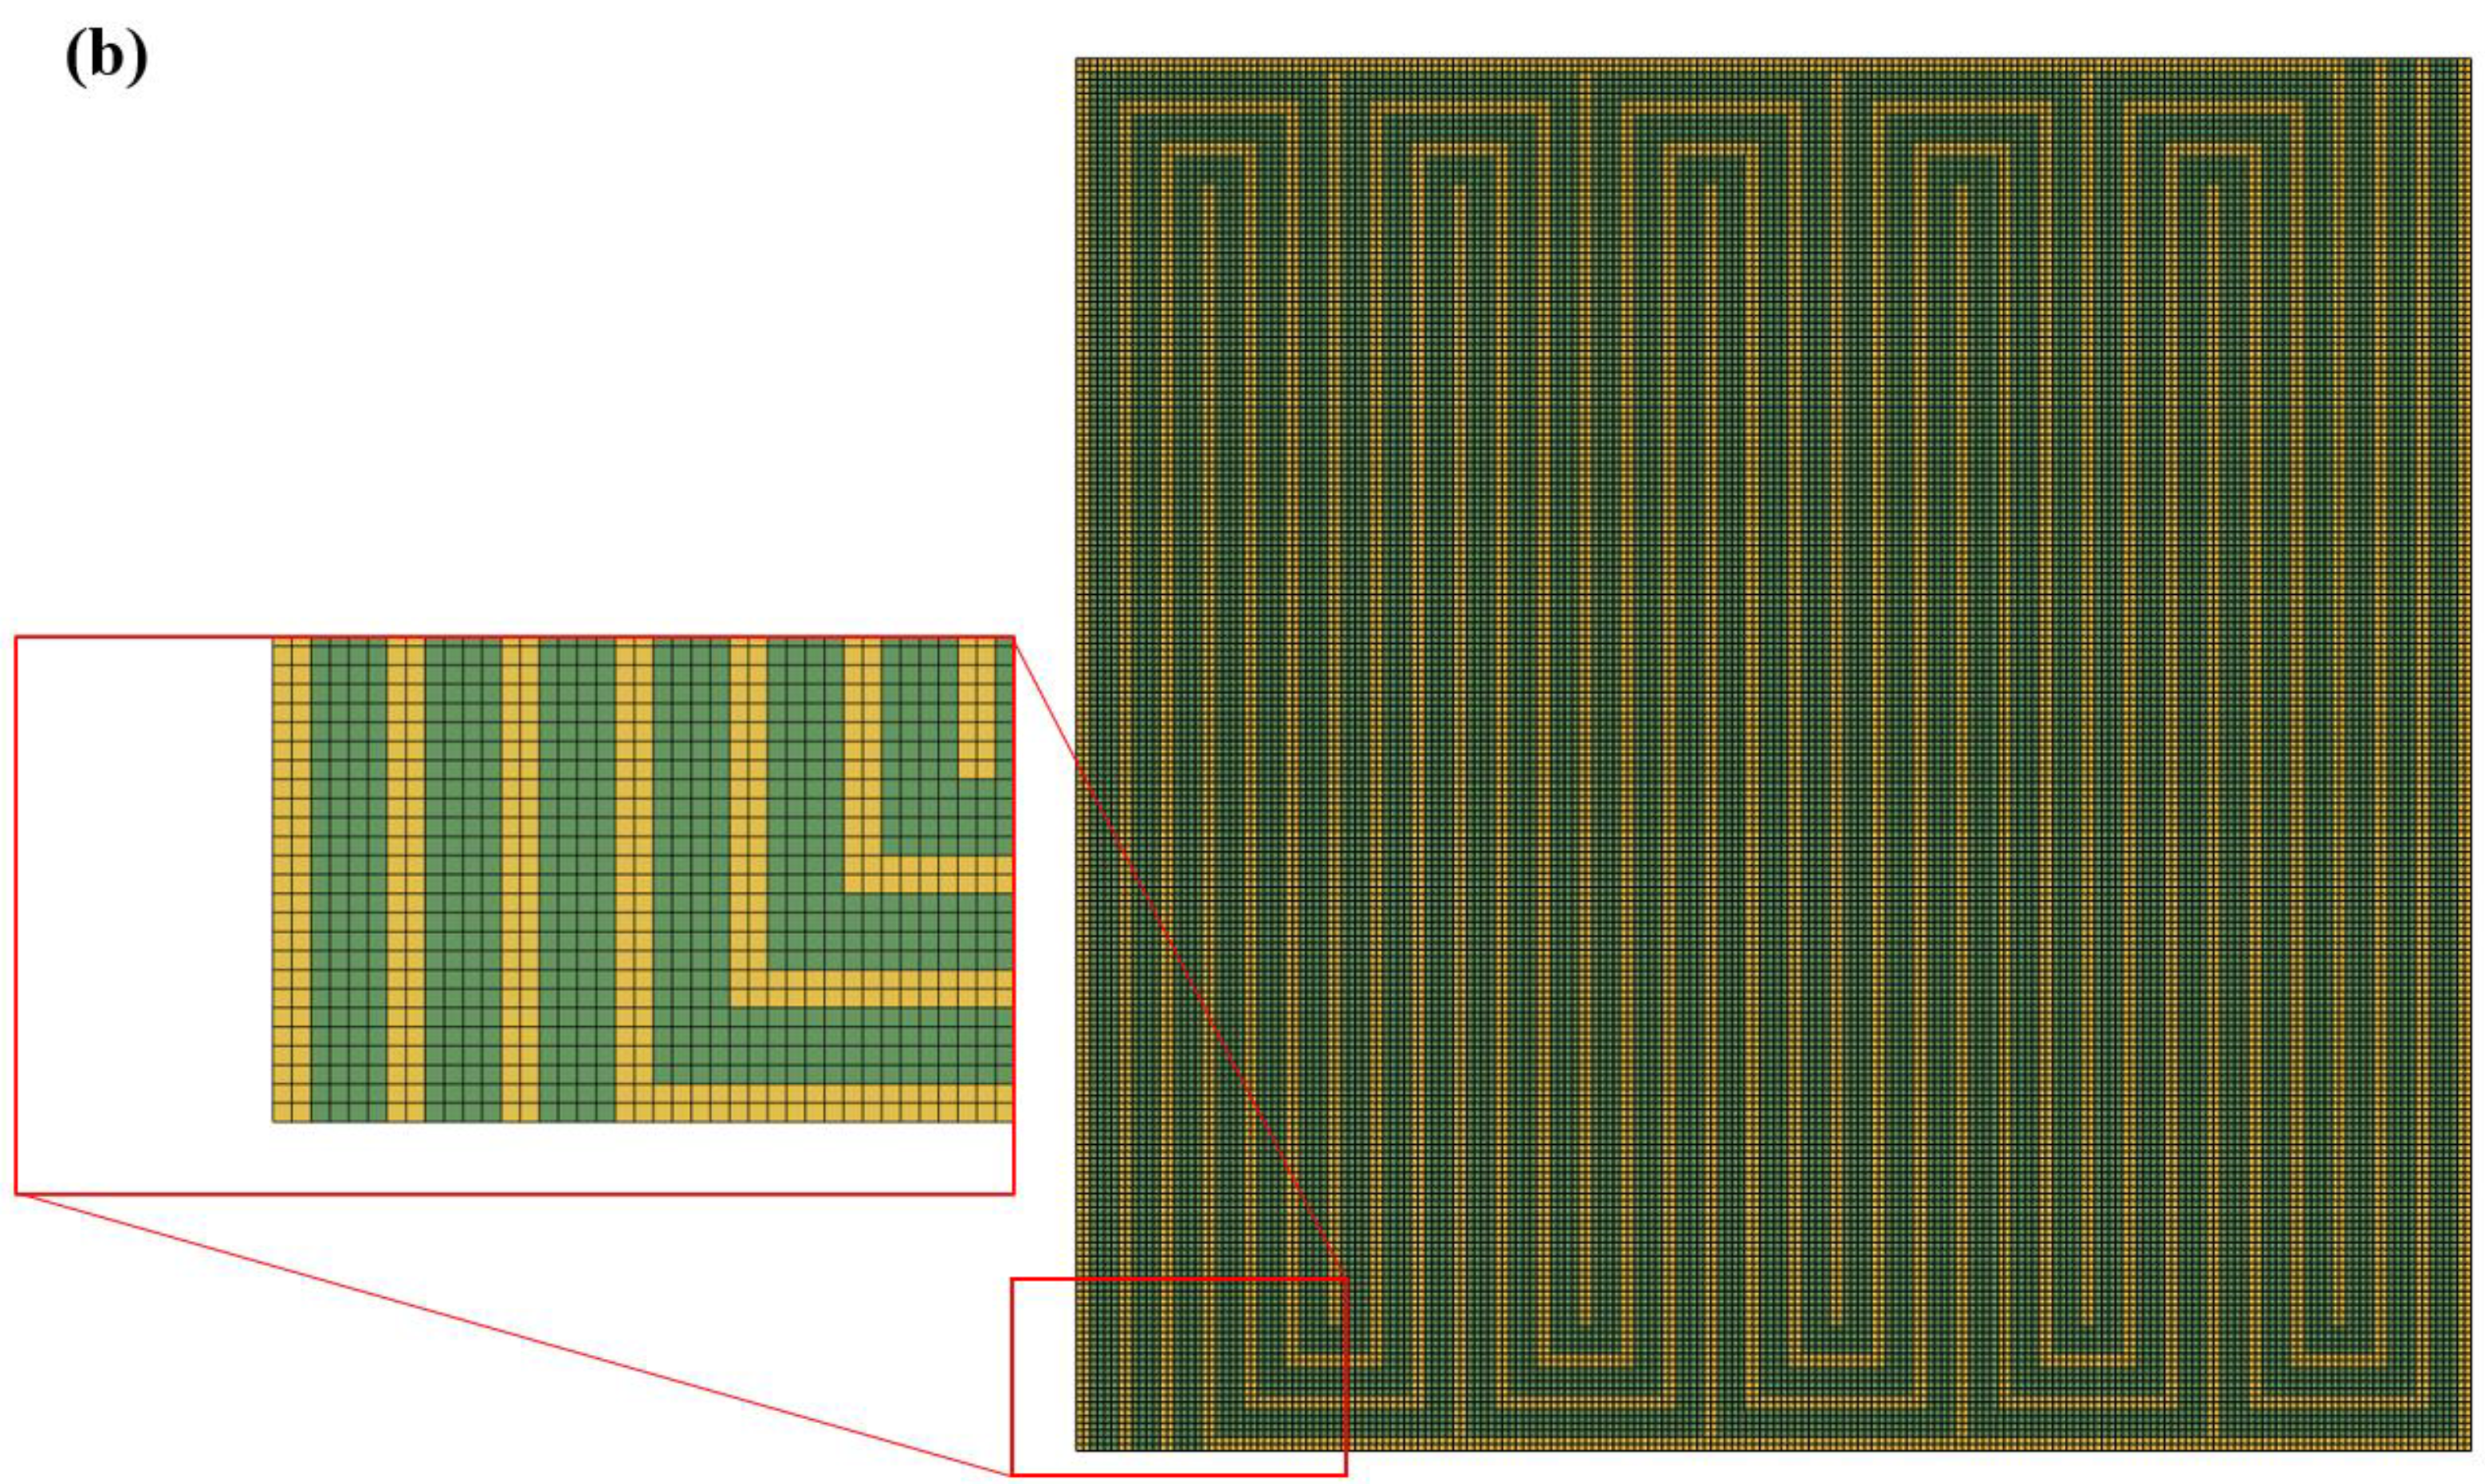
The model of a PEMEC with a three-channel serpentine proposed by Ma et al. in [14], whose geometry and dimensions are shown in Figure 1a–c and Table 2, respectively, is reproduced in SIMCENTER STAR-CCM + v2022.2 (SIEMENS DISW). This is a cell with a triple serpentine channel configuration measuring 5 cm × 5 cm. The number of computational cell layers for MEM, CL, and GDL are 4, 3, and 6, respectively. The finite volume mesh consists of approximately 1.35 M hexahedral cells, of which 120 k are for each CL. This was chosen from mesh independence tests until mesh-independent solutions were obtained. However, coarser grids (especially in the axial direction) will be evaluated in future studies based on the guidelines proposed in literature. Numerical simulations were run on a 32-core Linux cluster, with a computational time of approximately 20 h of physical time for each case. Material characterization and boundary conditions are reported in Table 3 and Table 4, respectively. The thermal and electrical characterization of the boundary conditions at external walls is that of adiabatic ( T / x = 0 , with x being the wall-normal direction) and insulating ( φ s / x = 0 ) surfaces, except for the current collectors (top and bottom surfaces in Figure 1) treated as isothermal ( T = 333   K / 353   K , depending on the simulated operating condition) and isopotential surfaces, with imposed values at the cathode/anode of φ s = 0 / V , respectively, with V spanning the 1.4–2.0 V range with a step of 0.1 V, and a refined 0.05 V step for low-voltage operation. The temperature on the outer bipolar plate walls is set to the inlet temperature of water (i.e., 333 K and 353 K for the two tested temperatures), assuming an ideal cooling system behaviour. A face-normal velocity specification is imposed at anodic and cathodic inlets, with values based on the flowrate specification from [14] and reported in Table 4, with the single-phase (liquid) water temperature equal to 333 K or 353 K depending on the simulated condition, whereas ambient pressure is imposed at outlet sections for the formed multi-phase mixture (gaseous hydrogen/liquid water at the cathode and gaseous oxygen/liquid water at the anode, respectively).

4. Results

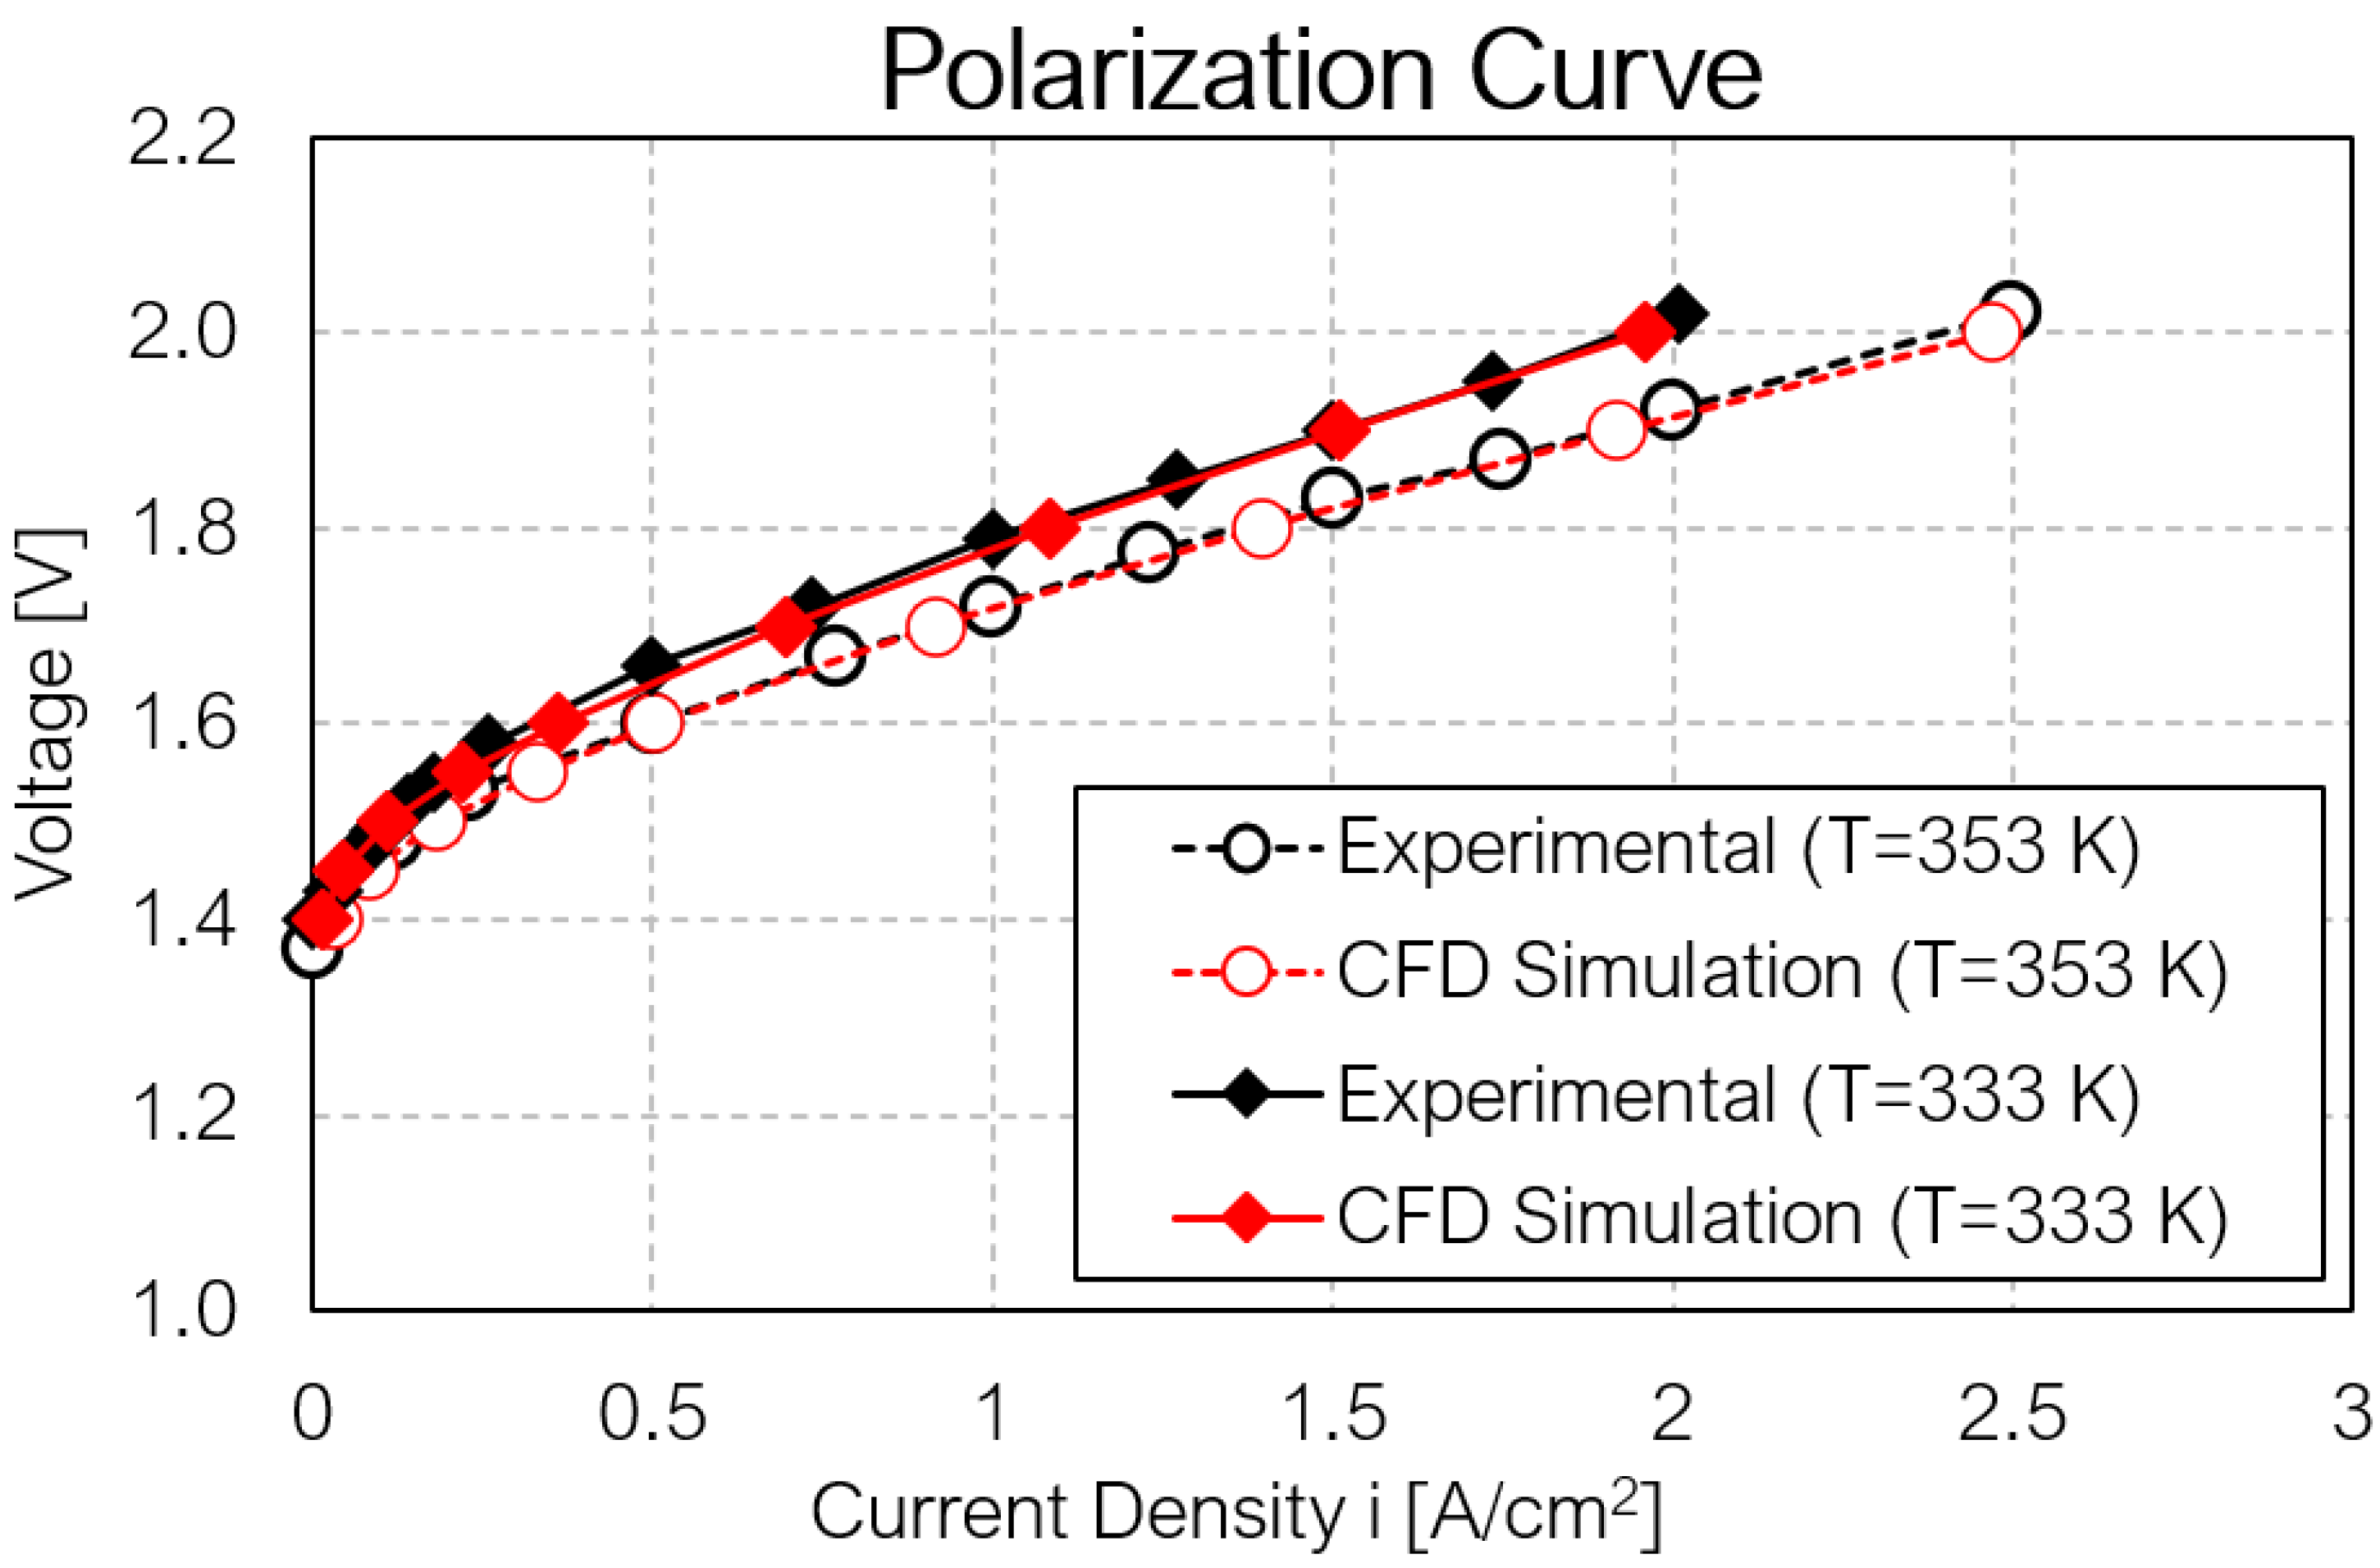
The validation of the numerical model is achieved by comparing the simulated polarization curve with the experimental data reported in [14], for two temperature levels. As it can be seen in Figure 2, the presented results show a good agreement in terms of current/voltage for both the analysed operating temperatures. The experimentally observed voltage reduction with temperature is accurately reproduced by simulations and it is attributed to the increase in the exchange current density (Equations (19) and (20)) and in the membrane ionic conductivity (Equation (12)) with temperature. This results in a reduction of the activation and ohmic overpotentials, respectively, and the obtained results confirm a physics-based modelling of overpotentials contributions.
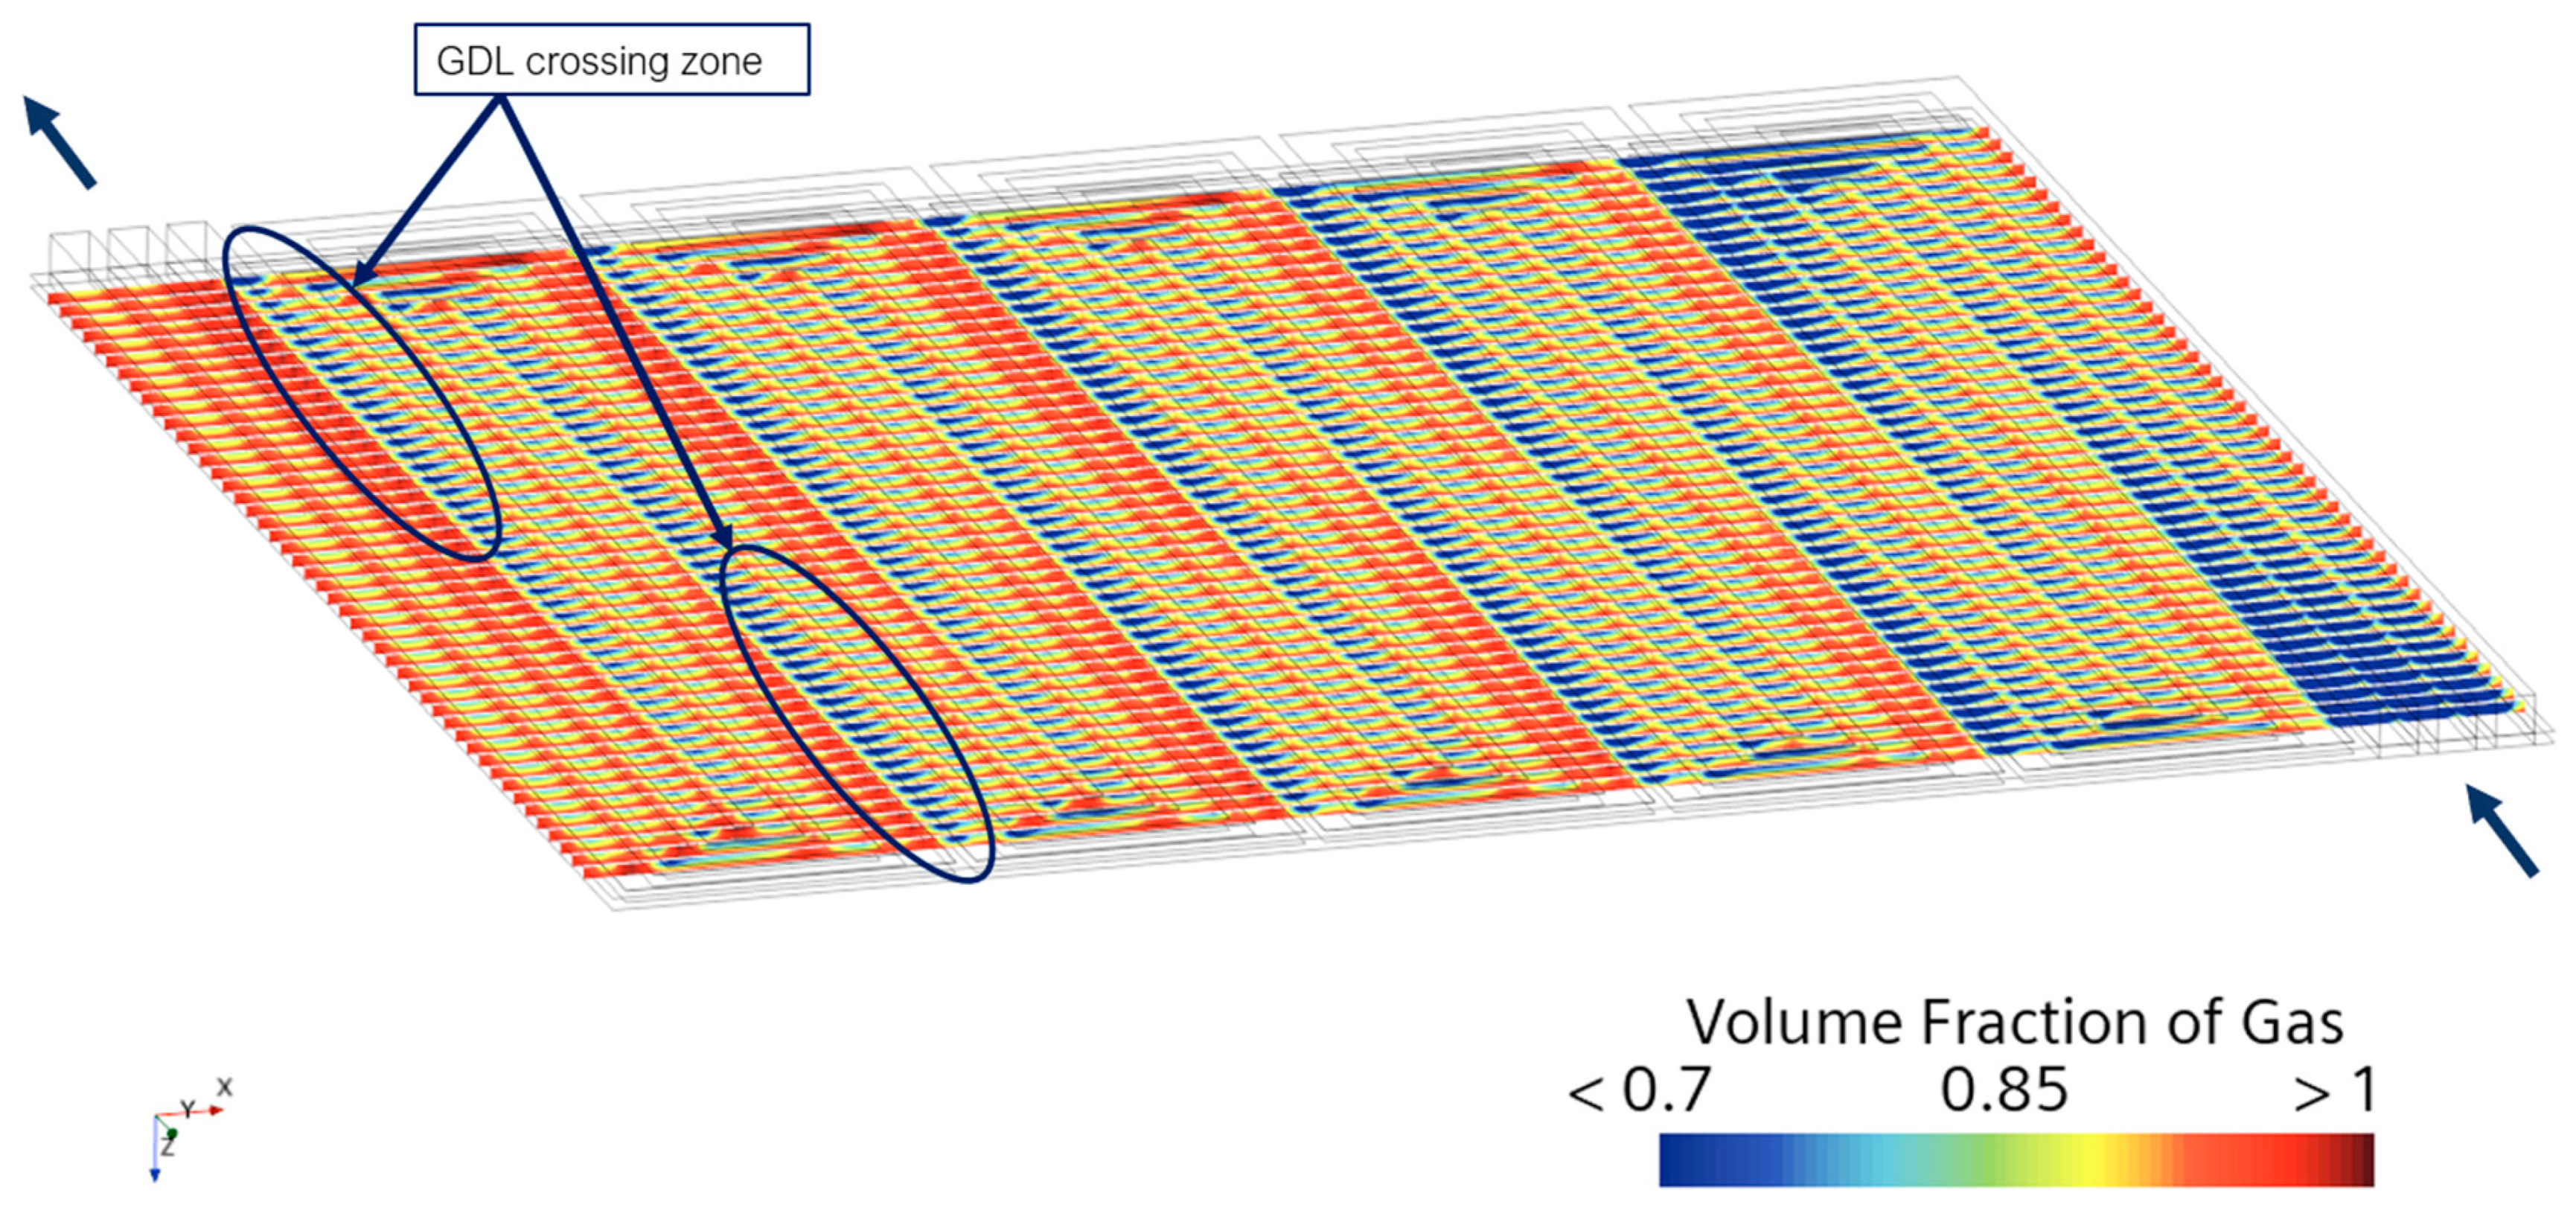
To gain more insight into the performance, an analysis of the individual overpotentials is shown for each operating voltage in Figure 3. The largest contribution is the anodic activation overpotential, motivated by the reduced exchange current density value. The lowest loss is constituted by the mass transport overpotential, negligible for operations below 1.6 V and noticeable only around 2.0 V. This is due to the progressive filling of anodic CL with gaseous oxygen, obstructing the transport of reactants due to its high specific volume (gaseous) and the flow obstruction exerted by porous materials (CLs and GDLs). As might be expected, the ohmic overpotential tends to increase as the current supplied to the electrolyser increases. Figure 4 shows the volume fraction of gas at the interface between the GDL and anode-side channels. The horizontal bands with a reduced volume fraction of gas near the serpentine bends are due to the entry of liquid water into the gas diffusion layer, which tends to push the gas away and eject it into the adjacent channel, where bands with higher values can be seen. This phenomenon is caused by the pressure gradient between these adjacent channel pairs, drawing the liquid to bypass the channel path through the GDL. This phenomenon is explained in detail below.
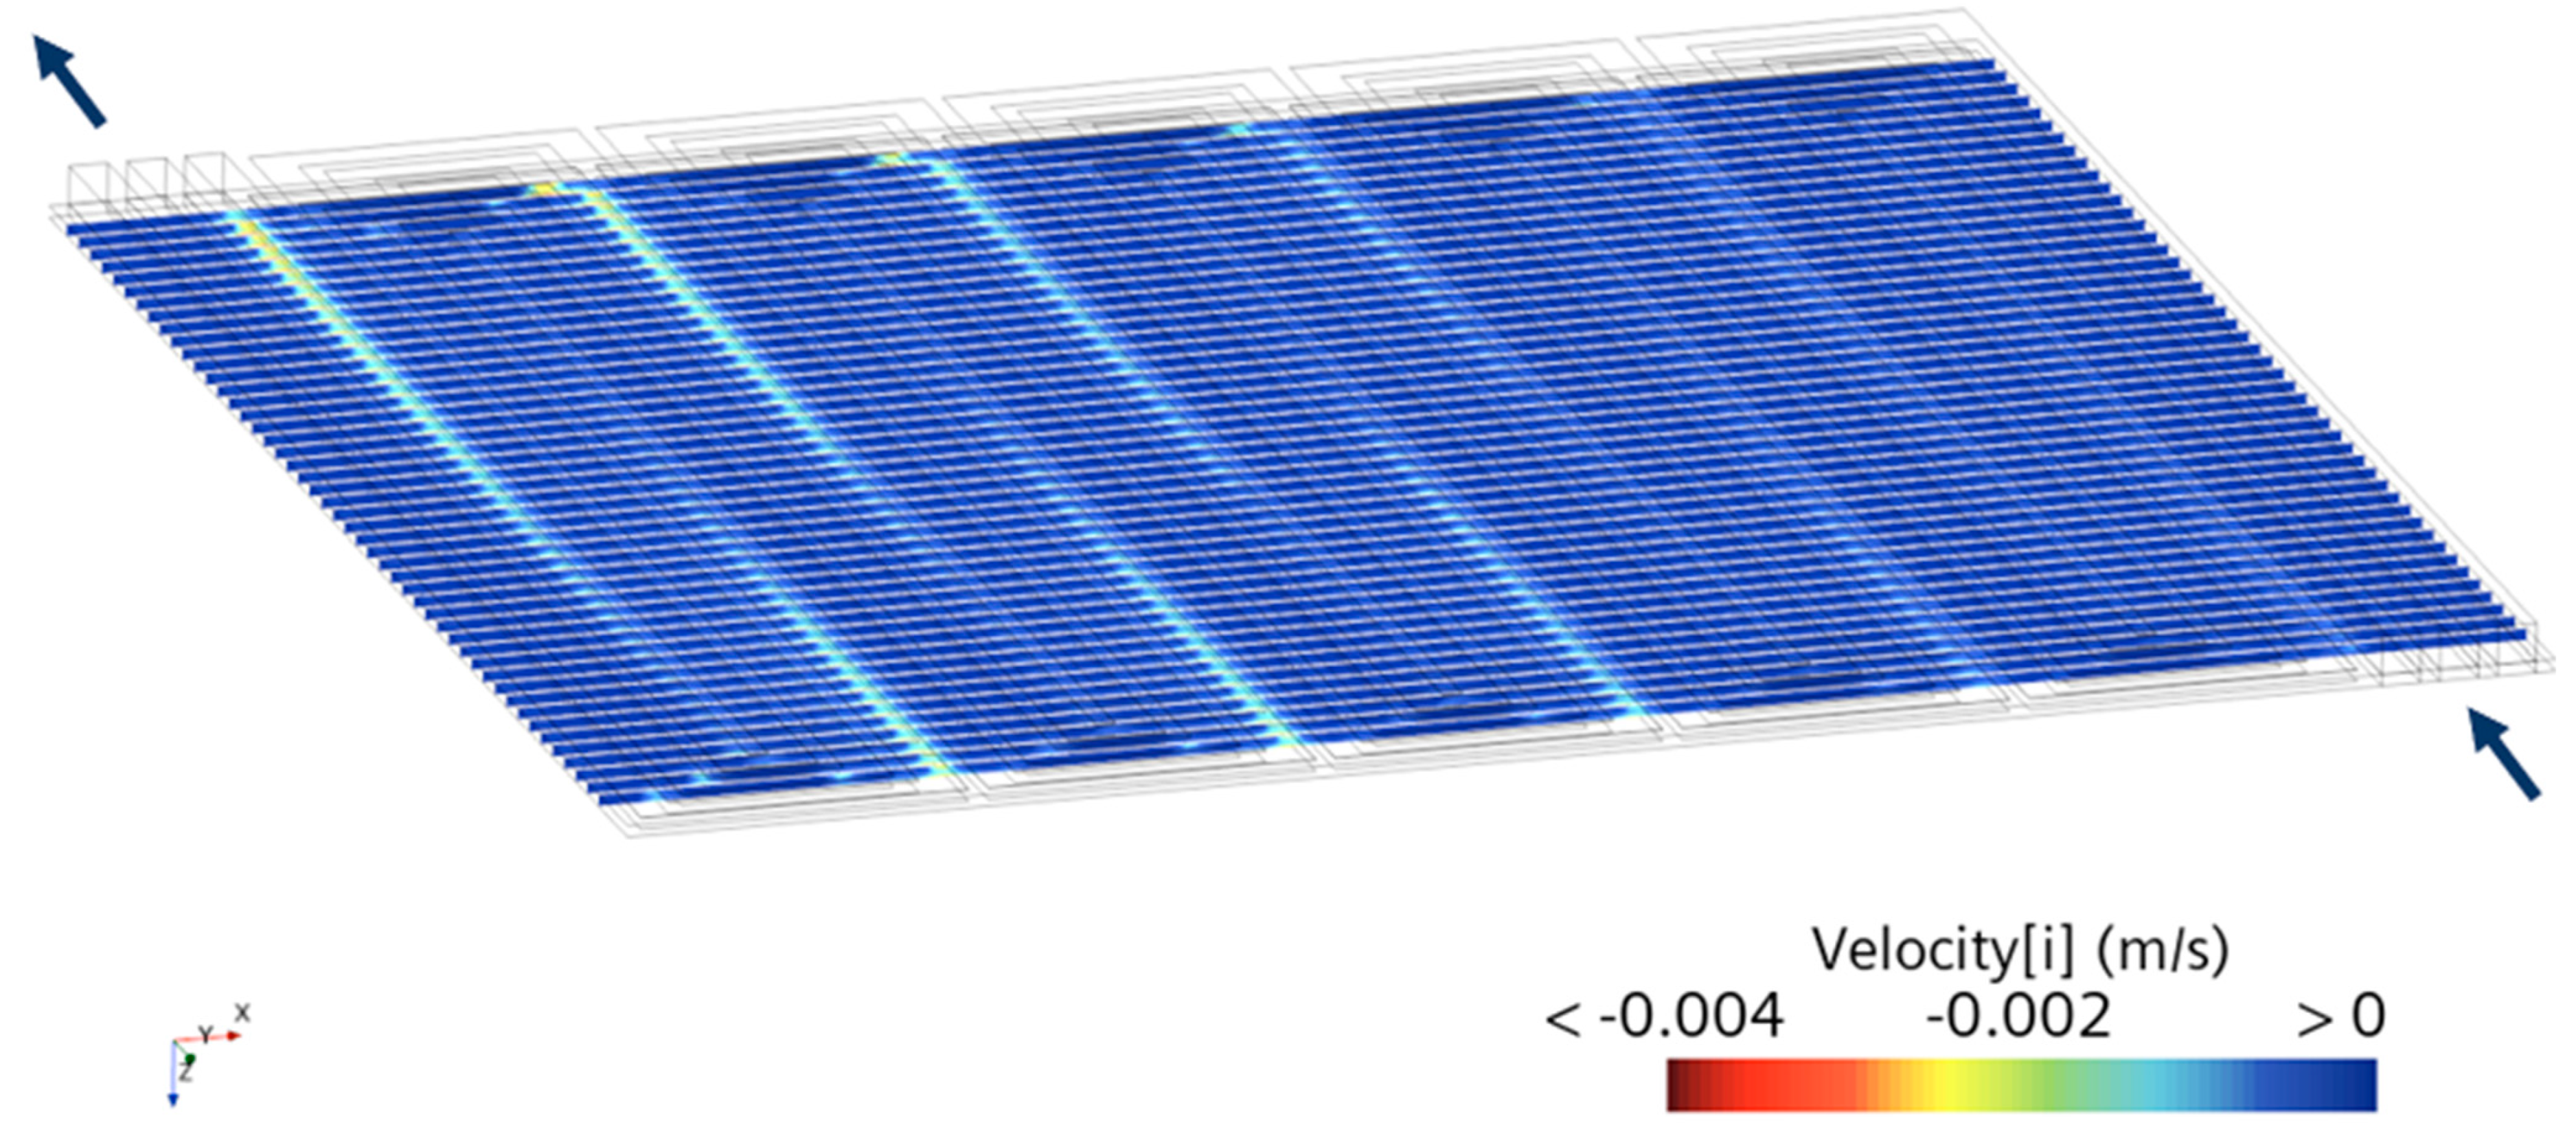
Figure 5 shows the distribution of the volume fraction of gas in the sections within the GDL, highlighting the gas accumulation areas and the liquid by-pass flow. The x-direction component of the mixture velocity, whose negative values confirm the fluid by-pass trend through the GDL under the BP in the indicated areas, is shown in Figure 6. The effect of this phenomenon decreases as the gas proceeds along the channel due to the reduction of the pressure gradient between adjacent channels, as will be explained in detail below.
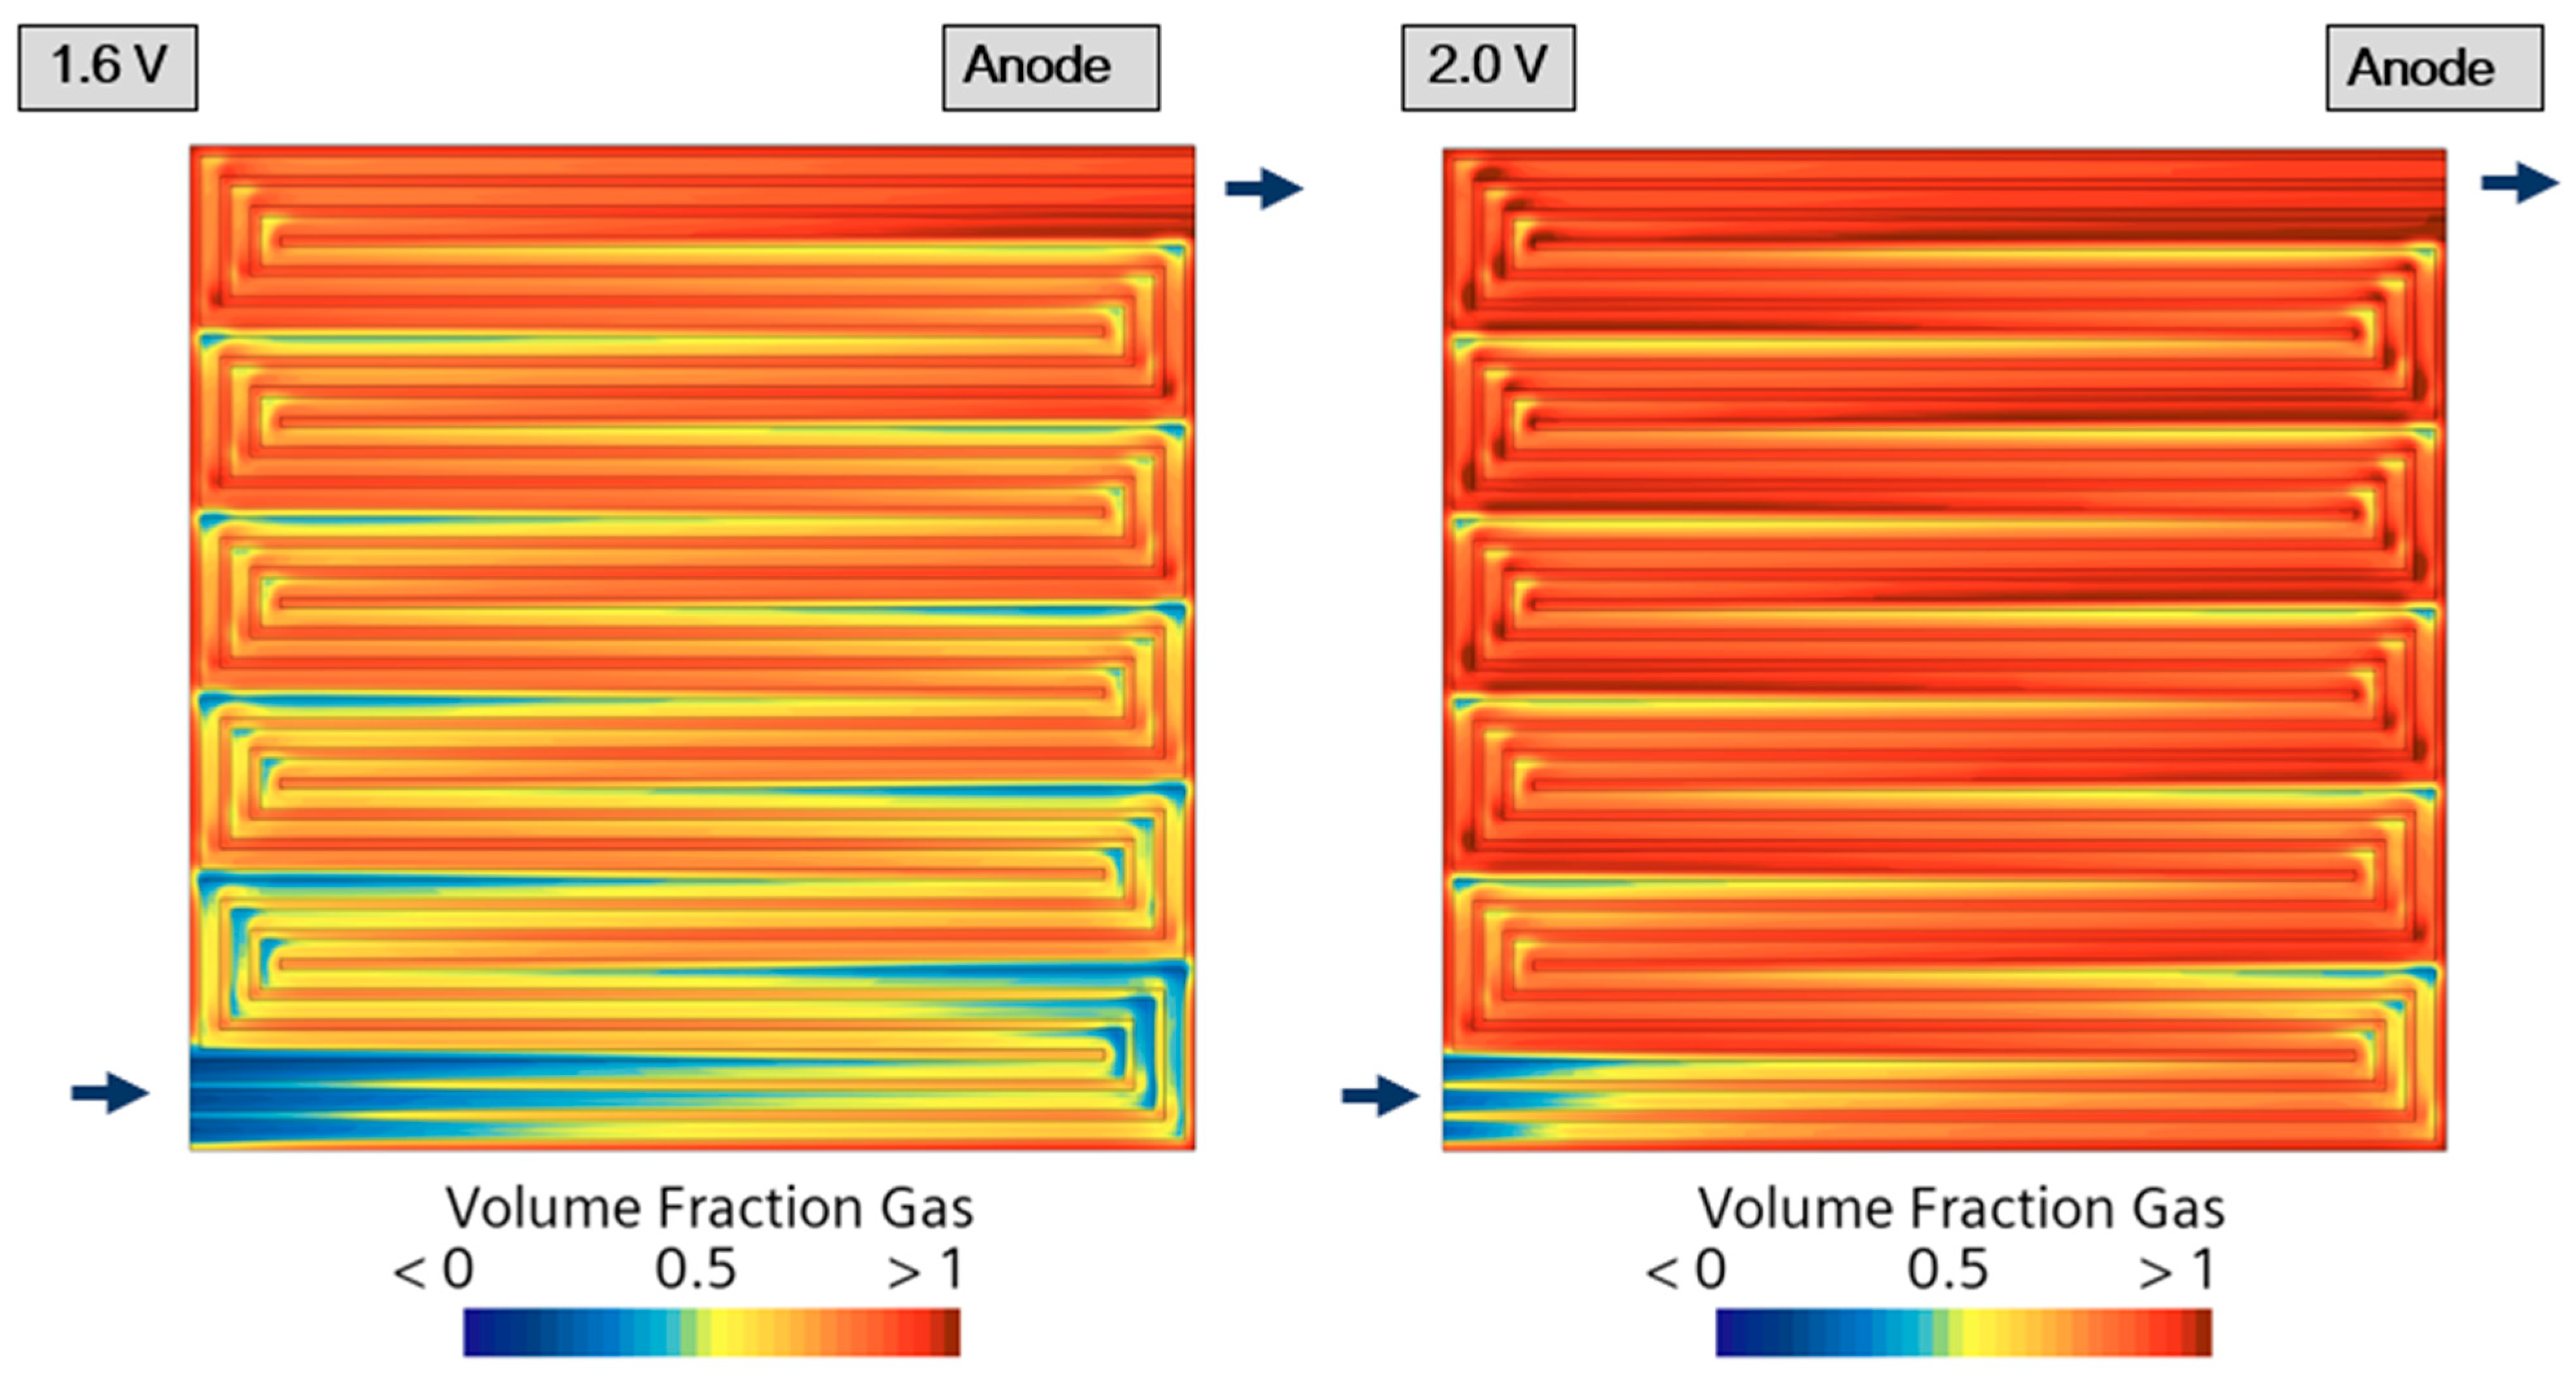
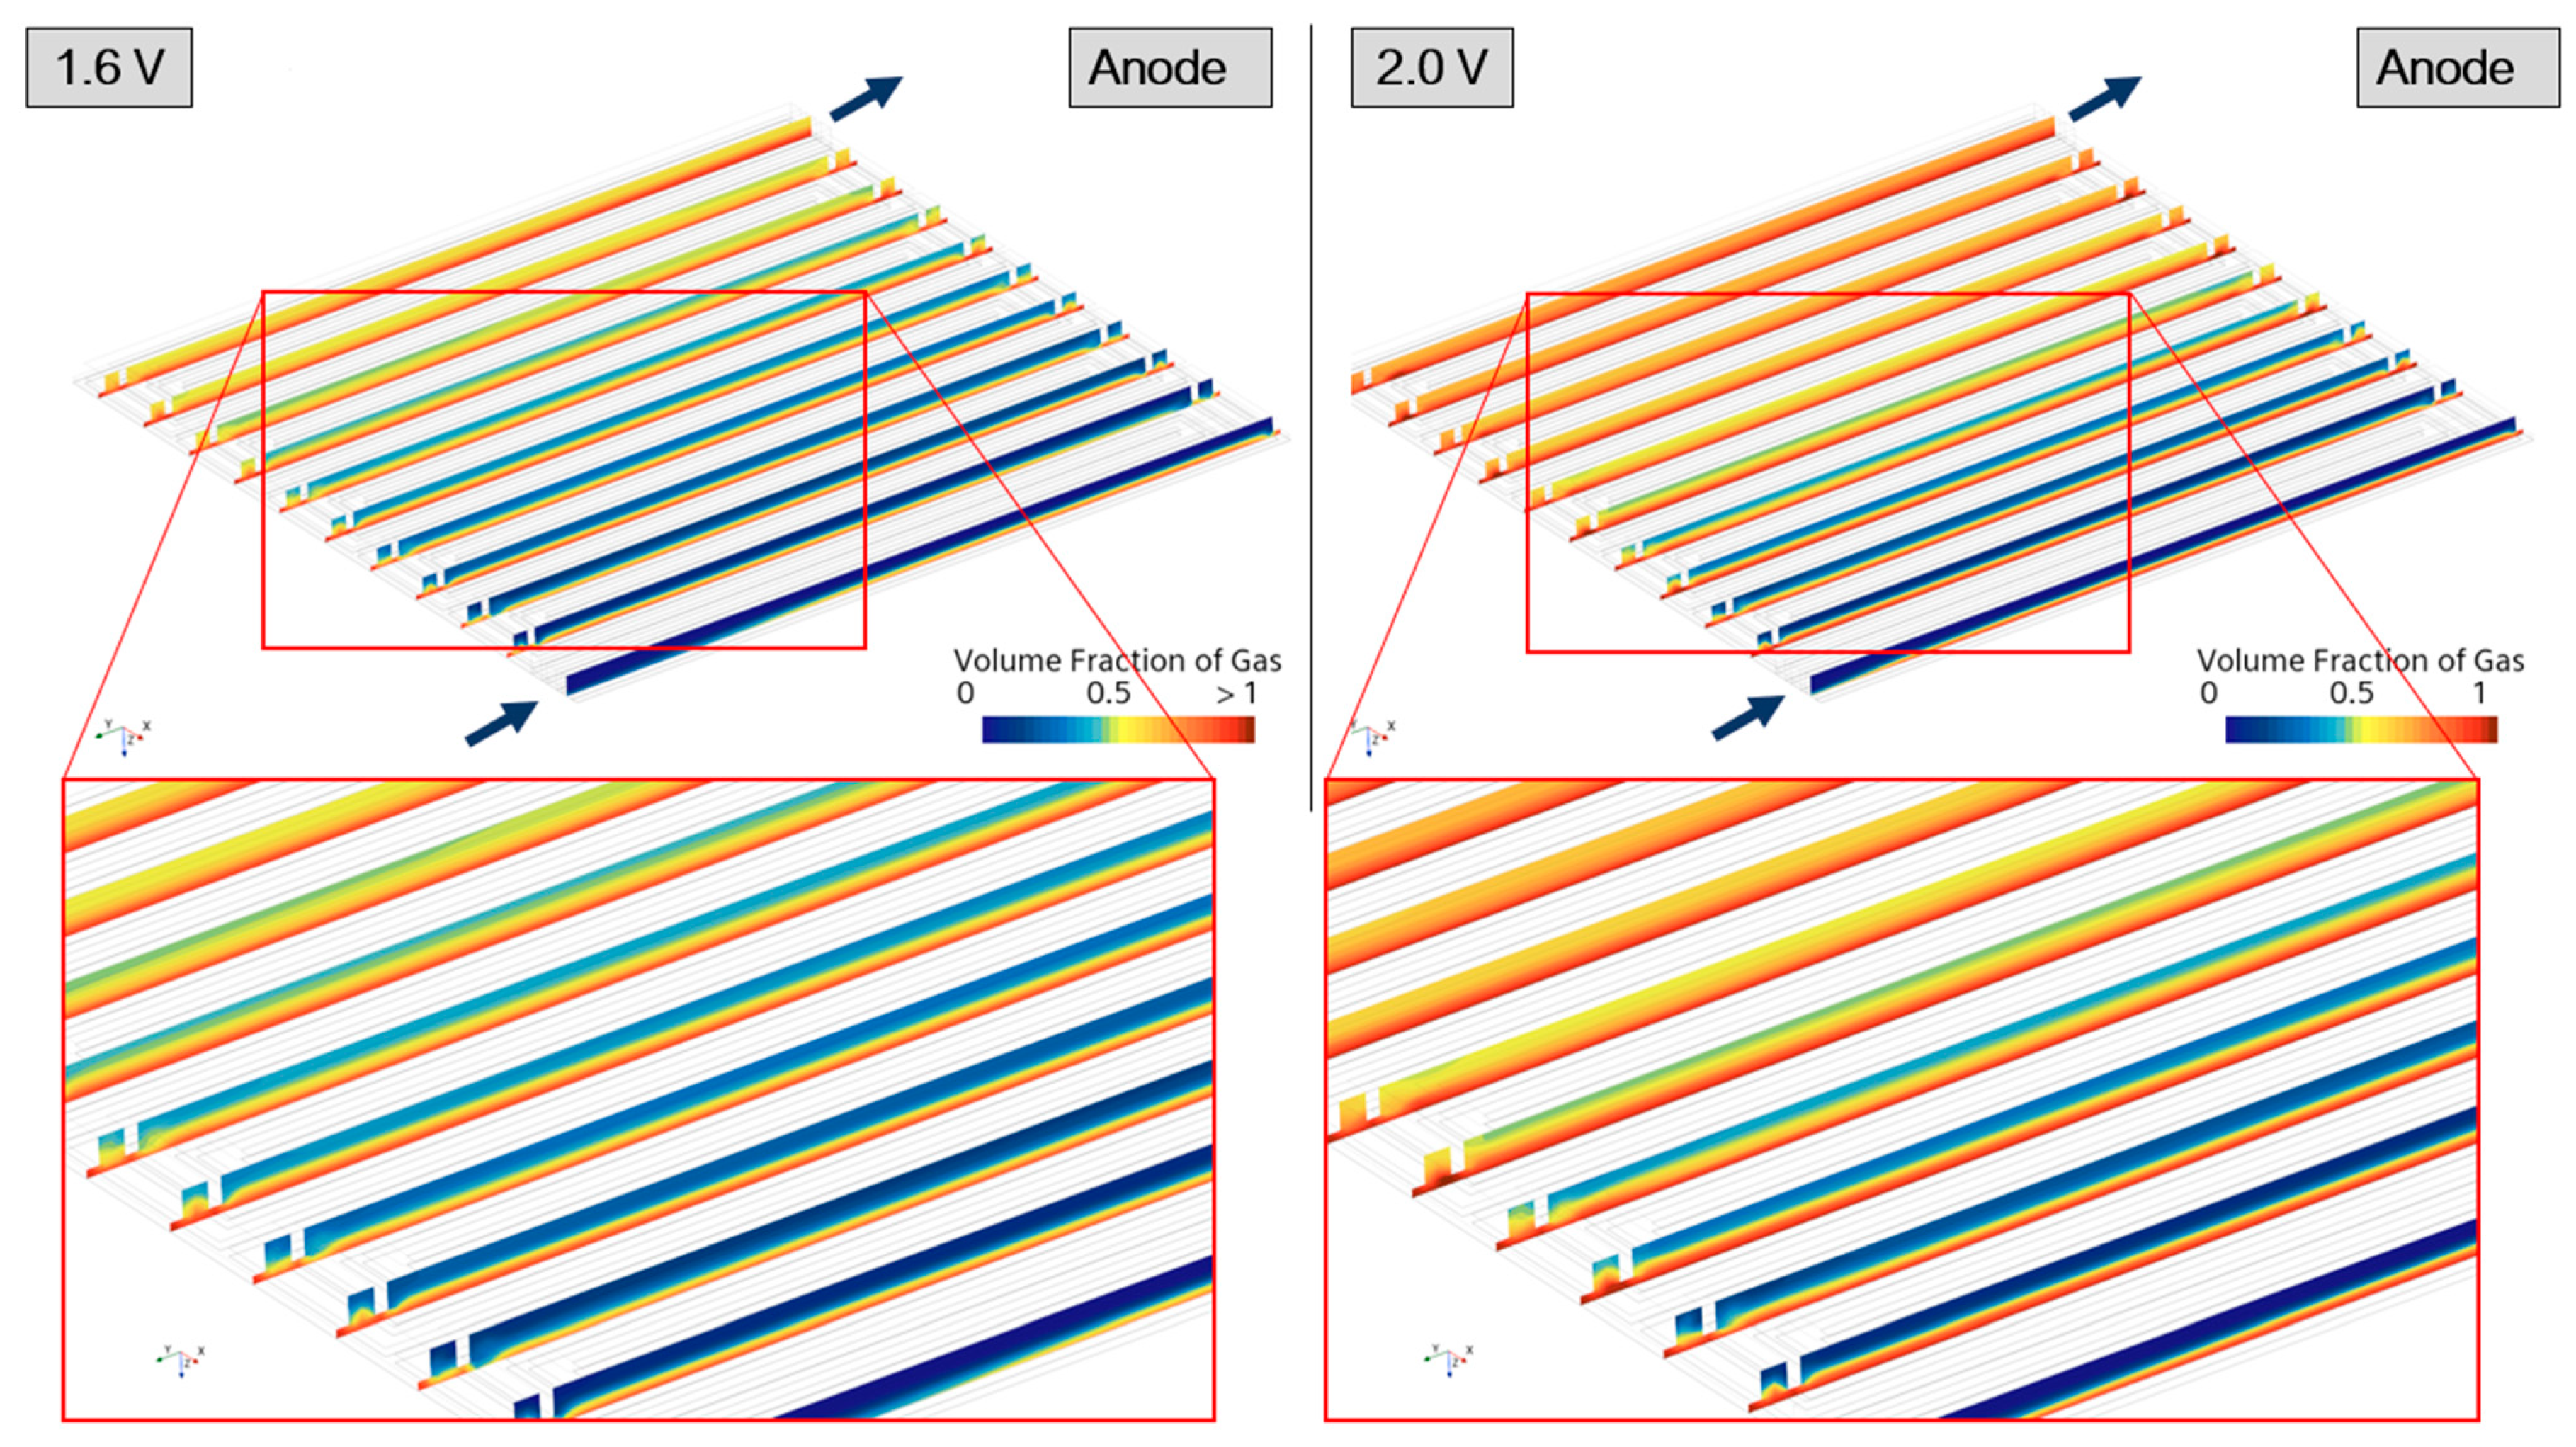
The analysis of the gaseous volume fraction is extended to the gas channels, as the large specific volume of the gas-phase products alter the volumetric flow rate and hence the flow regime. Figure 7 shows the gas volume fraction distribution on the anodic and cathodic side of the cell, for two operating voltages (1.6 V and 2.0 V). As the voltage increases (i.e., for higher electric power), more oxygen and hydrogen are produced. As reactions develop on all the active surface, the gas phase tends to increase towards the outlet of the electrolysis cell, making gas removal from CLs and GDLs increasingly complex. The larger presence of gas in the cathode side is motivated by the lower inlet flowrate, as reported in Table 4, promoting the gas-phase build up. Figure 8 shows the gas volume fraction on transverse sections, highlighting the local stratification of the gas phase in the anodic CL and GDL and the consequential filling of the channels along the path.
From a comparison with the gas volume fraction fields reported in the reference article [14], a significant difference is noticed. The reference article shows higher gas volume fraction values compared to those obtained from the current model, which led to the decision to perform a quantitative analysis of the produced hydrogen flow rate based on Faraday’s law to ensure the accurate prediction of the gas phase produced by this model. These results are presented in the final part of this section to validate the presented results. An interesting consequence of the multi-phase nature of flows in a PEMEC is related to the gas phase production and the consequent liquid fraction reduction, leading to a lower mixture density which induces a flow acceleration to conserve the mass flow rate.
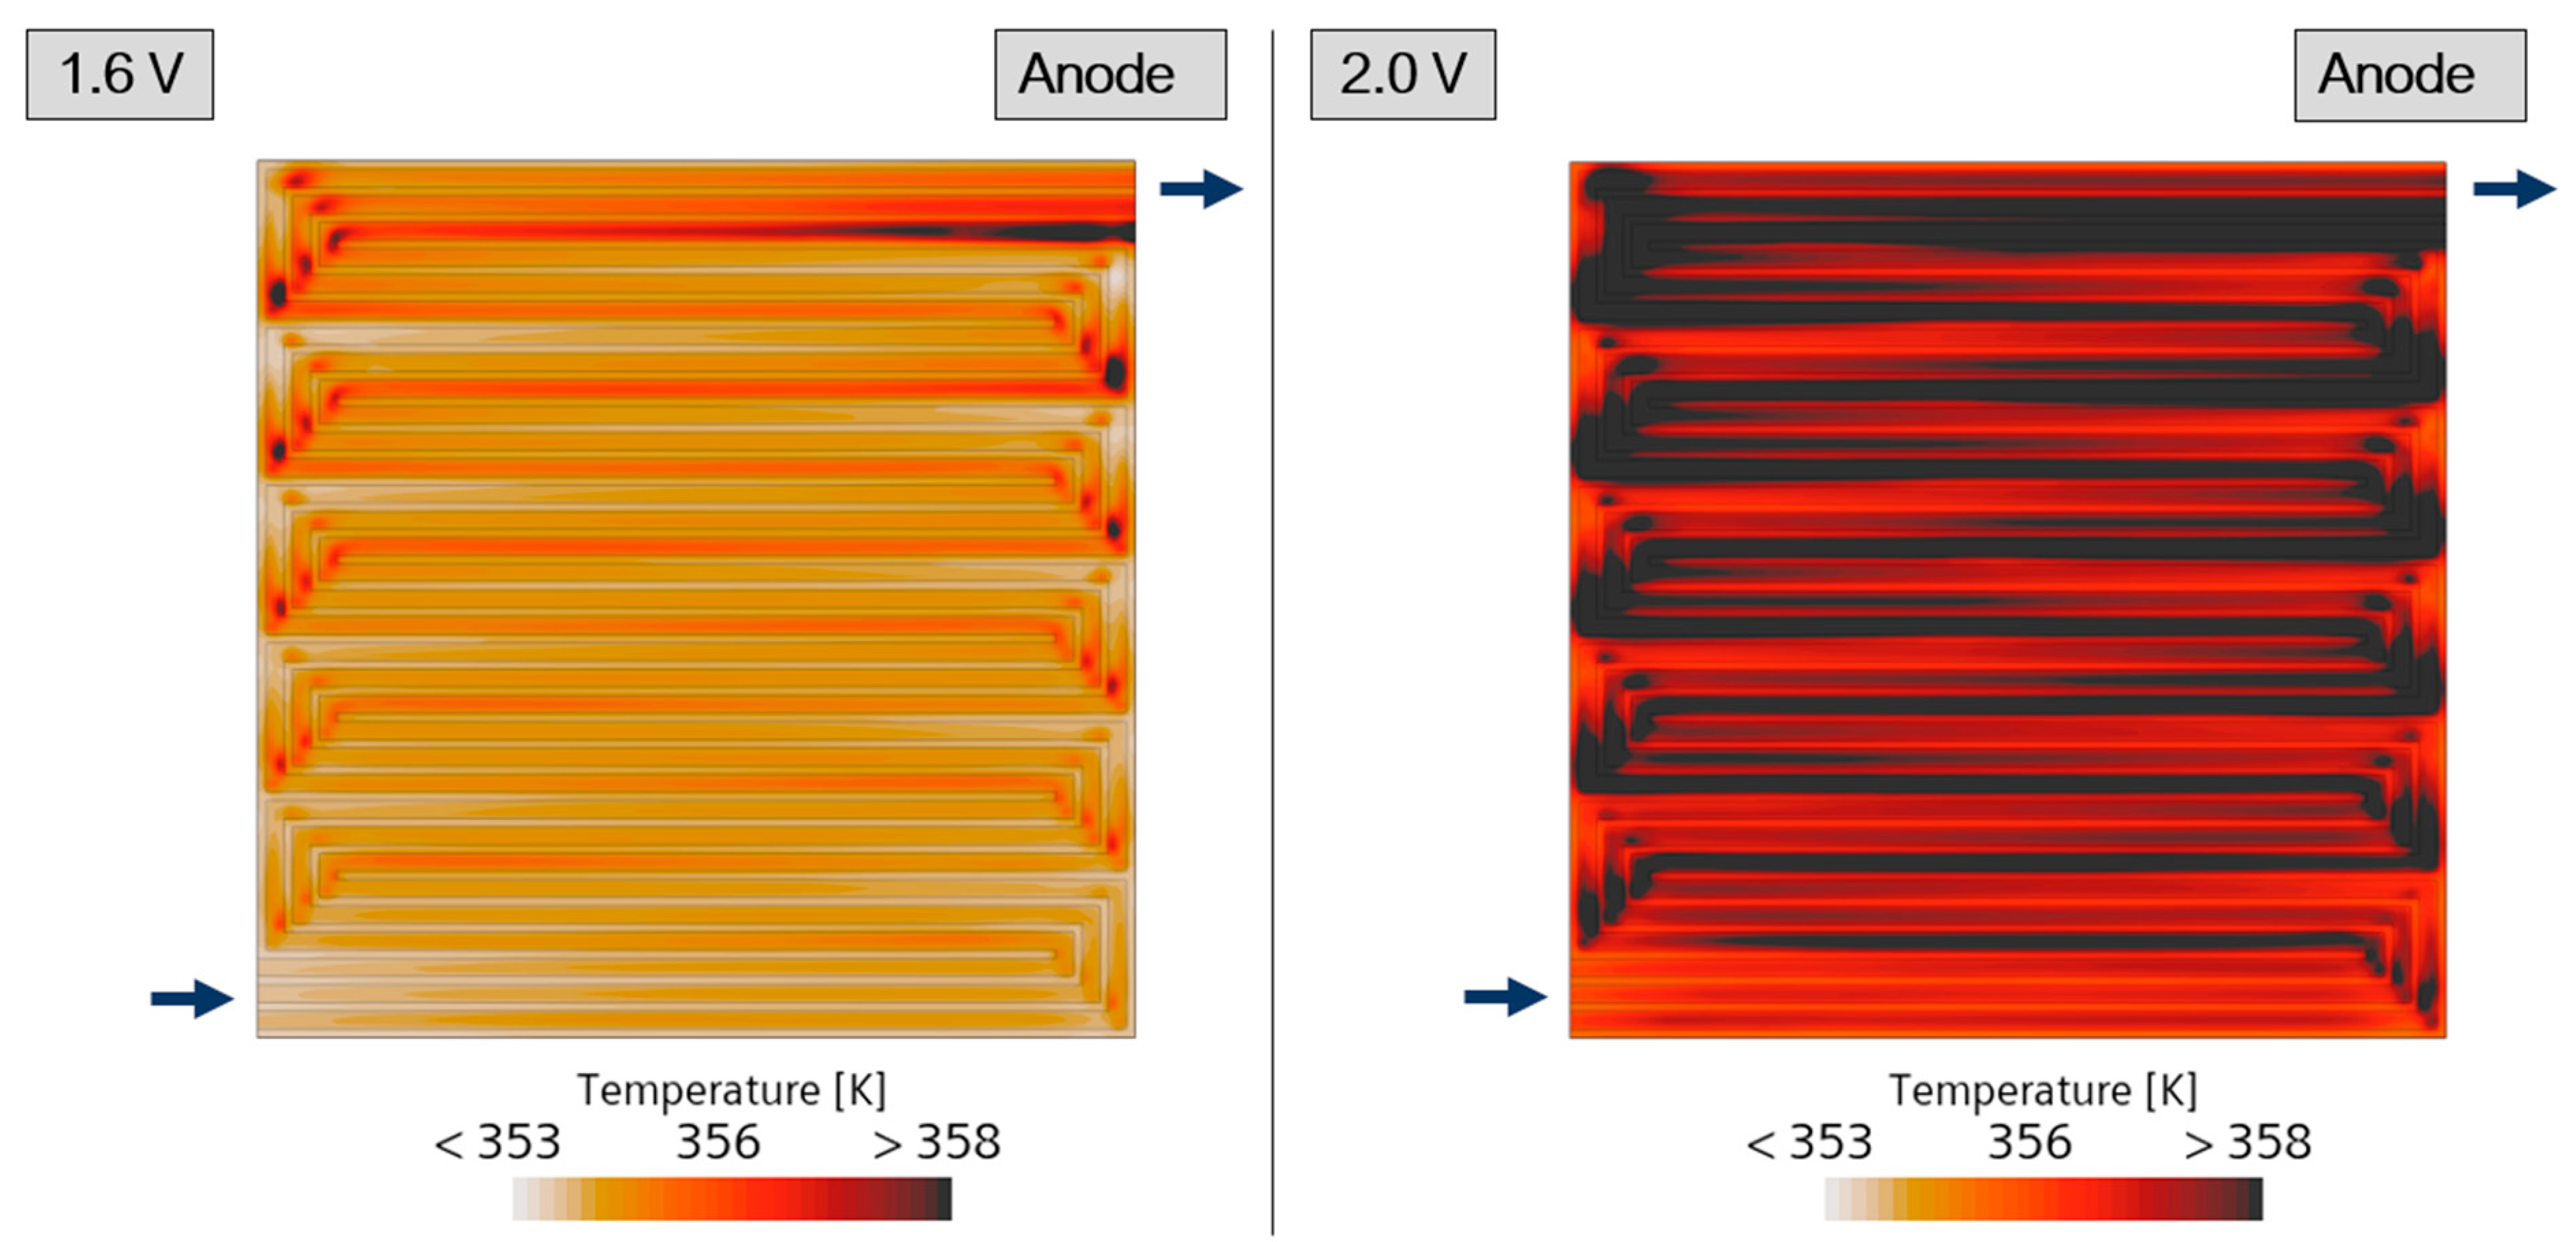
Figure 9a,b shows the velocity distribution for 1.6 V and 2.0 V, with the latter case showing higher flow velocities deriving from higher gas phase production. This causes an increased pressure drop Figure 9c,d for high voltage operation, resulting in increased energy required for water pumps. Figure 10 shows the temperature ranges at the interface between the GDL and anode-side channels. The average temperature increases with the operating voltage due to the higher amount of power dissipated by the cell, and the areas of maximum temperature coincide with those of maximum gas volume fraction shown in Figure 4.
To complete the modelling methodology validation, the hydrogen production rate ( m ˙ H 2 ) resulting from the 3D-CFD simulations is compared with the theoretical value predicted by Faraday’s formula for electrolysis (Equation (24)) [31], which was not discussed or reported in [14]. The results are shown in Figure 11a, confirming that the correct amount of hydrogen is produced at all voltages and temperatures, thus reinforcing the CFD-based detailed analysis presented in the previous paragraphs. Finally, the PEMEC efficiency ( η ) calculated as in Equation (25) [31] is reported in Figure 11b. The validation of this type of integral-scale variables (i.e., quantitative relationship between products’ flow rate and input current) against theoretical predictions (Faraday’s law) is fundamental to reinforce the detailed analysis presented in the previous sections.
m ˙ H 2 = M H 2 · P e 2 · V c e l l · F
η = m ˙ H 2 ·   L H V H 2 P e l

5. Conclusions

In this study, a comprehensive multi-dimensional, multi-physics, and non-isothermal methodology for PEM electrolysis simulation is presented, investigating the interaction between fluid dynamics, electrochemistry, and heat transport. The 3D-CFD model for PEM electrolysis provides a detailed insight into gas–liquid stratification, overpotentials break-up, and the variation of the flow regime as a consequence of gas-phase generation. The model relevantly includes the use of a macro-homogeneous catalyst layer, developed by the authors for PEM fuel cells and here applied to PEM electrolysis.
The model is used to simulate a PEM electrolysis study from the open literature, providing valuable experimental and numerical data for model validation. The polarization curves obtained by the presented model are in excellent agreement with the experimental results at two temperature levels (333 K and 353 K), allowing the investigation of the complex multi-phase flow developing in the distributor channels and in the porous parts. Hydrogen production rates match the theoretically calculated values at all voltages and temperatures, providing a quantitative validation of the obtained model results.
The presented methodology offers an industry-relevant and ready-to-use tool for investigating the complex behaviour of PEM electrolysers. The study contributes to filling a critical engineering gap, supporting the transition towards carbon-free solutions in line with the global migration from fossil-fuel-based sources.

Author Contributions

Methodology, G.C. and A.C.; Software, G.C., A.C. and S.F.; Validation, G.C. and A.C.; Investigation, G.C. and S.F.; Data curation, G.C.; Writing—original draft, G.C., S.F. and A.d.; Visualization, G.C.; Supervision, A.d.; Project administration, A.d.; Funding acquisition, A.d. All authors have read and agreed to the published version of the manuscript.

Funding

This research was funded by University of Modena and Reggio Emilia: FAR2021DIP_DIEF-Fondo di Ateneo per la Ricerca 2021.

Data Availability Statement

Research data will be shared by the authors upon request.

Conflicts of Interest

The authors declare no conflict of interest.

Nomenclature

aactivity
BPBipolar Plate
cconcentration [mol/m3]
cpspecific heat [J/kg/K]
CLcatalyst layer
CFDComputational Fluid Dynamics
EWEquivalent molecular weight of dry membrane [kg/mol]
FFaraday constant [C/mol]
f ¯ force [N]
GDLGas Diffusion Layer
LHVLower Heating Value [MJ/kg]
i(superficial) current density [A/m2]
jvolumetric current density [A/m3]
Kpermeability [m2]
kthermal conductivity [W/m/K]
m ˙ Mass flow [kg/s]
Mmillions
MMP Mixture multi-phase
ppressure [Pa]
PPower [W]
PEMProton Exchange Membrane
PEMECProton Exchange Membrane Electrolyser Cell
PEMFCProton Exchange Membrane Fuel Cell
Runiversal gas constant [J/mol/K]
RESrenewable energy sources
RHRelative humidity
Sentropy, source terms
SMRSteam Methane Reforming
Ttemperature [K]
u ¯ velocity [m/s]
Greek Symbols
αcharge transfer coefficient; volume fraction
γpressure scaling coefficients; membrane water absorption/desorption rate [1/s]
δthickness [m]
εporosity
ζ specific active surface of the catalyst [1/m]
ηoverpotential [V]
θ contact angle [°]
κelectric conductivity [S/m]
λwater content
μdynamic viscosity [kg/m/s]
ρdensity [kg/m3]
σionic conductivity [S/m]; surface tension [N/m]
τtortuosity
φpotential [V]
Subscripts and superscripts
aanode
ccathode
eelectrolyte
elelectric
effeffective
eqequilibrium
ggas
iionomer
ininertial
lliquid
mmembrane
nthe n-th phase
pporous
ptplatinum
refreference
rlrelative
ssolid
vviscous
wwater

References

  1. Carmo, M.; Fritz, D.L.; Mergel, J.; Stolten, D. A comprehensive review on PEM water electrolysis. Int. J. Hydrogen Energy 2013, 38, 4901–4934. [Google Scholar] [CrossRef]
  2. Barbir, F. PEM electrolysis for production of hydrogen from renewable energy sources. Solar Energy 2005, 78, 661–669. [Google Scholar] [CrossRef]
  3. Zhang, H.; Yuan, T. Optimization and economic evaluation of a PEM electrolysis system considering its degradation in variable-power operations. Appl. Energy 2022, 324, 119760. [Google Scholar] [CrossRef]
  4. Olivier, P.; Bourasseau, C.; Bouamama, P.B. Low-temperature electrolysis system modelling: A review. Renew. Sustain. Energy Rev. 2017, 78, 280–300. [Google Scholar] [CrossRef]
  5. Choi, P.; Bessarabov, D.G.; Datta, R. A simple model for solid polymer electrolyte (SPE) water electrolysis. Solid. State Ion. 2004, 175, 535–539. [Google Scholar] [CrossRef]
  6. Diaz, D.F.R.; Valenzuela, E.; Wang, Y. A component-level model of polymer electrolyte membrane electrolysis cells for hydrogen production. Appl. Energy 2022, 321, 119398. [Google Scholar] [CrossRef]
  7. D’Adamo, A.; Haslinger, M.; Corda, G.; Höflinger, J.; Fontanesi, S.; Lauer, T. Modelling Methods and Validation Techniques for CFD Simulations of PEM Fuel Cells. Processes 2021, 9, 688. [Google Scholar] [CrossRef]
  8. Nie, J.; Chen, Y. Numerical modeling of three-dimensional two-phase gas–liquid flow in the flow field plate of a PEM electrolysis cell. Int. J. Hydrogen Energy 2010, 35, 3183–3197. [Google Scholar] [CrossRef]
  9. Wang, C.Y. Fundamental Models for Fuel Cell Engineering. Chem. Rev. 2004, 104, 4727–4765. [Google Scholar] [CrossRef]
  10. Ruiz, D.D.H.; Sasmito, A.P.; Shamim, T. Numerical Investigation of the High Temperature PEM Electrolyzer: Effect of Flow Channel Configurations. ECS Trans. 2013, 58, 99–112. [Google Scholar] [CrossRef]
  11. Toghyani, S.; Afshari, E.; Baniasadi, E. Metal foams as flow distributors in comparison with serpentine and parallel flow fields in proton exchange membrane electrolyzer cells. Electrochim. Acta 2018, 290, 506–519. [Google Scholar] [CrossRef]
  12. Toghyani, S.; Afshari, E.; Baniasadi, E. Three-dimensional computational fluid dynamics modeling of proton exchange membrane electrolyzer with new flow field pattern. J. Therm. Anal. Calorim. 2018, 135, 1911. [Google Scholar] [CrossRef]
  13. Toghyani, S.; Afshari, E.; Baniasadi, E.; Atyabi, S.A. Thermal and electrochemical analysis of different flow field patterns in a PEM electrolyzer. Electrochim. Acta 2018, 267, 234–245. [Google Scholar] [CrossRef]
  14. Ma, Z.; Witteman, L.; Wrubel, J.A.; Bender, G. A comprehensive modeling method for proton exchange membrane electrolyzer development. Int. J. Hydrogen Energy 2021, 46, 17627–17643. [Google Scholar] [CrossRef]
  15. D’Adamo, A.; Riccardi, M.; Locci, C.; Romagnoli, M.; Fontanesi, S. Numerical Simulation of a High Current Density PEM Fuel Cell; SAE Technical Papers; SAE International: Warrendale, PA, USA, 2020. [Google Scholar] [CrossRef]
  16. Harvey, D.; Pharoah, J.G.; Karan, K. A comparison of different approaches to modelling the PEMFC catalyst layer. J. Power Sources 2008, 179, 209–219. [Google Scholar] [CrossRef]
  17. Lafmejani, S.S.; Olesen, A.C.; Kær, S.K. VOF modelling of gas–liquid flow in PEM water electrolysis cell micro-channels. Int. J. Hydrogen Energy 2017, 42, 16333–16344. [Google Scholar] [CrossRef] [Green Version]
  18. Wu, L.; Zhang, G.; Xie, B.; Tongsh, C.; Jiao, K. Integration of the detailed channel two-phase flow into three-dimensional multi-phase simulation of proton exchange membrane electrolyzer cell. Int. J. Green Energy 2021, 18, 541–555. [Google Scholar] [CrossRef]
  19. Corda, G.; Fontanesi, S.; d’Adamo, A. Methodology for PEMFC CFD Simulation Including the Effect of Porous Parts Compression. Int. J. Hydrogen Energy 2022, 47, 14658–14673. [Google Scholar] [CrossRef]
  20. Corda, G.; Fontanesi, S.; D’Adamo, A. Numerical Comparison of the Performance of Four Cooling Circuit Designs for Proton Exchange Membrane Fuel Cells (PEMFCs); SAE Technical Papers; SAE International: Warrendale, PA, USA, 2022. [Google Scholar] [CrossRef]
  21. D’Adamo, A.; Corda, G. Numerical Simulation of Advanced Bipolar Plates Materials for Hydrogen-Fueled PEM Fuel Cell; SAE Technical Papers; SAE International: Warrendale, PA, USA, 2022. [Google Scholar] [CrossRef]
  22. D’Adamo, A.; Riccardi, M.; Borghi, M.; Fontanesi, S. CFD Modelling of a Hydrogen/Air PEM Fuel Cell with a Serpentine Gas Distributor. Processes 2021, 9, 564. [Google Scholar] [CrossRef]
  23. Hao, L.; Cheng, P. Lattice Boltzmann simulations of anisotropic permeabilities in carbon paper gas diffusion layers. J. Power Sources 2009, 186, 104–114. [Google Scholar] [CrossRef]
  24. Tabuchi, Y.; Shiomi, T.; Aoki, O.; Kubo, N.; Shinohara, K. Effects of heat and water transport on the performance of polymer electrolyte membrane fuel cell under high current density operation. Electrochim. Acta 2010, 56, 352–360. [Google Scholar] [CrossRef]
  25. Wu, H.; Li, X.; Berg, P. On the modeling of water transport in polymer electrolyte membrane fuel cells. Electrochim. Acta 2009, 54, 6913–6927. [Google Scholar] [CrossRef]
  26. Springer, T.E.; Zawodzinski, T.A.; Gottesfeld, S. Polymer Electrolyte Fuel Cell Model. J. Electrochem. Soc. 1991, 138, 2334–2342. [Google Scholar] [CrossRef]
  27. Chang, Y.; Qin, Y.; Yin, Y.; Zhang, J.; Li, X. Humidification strategy for polymer electrolyte membrane fuel cells – A review. Appl. Energy 2018, 230, 643–662. [Google Scholar] [CrossRef]
  28. Marangio, F.; Santarelli, M.; Calì, M. Theoretical model and experimental analysis of a high pressure PEM water electrolyser for hydrogen production. Int. J. Hydrogen Energy 2009, 34, 1143–1158. [Google Scholar] [CrossRef]
  29. Kim, H.; Park, M.; Lee, K.S. One-dimensional dynamic modeling of a high-pressure water electrolysis system for hydrogen production. Int. J. Hydrogen Energy 2013, 38, 2596–2609. [Google Scholar] [CrossRef]
  30. Awasthi, A.; Scott, K.; Basu, S. Dynamic modeling and simulation of a proton exchange membrane electrolyzer for hydrogen production. Int. J. Hydrogen Energy 2011, 36, 14779–14786. [Google Scholar] [CrossRef]
  31. Bessarabov, D.; Wang, H.; Li, H.; Zhao, N. (Eds.) PEM Electrolysis for Hydrogen Production: Principles and Applications; CRC Press: Boca Raton, FL, USA, 2016. [Google Scholar]
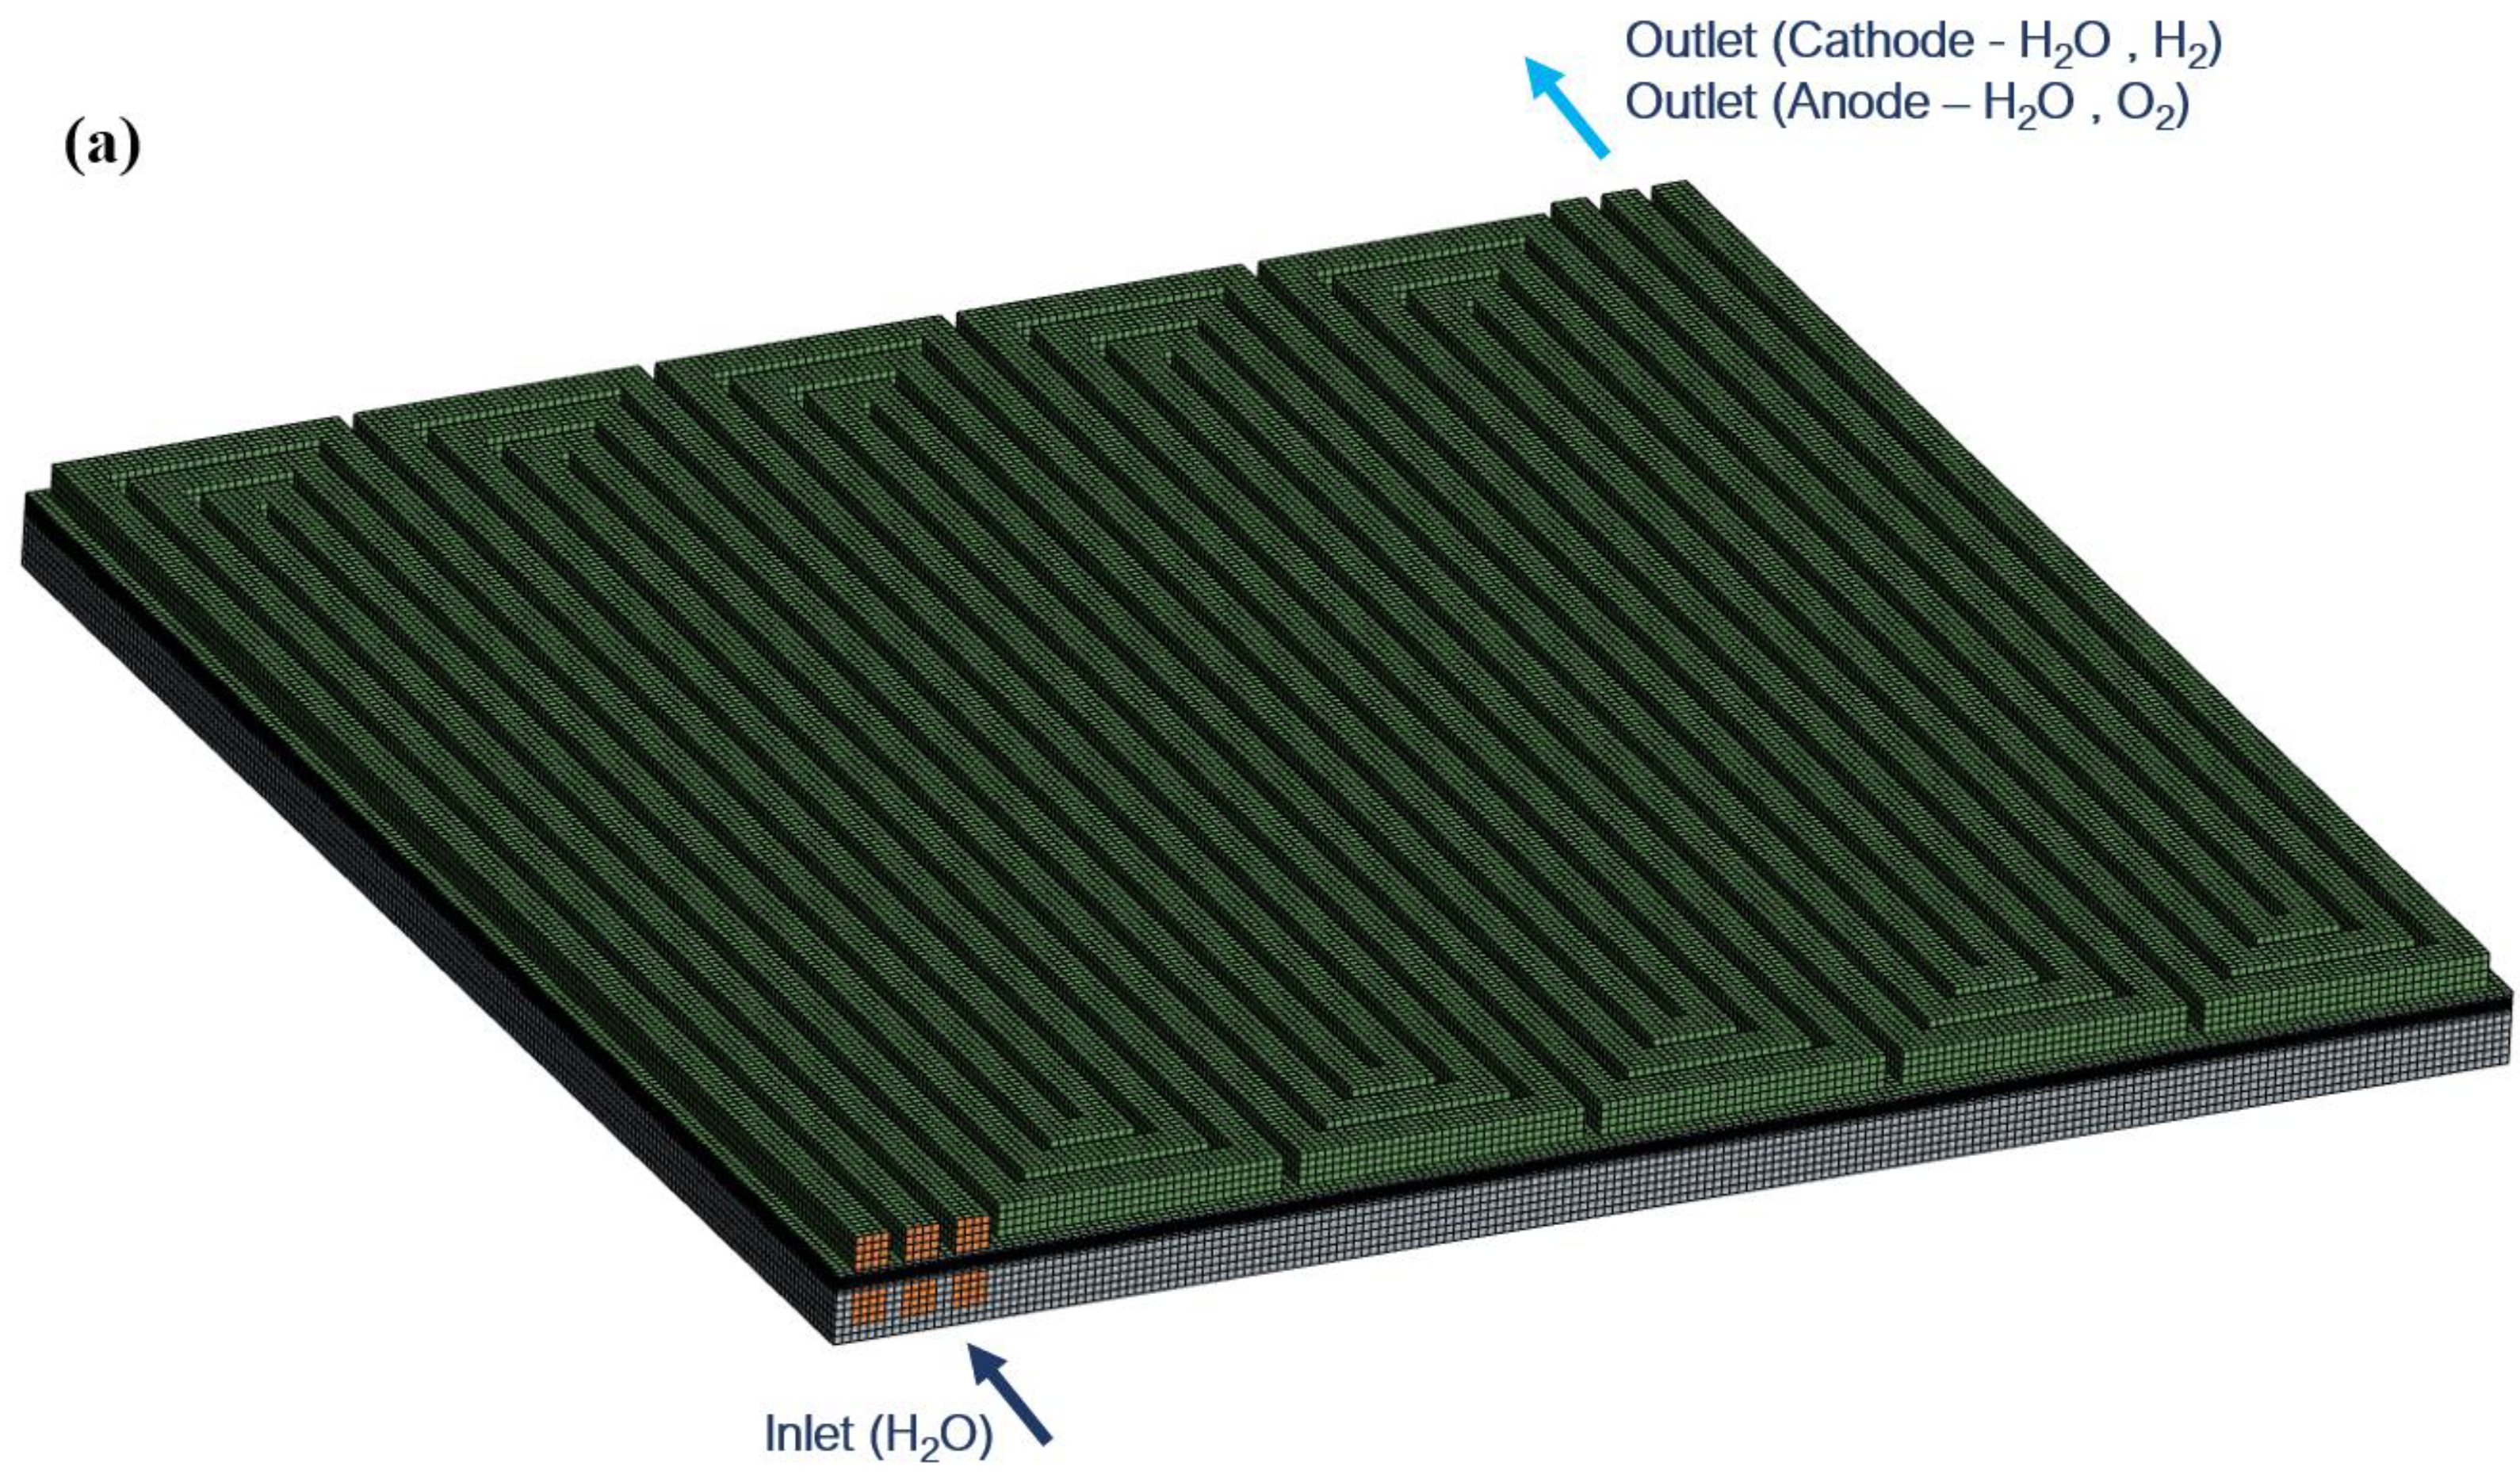
Figure 1. (a) Computational domain and finite volume mesh. (b) Top view mesh. (c) Mesh of channels and porous media with principal dimensions.
Energies 16 05968 g001aEnergies 16 05968 g001bEnergies 16 05968 g001c
Figure 2. Polarization curves for 333 K and 353 K operation.
Energies 16 05968 g002
Figure 3. Overpotentials break-up analysis for 333 K and 353 K.
Energies 16 05968 g003
Figure 4. Volume fraction of gas in the GDL/anode channel interface (353 K). Arrows indicate flow path.
Energies 16 05968 g004
Figure 5. Volume fraction of gas in the anode gas diffusion layer sections (353 K). Arrows indicate flow path.
Energies 16 05968 g005
Figure 6. Mixture velocity in the x-direction in the anode gas diffusion layer sections (353 K). Arrows indicate flow path.
Energies 16 05968 g006
Figure 7. Volume fraction of gas in the anode and cathode side for three operating voltages (353 K). Arrows indicate flow path.
Energies 16 05968 g007
Figure 8. Gas phase stratification on the anodic CL surface for 1.6 V (left) and 2.0 V (right) operation (353 K). Arrows indicate flow path.
Energies 16 05968 g008
Figure 9. (a,b) Velocity magnitude field in sections along the channels, (c,d) Absolute pressure field in the anode side (353 K). Arrows indicate flow path.
Energies 16 05968 g009
Figure 10. Temperature in the GDL/anode channel interface (353 K). Arrows indicate flow path.
Energies 16 05968 g010
Figure 11. (a) Comparison between the hydrogen production rate at the cathode [g/h] calculated by the numerical model (red lines) and the theoretical values calculated with Faraday’s formula (green dots), (b) efficiency of the electrolysis cell calculated with Equation (25).
Energies 16 05968 g011
Table 1. Governing equations for the mixture multi-phase (MMP) model, elaborated from [7].
Governing EquationSource Term Specification
Continuity equation:
· ( ρ m u ¯ m ) = S m    (1)
Gas   Channel :   S m = 0
Gas   Diffusion   Layer   ( GDL ) :   S m = 0
Anode   CL :   S m = M O 2 4 F j a j a 2 F M H 2 O
Cathode   CL :   S m = M H 2 2 F j c
Solid   parts   ( membrane ,   BPs ) :   u ¯ m = 0
Momentum equation:
1 ε 2 ( ρ m u ¯ m u ¯ m ) = p + · ( μ ε u ¯ m ) + S ¯ u    (2)
Gas   Diffusion   Layer   ( GDL ) :   S ¯ u = μ K G D L u ¯ m + f ¯ p + f ¯ U
Catalyst   Layer   ( CL ) :   S ¯ u = μ K C L u ¯ m + f ¯ p + f ¯ U
Solid   parts   ( Membrane ,   BPs ) :   u ¯ m = 0
Species transport:
· ( ρ m Y k u ¯ m ) = · ( ρ m D k e f f Y k ) + S k    (3)
Gas   Channel :   S k = 0
Gas   Diffusion   Layer   ( GDL ) :   S T = i s 2 k e f f
O 2   at   Anode   CL :   S O 2 , a = M O 2 4 F j a
H 2 O   at   Anode   CL :   S H 2 O , a = j a 2 F M H 2 O
H 2   at   Cathode   CL :   S H 2 , c = M H 2 2 F j c
Solid   parts   ( membrane ,   BPs ) :   Y k = 0
Energy transport:
· [ ( ρ m c p ) e f f T u ¯ ] = · ( k e f f T ) + S T    (4)
Gas   Channel :   S T = 0
Gas   Diffusion   Layer   ( GDL ) :   S T = i s 2 k e f f
Anode   CL :   S T = i s 2 k e f f + i e 2 σ e f f + j a η a c t + j a T Δ S 2 F
Cathode   CL :   S T = i s 2 k e f f + i e 2 σ e f f + j c η a c t + j c T Δ S 2 F
Solid   parts   ( BPs ) :   S T = i s 2 k e f f
Solid parts (membrane): S T = i e 2 σ e f f
Charge transport:
· ( κ e f f Φ s ) + S Φ s = 0    (5)
· ( σ e f f Φ e ) + S Φ e = 0    (6)
Gas   Channel :   Φ s = 0 ; Φ e = 0
Gas   Diffusion   Layer   ( GDL ) :   S Φ s = 0   ;   S Φ e = 0
Anode   CL :   S Φ s = j a ; S Φ e = j a
Cathode   CL :   S Φ s = j c ; S Φ e = j c Solid   parts   ( membrane ,   BPs ) :   S Φ s = 0 ;   S Φ e = 0
Table 2. Geometrical dimensions, reproduced from [14].
Component DimensionsValue
Channel height1 mm
Channel width1 mm
BP width between channels0.5 mm
BP height1.5 mm
GDL thickness300 μm
CL thickness12 μm
Membrane thickness30 μm
Table 3. Physical and transport properties, reproduced from [14].
Physical Properties of FC Main ComponentsValue
GDL    Density (solid phase)
       Electrical conductivity
       Thermal conductivity
       Permeability
       Contact angle θc
       Porosity εGDL
CL       Porosity εCL
       Permeability
       Contact angle θc
       Specific active area ζ
  Ionomer Density
       Ion. conductivity
       Spec. heat
       Th. conductivity
       Volume fraction
  Pt/C Density
       El. conductivity
       Spec. heat
       Th. conductivity
       Volume fraction
BP    Density
       El. conductivity
       Spec. heat
       Th. conductivity
Membrane Density
       Ion. conductivity
       Spec. heat
       Th. conductivity
2250 kg/m3
500 S/m
24 W/m/K
4 × 10⁻¹² m2
110°
0.7
0.4
4 × 10⁻¹³ m2
110°
110 , 000   1 / m
2000 kg/m3
Equation (12)
903.0 J/kg/K
0.445 W/m/K
0.4
2250.0 kg/m3
500.0 S/m
707.68 J/kg/K
10 W/m/K
0.6
2250 kg/m3
20,000 S/m
707.68 J/kg/K
20 W/m/K
2000 kg/m3
Equation (12)
903 J/kg/K
0.445 W/m/K
Table 4. Boundary conditions, reproduced from [14].
Boundary ConditionsValue
Cathode Channel  Inlet
           Water flowrate
           Temperature
           Volume fraction of water
          Outlet
           Pressure
Anode Channel   Inlet
           Water flowrate
           Temperature
           Volume fraction of water
          Outlet
           Pressure
Cathode BP       Top
           Electric potential
           Temperature
          Bottom
           Electric potential
           Temperature

5 mL/min
353 K/333 K
1

101,325 Pa

50 mL/min
353 K/333 K
1

101,325 Pa

0 V
353 K/333 K (Fixed by the cooling system)
From 1.4 V to 2.0 V
353 K/333 K (Fixed by the cooling system)
Disclaimer/Publisher’s Note: The statements, opinions and data contained in all publications are solely those of the individual author(s) and contributor(s) and not of MDPI and/or the editor(s). MDPI and/or the editor(s) disclaim responsibility for any injury to people or property resulting from any ideas, methods, instructions or products referred to in the content.