Article

Accurate Modeling of CCS Combo Type 1 Cable and Its Communication Performance Analysis for High-Speed EV-EVSE Charging System

School of Electric and Electronic Enginnering, Yonsei University, Seoul 03722, Republic of Korea
*
Author to whom correspondence should be addressed.
These authors contributed equally to this work.
Energies 2023, 16(16), 5947; https://doi.org/10.3390/en16165947
Submission received: 18 July 2023 / Revised: 1 August 2023 / Accepted: 10 August 2023 / Published: 11 August 2023

Abstract

:
This paper addresses the issue of electromagnetic interference (EMI) in electric vehicle supply equipment (EVSE) charging cables, which can disrupt the communication signal for the real-time monitoring of the charging status, leading to the termination of charging. We propose a dedicated measurement jig for the Combined Charging System Combo Type 1 (CCS-CT1) cable structure and models its electrical characteristics of the jig using the impedance peeling technique for de-embedding. The obtained pure S-parameters of CCS-CT1 are then used to conduct a simulation of the signal integrity problem caused by Gaussian noise, which is the worst-case scenario that can occur in a typical charging system. This paper suggests that the root cause of this problem may be related to the high-power AC/DC conversion device included in the EVSE, which uses a switch-mode power conversion (SMPC) method that involves nonlinear operation and can result in increased harmonic noise and a more complex signal protocol for precise control. Finally, this study provides insights into the challenges of implementing high-speed charging systems and offers a solution for obtaining the accurate electromagnetic characteristics of charging cables.

1. Introduction

In recent years, there has been a growing concern for environmental conservation, leading to an increase in the adoption of electric vehicles (EVs) as a replacement for petroleum-based vehicles [1,2,3]. Many developed countries are making efforts to promote the distribution of high-speed electric vehicle supply equipment (EVSE) to enable the rapid charging of EVs [4]. However, unlike conventional AC charging systems, rapid charging systems require a higher amount of electric power transfer in a short time [5,6,7,8]. This demand has led to larger and more complex AC/DC conversion devices that are no longer efficient when integrated into conventional EVs as an on-board system. Therefore, a new EVSE that directly transmits DC was proposed, and the position of the AC/DC conversion device in the system was moved from the vehicle input to the charging output, as presented in Figure 1 [9,10].
This off-board system is suitable for providing a large amount of current flow for high-speed charging [11]. However, supplying DC can pose a significant risk to users if the charging system is not properly controlled [12,13]. To protect users from these risks, most charging devices use a communication and control line in addition to the power line to monitor the charging status in real time [14,15]. Despite these efforts, there have been reported instances of the intermittent termination of communication sequences and occasional errors in these charging systems [16,17,18,19,20,21,22]. While the exact causes of these phenomena are likely diverse, the authors have identified electromagnetic interference (EMI) as a significant contributing factor, arguing that a thorough analysis of the degradation of communication performance due to EMI coupling is necessary.
The fundamental cause of this problem lies in the significant difference between the conventional method of supplying a relatively low amount of AC and the new method of supplying a much higher amount of DC using EVSEs. The high-power AC/DC conversion device included in the EVSE uses a switch-mode power conversion (SMPC) method that involves a nonlinear operation to maximize its power efficiency [23,24] and, subsequently, results in an increased amount of harmonic noise and a more complex signal protocol for precise control [25,26]. Such a noise from the power conversion process is enough to cause a malfunction in the charging system by electromagnetic coupling to other communication lines from the DC power line in the worst-case scenario [16,20]. Furthermore, the issue of electromagnetic coupling has always been challenging for electric and electronic engineers [27,28,29].
This study assumes that the main reason for the communication performance degradation is the noise coupling in the cable bundle, and the origin of the noise is the EVSE power conversion system. Furthermore, since the service failure is evident, given that the amount of coupled noise is prominent in the designated frequency band for the communication, the correlation between generated noise and coupling noise should be analyzed from the perspective of communication systems. To be specific, this study performs an analysis on the CCS combo Type 1 (CCS-CT1) standard established by the CharIN consortium [30]. CCS-CT1 is configured in the form shown in Figure 2, and the transmission cables for them are composed of cable bundle structures. Given that we excite the port in the interested cables, as shown in Figure 2, the frequency-dependent electromagnetic characteristics of such structures can be quantified in the form of scattering parameters (S-parameters) [31,32,33].
Vector Network Analyzers are commonly used to obtain S-parameters and are typically configured in coaxial types such as N-type or SMA, requiring a suitable adapter or measurement jig. However, when measuring unique structures such as CCS-CT1 cables, dedicated adapters or measurement jigs are necessary, and additional adjustment should be included in the measurement results. As a result, it is unclear how to obtain the complete electromagnetic characteristics of the cables.
To address this issue, this study developed a dedicated measurement jig for the CCS-CT1 cable structure and modeled the circuit characteristics of the jig using the impedance peeling technique [34] with a time-domain reflectometer (TDR). The impedance values of the modeled jig are eliminated from the measured S-parameters using the de-embedding process, enabling the complete S-parameter values of the CCS-CT1 cable to be obtained. Additionally, there are various measurement techniques for multiconductor transmission line (MTL) structured cables [35,36]. However, considering factors such as measurement convenience and the number of required measurements, the method proposed in this paper can be considered the most efficient approach, at least for CCS-CT1 cables.
At last, because of the CCS-CT1 adopting Homeplug Green Phy [37,38], an OFDM-based communication technology, a simple OFDM simulation was conducted using the obtained S-parameters to analyze the signal integrity problem caused by Gaussian noise, which is the worst-case scenario that can occur in a typical charging system.

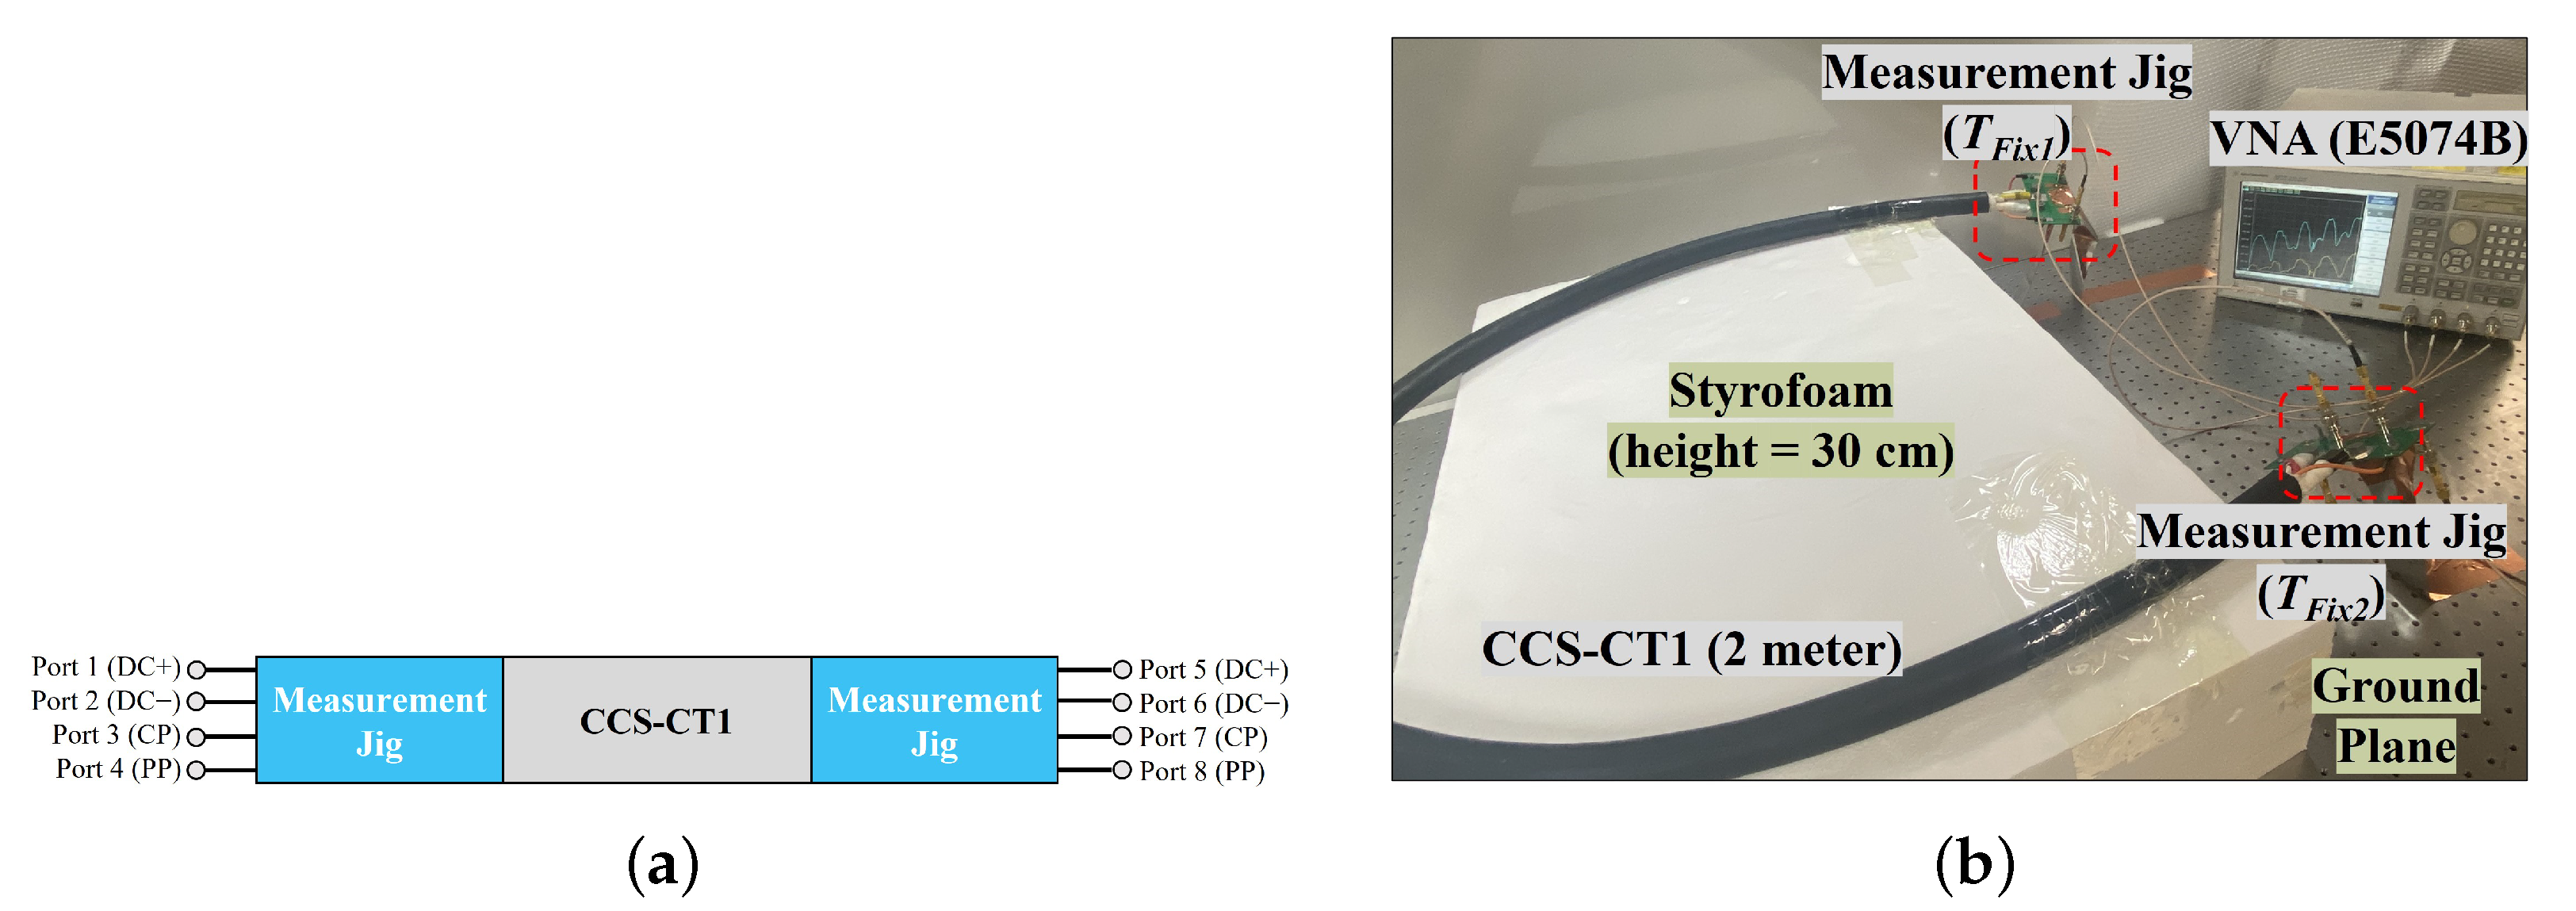
2. Measurement and Simulation Setup of CCS-CT1

This section outlines a method for obtaining the intact network characteristics (S-parameters) of the CCS-CT1 cable, as well as the simulation setup created to compare and verify the measurement results. The CCS-CT1 cable originally consists of L1 and N for AC power transmission, with CP and PP designated for charging control and communication, DC+ and DC− for DC power transmission, and protective earth (PE) for integrated ground, as shown in Figure 2. However, since this study solely focuses on DC charging environments, five purpose-designed multi-conductor transmission lines comprising CP, PP, DC+, DC−, and PE are utilized, as shown in Figure 3. These transmission lines were fabricated by Samwoo Electronic in Korea [30,39]. The fabricated cable and corresponding simulation design are presented in Figure 3. AUX1 and AUX2 are the auxiliary lines for the temperature and humidity sensors.

2.1. Fabrication of Measurement JIG for CCS-CT1

The CCS-CT1 cable requires DC conductor lines with sufficient thickness to handle a maximum current of 200 A, which makes it challenging to use terminal types like SMA, BNC, or N-type that are typically used in RF/microwave circuits. Instead, lugs are used for termination, as shown in Figure 4b. However, this type of termination is difficult to use with an ordinary network analyzer. To address this issue, a measurement jig is designed and fabricated to accommodate lug terminations, as shown in Figure 4a.
The key aspect of constructing the measurement jig is to design the characteristic impedance ( Z c ) between the input port and the lug attachment point to closely match with the port impedance ( Z s = 50 Ω ) of the measuring equipment. This is for minimization of multiple reflection (MR) [40,41], which can occur when there is a sudden characteristic impedance discontinuities. DC+ and DC− cables require a large amount of current supply and are terminated with relatively wide and thick lugs, resulting in a relatively low impedance at the lug attachment point. To maintain a characteristic impedance similar to Z s , the defected ground structure (DGS) technique [42] is used to increase the characteristic impedance. Then, relatively thin CP and PP cable lug attachment points also utilize DGS structure of which defected area is adjusted appropriately. Then, the feeding line is designed to utilize the grounded co-planar waveguide (GCPW) technique [43], which controls its characteristic impedance with gap distance between the ground and the signal line similar to Z s . Finally, the opposite side of the lug attaching area is terminated, accommodating BNC ports for measurement convenience. All relevant parameters used to fabricate the jig are listed in Table 1. To conduct the measurement of the CCS-CT1, a fabricated jig is used for certain cable lengths (e.g., 1 m and 2 m), as shown in Figure 5b, while the port excitations are conducted, as shown in Figure 5a.
Since the measurement setup is composed of a 2-sided 8-port network with 4 ports on each side, as shown in Figure 5a, it is difficult to measure the values for all 8 ports using a general VNA having 2 to 4 ports. Therefore, in this paper, an 8-port S-parameter network consisting of four unbalanced signal lines are established via multiple measurements using a 4-port VNA (Keysight’s E5071B) [32]. Also, the frequency range is set as 300 kHz to 100 MHz because the effective frequency range of high-level communication HomeplugGreenPHY is 1–30 MHz [37].

2.2. Simulation Modeling

The purpose of the simulation modeling in this subsection is to find the transfer function of the CCS-CT1 cable, which is determined using geometrical and material factors such as the length, dielectric loss, and diameter of the conductor [31,44]. As mentioned, the cable is composed of four signal lines, CP, PP, DC+, and DC−, that are twisted together in a clockwise rotation. Therefore, we conduct the analysis using Q2D (2D FEM, Ansys Inc., Canonsburg, PA, USA) based on the model in Figure 3, and it reflects the rotation by assigning the different cable arrangements for each unit length, as shown in Figure 6.
The unit length is set to operate with “electrically short” characteristics in the target frequency range, with a maximum value of 100 MHz, ( l n < 1/10 λ ) [31]. The analysis results for each unit length are integrated sequentially using the ABCD matrix, and eventually, a concatenated 8 by 8 matrix for 8-port system is obtained via (1b), where the 4 by 4 sub-matrix comprised within 2 by 2 structure is expressed in (1a) [45].
[ v ( z 2 ) ] [ i ( z 2 ) ] = [ ϕ 11 ( z 2 z 1 ) ] [ ϕ 12 ( z 2 z 1 ) ] ϕ 21 ( z 2 z 1 ) ] [ ϕ 22 ( z 2 z 1 ) ] [ v ( z 1 ) ] [ i ( z 1 ) ]
[ V ( z n ) ] [ I ( z n ) ] = [ ϕ ] n 1 × × [ ϕ ] 2 × [ ϕ ] 1 [ V ( z 1 ) ] [ I ( z 1 ) ]

2.3. De-Embedding Process Using Impedance Peeling

The measured 8-port S-parameter in Section II-A includes the effects of the measurement jig in addition to the cable characteristics. Therefore, this subsection discusses the de-embedding process employed to eliminate the effects of the measurement jig [46,47,48]. However, predicting the propagation direction of electromagnetic waves over time within limited band S-parameter is generally ineffective because S-parameters are frequency domain information at steady state. Hence, to observe changes over time, this paper utilized a time-domain reflectometer (TDR), and the impedance changes from the BNC part to the cable lug of the measurement jig are presented in Figure 7. If TDR is not available, similar results to Figure 7 can be obtained by acquiring S-parameters for a sufficiently wide frequency range and performing inverse Fourier transformation (IFT) after appropriate preprocessings in [49].
In Figure 7, it reveals that the region from t = 0 to t = 2.23 (red area) consists of a transmission line with 50 ohm characteristic impedance and includes the VNA input/output terminals, SMA cables, and BNC input connector. Although a slight impedance variation occurs at the BNC connecting junction, the characteristic impedance is relatively stable. Then, from t = 2.23 ns to t = 4 ns (yellow area), this area consists of the lug termination. As the four signal lines (DC+, DC−, CP, and PP) have an unbalanced structure based on a common ground (GND), a rapid increase in characteristic impedance is expected, and indeed, a sharp increase in impedance is observed in the corresponding area. Moreover, as seen from the measurement jig configuration in Figure 4a, the CP and PP lines have a characteristic impedance about 2.5 times higher than the DC+ and DC− lines to GND due to their greater distance from the ground (PE) line. Finally, the area after t = 4 ns can be regarded as the region of the complete CCS-CT1, which is the area we aim to obtain via de-embedding in this subsection.
Here, the cable measurement setup, including the measurement jig, is expressed using T-matrix, as shown in (2) [50,51].
[ T M e a ] = [ T F i x 1 ] · [ T D U T ] · [ T F i x 2 ]
In Equation (2), [ T M e a ] represents the measured S-parameters, where [ T F i x 1 ] and [ T F i x 2 ] represent the measurement jig at both ends, and [ T D U T ] represents the intact cable network that is ultimately desired. The transformation between the S-matrix and the T-matrix can be performed via (3a), (3b), where the dual subscripts (e.g., ie, ee, ei, and ii) represent the import and export sides and are used to reflect the correlation between the four 4 by 4 sub-matrices comprising the 8 by 8 complete matrix within 2 by 2 structure [50,51].
S 8 × 8 = [ T i e ] [ T e e ] 1 [ T i i ] [ T i e ] [ T e e ] 1 [ T e i ] [ T e e ] 1 [ T e e ] 1 [ T e i ]
T 8 × 8 = [ S i e ] 1 [ S i e ] 1 [ S i i ] [ S e e ] [ S i e ] 1 [ S e i ] [ S e e ] [ S i e ] 1 [ S i i ]
Using the S to T transformation presented in (3a), (3b), the measured 8 by 8 S-parameter data are converted into a T-matrix of the same size. Using the transformed equation, the value of the complete CCS-CT1, T D U T , can be obtained, as shown in (4);
[ T D U T ] = [ T F i x 1 ] 1 · [ T M e a ] · [ T F i x 2 ] 1 .
To derive [ T D U T ] from Equation (4), accurate values of [ T f i x 1 , 2 ] must be obtained. Fortunately, the T-line in the measurement jig has a coupling coefficient of less than −50 dB at under 100 MHz in simulation. Each line can be considered independent, as written in (5) [45];
S F i x 1 = S 11 0 0 0 S 15 0 0 0 0 S 22 0 0 0 S 26 0 0 0 0 S 33 0 0 0 S 37 0 0 0 0 S 44 0 0 0 S 48 S 51 0 0 0 S 55 0 0 0 0 S 62 0 0 0 S 66 0 0 0 0 S 73 0 0 0 S 77 0 0 0 0 S 84 0 0 0 S 88 .
In case of considering (5), for instance, which is the target matrix supposed to be filled, the respective subscripts i e , e e , e i , and i i partition the goal matrix ( [ S F i x 1 ] ) as follows:
S i i = S 11 0 0 0 0 S 22 0 0 0 0 S 33 0 0 0 0 S 44 , S i e = S 15 0 0 0 0 S 26 0 0 0 0 S 27 0 0 0 0 S 48 , S e i = S 51 0 0 0 0 S 62 0 0 0 0 S 73 0 0 0 0 S 84 , S e e = S 55 0 0 0 0 S 66 0 0 0 0 S 77 0 0 0 0 S 88 .
To fill out the non-zero values in (5) or (6), impedance peeling technique is employed in this paper. The peeling is conducted based on a cascaded ABCD matrix, as shown in (7) and (8), which utilizes the ABCD matrix of transmission lines. The electrical length ( γ l ) and characteristic impedance ( Z 0 ) of each ABCD matrix used in the peeling are from the TDR results illustrated in Figure 5.
A B C D = c o s h ( γ l ) Z 0 s i n h ( γ l ) s i n h ( γ l ) / Z 0 c o s h ( γ l )
A B C D F i x = A B C D 1 · A B C D 2 A B C D n
Figure 7 shows a dynamic impedance variation at 2.7 ns from the origin and simultaneously confirms that the wave propagation in the measurement jig lasted for about 4.6 ns. The sampling period of the TDR result in Figure 7 is approximately 0.117 ns, and eventually, the equivalent model of the measurement jig is formed with the 39 cascading impedance samples (4.6/0.117 ≈ 39.32) [34].
In Figure 8, the dotted line is the modeled (reconstructed) results using the impedance peeling, while the solid line is the TDR measurement data. The modeled ones (dotted line) are the result of convolution of unit step function and IFFT of S-parameter in (5) because of the sufficient bandwidth ( f s = 1/0.117 ns ≈ 8.55 GHz). By utilizing the impedance peeling technique, [ S f i x 1 ] is obtained as described earlier, and through the S-T transformation of Equation (3), [ T f i x 1 ] can be calculated. Additionally, since [ T f i x 2 ] is symmetrically connected to [ T f i x 1 ], [ S f i x 2 ] is also available by symmetrizing the diagonal elements of [ S f i x 1 ] using (5) [45]. Then, [ T f i x 2 ] is earned by substituting [ S f i x 2 ] into (3b) in a similar manner. This subsection confirms that the modeled results are mostly consistent with the TDR measurement, and the impedance region, except for the cable lug and BNC connection, mostly converges to 50 Ω , which is a fundamental requirement for a smooth de-embedding process.

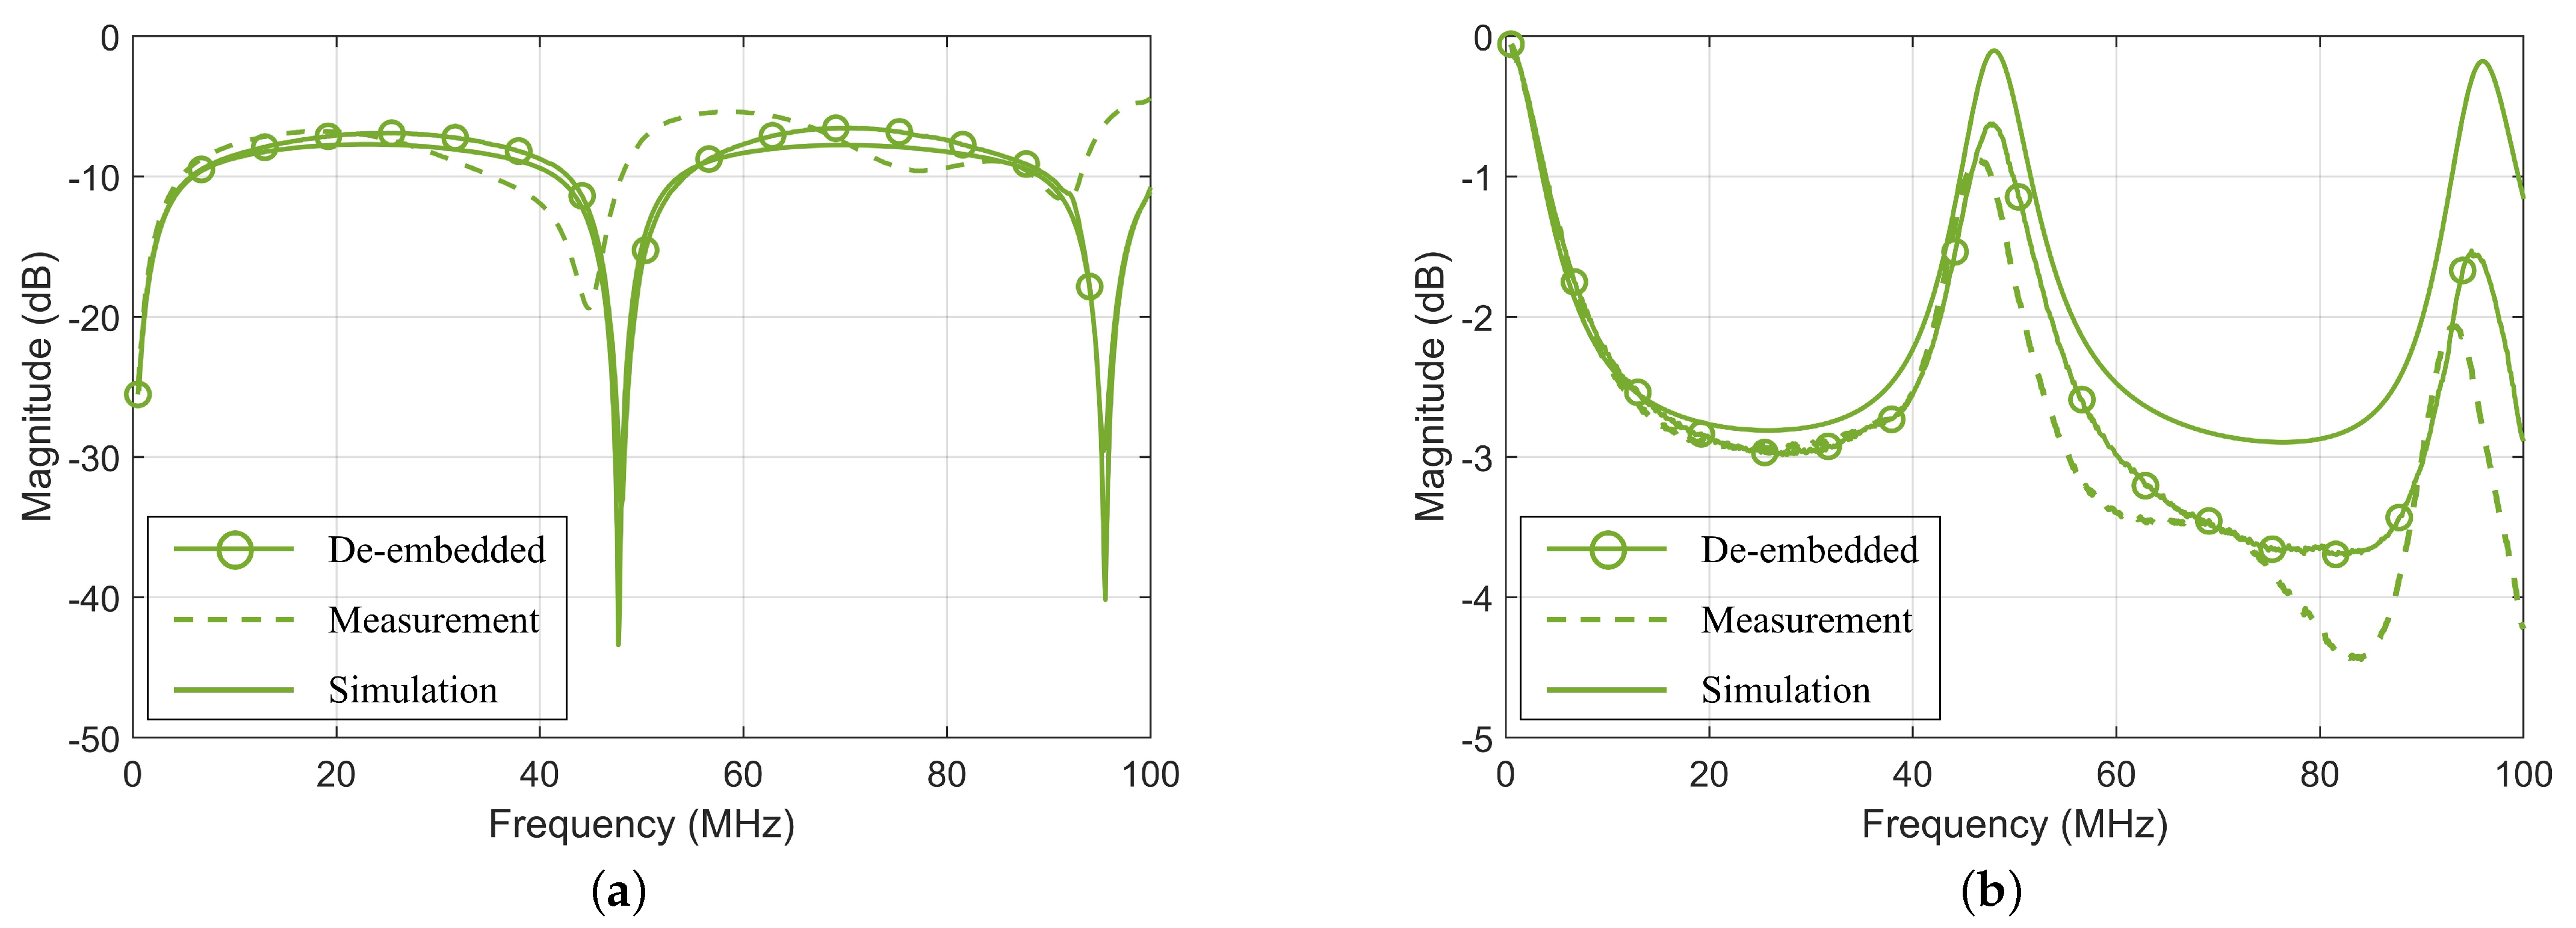
2.4. Comparison between De-Embedded Measurement and Simulation

This subsection compares and discusses the results of the cable simulation performed in II-B with the de-embedded cable measurement obtained in II-C. Figure 9a,b, respectively, illustrate the frequency vs. transmission and reflection coefficients of 1 m thin length cable (CP or PP), and Figure 10a,b also presents same works for 2 m long cable.
The graph in Figure 9 and Figure 10 reveals that the cable measurement and the simulation results exhibit significant discrepancies as the frequency increases. This indicates that the changes in characteristic impedances of the measurement jig and cable lug connections become more pronounced as the frequency increases. To mitigate this distortion, we performed de-embedding process and obtained very similar results to the simulation results. In the case of transmission, due to the differences in the modeled loss terms of the cable in simulation, it presents approximately 1 dB (Figure 9b) and 1.5 dB (Figure 10b) differences at 100 MHz. Nevertheless, since we corrected the most critical aspect, including the length resonance frequency of the cable, via de-embedding process, it is possible to obtain meaningful results.

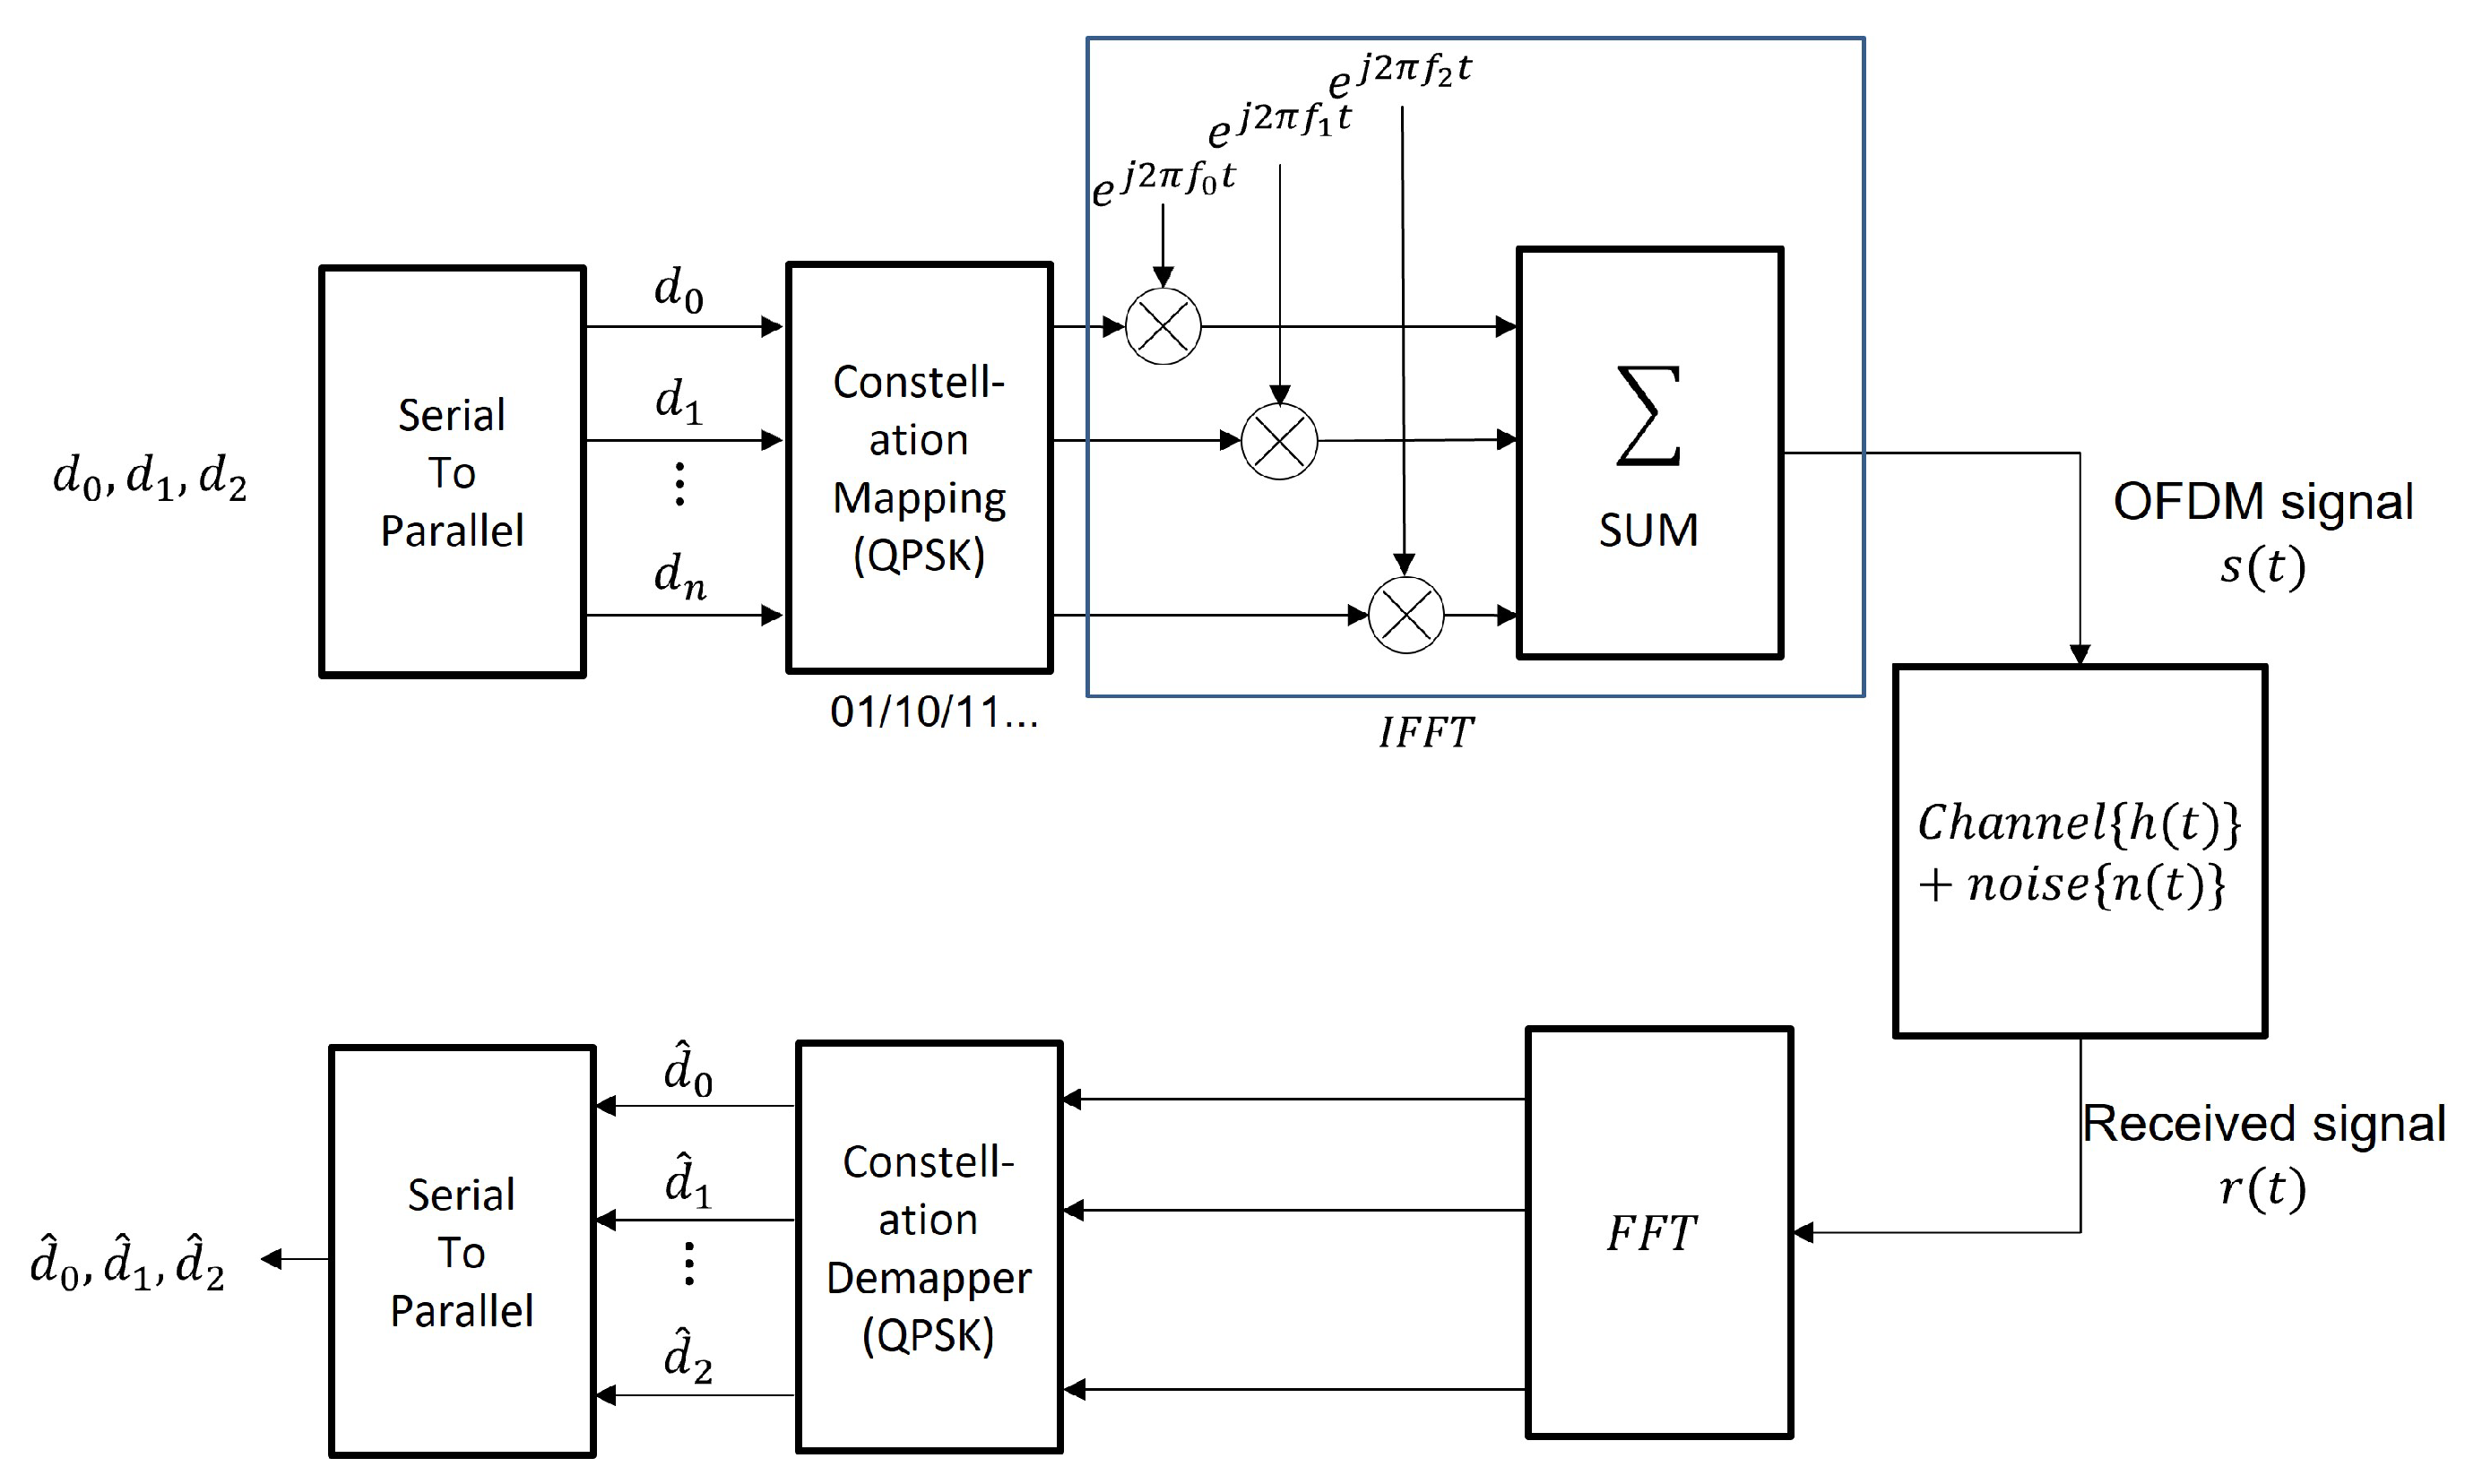
3. Communication Simulation Using the Complete S-Parameter

In this section, a simulation is performed for the communication system using the complete S-parameter of the CCS-CT1 obtained in the previous section. As mentioned earlier, CCS-CT1 uses both low-level communication (LLC), which is based on Pulse Width Modulation (PWM) [37,52] and used in AC slow charging, and high-level communication (HLC), also known as Homeplug GreenPHY (HPGP). LLC is typically used to check the hardware status just before starting the charging process, while HLC provides important information such as the charging status of the vehicle battery, remaining charging time, and potential heat generation caused by high current levels, given that the hardware checklist is completed via LLC communication. Since HLC utilizes a higher and wider frequency band than LLC and is performed simultaneously with charging, this section addresses the issues caused by coupling noise in HLC [53].

3.1. OFDM Communication Environment

HPGP used in HLC employs orthogonal frequency division multiplexing (OFDM) based on the communication method and occupies a bandwidth of 1 to 28 MHz [26]. The transmitter in EVSE generates a subcarrier signal after mapping the digital signals into symbols using the QPSK modulation. After passing through a wired channel (CCS-CT1 cable) with a transfer function of h ( t ) , the OFDM signal is demodulated again in the EV. Figure 11 shows the OFDM process in a block diagram.
As illustrated in Figure 11, the OFDM signal transmitted through the CP line may be affected by external noise in addition to self-attenuation due to losses within the cable. Assuming no additional external noise exists, the received signal passed through the channel can be modeled as (9).
r ( t ) = s ( t ) h ( t ) R n = S n × H n
The subscript n in each symbol in the frequency domain representation indicates the index of each subcarrier band. Then, by compensating the collected signal with the estimated channel value, the original signal ( S ^ n ) can be estimated as follows (10) [54]:
S ^ n = R n H ^ n .
In the HLC simulation performed in this paper, the S-parameter information of CCS-CT1, which has been extracted beforehand, can be utilized. Accordingly, it is also possible to substitute the channel estimation H ^ s with the S-parameter. However, obtaining measurement-based transfer functions H n in the actual charging environments is difficult, so estimation techniques such as least square (LS) and minimum mean-square error (MMSE) [55] are performed, and the Zimmerman and Dostert model [56], which is specialized for PLC communication, is also utilized.

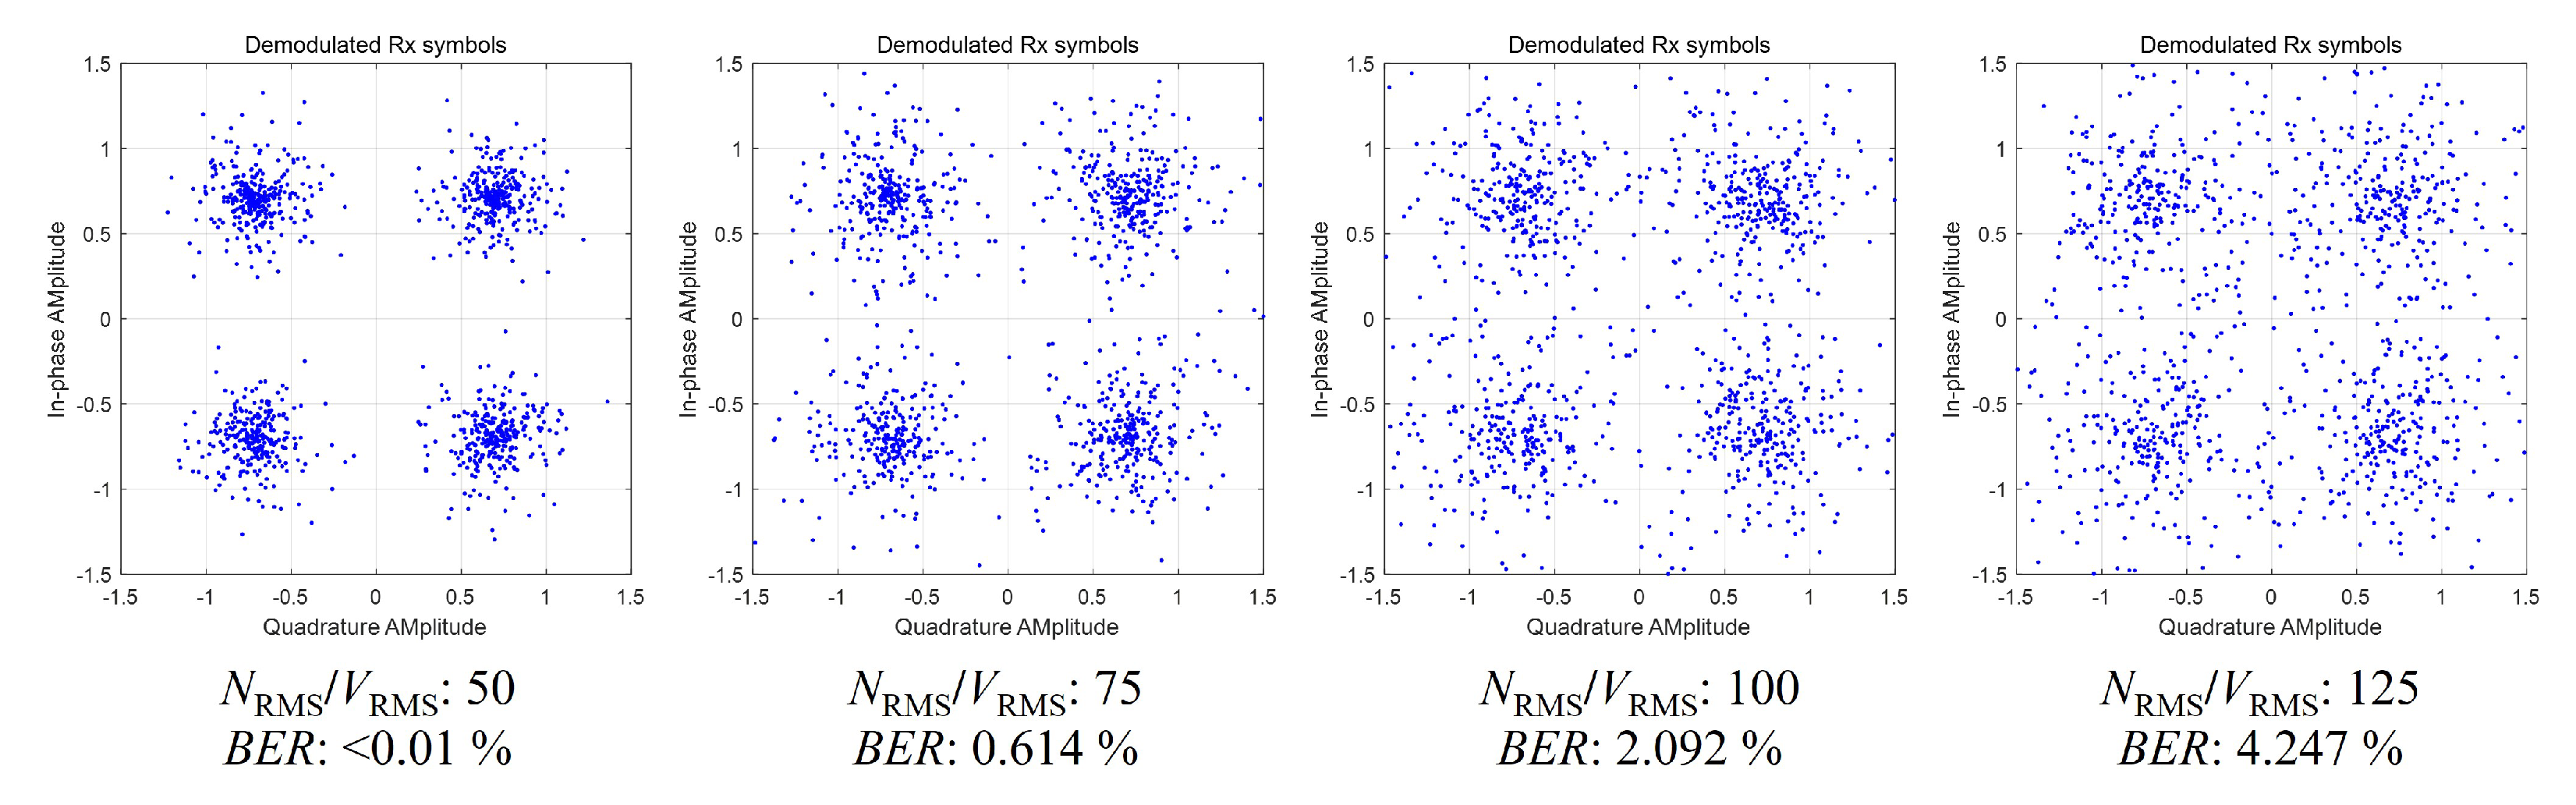
3.2. Error Threshold Analysis

As mentioned in the previous subsection, HPGP based on OFDM utilizes channel estimation techniques to predict the original signal from the received signal. However, as explained before, the random noise components can be added due to the noise coupling in the EVSE-EV charging cable, CCS-CT1, can be added, and such an environment is simply modeled as (11).
r ( t ) = s ( t ) h ( t ) + n ( t ) .
In Equation (11), n ( t ) represents the coupled noise from the EVSE into the CP line load. If we estimate the original signal ( S ^ n ) using the method described in the previous subsection, the definition in (12) holds.
S ^ n = R n + N n H ^ n .
However, (12) differs from (10), which is defined in the noiseless environment, as it contains N n / H ^ n , and the estimation of the original signal is affected by the magnitude of N n . As mentioned earlier, N n can be assumed as the noise generated in the DC line and transferred to the CP line and can be defined using (13).
N n = H f a r | | n e a r ( f ) · N D C ( f ) .
Here, the N D C is the noise generated from the DC supply equipment, and as the EV-EVSE charging system consists of a bidirectional communication system, the transfer function for both far-end crosstalk ( H f a r ) and near-end crosstalk ( H n e a r ) are necessary, as shown in (13). The two coupling paths based on the S-parameter measurement are illustrated in Figure 12, and it is well known that the S-parameter is measured under the condition that every terminating port impedance is set as 50 Ω .
However, the actual output port impedance of the DC supply equipment or the communication module’s in/output port impedance has a respective value according to its preference. In order to derive the voltage transfer function for NEXT or FEXT from the S-parameter measurement obtained in a 50 Ω system, the conversion process should proceed as follows in (14a), (14b), and (14c) [57,58];
H n m ( f ) = V n ( f ) V m ( f ) = S n m ( 1 + Γ n o ) ( 1 S n n Γ n 0 ) ) ( 1 + Γ m )
Γ m ( f ) = S m m + i m Γ i 0 S i m S m i 1 Γ i 0 S i i
Γ k 0 ( f ) = Z k ( f ) Z 0 Z k ( f ) + Z 0 .
Equation (14a) defines the transfer function composed of the voltage at the destination port ( V n ) and the departure port ( V m ) in the frequency domain. In (14a), Γ m means the total reflection at the departure port (m), as represented in (14b). Also, the Γ n 0 and Γ i 0 are available using (14c), where the termination impedance of the destination port ( Z k ) and the network impedance ( Z 0 = 50 Ω ) are utilized.
Setting H f a r as H 71 and H n e a r as H 31 allows for the calculation of the coupled noise via (14). Accordingly, to obtain more practical transfer functions, the port termination impedance values in (13) can be substituted based on the typical output impedance of the EVSE (<10 Ω ), the input impedance of high-capacity batteries (<5 Ω) in the EV [59,60], and the input (>10 kΩ)/output (>10 kΩ) impedance values of bidirectional voltage communication systems.

3.3. Error Scenario Discussion

In communication systems utilizing OFDM, it is common to quantify the error occurrence caused by channel noise using the bit error rate (BER), which represents the ratio of the difference between the bit values of the transmitted signal ( S n ) and the estimated transmitted signal ( S ^ n ). In this paper, we first analyzed the error vector magnitude (EVM) values that vary depending on the size of the noise induced in the aggressive line (DC+) during the OFDM communication using the previously modeled NEXT and FEXT transfer functions [61]. The generated noise was based on a Gaussian noise function that occurs within OFDM, and the size of the noise in the EVSE relative to the transmitted signal is quantified based on the ratio of the RMS values of the transmitted signal and the Gaussian noise within the communication bandwidth. The simulations are performed on a de-embedded 1 m long CCS-CT1 cable, as presented in Figure 13 and Figure 14, where Figure 13 shows the simulation results under the NEXT condition, and Figure 14 shows the case of the FEXT.
Through EVM values from the simulations, it is anticipated that significant bit errors of approximately 4% may occur when the noise signal ratio is about 125 in both near-end and far-end cases [62]. As users aim for faster charging, the size of the power supply noise from the power-supplying equipment increases, leading to an increase in error probability caused by the coupling noise, ultimately resulting in a possible interruption in the charging sequence. To obtain more realistic results, the simulation is conducted using the measurement data of 7 m of the de-embedded CCS-CT1 cable, as shown in Figure 15.
According to well-known EMC practices, it is clear that the near-end crosstalk (NEXT) is similar regardless the length of cables, while the FEXT is more pronounced for longer cables due to increased coupling paths. Hence, as summarized in Figure 15, it is observed that the BER at the far end increases as the cable length increases despite the same noise level. On the other hand, it is confirmed that the BER at the near end increases only slightly compared to that at the far end. In other words, in real environments, the increased lengths of CCS-CT1 cable could easily effect the communication quality of EV-EVSE and eventually jeopardize the charging process in the worst-case scenario.
This paper conducted OFDM simulations based on the QPSK modulation scheme, which is adopted via the HPGP communication protocol for EV-EVSE communications. However, it is predicted that if a higher order digital modulation technique is utilized, the system will cause a higher bit error rate (BER) under the same system configuration. Therefore, it is necessary to establish an improved CCS-CT1 cable assembly either by changing the contemporary common-mode wiring to a differential-mode wiring or by building a more reliable shield between the communication signal line and the DC power line. Additionally, after constructing an actual EV-EVSE communication system [63,64], using a noise generator [65,66] would allow us to obtain more realistic results regarding communication degradation due to electromagnetic coupling. These results are expected to make a significant contribution to the future development of EV-EVSE systems.

4. Conclusions

The increasing demand for electric vehicles has resulted in the widespread adoption of off-board charging methods that can supply large amounts of DC current to the vehicles. However, the charging cables currently used for electric vehicles are susceptible to electromagnetic interference (EMI) due to the lack of a separate shielding device between the power line and the communication line that controls it. As previously noted, the high-power AC/DC conversion device used in EVSEs emits various noise signals due to its switch-mode methods, and the strength of these noise signals can be relatively large compared to that of the communication signals. This can cause a charging system malfunction by electromagnetic coupling to other communication lines from the noisy DC power line, ultimately leading to service failure. In this study, a dedicated measurement jig for the CCS-CT1 cable structure is developed, and a de-embedding technique based on the impedance peeling technique using a time-domain reflectometer (TDR) is proposed to obtain the complete S-parameter values of the CCS-CT1 cable. By conducting OFDM simulations using the measured S-parameters, the signal integrity problems caused by Gaussian noise, which is the worst-case scenario that can occur in a typical charging system, are carefully analyzed. If we want to perform further analyses for specific situations, we expect that the practical modeling of the noise generated during the switch-mode power conversion process or the modeling of noise from different scenarios can be used to assess the possibility of communication performance degradation due to electromagnetic coupling. We hope that these results can contribute to the development of more efficient and reliable off-board charging systems that are less susceptible to EMI, guarantee the efficacy of communication systems, and eventually ensure the safety of EV-EVSE system users.

Author Contributions

Conceptualization, E.L.; data curation, S.P.; formal analysis, E.L. and S.P.; investigation, E.L., S.P., Y.-H.N. and D.-H.C.; supervision, J.-g.Y. All authors have read and agreed to the published version of the manuscript.

Funding

This work is supported by the Standardization and Certification of New Energy Technologies of the Korea Institute of Energy Technology Evaluation and Planning (KETEP) granted financial resource from the Ministry of Trade, Industry & Energy, Republic of Korea (No. 20217301010050).

Data Availability Statement

Not applicable.

Conflicts of Interest

The authors declare no conflict of interest.

Abbreviations

The following abbreviations are used in this manuscript:
CCS-CT1Combined Charging System Combo Type 1
SMPCSwitch-mode Power Conversion
EVElectric Vehicle
EVSEElectric Vehicle Supply Equipment
EMIElectromagnetic Interference
TDRTime-domain Reflectometer
OFDMOrthogonal Frequency-division Multiplexing
DGSDefected Ground Structure
GCPWGrounded Co-planar Waveguide
IFTInverse Fourier Transformation
PEProtectiv Earth
PWMPulse Width Modulation
HPGPHomeplug GreenPHY
HLCHigh-level Communicaiton
LLCLow-level Communication
LSLeast Squre
MMSEMinimum Mean-squre Error
CPControl Pilot
NEXTNear-end Crosstalk
FEXTFar-end Crosstalk
EVMError Vector Magnitude

References

  1. Wu, J.; Liao, H.; Wang, J.W.; Chen, T. The role of environmental concern in the public acceptance of autonomous electric vehicles: A survey from China. Transp. Res. Part F Traffic Psychol. Behav. 2019, 60, 37–46. [Google Scholar] [CrossRef]
  2. Harper, C.; McAndrews, G.; Byrnett, D.S. Electric Vehicles: Key Trends, Issues, and Considerations for State Regulators; National Association of Regulatory Utility Commissioners: Washington, DC, USA, 2019; pp. 1–44. [Google Scholar]
  3. Shi, J.; Xu, B.; Zhou, X.; Hou, J. A cloud-based energy management strategy for hybrid electric city bus considering real-time passenger load prediction. J. Energy Storage 2022, 45, 103749. [Google Scholar] [CrossRef]
  4. Deb, N.; Singh, R.; Brooks, R.R.; Bai, K. A review of extremely fast charging stations for electric vehicles. Energies 2021, 14, 7566. [Google Scholar] [CrossRef]
  5. Aretxabaleta, I.; De Alegria, I.M.; Andreu, J.; Kortabarria, I.; Robles, E. High-voltage stations for electric vehicle fast-charging: Trends, standards, charging modes and comparison of unity power-factor rectifiers. IEEE Access 2021, 9, 102177–102194. [Google Scholar] [CrossRef]
  6. Yilmaz, M.; Krein, P.T. Review of Battery Charger Topologies, Charging Power Levels, and Infrastructure for Plug-In Electric and Hybrid Vehicles. IEEE Trans. Power Electron. 2013, 28, 2151–2169. [Google Scholar] [CrossRef]
  7. Wei, Z.; Quan, Z.; Wu, J.; Li, Y.; Pou, J.; Zhong, H. Deep Deterministic Policy Gradient-DRL Enabled Multiphysics-Constrained Fast Charging of Lithium-Ion Battery. IEEE Trans. Ind. Electron. 2022, 69, 2588–2598. [Google Scholar] [CrossRef]
  8. Wu, J.; Wei, Z.; Liu, K.; Quan, Z.; Li, Y. Battery-Involved Energy Management for Hybrid Electric Bus Based on Expert-Assistance Deep Deterministic Policy Gradient Algorithm. IEEE Trans. Veh. Technol. 2020, 69, 12786–12796. [Google Scholar] [CrossRef]
  9. Rasool, H.; Verbrugge, B.; Zhaksylyk, A.; Tran, T.M.; El Baghdadi, M.; Geury, T.; Hegazy, O. Design optimization and electro-thermal modeling of an off-board charging system for electric bus applications. IEEE Access 2021, 9, 84501–84519. [Google Scholar] [CrossRef]
  10. Park, S.I.; Lee, J.G. Design of Smart Off-Board Charge System for Neighborhood Electric Vehicle. J. Korea Inst. Electron. Commun. Sci. 2013, 8, 1499–1504. [Google Scholar] [CrossRef] [Green Version]
  11. Shahir, F.M.; Gheisarnejad, M.; Sadabadi, M.S.; Khooban, M.H. A new off-board electrical vehicle battery charger: Topology, analysis and design. Designs 2021, 5, 51. [Google Scholar] [CrossRef]
  12. Jiang, L.; Diao, X.; Zhang, Y.; Zhang, J.; Li, T. Review of the charging safety and charging safety protection of electric vehicles. World Electr. Veh. J. 2021, 12, 184. [Google Scholar] [CrossRef]
  13. Wang, B.; Dehghanian, P.; Wang, S.; Mitolo, M. Electrical safety considerations in large-scale electric vehicle charging stations. IEEE Trans. Ind. Appl. 2019, 55, 6603–6612. [Google Scholar] [CrossRef]
  14. International Electrotechnical Commission. Electric Vehicle Conductive Charging System—Part 24: Digital Communication between a d.c. EV Charging Station and an Electric Vehicle for Control of d.c. Charging; International Electrotechnical Commission: Geneva, Switzerland, 2014. [Google Scholar]
  15. Lewandowski, C.; Gröning, S.; Schmutzler, J.; Wietfeld, C. Performance evaluation of PLC over the IEC 61851 control pilot signal. In Proceedings of the 5th Workshop on Power Line Communications, Arnhem, The Netherlands, 22–23 September 2011. [Google Scholar]
  16. Chudy, A.; Stryczewska, H.D. Electromagnetic compatibility testing of electric vehicles and their chargers. Inform. Autom. Pomiary Gospod. Ochr. ŚRodowiska 2020, 10, 70–73. [Google Scholar] [CrossRef]
  17. Wan, W.; Zhou, J.; Cai, J.; Ding, X.; Jiang, L. The Interoperability Test of Off-Board Charger for Electric Vehicle. In Proceedings of the 2020 IEEE 4th Conference on Energy Internet and Energy System Integration (EI2), Wuhan, China, 31 October–1 November 2020; pp. 654–658. [Google Scholar]
  18. Martinez, W.; Lin, W.; Suarez, C. EMC implications of implementing WBG devices in battery charger modules for electric vehicles. In Proceedings of the 2022 International Power Electronics Conference (IPEC-Himeji 2022—ECCE Asia), Brasov, Romania, 25–28 September 2022; pp. 2516–2521. [Google Scholar]
  19. Alame, D.; Azzouz, M.; Kar, N. Assessing and mitigating impacts of electric vehicle harmonic currents on distribution systems. Energies 2020, 13, 3257. [Google Scholar] [CrossRef]
  20. Mazurek, P.; Chudy, A. An Analysis of Electromagnetic Disturbances from an Electric Vehicle Charging Station. Energies 2022, 15, 244. [Google Scholar] [CrossRef]
  21. Slangen, T.M.H.; van Wijk, T.; Ćuk, V.; Cobben, J.F.G. The Harmonic and Supraharmonic Emission of Battery Electric Vehicles in The Netherlands. In Proceedings of the 2020 International Conference on Smart Energy Systems and Technologies (SEST), Istanbul, Turkey, 7–9 September 2020; pp. 1–6. [Google Scholar] [CrossRef]
  22. Singh, G.; Howe, W. Assessing the Harmonic and Supraharmonic Impact of Electric Vehicle Charging Facilities. In Proceedings of the 2022 20th International Conference on Harmonics & Quality of Power (ICHQP), Naples, Italy, 29 May–1 June 2022; pp. 1–6. [Google Scholar] [CrossRef]
  23. Karmaker, A.K.; Roy, S.; Ahmed, M.R. Analysis of the impact of electric vehicle charging station on power quality issues. In Proceedings of the 2019 International Conference on Electrical, Computer and Communication Engineering (ECCE), Cox’s Bazar, Bangladesh, 7–9 February 2019; pp. 1–6. [Google Scholar]
  24. Rajendran, G.; Vaithilingam, A.; Naidu, K.; Prakash, S.; Ahmed, R. Hard Switching Characteristics of SiC and GaN Devices for Future Electric Vehicle Charging Stations. MATEC Web Conf. 2021, 335, 02007. [Google Scholar] [CrossRef]
  25. International Organization for Standardization. Road Vehicles—Vehicle to Grid Communication Interface—Part 3: Physical and Data Link Layer Requirements; International Organization for Standardization: Geneva, Switzerland, 2015. [Google Scholar]
  26. Pallander, R. Implementation of HomePlug Green Phy standard (ISO15118) into Electric Vehicle Supply Equipment. 2021. Available online: https://ltu.diva-portal.org/smash/get/diva2:1546405/FULLTEXT01.pdf. (accessed on 17 July 2023).
  27. Jo, S.; Noh, Y.H.; Kim, C.g.; Park, Y.W.; Lee, D.H.; Jeong, K.S.; Yook, J.G. Analysis of HEMP Coupling Signal for a Coaxial Cable Considering Various Cable Parameters. J. Korean Inst. Electromagn. Eng. Sci. 2020, 31, 542–554. [Google Scholar] [CrossRef]
  28. Im, H.R.; Kim, W.B.; Kim, C.g.; Sohn, J.H.; Jeong, K.S.; Yook, J.G. Method for Approximated Analysis of HEMP Couplings to Cables in Reinforced Concrete. J. Korean Inst. Electromagn. Eng. Sci. 2020, 31, 623–630. [Google Scholar] [CrossRef]
  29. Kim, S.; Noh, Y.H.; Lee, J.; Lee, J.; Choi, J.S.; Yook, J.G. Electromagnetic Signature of a Quadcopter Drone and Its Relationship With Coupling Mechanisms. IEEE Access 2019, 7, 174764–174773. [Google Scholar] [CrossRef]
  30. SAE International. SAE Electric Vehicle and Plug in Hybrid Electric Vehicle Conductive Charge Coupler J1772_201710; SAE International: Warrendale, PA, USA, 2015. [Google Scholar]
  31. Paul, C.R. Analysis of Multiconductor Transmission Lines; John Wiley & Sons: Hoboken, NJ, USA, 2007. [Google Scholar]
  32. Rolfes, I.; Schiek, B. Multiport method for the measurement of the scattering parameters of N-ports. IEEE Trans. Microw. Theory Tech. 2005, 53, 1990–1996. [Google Scholar] [CrossRef]
  33. Stevanović, I.; Wunsch, B.; Madonna, G.L.; Skibin, S. High-frequency behavioral multiconductor cable modeling for EMI simulations in power electronics. IEEE Trans. Ind. Inform. 2014, 10, 1392–1400. [Google Scholar] [CrossRef]
  34. Pupalaikis, P.J. Time-domain techniques for de-embedding and impedance peeling. System 2020, 1, 1–2. [Google Scholar]
  35. Stevanović, I.; Wunsch, B.; Madonna, G.L.; Vancu, M.F.; Skibin, S. Multiconductor cable modeling for EMI simulations in power electronics. In Proceedings of the IECON 2012—38th Annual Conference on IEEE Industrial Electronics Society, Montreal, QC, Canada, 25–28 October 2012; pp. 5382–5387. [Google Scholar] [CrossRef]
  36. Wang, L. Estimation of multi-conductor powerline cable parameters for the modelling of transfer characteristics. IET Sci. Meas. Technol. 2014, 8, 39–45. [Google Scholar] [CrossRef]
  37. Yonge, L.; Abad, J.; Afkhamie, K.; Guerrieri, L.; Katar, S.; Lioe, H.; Pagani, P.; Riva, R.; Schneider, D.M.; Schwager, A.; et al. An overview of the HomePlug AV2 technology. J. Electr. Comput. Eng. 2013, 2013. [Google Scholar] [CrossRef]
  38. Homeplug Powerline Alliance. HomePlug Green PHY: The Standard For Inhome Smart Grid Powerline Communications—An Application and Technology Overview, 3rd ed.; 2012. Available online: https://content.codico.com/fileadmin/media/download/datasheets/powerline-communication/plc-homeplug-green-phy/homeplug_green_phy_whitepaper.pdf (accessed on 17 July 2023).
  39. SamWoo-Electronics. Electric Vehicle Charging Technology. Available online: http://scm.isamwoo.com/evalucon/pdf/EVT_Catalogue_C18_E01-ENG.PDF (accessed on 17 July 2023).
  40. Ye, X. De-embedding errors due to inaccurate test fixture characterization. IEEE Electromagn. Compat. Mag. 2012, 1, 75–78. [Google Scholar] [CrossRef]
  41. Ye, X.; Fan, J.; Drewniak, J.L. New de-embedding techniques for PCB transmission-line characterization. In Proceedings of the DesignCon 2015, Santa Clara, CA, USA, 27–30 January 2015. [Google Scholar]
  42. Khandelwal, M.K.; Kanaujia, B.K.; Kumar, S. Defected ground structure: Fundamentals, analysis, and applications in modern wireless trends. Int. J. Antennas Propag. 2017, 1–22. [Google Scholar] [CrossRef]
  43. Wadell, B.C. Transmission Line Design Handbook; Artech House: Norwood, MA, USA, 1991. [Google Scholar]
  44. Meyer, P. Multi-conductor transmission line analysis using the generalized multi-mode S-parameter transformation. In Proceedings of the 2015 IEEE 19th Workshop on Signal and Power Integrity (SPI), Berlin, Germany, 10–13 May 2015; pp. 1–4. [Google Scholar] [CrossRef]
  45. Pozar, D.M. Microwave Engineering, 3rd ed.; John Wiley & Sons: Hoboken, NJ, USA, 2005. [Google Scholar]
  46. Black, W.C. Power line S-parameter characterization using open-source tools. In Proceedings of the ISPLC2010, Rio de Janeiro, Brazil, 28–31 March 2010; pp. 62–66. [Google Scholar]
  47. Liu, B.W.; Wei, X.C.; Xv, C.X. A hybrid de-embedding method for low loss and reciprocal PCB fixtures. IEEE Trans. Instrum. Meas. 2022, 71, 1–8. [Google Scholar] [CrossRef]
  48. Ali, A.S.; Mittra, R. Time-Domain Reflectometry Using Scattering Parameters and a De-Embedding Application; Technical Report; University of Illinois Urbana Electromagnetic Communication Laboratory: Champaign, IL, USA, 1986. [Google Scholar]
  49. Bordin, C.J., Jr.; dos Santos, K.M.G. Conversion of Scattering Parameters to Time-Domain for Imaging Applications: Rules and Examples. J. Commun. Inf. Syst. 2021, 36, 62–69. [Google Scholar]
  50. Frickey, D.A. Conversions between S, Z, Y, H, ABCD, and T parameters which are valid for complex source and load impedances. IEEE Trans. Microw. Theory Tech. 1994, 42, 205–211. [Google Scholar] [CrossRef]
  51. Frei, J.; Cai, X.D.; Muller, S. Multiport S-parameter and T-parameter conversion with symmetry extension. IEEE Trans. Microw. Theory Tech. 2008, 56, 2493–2504. [Google Scholar] [CrossRef]
  52. Terzi, U.K.; Ilhan, H.E.; Kaymaz, H.; Erdal, H.; Çalik, H. A review of commercial electric vehicle charging methods. Promet-Traffic Transp. 2020, 32, 291–307. [Google Scholar] [CrossRef] [Green Version]
  53. Kubel, M. Design Guide for Combined Charging System; CharIN eV: Berlin, Germany, 2015. [Google Scholar]
  54. Sure, P.; Bhuma, C.M. A survey on OFDM channel estimation techniques based on denoising strategies. Eng. Sci. Technol. Int. J. 2017, 20, 629–636. [Google Scholar] [CrossRef]
  55. Coleri, S.; Ergen, M.; Puri, A.; Bahai, A. Channel estimation techniques based on pilot arrangement in OFDM systems. IEEE Trans. Broadcast. 2002, 48, 223–229. [Google Scholar] [CrossRef] [Green Version]
  56. Zimmermann, M.; Dostert, K. A multipath model for the powerline channel. IEEE Trans. Commun. 2002, 50, 553–559. [Google Scholar] [CrossRef] [Green Version]
  57. Rautio, J. Techniques for Correcting Scattering Parameter Data of an Imperfectly Terminated Multiport When Measured with a Two-Port Network Analyzer. IEEE Trans. Microw. Theory Tech. 1983, 31, 407–412. [Google Scholar] [CrossRef]
  58. Lu, S.S.; Lin, Y.S.; Chiu, H.W.; Chen, Y.C.; Meng, C.C. The determination of S-parameters from the poles of voltage-gain transfer function for RF IC design. IEEE Trans. Circuits Syst. I Regul. Pap. 2005, 52, 191–199. [Google Scholar] [CrossRef]
  59. Dai, H.; Jiang, B.; Wei, X. Impedance characterization and modeling of lithium-ion batteries considering the internal temperature gradient. Energies 2018, 11, 220. [Google Scholar] [CrossRef] [Green Version]
  60. Hannan, M.A.; Lipu, M.H.; Hussain, A.; Mohamed, A. A review of lithium-ion battery state of charge estimation and management system in electric vehicle applications: Challenges and recommendations. Renew. Sustain. Energy Rev. 2017, 78, 834–854. [Google Scholar] [CrossRef]
  61. Voelker, K. Apply error vector measurements in communications design. Microwaves & RF 1995, 34, 143–144. [Google Scholar]
  62. Shafik, R.A.; Rahman, M.S.; Islam, A.R. On the Extended Relationships Among EVM, BER and SNR as Performance Metrics. In Proceedings of the 2006 International Conference on Electrical and Computer Engineering, Dhaka, Bangladesh, 19–21 December 2006; pp. 408–411. [Google Scholar] [CrossRef] [Green Version]
  63. Anil, D.; Sivraj, P. Electric Vehicle Charging Communication Test-bed following CHAdeMO. In Proceedings of the 2020 11th International Conference on Computing, Communication and Networking Technologies (ICCCNT), Kharagpur, India, 1–3 July 2020; pp. 1–7. [Google Scholar] [CrossRef]
  64. Lathika, A.; Nithin, S. Development of a Communication Test Bed for Electric Vehicle Charging. In Proceedings of the 2020 International Conference on Electronics and Sustainable Communication Systems (ICESC), Coimbatore, India, 2–4 July 2020; pp. 1127–1130. [Google Scholar] [CrossRef]
  65. Nia, M.S.S.; Shamsi, P.; Ferdowsi, M. EMC Modeling and Conducted EMI Analysis for a Pulsed Power Generator System Including an AC–DC–DC Power Supply. IEEE Trans. Plasma Sci. 2020, 48, 4250–4261. [Google Scholar] [CrossRef]
  66. Wu, C.; Kim, H.; He, J.; Erickson, N.; Cho, S.; Kim, D.; Hur, Y.; Pommerenke, D.J.; Fan, J. Analysis and Modeling of Conducted EMI from an AC–DC Power Supply in LED TV up to 1 MHz. IEEE Trans. Electromagn. Compat. 2019, 61, 2050–2059. [Google Scholar] [CrossRef]
Figure 1. Configuration of off-board charging system.
Energies 16 05947 g001
Figure 2. Port configuration of CCS-CT1 cable and related S-parameter.
Energies 16 05947 g002
Figure 3. Cross section of CCS-CT1 and role of each line.
Energies 16 05947 g003
Figure 4. (a) Upper side and (b) lower side of the fabricated measurement jig and (c) connection with CCS-CT1 cable.
Energies 16 05947 g004
Figure 5. (a) Configuration of port excitation and (b) full measurement setup.
Energies 16 05947 g005
Figure 6. Unit cell configuration of CCS-CT1 cable (Red: CP, Orange: PP, Remainders: Auxiliary).
Energies 16 05947 g006
Figure 7. TDR result of the CCS combo measurement result.
Energies 16 05947 g007
Figure 8. Comparison of de-embedded TDR results of the measured and modeled fixture.
Energies 16 05947 g008
Figure 9. Frequency response of (a) reflection and (b) insertion loss regarding simulation, with its measured and de-embedded results for 1 m length of CCS–CT1 cable.
Energies 16 05947 g009
Figure 10. Frequency response of (a) reflection and (b) insertion loss regarding simulation, with its measured and de-embedded results for 2 m length of CCS–CT1 cable.
Energies 16 05947 g010
Figure 11. Conceptual block diagram of OFDM/QPSK communication.
Energies 16 05947 g011
Figure 12. Noise coupling path (Red) S 31 and (Blue) S 71 .
Energies 16 05947 g012
Figure 13. Constellation map using 1 m of CCS–CT1 with near–end transfer function ( H n e a r ).
Energies 16 05947 g013
Figure 14. Constellation map using 1 m of CCS–CT1 with far–end transfer function ( H f a r ).
Energies 16 05947 g014
Figure 15. Constellation map comparison between 1 m and 7 m of near– and far–end transfer functions.
Energies 16 05947 g015
Table 1. Dimension of fixture ( ϵ r = 4.3).
TypeHeight (Subs.)Width (W)Spacing (S)
CPWG (feed)0.8 mm1.5 mm1.08 mm
DGS (DC)0.8 mm22 mm1.4 mm
DGS (CP)0.8 mm8.2 mm1.1 mm
Disclaimer/Publisher’s Note: The statements, opinions and data contained in all publications are solely those of the individual author(s) and contributor(s) and not of MDPI and/or the editor(s). MDPI and/or the editor(s) disclaim responsibility for any injury to people or property resulting from any ideas, methods, instructions or products referred to in the content.

