Article

Conceptual Design of a Floating Modular Energy Island for Energy Independency: A Case Study in Crete

1
Department of Wind Engineering and Fluid Dynamics, Faculty of Civil and Environmental Engineering, Ruhr-Universität Bochum, 44780 Bochum, Germany
2
Department of Geographic, Geophysics Engineering and Energy, Faculty of Sciences, University of Lisbon, 1649-004 Lisbon, Portugal
3
School of Mechanical and Materials Engineering, University College Dublin, D04 V1W8 Dublin, Ireland
4
Vinča Institute of Nuclear Sciences—National Institute of the Republic of Serbia, University of Belgrade, 11000 Belgrade, Serbia
5
Croatian Roads Ltd., 10000 Zagreb, Croatia
6
Department of Civil Engineering, School of Engineering, University of Birmingham, Birmingham B15 2TT, UK
7
School of Production Engineering and Management, Technical University of Crete, 731 00 Chania, Greece
*
Author to whom correspondence should be addressed.
Energies 2023, 16(16), 5921; https://doi.org/10.3390/en16165921
Submission received: 23 June 2023 / Revised: 28 July 2023 / Accepted: 31 July 2023 / Published: 10 August 2023
(This article belongs to the Special Issue Sustainable Energy Artificial Islands)

Abstract

:
This paper aims to investigate the development of a floating artificial sustainable energy island at a conceptual design level that would enhance the energy independence of islands focusing on a case study on the island of Crete. This paper provides a baseline assessment showing the immense potential of wind and solar energy in and around Crete integrating the third significant renewable energy source (RES) of ocean waves into the energy island. The selection of the best location for the floating offshore platforms that compose the energy island is addressed through exploiting the great potential of the above-mentioned RES, taking into consideration criteria with regard to several significant human activities. To this end, the concept of an innovative floating modular energy island (FMEI) that integrates different renewable energy resources is proposed; in addition, a case study that focuses on the energy independency of a big island illustrates the concept referring to the substitution of the local thermal power plants that are currently in operation in Crete with sustainable energy power. Although focused on the renewable energy resources around Crete, the work of this paper provides a basis for a systematic offshore renewable energy assessment as it proposes a new methodology that could be used anywhere around the globe.

1. Introduction

Ambitious targets for 2030, set by the European Union [1] towards greenhouse gas emissions, is a strong motivation for the development and deployment of robust offshore renewable energy infrastructure. With increasing energy demand, and challenges surrounding the acquisition and development of onshore real estate for renewable energy infrastructure, there is an increasing interest in combined offshore energy converters. This is particularly true in the case of remote settlements that are located far from the electricity grid infrastructure of the nearby mainland [2]. Islands such as Crete, the fifth largest island in the Mediterranean Sea, are examples of regions where low-carbon substitutes for existing onshore thermal power plants need to be developed to meet the increasing energy demands. Combined energy harvesting devices installed offshore, with the possibility to share common and costly infrastructure such as foundations or grid installations, can be ideal solutions in such cases.
Artificial floating islands have been proposed for various purposes such as floating airplane runways, fuel storage bases, aquaculture, wastewater treatment and even as floating cities [3,4,5,6]. Although the concept of prefabricated, modular floating islands is not new [7,8], an energy island dedicated to renewable energy, with near-zero onshore land acquisition makes it an extraordinarily suitable solution to the energy demands. Focusing on the idea of an energy island as a portable modular floating structure combining wind, wave and solar energy harvesters and energy storage systems, the Floating Modular Energy Island (FMEI) concept is proposed. Strengths include enhanced renewable energy potential in offshore locations and capital gains through shared floating, mooring, storage and energy transport infrastructure. The idea of using the floating energy island not only as an additional power plant, but also as a hub for electricity production in the case of other prospective wind farms, increases the importance of the energy island. The energy island as a hub for major power distribution has also been initiated for the North Sea [9].
The Mediterranean Sea around the island of Crete is characterised by deep waters, making it difficult to construct fixed-bottom offshore energy farms. The island of Crete, which is presently served by three thermal power plants generating about 800 MW of electricity [10], is an ideal location to study the possibility of combined offshore energy converters harvesting the wind, wave and solar sources. This study presents the scenarios in which offshore wind energy has the potential to become a new base for renewable energy resources in Crete, with wave energy as a substitute. The concept of an FMEI agrees very well with the sustainable development goals put forward by the international bodies [11,12].
This paper presents the novel design of a conceptual floating modular energy island for the island of Crete. A detailed description of wind, wave and solar energy potentials in the geographical region is presented. A suitable site for the FMEI is then identified, optimizing the energy potential and taking into account proximity to land and shipping lanes. The bathymetric, climatic and geographical characteristics of the site are evaluated, and the potential for renewable energy sources (RES) are assessed for the chosen location. Energy converters available on the current market are considered. Finally, we present a conceptual design of the region and the demand-specific FMEI.

2. Assessment of Renewable Energy Resources for Potential Location

The first step in designing an energy island is to identify the most suitable location for the use of wind, solar and wave energies in the vicinity of the Cretan islands. The concept of FMEI is to consider the synergy between the three RES. The regions around the island of Crete with the highest solar, wind and wave energy potential were identified. The identification is carried out using open-source historical data of wind speed, solar irradiation and the sea waves reanalysis. The assessment of resources is carried out in parallel with the consideration of protected areas, exclusion zones and grid connectivity. The potential locations are curated taking into account available resources, sea depth and distance from the coast with visibility impact. In the second step, having chosen the proposed potential location, the performance data of the different types of energy were calculated and converted into the same unit of power. Once the best location was identified, the concept of an FMEI was designed and a conversion system for each type of energy was selected. In this study, monthly assessment of energy is pursued to address the summer, winter and peak energy demand months.

2.1. Wind Energy Assessment

Data from the New European Wind Atlas (NEWA) 1.0 [13] were used to identify the most promising offshore wind speed. The initial observation of regions with potential wind energy was started by using the climate mean wind speed and power density. The climate data refers to simulated data from a mesoscale WRF model with 3 km grid spacing based on large-scale reanalysis wind climate data [14,15]. Figure 1a,b show the contour map of the climate mean wind speed and power density for Crete and the surrounding area. On the west, east and central south region of the island of Crete, a high climate mean wind speed is identified. The three regions are marked as potential regions and the mesoscale climate mean wind speed and power density are summarized in Table 1. The three selected regions of west, east and central south are evaluated by means of the obtained climate mean wind power density. Classification of the three regions into a wind power class results in wind class 6 [16].
In this assessment, historical or time-series wind speed from 1 January 2018 to 31 December 2018 were used to estimate the monthly average wind speed at 75 m, 100 m, 150 m and 200 m elevations, which is the range of hub heights of offshore wind turbines on the market. By the time the data from [13] were retrieved, the authors were unable to find more recent years than 2018. It must be noted that there is a mismatch of recorded time in the interface of the NEWA website and the time stored in the downloaded data. The authors have acknowledged this error but assumed the former to be true as the trend of mean wind speed throughout the year is more plausible than the latter. The estimation of wind speed along the heights can be determined with the obtained wind profile exponent using the data from the four elevations. The evaluation is carried out for the three potential regions and the mean wind speed is assessed for each month in the year. Figure 2 shows the trend of monthly mean wind speed at a 100 m elevation for the west, east and central south potential regions. The three potential regions become the basis options to select the potential location of the energy island, where further assessment of solar and wave energy, as well as the consideration of several human activities, are further elaborated in this paper.

2.2. Solar Energy Assessment

The Global Solar Atlas [17] was used to identify the most promising offshore solar sites with high normal solar irradiance. As offshore solar data are not available, this study uses data of the nearby onshore sites, where the southern coastal areas of Greece have the highest solar potential, including the entire island of Crete, where more than 1800 kWh/m2 can potentially be achieved (Figure 3). The solar irradiation is evaluated for its monthly mean hourly power production after considering the selected commercial solar panel. Using the online tool PVGIS, three possible locations were studied. This tool allows users to know the daily, monthly, and yearly solar radiation and photovoltaic (PV) system performance for any location onshore. Considering the potential wind energy harvested at those locations, the most beneficial for both energy resources (solar and wind) is the one located at 35.689 latitude and 23.740 longitude. The mean power production obtained for the said location is represented in Figure 4. Most areas of Greece are characterized by summers with high irradiation and winters with low irradiation, as can be seen in the figure above. For the selected location, the highest value obtained was 246.52 kWh in July and the lowest was 69.48 kWh in December. This gives an average value of 156.66 kWh/year.

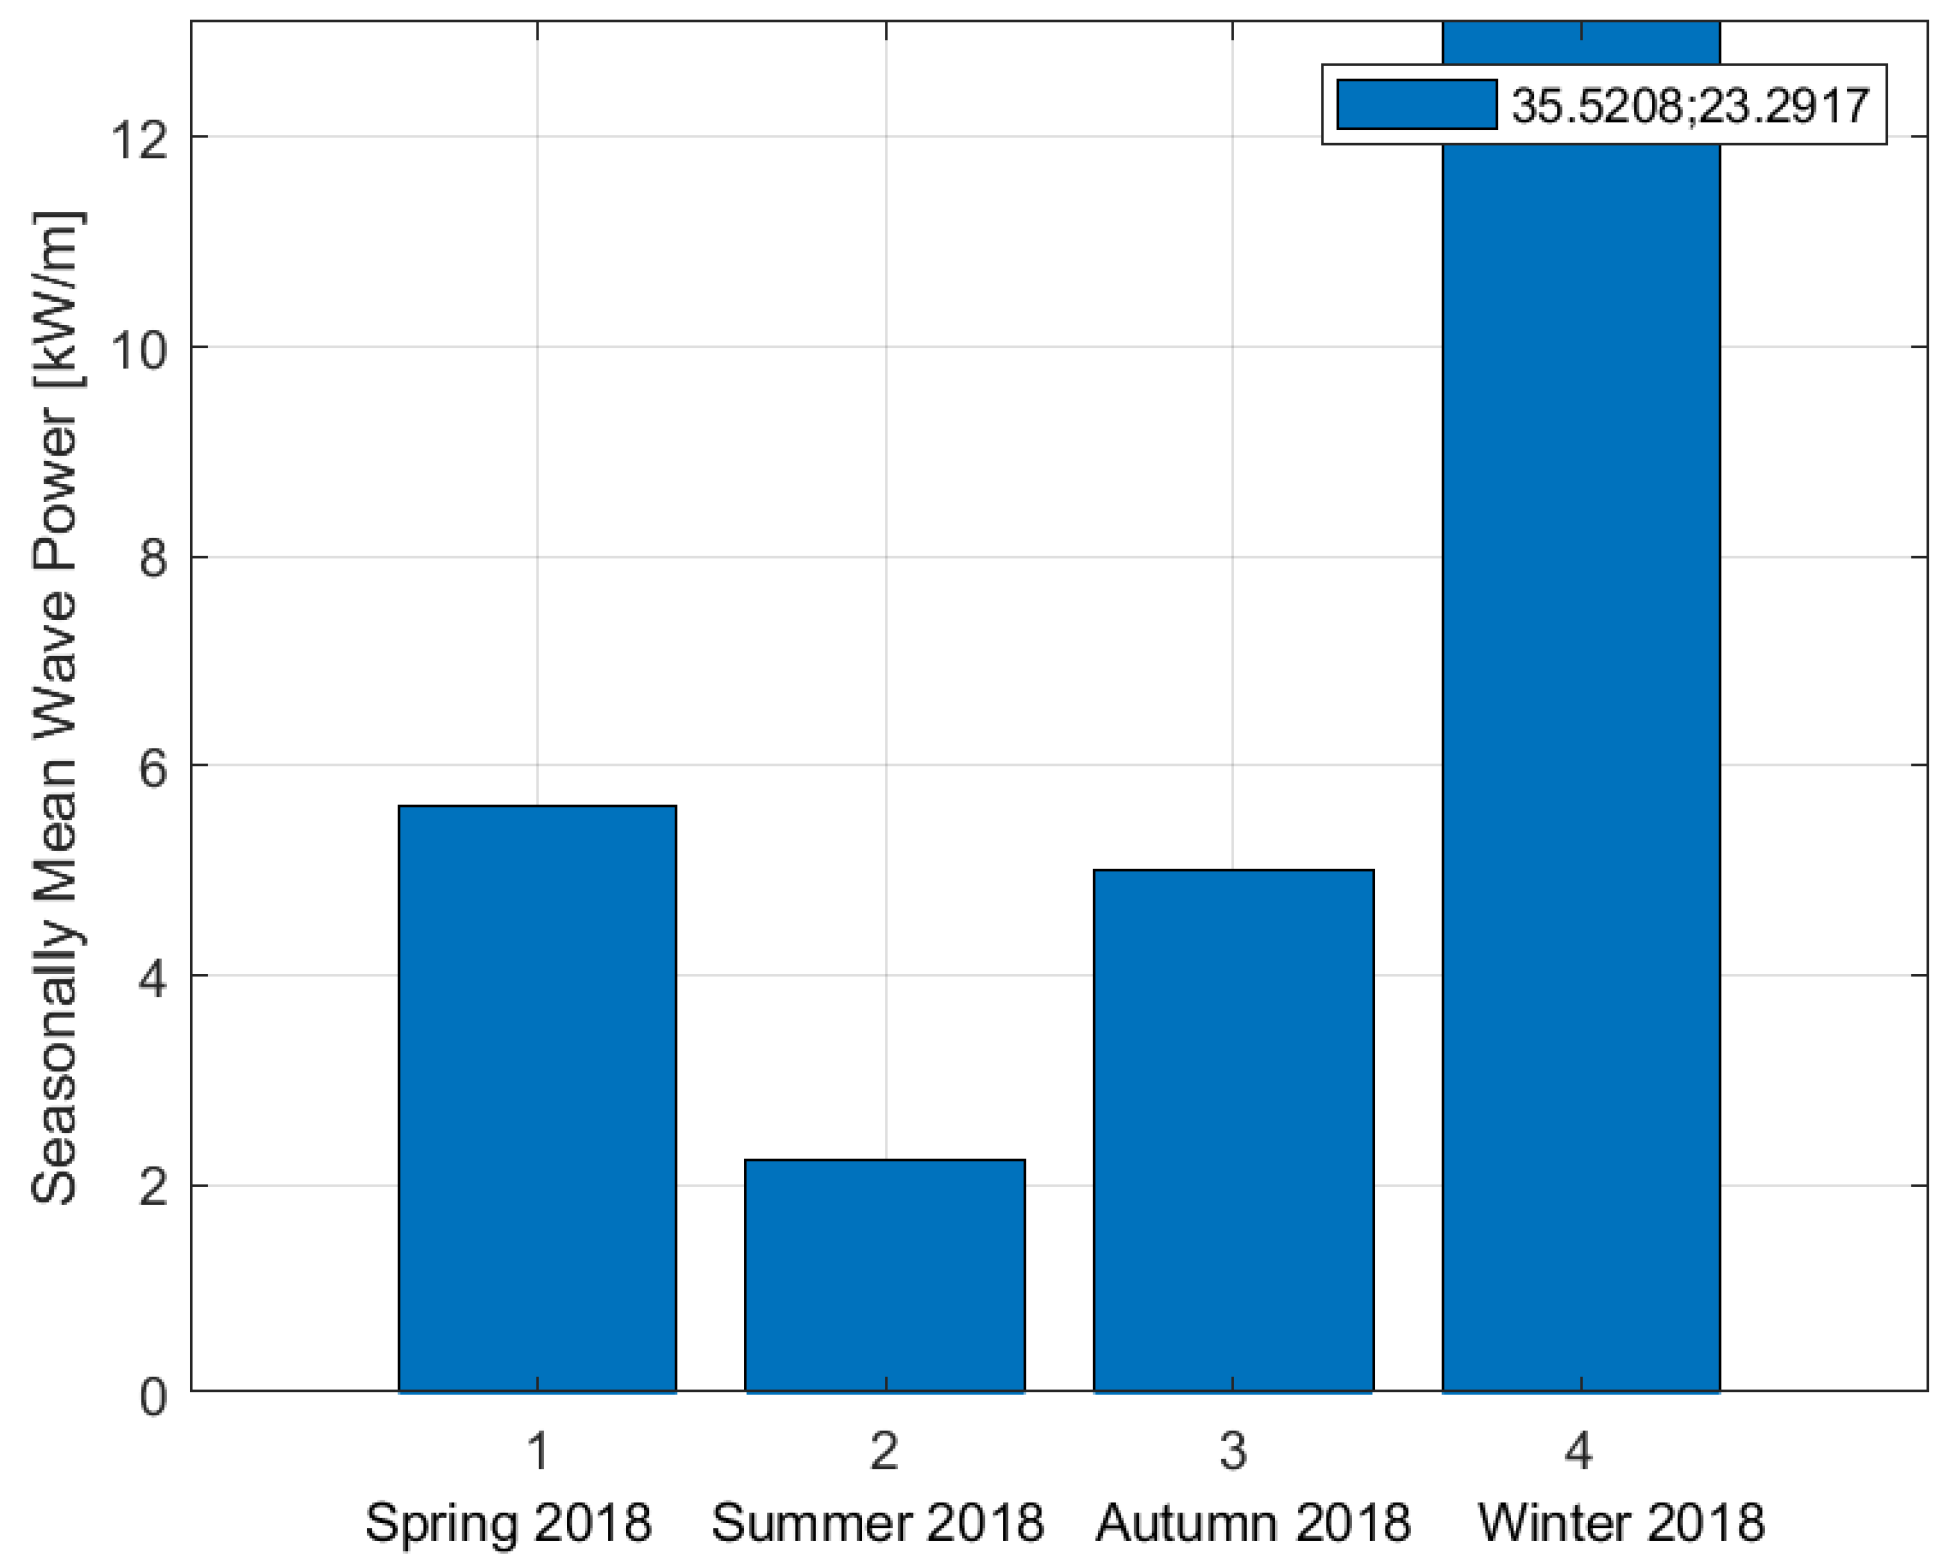
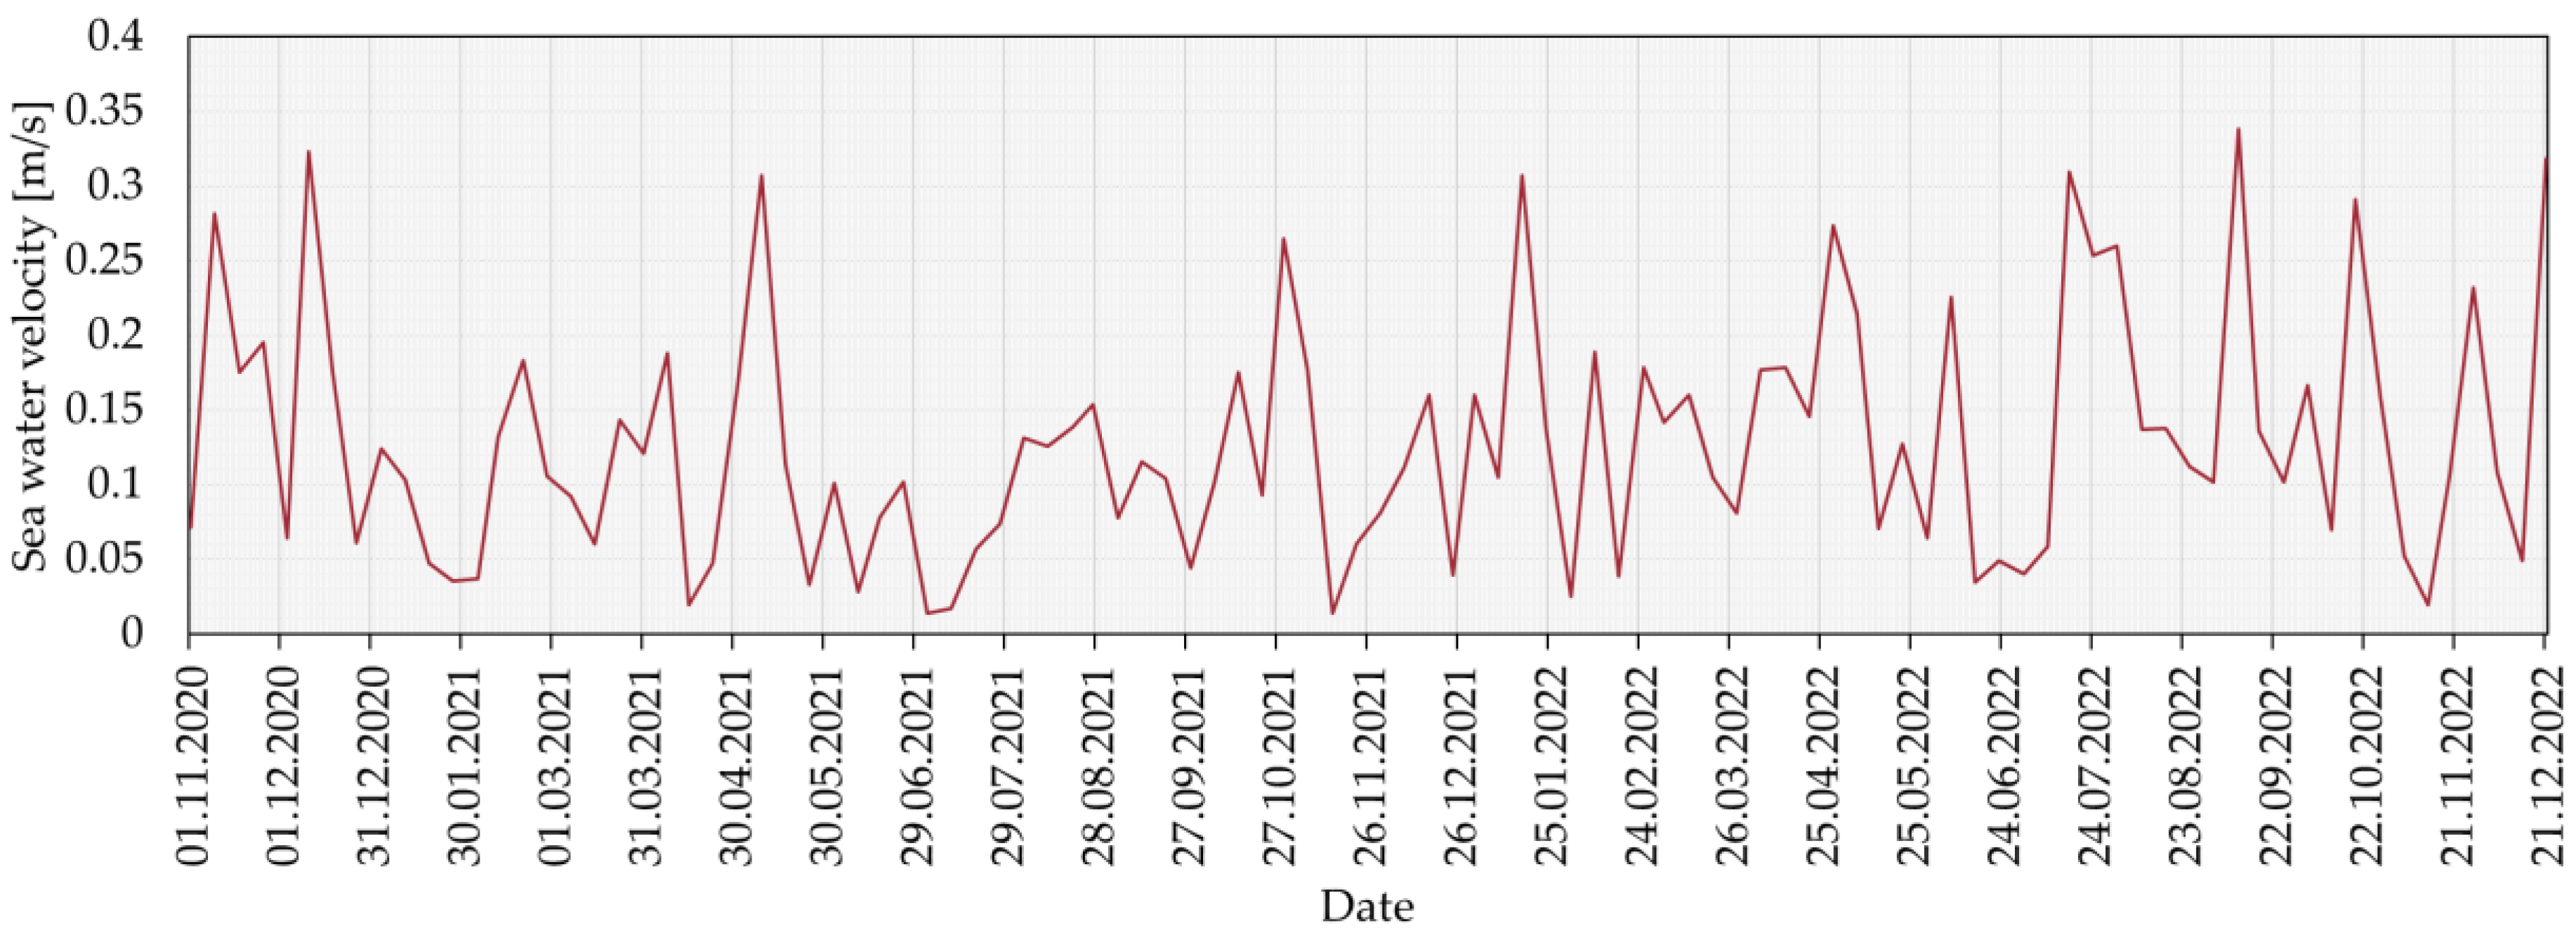
2.3. Wave Energy Assessment

In comparison to wind and solar energy resources, wave energy is scarcely practiced, and its development is newer. At the same time, a large energy potential from sea waves of around 29,500 TWh in annual global production is estimated [18]. Wave energy potentials around Greece have been evaluated in previous works [19,20,21,22,23], showing that the potential of sea waves as RES is considerable despite the novelty of wave energy converters. Figure 5a,b show the distribution of sea surface wave significant heights on two winter dates, 30 November 2021 and 30 November 2022.
Significant wave height Hm0 of wave and the energy wave period T m 1 , 0 is used to estimate the average power potential ( P wave ), as described in Equation (1), where ρ is the water density (i.e., 1000 kg/m3) and g is the gravitational acceleration (i.e., 9.81 m/s2). In this conceptual study, the energy assessment of waves uses the Mediterranean Sea waves reanalysis data [24]. Spectral significant wave height, mean wave direction and spectral moments wave period are taken for the three potential regions (east, west and central south regions) for the year 2020. Significant wave height is averaged over an area for each region, selected as shown in Table 2 and Figure 6a–c. For synchronization of the three RES, the wave energy potential around Crete is also assessed by its monthly power potential. Figure 7a–c show, respectively, the monthly mean wave power in kW/m of 2018 for the west, central south and east regions, where west region in the respective year has highest power potential compared to the other regions. Figure 8 shows the seasonal trend of the west region. The highest potential throughout the year is expected in the winter season, considering higher sea wave height in winter months. This indicates the contribution and storage opportunity from sea wave energy can be allocated in the colder months. Highest monthly mean wave power is estimated at around 16.83 kW/m, which agrees with most assessments by previous studies. Lavidas and Venugopal [20] estimated around 5–6.5 kW/m of wave energy flux in the central lower region of the Aegean sea, and 8 kW/m energy flux of the south and east of Crete.
P wave = ρ g 2 π · 64 H m 0 2 · T m 1 , 0

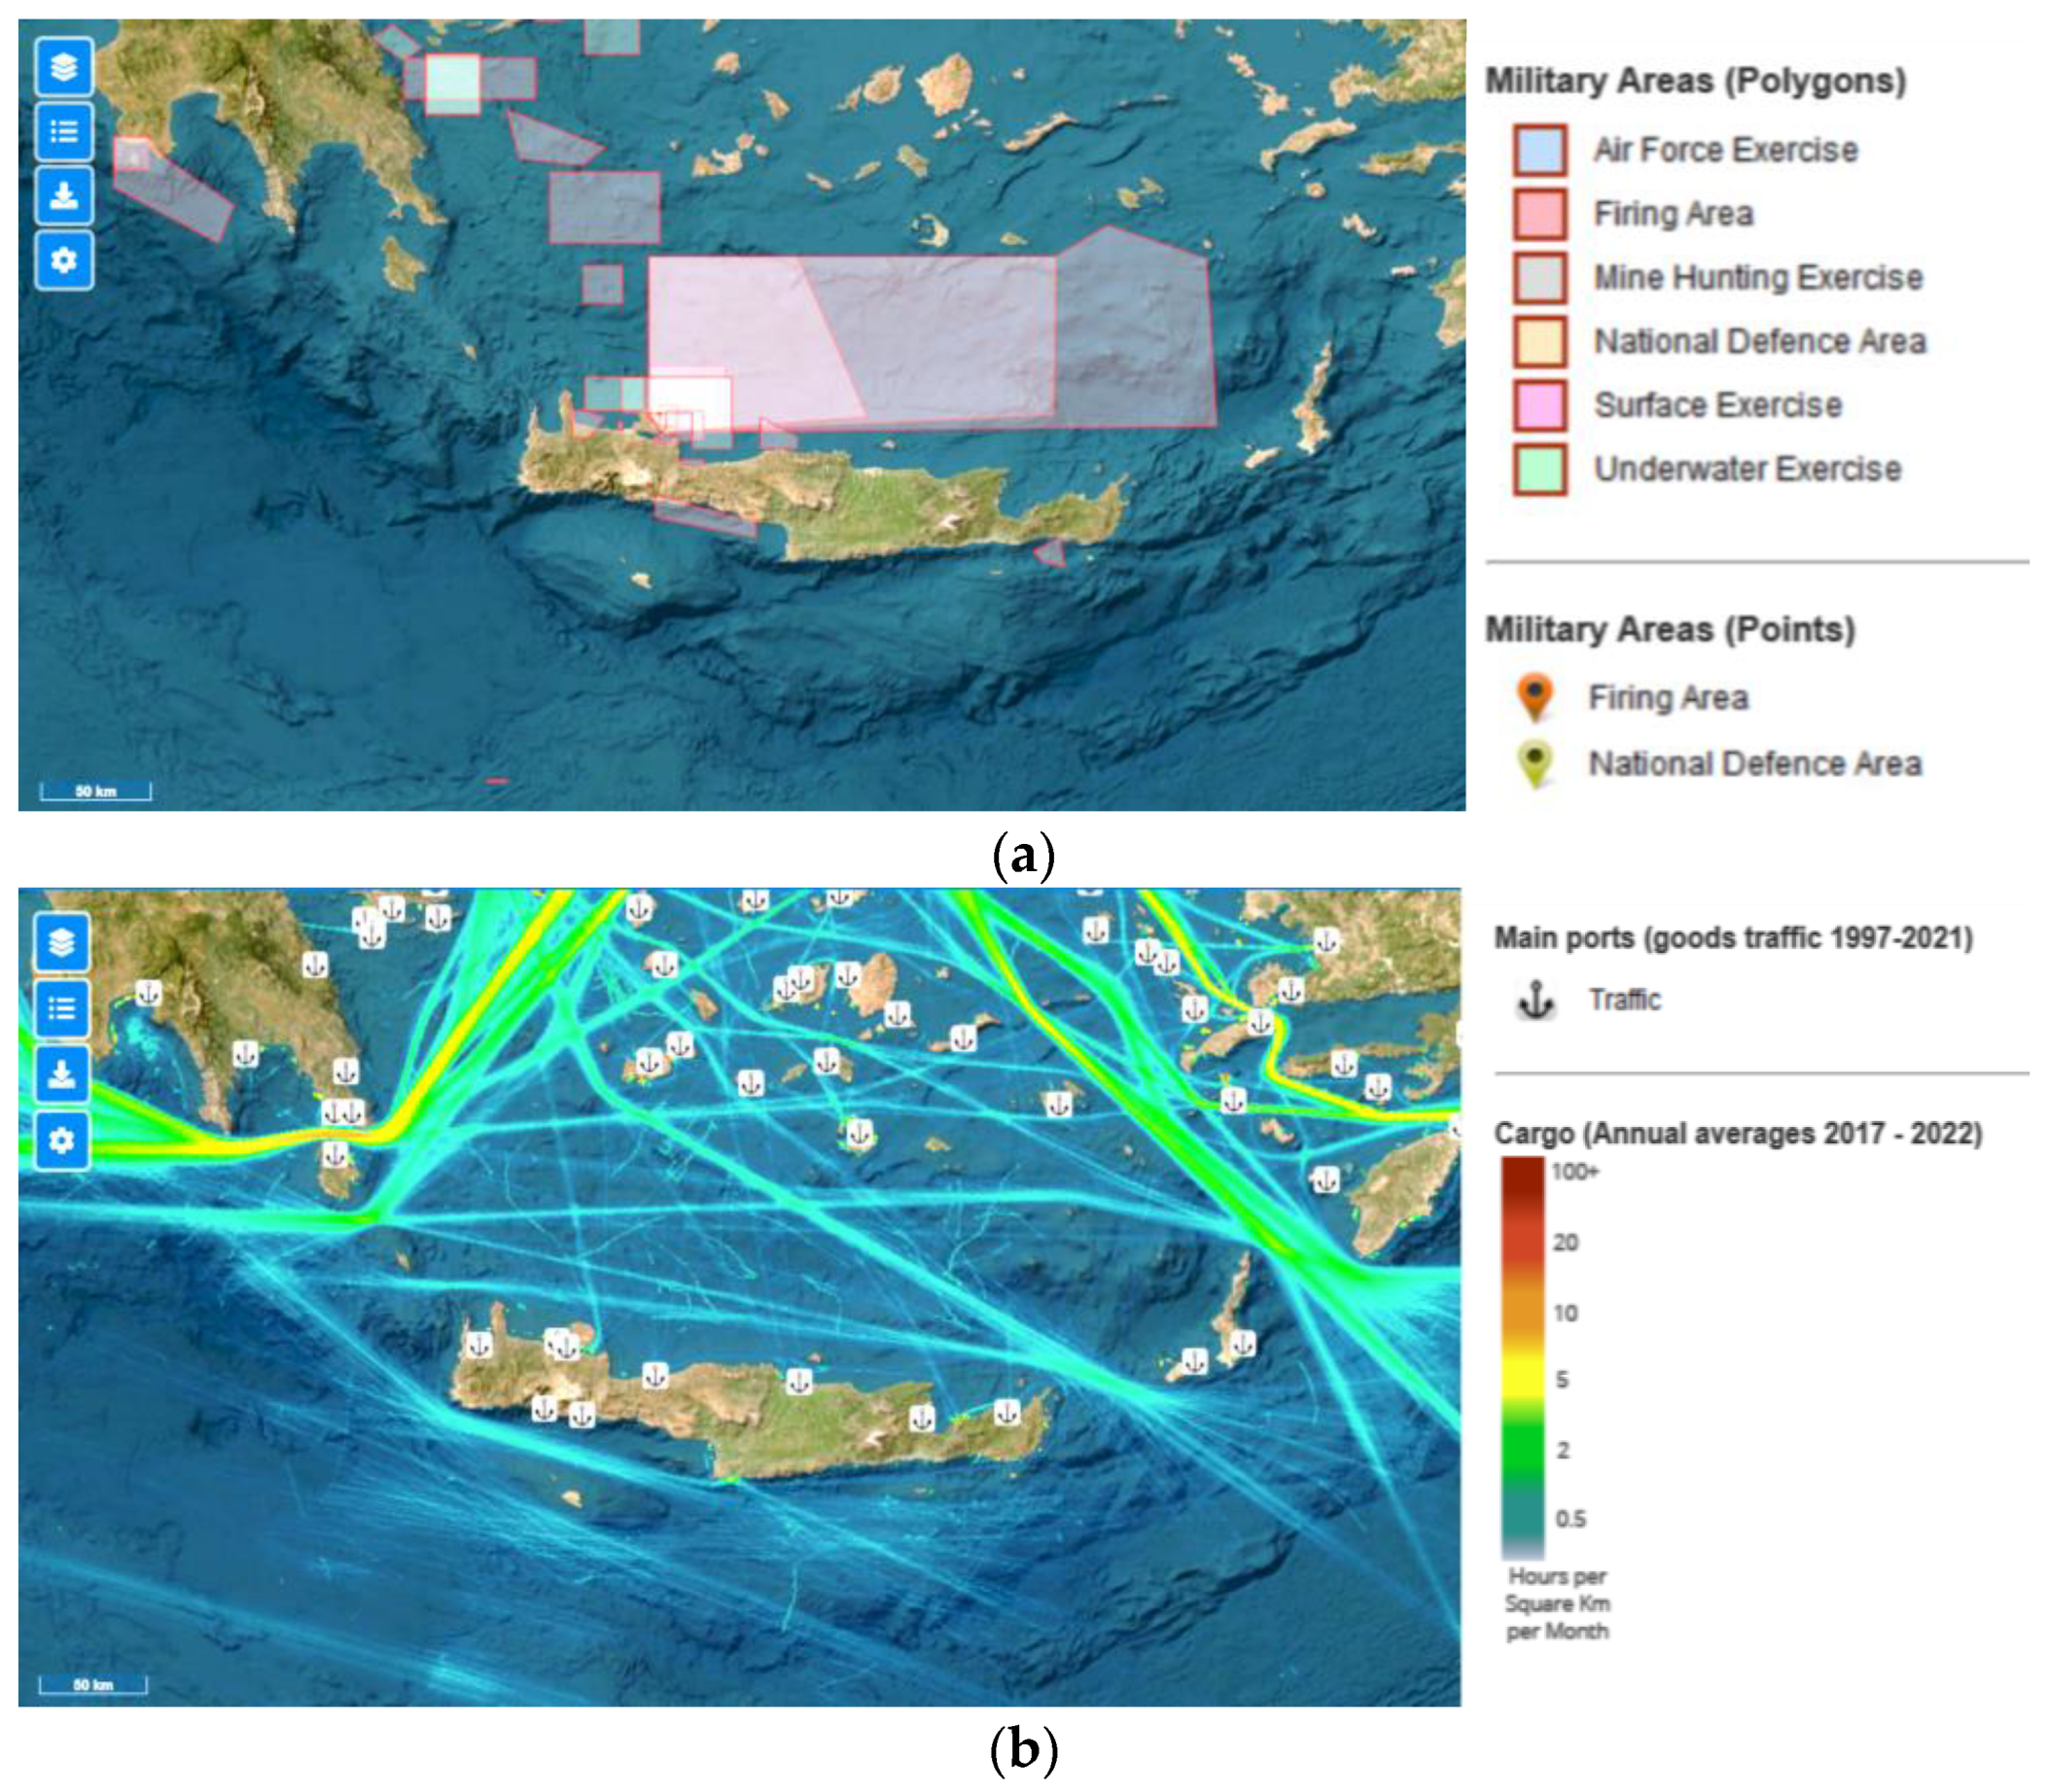
3. Potential Location and Considerations for Energy Islands

The consideration of choosing the location in potential regions (east, west and central south regions) of Crete is then compared with the exclusion criteria. Based on the Greek Specific Framework for the Spatial Planning and Sustainable Development for Renewable Energy Sources (SFSPSD-RES) [25] and previous studies [26,27] the following exclusion criteria were chosen: military exercise areas, areas with high shipping traffic density, main shipping routes and manoeuvring areas of ports (5 km buffer zone), areas close to telecommunication cables and areas belonging to the Natura2000 network. Military exercise areas are considered unsuitable for the FMEI site since they are used for training purposes or as firing fields. In the case of Crete, it is very important to avoid areas with high shipping traffic density and manoeuvring areas of ports which have a large role in the development of the local economy through trade and tourism. To ensure undisturbed shipping movement, a distance of 5 km from the shipping routes was selected in accordance with [28]. Areas close to telecommunication cables were excluded from the analysis in order to avoid possible damage of cables during the installation of FMEI. The Natura2000 network was used to identify protected areas with recognized ecological value in the Crete marine environment, where the deployment of FMEI is not feasible. A 2 km buffer zone from marine protected areas is considered, according to [29]. Figure 9 shows the unsuitable marine areas for FMEI.
Furthermore, sea depth imposes significant spatial constraints for the FMEI siting, as it affects the selection of the FMEI support structure and contributes to investment costs [34]. The sea depth was used to limit the area of interest and to evaluate the site. Fixed bottom structures have a limited range of sea depths while floating structures can be used in larger sea depths. The lower sea depth means lower construction and maintenance costs [35]. The bathymetry map around Crete was used to identify the suitable location for an FMEI (Figure 10). As can be seen, the sea depth around Crete can reach more than 1000 m. Considering the sea depth around Crete, a floating FMEI is a mandatory choice. In the analysis, the areas with a sea depth limit of 500 m are considered preferable, based on [25].
The southern parts of the Cretan coast were ranked as the lowest priority, as there is no existing or future interconnection, although these regions have high solar and wind energy potential. In addition, the south and east parts of the Cretan coast are not suitable regions for FMEI due to political tensions with Libya and Turkey over maritime border demarcation. The marine area north of Crete was excluded due to the military firing ranges in this region and the intense coastal activities (high shipping density and proximity to airports and ports) although this region has a shallower seabed and a good connection to the intercontinental and Cretan electricity grid, as well as future EuroAsia and EuroAfrica interconnections [37,38].
Considering the energy potential and the exclusion criteria, the offshore area on the west coast of Crete is the most suitable location for an FMEI. The exact location of the FMEI is then determined considering the sea depth, the distance from ports and the minimum visibility range. The distance from ports was included in the analysis in order to favour locations that are easier to access. The large distances between the EI and the shore ensure a minimum visibility range but at the same time significantly increase the installation and maintenance cost [39]. The upper limit for the distance from a port is set at 100 km. Therefore, to avoid visual and acoustic disturbances and to ensure the social acceptance of EI, an optimal distance range of 15–25 km was selected, based on [25].
Through the comparison of areas with high energy potential and exclusion areas, interconnection of the power grid, distance from the coast of Crete and borders of national territorial waters, a location (CL) within 35.61 latitude, 23.36 longitude was selected (Figure 11). The CL has a sea depth of approximately 250 m occupying 5000 m in length. This location is situated in the north-west of the Crete offshore area close to the largest part of the population in the Crete and close to the port of Kissamos, but at the same time at a sufficient distance from the coast to avoid visual impact. It is important to mention that the CL is located close to the local grids of interconnection with Peloponnese. The EI will collect high-voltage alternating current power from offshore renewables where short additional branching interconnection cable can be supplemented to end at Kissamos Bay, which is the same end point of the interconnection with Peloponnese. Thus, CL satisfies technical/economic factors while ensuring socio-political acceptance of the EI.
An uninhabited islet, Pontikonisi, exists in between the CL and the Balos Beach, which can function as a hiding agent for the chosen location to minimize the visibility of the FMEI. Assuming a square element of the location, up to 25 km2 area can be potentially utilized for the mooring of the FMEI. Assessment of the monthly wind is repeated for the CL. For waves, the energy assessment is repeated for the nearby location of 35.80 latitude, 24.00 longitude, where a solar energy assessment is repeated for the irradiation on the nearest coast to the CL. The energy potential can then be calculated in relation to the CL. The proposed methodology could be applied to other marine areas to support the site selection process of future EI projects worldwide.

4. Conceptual Design of the Energy Island

4.1. Floating Wind Turbine

The main factors considered in the design are the size and diameter of the wind turbine, the wind turbine series, and the distance between the wind turbines. Two commercial offshore wind turbine (OWT) models from Siemens Gamesa Renewable Energy were assessed as a case study, namely the SG 8-167 DD and the SG 14-222 DD. The wind turbines have a rated power of 8 MW and 14 MW, respectively. It is anticipated that more development of OWT models with higher nominal power will be available on the market by the time the proposed modular energy islands are constructed. Given this, the proposal to use the more powerful OWT of the SG 14-222 DD turbine is likely to make a more effective contribution to energy substitution.
Wind turbines produce a wake region immediately downstream which could lower the power production in a neighbouring turbine [41]. Several studied have reported an optimal spacing of 10-15D between turbines for minimal aerodynamic losses [42,43,44,45], where D is the rotor diameter of the turbine. For the proposed energy island, a spacing of 10D is adopted. Assuming the diameter of 222 m for the SG 14-222 DD turbine, the optimal spacing would be around 2220 m.
To support the massive OWT, a spar-buoy-type floating system supported by multiline catenary mooring systems is proposed. The spar buoy consists of a relatively deep cylindrical base with a heavier lower part offering more stability than other floating systems. The use of multiline anchors can be facilitated by thoughtful design of the wind farm layout. Mooring line tension loads were calculated to be over 1700 kN for a spar buoy floating platform supporting a 5 MW OWT [46]. The heavy mooring loads expected from the mooring system for the 14 MW OWT can be handled by suction-caisson-type subsea anchors. This type of anchor can also be used in multiline mooring systems. In this way, the same anchor can be connected to mooring lines from wind turbines, floating PV structures and wave generators. The geotechnical design of a suction anchor requires site-specific soil properties and is outside the scope of this article.

4.2. Floating Photovoltaic Structure

A commercial solar panel Sunmodule Plus SW 290-300 is considered to calculate the designated area for solar power production. For each month, the estimated power production is calculated for one panel’s power production, considering the monthly mean solar irradiation and the solar panel peak power output. Then the value is multiplied for the number of panels that can be placed on the estimated available floating area. As expected, the contribution from wind energy is higher in the winter and should be prioritized over solar energy production. In the summer months, the solar energy production reaches its peak, which exceeds the monthly power potential from one OWT. With the modularity of PV panels, the additional installation of panels can be performed if needed in the summer months, which is strongly suggested.
The biggest challenge in the structural design of a floating PV system is the extreme wind and wave loads, and fatigue-related microcracking and dealignment. The floating PV system that we propose consists of three components, namely the floats, PV modules, supporting structure, mooring system and electrical systems. Considering the various types of floating structures [47], cubic modular floats can be used that are assembled to create a large floating platform onto which the PV cells and electrical components can be installed independently. One example of such a design is from NRG Island [48]. This technology has been tested in the Dutch North Sea and has survived storms with wave heights of up to 10 m [47].
The mooring system proposed for the floating PV structure consists of catenary mooring anchored using suction anchors. Although suction anchors can be difficult to install at depths of over 250 m, considering the economy in using the same technology for all components of the FMEI, it is proposed. A multiline mooring system with a triangular layout with each anchor connected to three mooring lines was found to be optimal for the proposed design.

4.3. Wave Energy Converter

The power production from wave energy was estimated based on the chosen wave energy converter, WaveDragon (for more information the reader is referred to [49]). WaveDragon was chosen considering its application can be intended for deep sea and moored as a floating device. It must be noted that the choice of WaveDragon as a case study is conceptual and the actual development and availability of the converters are out of this paper’s scope. Lavidas et al. extensively estimates expected annual production for difference wave energy converters including WaveDragon, and the estimation includes Crete as the location [20]. In [20], WaveDragon provides the largest energy production compared to other wave energy converters.
In this paper, the power estimation for wave energy is per unit wave crest length, in kW/m. The power matrix of WaveDragon according to [50,51,52] was used to estimate the power production given the monthly mean significant wave height (Hm0) and wave period (Tm−1,0). Accordingly, mean power production was estimated. The power production is assumed to be generated from one device. In fact, Ref. [20] provides the power matrix specifically for WaveDragon based on Crete as the location for case studies; however, the matrix graphs are not quantified. Slight difference in power matrices when applied for different region should be noted. With respect to the design of WaveDragon, the device is formed as a slack-moored converter that consists of two wave reflectors which direct the waves towards a ramp. According to the designer [49], the dimensions of WaveDragon can be adjusted to the wave climate of the installation site. Assuming the 48 kW/m prototype design of WaveDragon having the largest width dimension of 390 m [49], the number of devices is then determined by considering the available space in the FMEI peripheral. The available space of the FMEI for wave energy converters depends on the distance between the wind turbines. It is intended that the wave energy converters are placed in the periphery of wind turbines placed in circle, acting as a wave breaker. It must be highlighted that the selected wave energy converter is taken as case study only for a realistic estimation of power production based the number of devices. The construction and mounting of the device should be modified based on the concept of the FMEI.

4.4. Energy Production

The conception of the FMEI energy capacity is based on the aim to replace the three currently operating thermal power plants (TPPs) which cover 2,376,490 MWh of the annual electrical consumption. The three TPPs produce roughly 800 MW total nominal power [10]. Referred to the same study [10], the annual peak power demand is 623 MW. The ratio between the total nominal power from the three TPPs and the annual peak power demand is γ = 1.28. The γ value is set to be the peak factor to calculate the targeted energy substitution from the FMEI, as follows:
FMEI   energy   capacity = γ   · C 3 TPP ,
where C3TPP is the contribution of 3TPPs for the annual electrical consumption. The γ is the ratio between the total nominal power from the three TPPs to the annual peak power demand.
This gives the value of 3,041,907.2 MWh of targeted energy substitution which the FMEI has to offer. In the conception of FMEI, the design is focused on information about the high energy resources available in the chosen location, not only from wind energy but also from solar radiation. The novelty of wave power has to be taken into account. The initial estimation of resource utilization is 45% wind energy, 45% solar energy, and 10% wave energy. Iteration in conception is performed between choosing the number of OWTs and area of PV panels based on the energy production ratio. For example, with an initial estimation of 45% energy production for the FMEI from wind energy, one would obtain the initial number of needed wind turbines considering the available wind speed information. This gives information on how the FMEI shape and form should be designed.
Figure 12a–c show the estimation of monthly power production potentials for the three RESs. The estimated power production from wind was obtained by taking the SG-14 222 DD model into consideration and the monthly mean wind speed from January 2018 to December 2018 for elevation z = 150 m. Typical values of horizontal axis wind turbine efficiency are considered. Then, the clean wind power is estimated by considering the power coefficient and typical losses (e.g., wake, mechanical, electrical and transmission loss). The capacity factor for the wind and solar energy production is assumed, respectively, to be 40% and 20% [53], whereas a 16% capacity factor of wave energy production is assumed, that is taken from the capacity factor of the device [20]. The value of the capacity factor for wave energy production might be higher, around 20% taking referring to an analysis of conceptual wave power plant in Ucluelet using Pelamis Wave Converter [54].
The evaluation of the solar energy potential for each month showed that the highest energy potential is available in the summer months and the annual energy potential is 488.38 MW/year for an estimated area of 0.265 km2 with 138,000 panels. With a capacity factor of 20%, the annual energy is around 171,129 MWh, which takes into account the monthly variations between the winter and summer months. This means a ratio of around 44.8% total FMEI production is contributed from solar energy.
The contribution of wind energy is proposed after comparing between the goal or wind energy contribution ratio and the number of wind turbines needed. It is found through the conception process that nine wind turbines are sufficient to obtain around 46.2% of the total FMEI production, contributed by wind energy. The number of wind turbines is also determined considering the limited area and distance between turbines. Considering the chosen OWT series and type, nine wind turbines have an estimated installed annual production of 176,759 MWh, already considering a capacity factor of 40%. The evaluation of the annual energy production of the wave energy is available in the next section, which covers 9% of the total FMEI production.

4.5. Design of the Energy Island

The design philosophy of the FMEI was primarily aimed at optimizing the energy harvesting installation cost and seabed construction. The first consideration in the layout of the FMEI was the placement of the wind turbines and the PV system, an octagonal FMEI consisting of nine floating OWTs at the outer periphery, and in the centre of FMEI. The centre of FMEI has an octagonal floating deck, which houses the PV, transmission, and storage system. The octagonal platform has the advantage of providing sufficient distance between the eight wind turbines and the last wind turbine can be placed in the centre. The definite corners of the octagon shape can be also used as a marking for mooring lines. The octagon platform shall be oriented considering the primary wind direction at the location. This design enables the use of multiline mooring which reduces the cost for deep sea anchor installation. This multiline concept also reduces the cost of offshore geotechnical investigations [55]. Figure 13 shows the proposed layout of the energy island and the location of seafloor anchors. Figure 14 shows the illustration of the proposed energy island. The size of octagonal platform in the centre needs to be able to house 138,000 PV panels (0.265 km2) and the buffer area for the centre wind turbine. Taking the example of a floating platform from ITI Energy Barge with platform sides of 40 m [56], total available cleared area for the centre platform has to be as large as 0.0016 km2. A centre octagonal platform with 260 m sides would have a central area of 0.326 km2, providing sufficient remaining area for operational purposes, e.g., maintenance path and walkway.
The pontoon-supported PV panel blocks, being modular in design, can be detached and transported to a port or staging base. For example, in the summer months, to maximize the contribution of solar energy production, the modular blocks can be added, to harness the additional irradiant energy. The solar panel should be placed at a higher elevation than the sea level to avoid the wave height and the installation of a wave breaker at the outer periphery is expected to reduce the wave height. A customized floater as the pontoon is suggested. For example, the design of elevated framed PV module is raised with the PV feet. The PV feet are attached to the main floater for each panel. Each main floater is connected to support floaters for a walkway. Such design was used by [57], but with lower PV feet. Higher, customized PV feet with stiffer columns are strongly suggested for the needs of open-sea floating PVs. The removal and installation process of the PV floaters can be facilitated by using a mechanical connection for each of the floaters, such as a screw connection.
The design should take into account the danger posed by the height of the waves and the speed of the sea water. For coordinates of the CL, Figure 15a,b show the sea water velocity (SWV) and its vector obtained from [24]. To observe the trend of sea water velocity and its magnitude, the period from January 2021 to November 2022 is chosen and the daily mean horizontal SWV is plotted in Figure 16. The maximum mean SWV at sea level does not exceed 0.35 m/s for the CL. Compared to the observed space in the surroundings, where speeds higher than 0.6 m/s are detected, the location of CL is satisfactory and should present a lesser load on the anchor lines.
An idea of focusing the wave energy converter not only for energy production, but also as a wave breaker (breakwaters) is put forward. The wave energy converter, which acts as a breakwater, can be placed in the outer edge of the octagonal layout of the modular energy island and in the vicinity of the central pontoons (see blue lines in Figure 13). With roughly 2000 m of outer perimeter of each octagon side, in total, a 16,000 m length is available for wave energy converter placement. Considering the largest width of WaveDragon (B = 390 m), forty-one devices can be installed on the outer edge and eight devices can be installed in the vicinity to the central pontoon. Considering the capacity factor, 34,039.7 MWh is estimated to be annually produced from the wave energy in one island. Combining the contribution of 3 RES, one FMEI can produce around 381,928 MWh annually. Eight FMEIs are proposed to be placed in the chosen location, producing 3,055,422 MWh annually. The main objective of the power transmission is to transfer the energy production directly to the island of Crete through interconnecting cables to the port of Kissamos Bay. An energy surplus is expected based on the energy production estimate described in Section 4.4. The surplus energy will be stored using the Power-to-X concept, such as green fuel transport by ships (e.g., conversion to green hydrogen).
In addition to the elevated floaters, barriers and geometric stabilisers can be installed around the perimeter of the floating PV area to avoid potential damage from wave heights during extreme weather conditions. Wind load analyses on the PV panels are required in the further design phase, taking into account the extreme/basic mean wind speed for the chosen site.
Some potential environmental issues associated with the FMEI relate to the marine and underwater environment. For example, the anchoring of the mooring lines must be carefully designed. A technical innovation of the mooring system must be introduced to ensure that there is little movement in the lower part of the mooring lines, thus avoiding disturbance to the seabed. Large floating areas for the photovoltaic panels can be a problem for underwater solar irradiation. However, considering the depth of the seawater around 250 m or more of the chosen site, the seabed is in the dysphotic zone, where the light is already insufficient to sustain photosynthesis at this depth. Therefore, the impact of the floating PVs on the underwater plants is expected to be less significant.
In this paper, the rough lifetime prediction refers to the lifetime of the offshore wind turbine. The lifetime of the floaters is not considered as a representative lifetime, as damaged floaters for photovoltaic (PV) panels are replaced and considered as maintenance. The same assumption is made for the PV panels. The lifetime of the wave energy converter is only considered as additional information, as the contribution of wave energy to the total energy production is small. The lifetime of a modern offshore wind turbine is assumed to be between 20 and 25 years, which is used as a first rule of thumb for the lifetime of the FMEI. However, it should be noted that repowering and maintenance can be carried out during the FMEI life, which can increase the number of years of operation. Repowering and life extension of offshore wind farms should be further investigated [58] and adapted for the OWTs installed in the FMEI. Another approach can be introduced by the regular maintenance of floating and mooring system, increasing the lifespan of supporting structure, to support more than one generation of offshore wind.
Further discussion should cover the cost–benefit analysis, potential challenges on legal, management and ownership issues of the FMEI and socio-economic impacts from different sectors. Optimizing the benefits over costs can be aided by comparing the cost of the interconnector cable and the cost of the power-to-x system for energy transfer. An initial levelized cost estimate for one full-scale FMEI lifetime is determined by summing the LCOE for one year of electricity production of the three RESs. Adapting the levelized cost of energy (LCOE) estimate of EUR 147/MWh for a floating photovoltaic plant in the sea [59], taking into account the estimated annual electricity production of 171,129 MWh for 138,000 panels in one FMEI, the estimated cost for a floating photovoltaic plant is 147 × 171,129 = EUR 25.15 million. It should be noted that the value quoted for a floating PV system is based on a site with a shallower sea depth and closer to the shore. For wind energy, the LCOE of a floating offshore wind farm according to the analysis of [60] is used with nine offshore wind turbines (OWT). The authors of [60] estimated the LCOE for three different sites around the island of Pantelleria, varying in water depth and distance from the coast. Site C is chosen as the reference site for LCOE estimation, considering the similarity of the distance to the coast with the CL in this paper. The value of EUR 127/MWh is chosen based on the estimation of LCOE in [60], depending on the deployment of nine wind turbines. Difference in nominal power of wind turbine taken as reference should be considered but assumed as representative value. Considering the 176,759 annual production of wind energy for one FMEI, the cost of implementing wind energy is around 176,759 × 127 = EUR 22.44 million. For wave energy, the average LCOE in 2020 is estimated to be around USD 570 (around EUR 512) per MWh [61]. This gives about 34,039 × 512 = EUR 17.42 million for annual energy production from wave energy. In total, more than EUR 65 million are needed for one FMEI lifetime.
In order to increase the acceptance of the FMEI, the involvement of the government in the ownership of the FMEI can be proposed. The accurate analysis of the invisibility of the FMEI from the coast of Crete needs to be disseminated and presented to the local people, and solutions to maintain undisturbed tourism activities need to be addressed. In order to raise awareness of energy solutions for the further development of Crete’s island activities, the management of the FMEI’s power production can be focused on local activities and tourism. An end-user engagement survey can be conducted in the initial design phase by interviewing a significant number of households in the west coast of Crete. The survey can be used to assess the interest of local people in the following aspects: the relevance of the FMEI to community identity, and the financial and environmental potential of the FMEI, and the expected social impact of the FMEI. Examples of such surveys are carried out by [62] when analysing renewable energy utilization for self-sustainable island grids.

5. Conclusions

In this paper, a conceptual design of a Floating Modular Energy Island (FMEI) is formulated to increase the energy independence of Crete by focusing on renewable energy resources (RES). The three currently operating thermal power plants (TPPs) are taken as a benchmark for the FMEI design to be able to replace their production. The selection of the best location for the floating energy island is addressed by assessing the great potential of wind, solar radiation and waves as renewable energy resources, taking into account criteria related to human activities. A form and number of FMEIs are proposed after considering the energy production and target contribution ratio of each RES. The proposed strategy with eight FMEIs can replace the three TPPS with an annual production of 3,055,422 MWh. For each of the three RES, the energy production estimation was carried out in detail. In addition, initial suggestions for FMEI construction and tools, power transmission, and consideration of environmental and social impacts are presented. An estimate of the levelized cost of electricity (LCOE) for an FMEI is made taking into account the LCOE of each energy source from related studies. The paper suggests important aspects to focus on in the next design phase: intelligent energy management, storage and transmission, including the idea of power-to-x and integration with the interconnection cable to the Kissamos bay. Besides the concept of making FMEIs a substitute for meeting energy demand, including strategic storage management and the potential of an energy hub should also be considered as a future perspective.

Author Contributions

Conceptualization, methodology, I.K., B.B., D.K., I.S., R.V., H.H., P.A. and C.B.; formal analysis, software, data curation and investigation I.K., B.B., D.K., I.S. and R.V.; writing—original draft preparation, review and editing, I.K., B.B., D.K., I.S. and R.V.; writing—review and supervision, H.H., P.A. and C.B. All authors have read and agreed to the published version of the manuscript.

Funding

This research received no external funding.

Data Availability Statement

The data presented in this study are openly available in [13,17,24].

Acknowledgments

The authors would like to acknowledge COST Action 20109 MODENERLANDS because it gave them the opportunity to fruitfully collaborate, and encouraged their further cooperation. The authors are thankful to the lecturers and technical tools provided in COST Action MODENERLANDS Training School 1 that made the evaluation of this work possible.

Conflicts of Interest

The authors declare no conflict of interest.

References

  1. European Commission, Directorate-General for Energy. An EU Strategy to Harness the Potential of Offshore Renewable Energy for a Climate Neutral Future; European Union: Brussels, Belgium, 2020. [Google Scholar]
  2. Keiner, D.; Salcedo-Puerto, O.; Immonen, E.; van Sark, W.G.; Nizam, Y.; Shadiya, F.; Duval, J.; Delahaye, T.; Gulagi, A.; Breyer, C. Powering an island energy system by offshore floating technologies towards 100% renewables: A case for the Maldives. Appl. Energy 2022, 308, 118360. [Google Scholar]
  3. Fujikubo, M.; Suzuki, H. Mega-Float. In Large Floating Structures. Ocean Engineering & Oceanography; Springer: Singapore, 2015; Volume 3, pp. 197–219. [Google Scholar]
  4. Nakamura, K.; Mueller, G. Review of the performance of the artificial floating island as a restoration tool for aquatic environments. In Proceedings of the World Environmental and Water Resources Congress 2008: Ahupua’A, Honolulu, HI, USA, 12–16 May 2008; pp. 1–10. [Google Scholar]
  5. Wang, C.; Tay, Z. Very large floating structures: Applications, research and development. Procedia Eng. 2011, 14, 62–72. [Google Scholar]
  6. Yeh, N.; Yeh, P.; Chang, Y.-H. Artificial floating islands for environmental improvement. Renew. Sustain. Energy Rev. 2015, 47, 616–622. [Google Scholar] [CrossRef]
  7. Drummen, I.; Olbert, G. Conceptual design of a modular floating multi-purpose island. Front. Mar. Sci. 2021, 8, 615222. [Google Scholar] [CrossRef]
  8. Frankel, G.E. Prefabricated and Relocatable Artificial Island Technology. In Macro-Engineering; Davidson, F.P., Frankel, E.G., Meador, C.L., Eds.; Woodhead Publishing: Cambridge, UK, 1997; pp. 155–173. [Google Scholar]
  9. Danish Energy Agency. Energy Islands in the North Sea. Available online: https://ens.dk/en/our-responsibilities/energy-islands/energy-island-north-sea (accessed on 25 July 2023).
  10. Dimitris, K.; Ioannis, A.; Irini, D.; Dimitris, C. Turning Crete into an energy independent island. In Proceedings of the 4th International Hybrid Power Systems Workshop, Crete, Greece, 22–23 May 2019. [Google Scholar]
  11. United Nations. Sustainable Development Goals–United Nations. Available online: http://www.un.org/sustainabledevelopment/sustainable-development-goals/ (accessed on 27 October 2022).
  12. European Cooperation in Science and Technology (COST). MODENERLANDS. Available online: https://modenerlands.eu/about/ (accessed on 28 October 2022).
  13. New European Wind Atlas (NEWA) Is Licensed under CC BY 4.0. Available online: https://map.neweuropeanwindatlas.eu/ (accessed on 28 September 2022).
  14. New European Wind Atlas (NEWA). About. Available online: https://map.neweuropeanwindatlas.eu/about (accessed on 7 January 2023).
  15. Witha, B.; Hahmann, A.; Sile, T.; Dörenkämper, M.; Ezber, Y.; García-Bustamante, E.; González-Rouco, J.F.; Leroy, G.; Navarro, J. WRF Model Sensitivity Studies and Specifications for the NEWA Mesoscale Wind Atlas Production Runs; New European Wind Atlas Report Zenodo. 2019. Available online: https://zenodo.org/record/2682604 (accessed on 7 January 2023).
  16. Bailey, B.H.; Scott, L. Wind Resource Assessment Handbook; AWS Scientific, Inc.: Albany, NY, USA, 1997. [Google Scholar]
  17. Global Solar Atlas. Solargis. Licensed under CC BY 4.0. Available online: https://globalsolaratlas.info/map?c=37.09024,23.307495,7&a=20.147043,34.709105,20.147043,39.398848,26.661333,39.398848,26.661333,34.709105,20.147043,34.709105&s=35.717974,23.584407&m=site (accessed on 17 July 2023).
  18. Seyboth, K.; Matschoss, P.; Kadner, S.; Zwickel, T.; Eickemeier, P.; Hansen, G.; Schlömer, S.; Stechow, C.V. Renewable Energy Sources and Climate Change Mitigation. Special Report of the Intergovernmental Panel on Climate Change; Cambridge University Press: Cambridge, UK, 2012. [Google Scholar]
  19. Ayat, B. Wave Power Atlas of Eastern Mediterranean and Aegean Seas. Energy 2013, 54, 251–262. [Google Scholar] [CrossRef]
  20. Lavidas, G.; Venugopal, V. A 35 Year High-Resolution Wave Atlas for Nearshore Energy Production and Economics at the Aegean Sea. Renew. Energy 2017, 103, 401–417. [Google Scholar] [CrossRef] [Green Version]
  21. Jadidoleslam, N.; Özger, M.; Ağiralioğlu, N. Wave Power Potential Assessment of Aegean Sea with an Integrated 15-Year Data. Renew. Energy 2016, 86, 1045–1059. [Google Scholar] [CrossRef]
  22. Zacharioudaki, A.; Korres, G.; Perivoliotis, L. Wave Climate of the Hellenic Seas Obtained from a Wave Hindcast for the Period 1960–2001. Ocean. Dyn. 2015, 65, 795–816. [Google Scholar] [CrossRef]
  23. Foteinis, S.; Tsoutsos, T.; Synolakis, C. Numerical Modelling for Coastal Structures Design and Planning. A Case Study of the Venetian Harbour of Chania, Greece. Int. J. Geoengin. Case Hist. 2018, 4, 232–241. [Google Scholar]
  24. Mediterranean Sea Waves Reanalysis, Copernicus Marine Service, Copernicus. Available online: https://data.marine.copernicus.eu/product/MEDSEA_MULTIYEAR_WAV_006_012/description?view=-&task=results&product_id=-&option=- (accessed on 17 July 2023).
  25. Ministry of Environment, Energy and Climate Change (MEECC). Specific Framework for Spatial Planning and Sustainable Development for Renewable Energy Sources. JMD 49828/2008, OGHE B’ 2464/3-12-08; MEECC: Athens, Greece, 2008. [Google Scholar]
  26. Lloret, J.; Turiel, A.; Sole, J.; Berdalet, E.; Sabates, A.; Olivares, A.; Gili, J.-M.; Vila-Subiros, J.; Sarda, R. Unravelling the ecological impacts of large-scale offshore wind farms in the Mediterranean Sea. Sci. Total Environ. 2022, 824, 153803. [Google Scholar] [CrossRef]
  27. Vasileiou, M.; Loukogeorgaki, E.; Vagiona, D.G. GIS-based multi-criteria decision analysis for site selection of hybrid offshore wind and wave energy systems in Greece. Renew. Sustain. Energy Rev. 2017, 73, 745–757. [Google Scholar] [CrossRef]
  28. Vagiona, D.G.; Kamilakis, M. Sustainable site selection for offshore wind farms in the South Aegean-Greece. Sustainability 2018, 10, 749. [Google Scholar] [CrossRef] [Green Version]
  29. Möller, B. Continuous spatial modelling to analyse planning and economic consequences of offshore wind energy. Energy Policy 2011, 39, 511–517. [Google Scholar] [CrossRef]
  30. Human Activities—Military Areas, EMODnet. Available online: https://emodnet.ec.europa.eu/geoviewer/?layers=12444:1:1,12443:1:1&basemap=esri-imagery&active=12444&bounds=20.387568850501644,34.15593868958256,28.276434013332725,37.756300040937425&filters= (accessed on 17 July 2023).
  31. Human Activities—Cargo, EMODnet. Available online: https://emodnet.ec.europa.eu/geoviewer/?layers=12963:1:1,12763:1:1,12717:1:1&basemap=esri-imagery&active=12963&bounds=20.604422241192978,33.855624450948575,28.38690765020506,37.40743565645723&filters= (accessed on 17 July 2023).
  32. Human Activities—Cables, EMODnet. Available online: https://emodnet.ec.europa.eu/geoviewer/?layers=12439:1:1,10180:1:1&basemap=esri-imagery&active=12439&bounds=20.604422241192978,33.855624450948575,28.38690765020506,37.40743565645723&filters= (accessed on 17 July 2023).
  33. Human Activities—Nature 2000 Sites, EMODnet. Available online: https://emodnet.ec.europa.eu/geoviewer/?layers=12517:1:1&basemap=esri-imagery&active=12517&bounds=20.604422241192978,33.855624450948575,28.38690765020506,37.40743565645723&filters= (accessed on 17 July 2023).
  34. Ng, C.; Ran, L. Offshore Wind Farms: Technologies, Design and Operation; Woodhead Publishing: Duxford, UK, 2016. [Google Scholar]
  35. Murphy, J.; Lynch, K.; Serri, L.; Airdoldi, D.; Lopes, M. Site Selection Analysis for Offshore Combined Resource Projects in Europe. In Report of the Off-Shore Renewable Energy Conversion Platforms—Coordination Action (ORECCA) Project. 2011. Available online: http://orecca.rse-web.it/doc_info/Site_Selection_Analysis_Report.pdf (accessed on 16 January 2023).
  36. Bathymetry, EMODnet. Available online: https://emodnet.ec.europa.eu/geoviewer/?layers=13004:1:1&basemap=ebwbl&active=13004&bounds=20.604422241192978,33.855624450948575,28.38690765020506,37.40743565645723&filters= (accessed on 17 July 2023).
  37. EuroAsia Interconnector. Available online: https://euroasia-interconnector.com/at-glance/ (accessed on 16 January 2023).
  38. EuroAfrica Interconnector. Available online: https://www.euroafrica-interconnector.com/at-glance/ (accessed on 16 January 2023).
  39. Myhr, A.; Bjerkseter, C.; Ågotnes, A.; Nygaard, T.A. Levelised cost of energy for offshore floating wind turbines in a life cycle perspective. Renew. Energy 2014, 66, 714–728. [Google Scholar] [CrossRef] [Green Version]
  40. Google Earth Version 9.191.0.0, Google Imagery 2015, 35°59′, 5°18. Available online: https://earth.google.com/web/@35.62533553,23.87668561,-71.11381736a,416802.83010475d,30.00004904y,3.28879468h,0t,0r/data=MikKJwolCiExTFp6R2QwYXpyQ1lhUU5yNTB6WlJJM2VDZFFPYTVLTm4gAQ (accessed on 15 November 2022).
  41. Sullivan, R.G.; Kirchler, L.B.; Cothren, J.; Winters, S.L. Offshore Wind Turbine Visibility and Visual Impact Threshold Distances. Environ. Pract. 2013, 15, 33–49. [Google Scholar] [CrossRef] [Green Version]
  42. Vermeer, L.J.; Sørensen, J.N.; Crespo, A. Wind turbine wake aerodynamics. Prog. Aerosp. Sci. 2003, 39, 467–510. [Google Scholar] [CrossRef]
  43. Marmidis, G.; Lazarou, S.; Pyrgioti, E. Optimal placement of wind turbines in a wind park using Monte Carlo simulation. Renew. Energy 2008, 33, 1455–1460. [Google Scholar] [CrossRef]
  44. Meyers, J.; Meneveau, C. Optimal turbine spacing in fully developed wind farm boundary layers. Wind. Energy 2012, 15, 305–317. [Google Scholar] [CrossRef] [Green Version]
  45. Stevens, R.J.; Gayme, D.F.; Meneveau, C. Effects of turbine spacing on the power output of extended wind-farms. Wind. Energy 2016, 19, 359–370. [Google Scholar] [CrossRef] [Green Version]
  46. Chen, J.; Hu, Z.; Duan, F. Comparisons of dynamical characteristics of a 5 MW floating wind turbine supported by a spar-buoy and a semi-submersible using model testing methods. J. Renew. Sustain. Energy 2018, 10, 053311. [Google Scholar] [CrossRef]
  47. Claus, R.; López, M. Key issues in the design of floating photovoltaic structures for the marine environment. Renew. Sustain. Energy Rev. 2022, 164, 112502. [Google Scholar] [CrossRef]
  48. NRG Island, Floating Solar. NRG Island. Available online: https://www.nrgisland.com/ (accessed on 14 November 2022).
  49. Wave Dragon ApS. Wave Dragon. Available online: https://wavedragon.net (accessed on 27 March 2023).
  50. Guillou, N.; Chapalin, G. Annual and seasonal variabilities in the performances of wave energy converters. Energy 2018, 165 Pt B, 812–823. [Google Scholar] [CrossRef] [Green Version]
  51. Veigas, M.; Iglesias, G. Potentials of a hybrid offshore farm for the islands of Fuerteventura. Energy Convers. Manag. 2014, 86, 300–308. [Google Scholar] [CrossRef]
  52. Veigas, M.; Lopez, M.; Romillo, P.; Carballo, R.; Castro, A.; Iglesias, G. A proposed wave farm on the Galician coast. Energy Convers. Manag. 2015, 99, 102–111. [Google Scholar] [CrossRef]
  53. Gigantidou, A. Crete Power System. In Proceedings of the 4th International Hybrid Power Systems Workshop, Crete, Greece, 22–23 May 2019. [Google Scholar]
  54. Dunnet, D.; Wallace, J.S. Electricity generation from wave power in Canada. Renew. Energy 2009, 34, 179–195. [Google Scholar] [CrossRef]
  55. Diaz, B.D.; Rasulo, M.; Aubeny, C.P.; Fontana, C.M.; Arwade, S.R.; DeGroot, D.J.; Landon, M. Multiline anchors for floating offshore wind towers. In Proceedings of the OCEANS 2016 MTS/IEEE Monterey, Monterey, CA, USA, 19–23 September 2016; IEEE: Piscataway, NJ, USA; pp. 1–9. [Google Scholar]
  56. Jonkman, J.M. Dynamics Modeling and Loads Analysis of an Offshore Floating Wind Turbine; NREL/TP-500-41958; National Renewable Energy Laboratory (NREL): Golden, CO, USA, 2007. [Google Scholar]
  57. Sunflex Photovoltaic System, Dock Marine Systems. Available online: https://www.dockmarine-europe.eu/en/sunflex-photovoltaic-systems (accessed on 22 June 2023).
  58. Pakenham, B.; Ermakova, A.; Mehmanparast, A. A Review of Life Extension Strategies for Offshore Wind Farms Using Techno-Economic Assessments. Energies 2021, 14, 1936. [Google Scholar] [CrossRef]
  59. Ghigo, A.; Faraggiana, E.; Sirigu, M.; Mattiazzo, G.; Bracco, G. Design and Analysis of a Floating Photovoltaic System for Offshore Installation: The Case Study of Lampedusa. Energies 2022, 15, 8804. [Google Scholar] [CrossRef]
  60. Ghigo, A.; Cottura, L.; Caradonna, R.; Bracco, G.; Mattiazzo, G. Platform Optimization and Cost Analysis in a Floating Offshore Wind Farm. J. Mar. Sci. Eng. 2020, 8, 835. [Google Scholar] [CrossRef]
  61. Baca, E.; Philip, R.T.; Greene, D.; Battey, H. Expert Elicitation for Wave Energy LCOE Futures; Technical Report NREL/TP-5700-82375; National Renewable Energy Laboratory (NREL): Golden, CO, USA, 2022. [Google Scholar]
  62. Jelic, M.; Batic, M.; Tomasevic, N.; Barney, A.; Polatidis, H.; Crosbie, T.; Ghanem, D.A.; Short, M.; Pillai, G. Towards Self-Sustainable Island Grids through Optimal Utilization of Renewable Energy Potential and Community Engagement. Energies 2020, 13, 3386. [Google Scholar] [CrossRef]
Figure 1. Contour map of Crete and surroundings for (a) climate mean wind speed and (b) climate mean power density [13].
Energies 16 05921 g001
Figure 2. Monthly mean wind speed from January 2018 to December 2018 for each potential region. Data from [13].
Energies 16 05921 g002
Figure 3. Map of direct normal irradiation from Greece [17].
Energies 16 05921 g003
Figure 4. Monthly mean hourly power production given the selected panel system and solar irradiation. Data from [17].
Energies 16 05921 g004
Figure 5. Contour map of sea surface wave significant height on (a) 30 November 2021 and (b) 30 November 2022 [24].
Energies 16 05921 g005
Figure 6. Selected area for sea wave reanalysis data of the (a) west, (b) central south and (c) east regions [24].
Energies 16 05921 g006
Figure 7. Monthly mean wave power for the (a) west, (b) central south and (c) east region in 2018. Data used from [24].
Energies 16 05921 g007
Figure 8. Seasonal trend of mean wave power in the west region in 2018. Data from [24].
Energies 16 05921 g008
Figure 9. Exclusion zones considering: (a) Military exercise areas [30]. (b) Shipping density, ports and maritime boundaries [31]. (c) Telecommunication cables [32]. (d) Sites belonging to the Natura 2000 network [33].
Energies 16 05921 g009aEnergies 16 05921 g009b
Figure 10. Bathymetry map around Crete [36].
Energies 16 05921 g010
Figure 11. Chosen location (CL) for FMEI [40].
Energies 16 05921 g011
Figure 12. Monthly potential mean power generation considering commercial energy converters: (a) Energy from wind for one OWT (in MW). (b) Energy from solar considering selected PV and area (in MW). (c) Energy from wave for one device of WaveDragon.
Energies 16 05921 g012
Figure 13. (a) Layout of the energy island with wave energy converters located in the blue lines. (b) Layout of anchor locations and multiline mooring system.
Energies 16 05921 g013
Figure 14. An illustration of the proposed energy island (not to scale).
Energies 16 05921 g014
Figure 15. (a) Sea water velocity and (b) its vector around Crete [24].
Energies 16 05921 g015
Figure 16. Daily mean of horizontal sea water velocity. Data from [24].
Energies 16 05921 g016
Table 1. Mesoscale climate mean wind speed and power density for each of the potential regions [13].
RegionLatitude,
Longitude
[°]
Climate Mean Wind Speed [m/s]Climate Mean Power Density [W/m2]Wind Power Class
West35.59, 23.358.87196
Central south34.85, 25.339.29736
East35.11, 26.479.79376
Table 2. Grid of three potential regions to obtain the data for wave energy assessment [24].
RegionLatitude RangeLongitude Range
West35.50–35.6023.30–23.40
Central south34.80–34.9025.30–25.40
East35.10–35.2026.40–26.50
Disclaimer/Publisher’s Note: The statements, opinions and data contained in all publications are solely those of the individual author(s) and contributor(s) and not of MDPI and/or the editor(s). MDPI and/or the editor(s) disclaim responsibility for any injury to people or property resulting from any ideas, methods, instructions or products referred to in the content.

