1. Introduction
Microgrids are gaining significant academic and industrial interest as a viable operational solution toward decarbonizing power grids [
1], characterized by the presence of various energy assets, such as demand (controllable and non-controllable), generation (solar PV, small-scale wind turbine, etc.), and other flexible assets, such as battery storage and control apparatuses for the management of its operation. There have been various definitions of microgrids proposed in the literature, with the Department of Energy of the United States defining a microgrid as a “group of interconnected loads and distributed energy resources within clearly defined electrical boundaries that acts as a single controllable entity with respect to the grid, meaning that a microgrid can connect and disconnect from the grid to enable it to operate in both grid-connected or island-mode” [
2]. Microgrids can provide services both within their physical boundaries and with the interconnected main grid. Overall, the characteristics mentioned above render microgrids a popular paradigm among operators, communities, and developers, with their popularity being further enhanced by compelling efficiency, reliability, and replicability metrics [
2,
3].
Much of the existing body of literature focuses on the development, examination, and implementation of control schemes and strategies for microgrids [
2,
3,
4,
5,
6,
7,
8]. Despite the valuable contributions of these studies to the domains of operational management, service-oriented control, etc. [
5,
6,
9,
10,
11], a dimension remains significantly overlooked: the latent potential of data associated with microgrid operations. Microgrid data, often harvested via IoT devices operating within a microgrid, offer powerful insights that could fundamentally alter operational strategies, pinpoint bad practices, guide capital investments, and uncover untapped potential [
12]. This valuable data resource is rarely accessible in an open format, particularly for small- to medium-scale microgrids. The exceptions are often limited to scientific projects, which collect and publicly share data. This shortfall is often attributed to the complex challenges of deploying a robust data architecture [
13].
Our study aims to bridge this gap, underscoring the need for a scalable and flexible architecture that can not only facilitate real-world applications of microgrids but also unlock the value hidden in operational data. By exploring this untapped potential, our research will contribute toward a data-driven approach to microgrid design, operation, and adoption, positioning it as an essential tool for the transition to a decarbonized power grid.
1.1. Literature Review
A considerable lack of conceptual work that focuses on practical data analytics deployment schemes is evident in the literature. The authors in [
14] proposed a conceptual communication architecture, focusing on the development of low-latency communication channels that operate the monitoring and control subsystems separately, and tested it on a lab-based test-bed. The survey presented in [
15] provides a comprehensive overview of data analytics techniques employed in microgrids. The survey covers various aspects, including data sources, analytic algorithms, and their applications, giving a holistic perspective on improving microgrid performance. The inclusion of real-world case studies and examples enhances the practical relevance of the survey; however, this work does not cover the various challenges faced by microgrids and the way that data analytics can address them. The paper presented in [
16] reports on the problems associated with big data stemming from microgrids, the sources of big data, the available tools that can be used for data handling, and finally, the benefits stemming from the utilization of big data and the challenges associated with its collection, processing, storage, visualization, integration, etc. Although the paper provides an overview of the applicability of big data stemming from microgrids, the various technical methodologies and architectures are not thoroughly evaluated.
The development of a low-cost Supervisory Control and Data Acquisition (SCADA) system for an experimental microgrid test-bed is proposed in [
17]. The paper highlights the lack of standardization in control topology and controller hardware technology, which often leads to the utilization of various communication protocols with different characteristics. The authors propose a SCADA system that integrates wireless control and monitoring for multiple energy assets. The system is implemented in a microgrid and utilizes Arduino and Raspberry Pi boards for data acquisition and control signal management, while it enables remote control and monitoring through a web interface. While the paper provides a methodology for the design and implementation of the low-cost SCADA system and showcases its application in an experimental microgrid test-bed, it does not propose designs that incorporate typical IoT devices found in microgrids (e.g., sensors, edge intelligence with direct internet connection) and the analysis of big data.
It is therefore imperative to investigate and propose real-world infrastructures, besides communication systems [
18] and network management schemes [
19,
20], that support the monitoring and operational analytics of microgrids, utilizing state-of-the-art computing resources and digital architectures that cater to technologies found within typical microgrids (e.g., power meters, edge intelligence). The significance of the latter is thoroughly investigated in [
12], where relevant data categorization, data acquisition, and energy disaggregation tools are investigated in the context of building data-driven business models for net-zero power grids.
In [
21], the authors emphasize the role of effective battery storage system oversight in optimizing the use of renewable resources and ensuring secure power grids. Currently, only advanced battery storage systems are monitored and controlled via a proprietary communication channel between the systems and the manufacturers’ cloud infrastructure. However, these channels and data are inaccessible. To manage such systems, commercial agreements with all manufacturers must be in place that grant access to their APIs, thus minimizing the potential for the wide-scale deployment of the architecture.
Edge computing is ideal for time-sensitive data processing within the monitoring framework, while cloud computing is used for data not bounded by time. Edge computing is centered around processing sensor data not in central nodes but at the network periphery, nearer to the data origin. The methodology proposed in [
22] employs a decentralized network architecture designed to accommodate local data generation and mobile computing. By integrating edge computing, an intermediary layer forms between IoT devices and the cloud, bringing advantages like enhanced processing speed, on-the-spot decision making, automatic alert systems, and decreased complexity. Edge computing signifies the strategic placement of distributed intelligent agents at the fringes of the network and in close proximity to IoT-enabled devices. These agents provide computation, storage, and application services near data sources. Many applications and services can benefit from the relocation of computational and storage tasks closer to IoT-enabled devices. This repositioning, known as edge computing, leads to significantly lower service response latency, reduces communication overhead, and alleviates the traffic load on the central network [
23].
1.2. Contributions of This Paper
This paper aims to address the existing gap in the literature by presenting a scalable and flexible physical and digital architecture for extracting data-driven insights from a real-world microgrid in the UK. With a focus on practical data analytics deployment schemes and case-specific insights, our research seeks to provide valuable contributions to the field of microgrid data analytics.
The architecture that we propose encompasses a comprehensive set of components, such as pre-existing devices within the microgrid and additional devices and software for this work. The software has been designed to facilitate efficient analytics within microgrid systems. Key components include edge monitoring via smart meters that act as crucial data collection points, monitoring, in real time, energy consumption and generation. Our architecture also utilizes existing edge intelligence, in the form of a PC that would typically already exist in a microgrid, empowering local data processing and decision-making capabilities, which ultimately elevates the microgrid’s responsiveness and autonomy. Moreover, to ensure an unimpeded flow of data, we have integrated data-harvesting mechanisms that guarantee a constant and reliable data acquisition process. The architecture also establishes a communication pathway between the edge and the cloud, ensuring efficient data transfer and interaction with cloud-based analytics platforms.
Analytics techniques are integral to our proposed architecture. They are utilized to identify good and bad practices, identify patterns, uncover hidden potential, and ultimately, aid in reducing operational costs. The implementation of cloud-hosted data analytics allows us to utilize large-scale computational capabilities and algorithms to process and analyze the vast amount of data collected from the microgrid. This analysis includes time-series data preprocessing, cleaning, imputation, and feature engineering. By dissecting statistical relationships within the data, we extract insights about the performance and operational characteristics of the microgrid.
A summary of our research contributions is presented hereafter:
The real-world applicability of microgrids is addressed by providing a practical physical and digital architecture that can be implemented in real-world scenarios to exploit the benefits of data analytics. The proposed architecture is a low-cost alternative, as it utilizes pre-existing equipment that would typically be present in microgrids.
The proposed architecture accounts for the unique challenges and opportunities faced by microgrids, ensuring its relevance and effectiveness. The deployment of the software in the locality of the microgrid enables operators to operate the scheme autonomously. Additionally, the architecture enables the low-latency communication of measurements due to the edge intelligence, without the need for large-scale data transmission in centralized systems.
This work proposes an end-to-end solution that spans from edge monitoring to cloud-based analytics, providing a comprehensive approach to energy insight extraction.
The architecture enables microgrid operators to tailor their strategies and decision-making processes based on the specific characteristics and requirements of their microgrid due to the capability to tailor the data analytics algorithms according to market, network, and asset specifications.
It utilizes industry-standard software (Python 3.9, Docker 23.0) and cloud computing (AWS) that are easily accessible.
The software that resides in the edge intelligence has been deployed in a virtualized container (Docker), ensuring flexibility, scalability, and short deployment and update times.
1.3. Organization of Paper
In the following sections, we delve into the methodology used to develop our proposed architecture from both physical and digital standpoints. We detail the data analysis techniques employed with respect to the case-specific market arrangement of the investigated microgrid. Subsequently, we present the results obtained from the one-year operation of a real-world microgrid in the UK and discuss the implications of these findings. Finally, we conclude with a comprehensive discussion on the practical applications and future research directions for microgrid design, operation, and adoption with respect to data analytics.
2. Physical Architecture
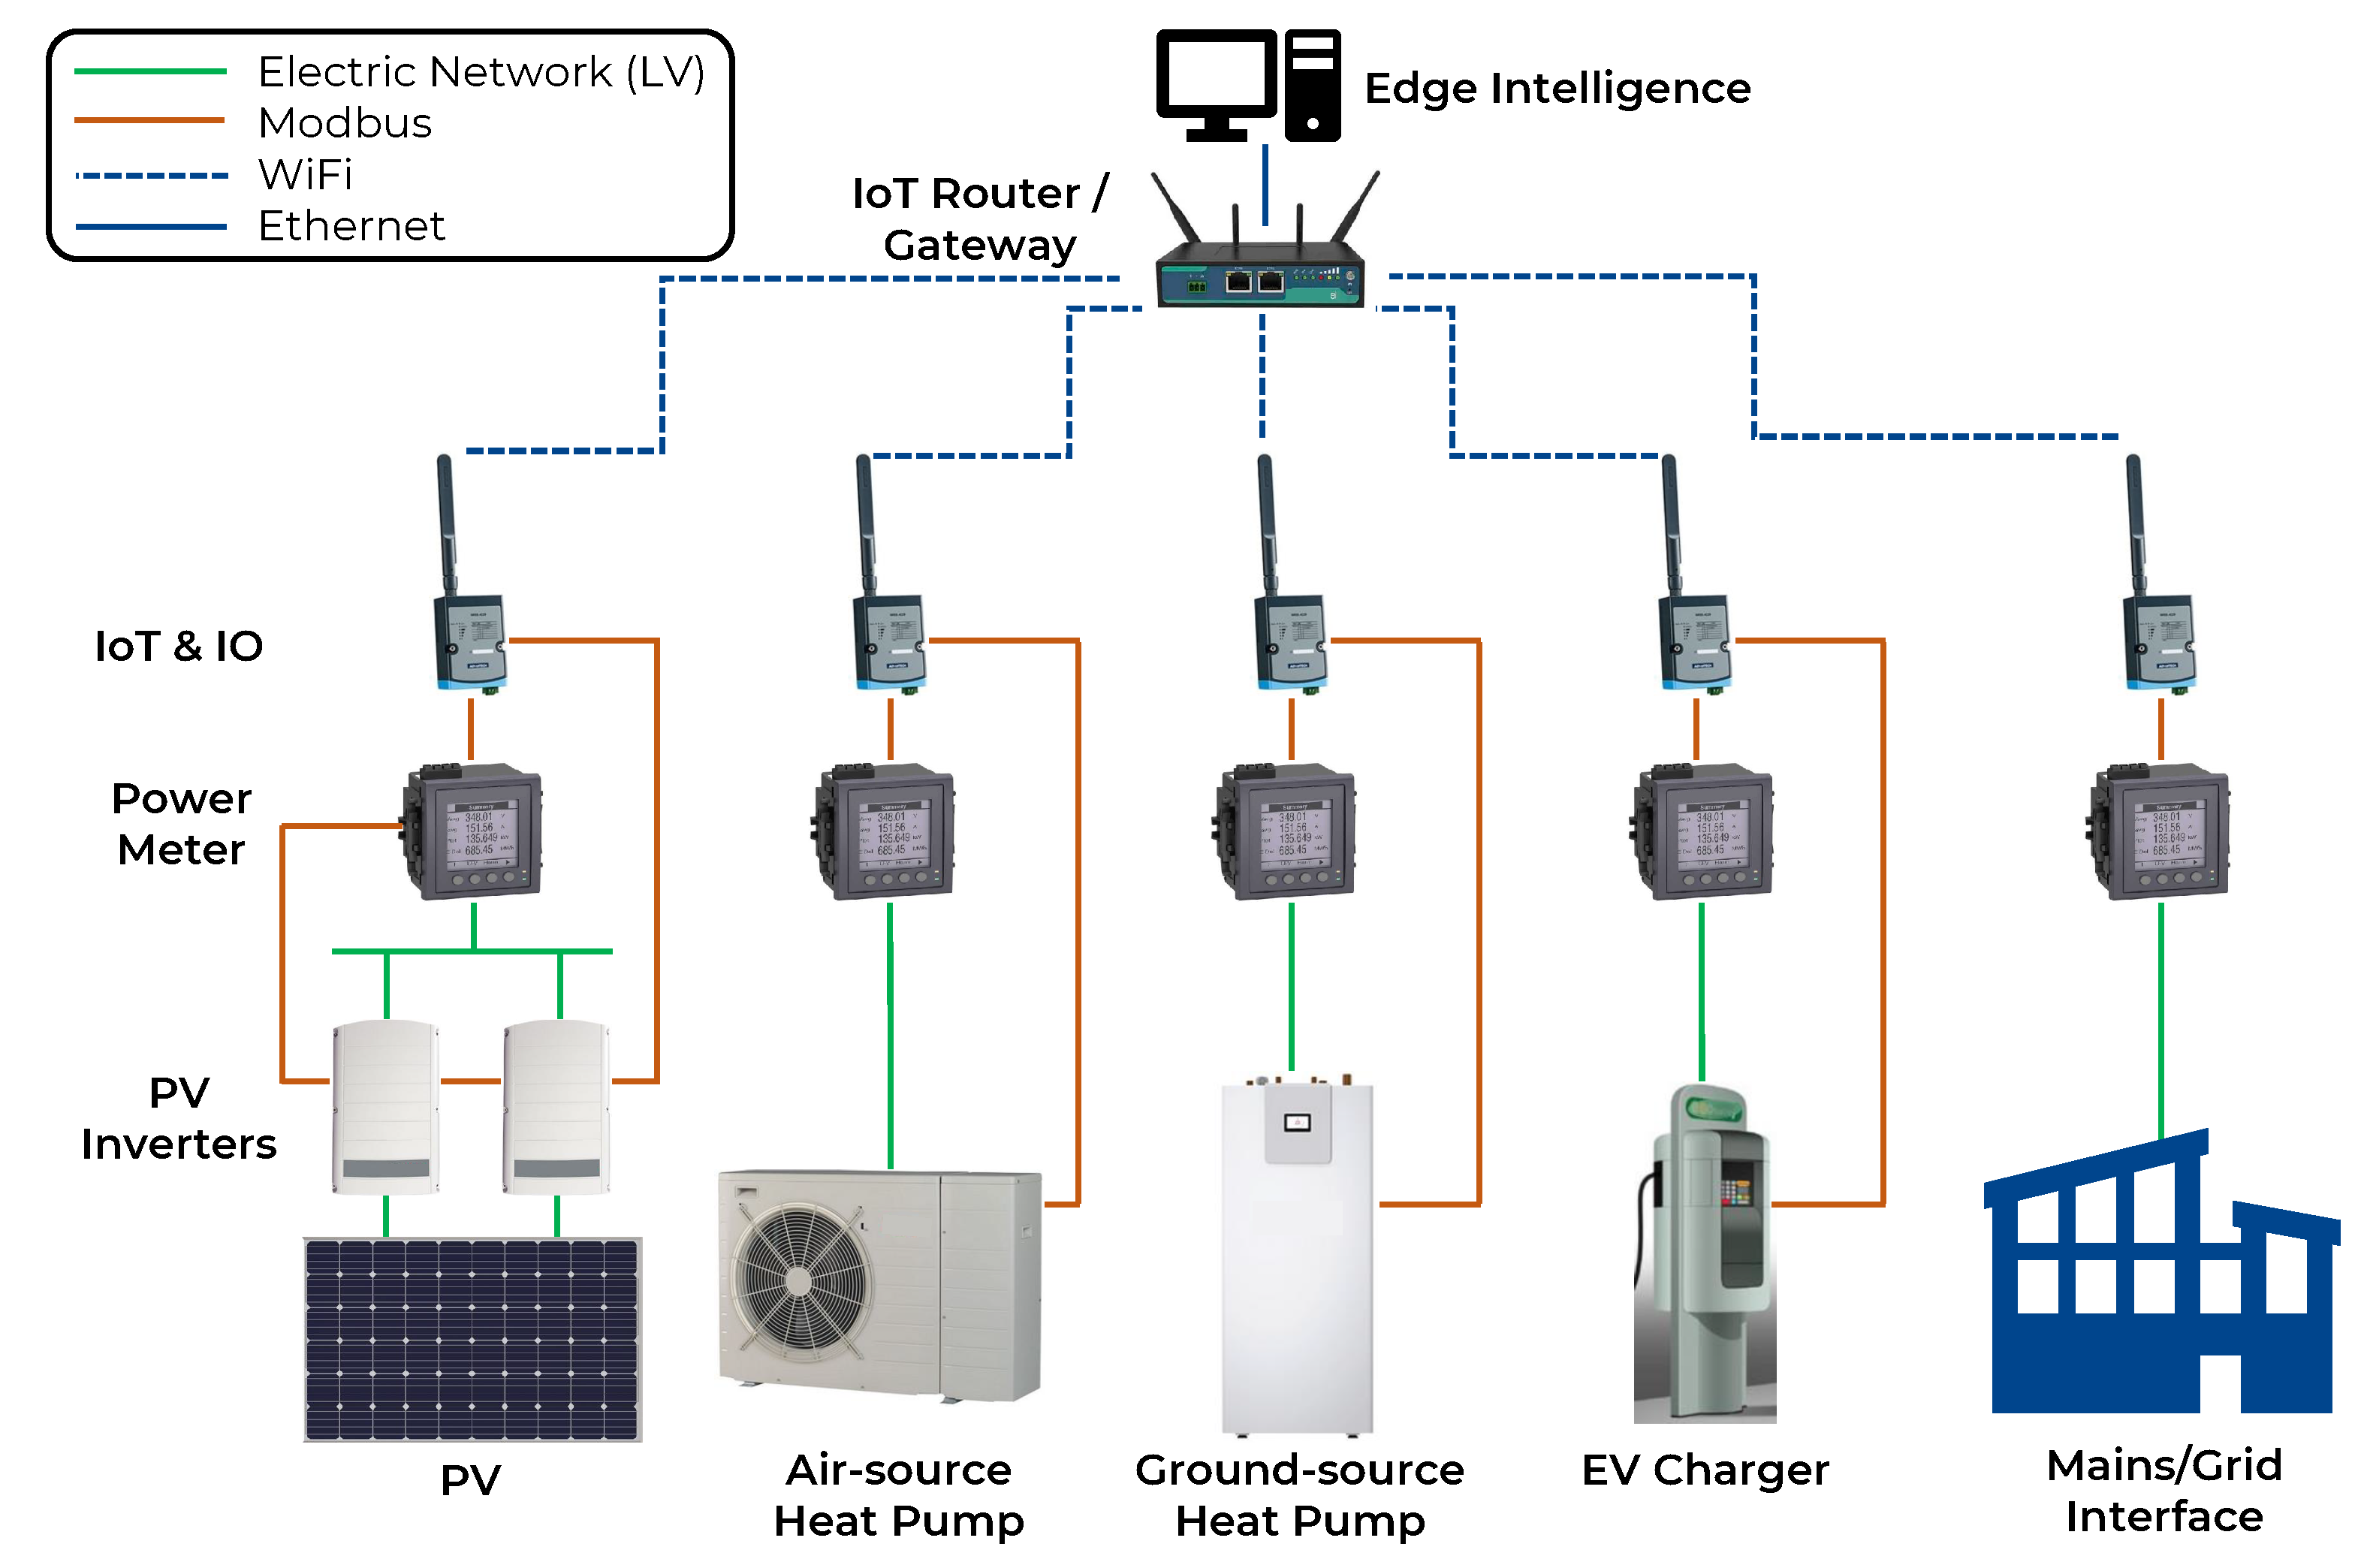
The microgrid installation, located in Brighton, UK, is a multi-vector system that comprises energy assets from electricity, electrified heating, and electrified transportation vectors. The microgrid is housed behind the utility meter, and all assets are connected to the low-voltage (LV) electric network. The microgrid is hosted in a real-world educational facility and can only operate in grid-connected mode.
The microgrid energy assets are an air-source heat pump (ASHP), a ground-source heat pump (GSHP), an electric vehicle (EV) charger, and a solar PV system connected via two parallel inverters. The physical architecture designed and deployed to monitor and subsequently control the energy assets consists of the following:
Power meters that are connected upstream of each asset, including a power meter installed at the microgrid mains. Each power meter is equipped with capabilities to monitor, among others, the voltage, current, frequency, active and reactive power, and active and reactive energy.
Internet-of-Things (IoT) and Input–Output (IO) modules that facilitate the data flows from the power meters toward the edge intelligence. The protocol utilized for the power meter connection is Modbus [
24]. All the IoT and IO modules are clustered via an IoT router/gateway that enables the wireless transfer of data from the IoT and IO modules via WiFi.
The collection of data from the edge intelligence that hosts the developed software is realized through a standard Ethernet connection to the IoT router/gateway.
The overall architecture can be seen in
Figure 1. The scope of the architecture is to utilize the pre-existing infrastructure (i.e., power meters) and utilize low-cost IoT devices to extract the data into a central edge intelligence device (i.e., a PC). The edge intelligence that resides within the microgrid is equipped with Python-based software developed specifically for this installation. The software gathers data from all available power meters every second, processes the data for any anomalies, creates basic datasets from maximum, minimum, and average values of the variables collected, and acts as the node that the cloud communicates with. To enable the replication of the proposed architecture, the software has been deployed in a Linux container, utilizing Docker technology for virtualization.
Microgrids present a significant prospect for incorporating IoT mechanisms, given the technical nature of the assets that compose a microgrid. Integrating IoT necessitates the deployment of sensing, connectivity, and analytic technologies for optimal operation. The underlying designs found in [
25] consider IoT infrastructure at the epicenter of microgrid architectures, serving vital roles in control, monitoring, protection, and analytics, aligning with the proposed architecture of the work presented in this paper. The architecture found in [
26] presents a high-level depiction of a digital architecture for the realization of energy communities; however, the paper does not delve into the low-level technical particularities of microgrid monitoring and analytics. An architecture that shares elements with the structure proposed in this paper can be found in [
27]. In contrast to our proposed architecture, the authors have only included Ethernet-based communications and do not explore any data pre-processing at the edge. More importantly, data analytics are not considered, and the architecture is mainly employed for monitoring and measurement visualization purposes.
Virtualization offers numerous advantages for owners and operators in managing their microgrids. It enhances operational efficiency, security, reliability, and flexibility while simultaneously reducing costs and simplifying management [
28]. Some of the benefits of virtualization include:
Streamlined management: Virtualization enables the central management and monitoring of systems, applications, and resources, leading to more efficient maintenance and troubleshooting processes.
Increased efficiency: By consolidating multiple applications and systems into a single server through virtualization, microgrids can reduce the need for additional physical devices. This reduction in hardware translates to cost savings in terms of energy consumption, maintenance efforts, and physical space requirements.
Enhanced flexibility: Virtualization allows microgrids to easily and swiftly scale their resources up or down as needed without the requirement of physically adding or removing hardware.
Additional security layers: Through the segregation of various applications and systems in separate containers, virtualization enhances the security metrics of microgrids. This isolation reduces the risk of a single compromised system affecting the entire microgrid, thus increasing overall security.
Improved reliability and resilience: By leveraging virtualization, microgrids can enhance their overall reliability by minimizing downtime and mitigating the impact of system failures. In case of a failure, containers can be swiftly migrated to alternative physical servers without interrupting service. Additionally, Docker provides the capability to automatically restart the containerized system, restoring the data collection process without manual intervention. This inherent resilience ensures uninterrupted data collection and minimizes downtime, resulting in enhanced data availability and system reliability.
The designed and deployed digital data infrastructure is presented in the following section.
3. Data Architecture and Implementation
The digital transformation of the energy sector has opened up new possibilities for collecting, processing, and leveraging data to drive operational efficiency and enhance customer experience. In this section, we provide a comprehensive understanding of the data pipeline involved in smart meter data collection, processing, and insight generation, as well as its implementation as part of the digital transformation of the microgrid under study. We highlight the key steps from local data collection to cloud-based analytics, showcasing the importance of data-driven decision making in the energy sector. For the purpose of data collection, processing, and analysis in the underlying work, Amazon Web Services (AWS), a leading cloud provider, is used as a fundamental component of the data pipeline. The proposed methodology is organized as follows: We begin by discussing the process of local data collection from edge devices and the aggregation of data into intervals. Next, we delve into the data ingestion to the cloud, including the organization and storage of data files. We then explore the Extract, Transform, Load (ETL) process in the cloud, including data cleaning, transformation, and preparation for analysis. Furthermore, we discuss the utilization of AWS QuickSight for interactive, web-based visualizations and the generation of automated reports for microgrid stakeholders.
3.1. Data Collection and Data Preprocessing
The data collection process plays a critical role in harnessing the potential of smart meter data for the digital transformation of the energy sector. In the architecture proposed in this work, smart meters are connected to a central data collection system, integrated into the edge intelligence through sockets, utilizing the Modbus protocol. Modbus allows for reliable and efficient communication between the smart meters and the central system, ensuring the seamless transfer of data. By establishing a socket connection, the central system can initiate data retrieval from the smart meters at regular intervals. The smart meters sample at a frequency of 1 s, and these data are available through the aforementioned socket connection.
However, storing and processing such granular data may be resource-intensive. To optimize storage and improve processing efficiency, the collected data are aggregated into larger intervals. In this case, the data are accumulated over a 1 min period, and the average, maximum, and minimum variable values are calculated. This aggregation helps to reduce storage requirements while still providing meaningful insights into data patterns. To ensure data quality and reliability, basic preprocessing steps are performed before storing the collected data. This includes handling corrupted or invalid measurements. For example, when no valid measurements are received or when certain data points contain anomalies, such as extreme spikes or inconsistencies, these data points are discarded or marked as missing values. By filtering out corrupted data, the overall quality of the collected data is improved, laying the foundation for accurate analysis and insights. Missing values are subsequently processed within the cloud-hosted architecture through imputation methods, further discussed in the sections that follow.
Additionally, given the critical nature of energy data, it is essential to maintain data integrity even in the event of a system disruption (e.g., internet connection lost). To address this, a local database is employed to store the collected data for a specific duration, set at 30 days for the specific microgrid discussed in this paper. The local storage acts as a backup, ensuring that data remain available and accessible even during power interruptions. Once the connection is re-established, the locally stored data are synchronized with the cloud-based storage for further analysis and processing.
3.2. Data Ingestion to the Cloud
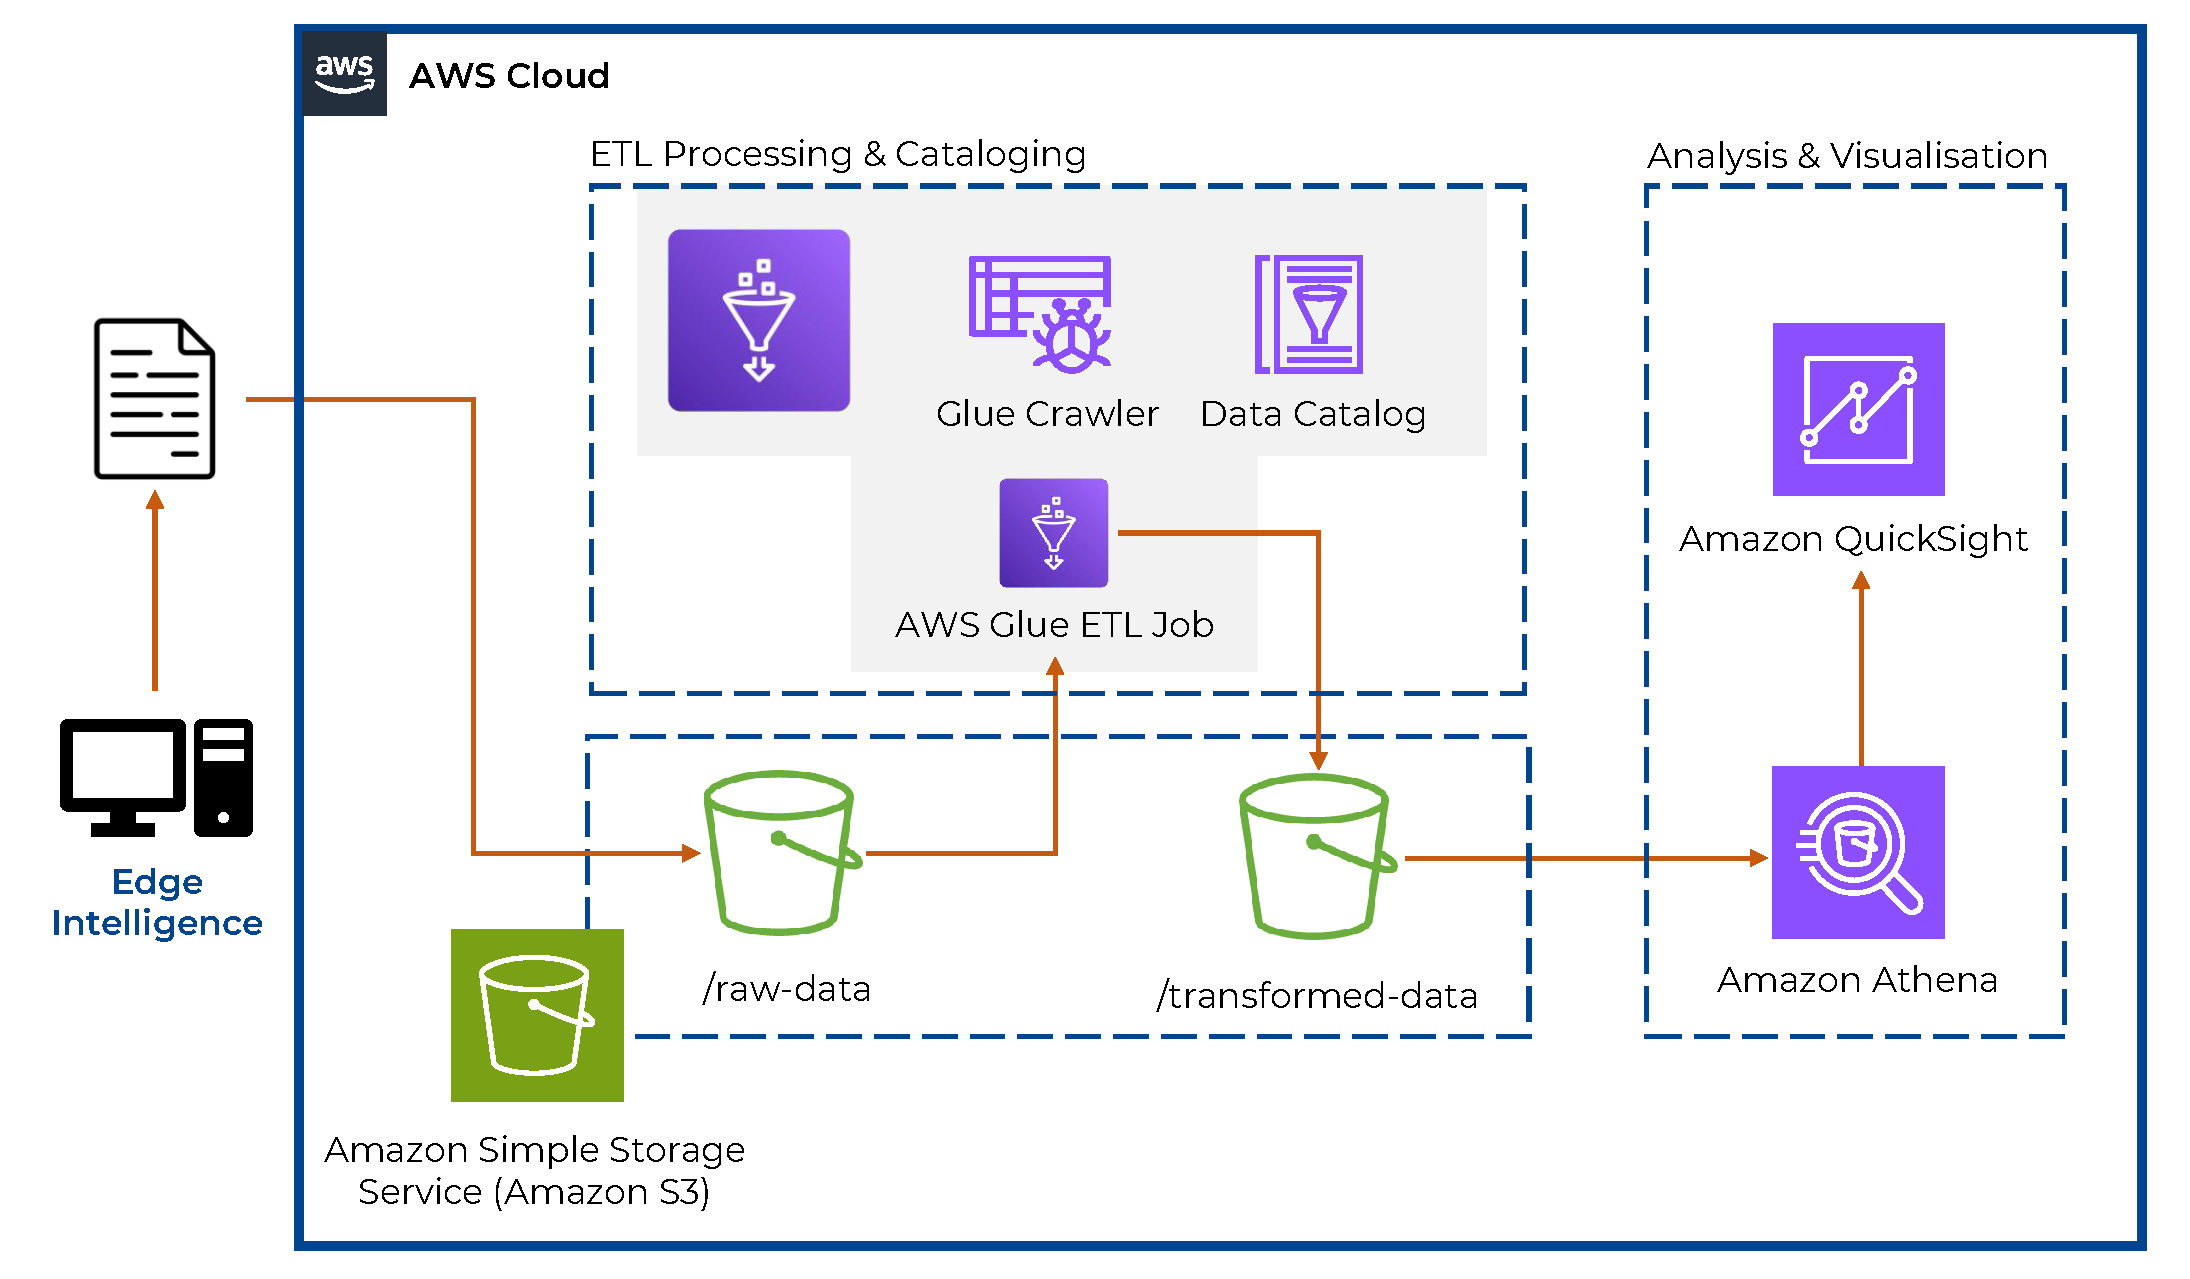
Once the data are collected locally, they are uploaded to AWS for centralized storage and further processing. The following sections focus on the data ingestion process, which involves organizing and uploading the data to the cloud for further processing and analysis. Various AWS tools are utilized to achieve three main tasks, namely:
The overall architecture that encompasses the tools developed and deployed in this work can be seen in
Figure 2. The role and interconnection of the tools are thoroughly described in the following sections.
3.2.1. Chunking and File Organization
To facilitate efficient data retrieval and management, the collected data chunks of files were organized. Each file is named after its corresponding timestamp and smart meter ID, ensuring easy identification and retrieval. The data are structured in a hierarchical manner, with files stored within daily, monthly, and yearly folders. This hierarchical organization allows for the logical segmentation of the data, enabling faster access to specific time periods and simplifying data management tasks. The collected data, organized into the chunked files, are uploaded to AWS Simple Storage Service (S3) [
29] buckets every 30 min to minimize cloud usage and costs.
3.2.2. Data Security and Compliance
Data security is a paramount concern when dealing with sensitive smart meter data. AWS provides security measures and compliance frameworks to safeguard the data in transit and at rest. By leveraging AWS Identity and Access Management (IAM) [
30], access policies and controls were enforced, ensuring that only authorized individuals such as the authors, microgrid stakeholders, and the edge intelligence have the necessary permissions to access and modify the data. Encryption techniques, such as 256-bit Advanced Encryption Standard (AES-256) server-side encryption and client-side encryption, were employed to protect the data from unauthorized access.
3.2.3. Data Transformation and Analysis in the Cloud
Data transformation and analysis are crucial steps in deriving meaningful insights from smart meter data. Therefore, to enable analytics and insights, an Extract, Transform, Load (ETL) process was applied to the data ingested in AWS. In particular, AWS Glue [
31], an ETL service that automates much of the tasks involved in this process, was utilized. Glue jobs were utilized to automate the process of reading the data files stored in S3, transforming and preparing them for further analysis. Subsequently, Glue crawlers [
32] were employed to automatically discover the schema of the transformed data and create a Glue catalog. This catalog serves as a metadata repository, facilitating query execution using tools like Amazon Athena [
33].
By using Glue Jobs, an automated and scalable approach to processing data was created, ensuring cleanliness and scalability. The development of Glue Job scripts was powered by Apache Spark, an open-source distributed computing framework. A detailed description of the steps utilized via Glue Jobs for data cleaning and transformation are presented below:
Glue Job Creation: Using AWS Glue, an ETL Python script was deployed to perform the data cleaning and transformation operations required.
Data Extraction, Cleaning, and Transformation: The Glue Job, leveraging the capabilities and libraries of Apache Spark [
34], extracts the smart meter data stored in AWS S3, performs data cleaning by detecting both outliers and missing values, drops unnecessary columns, and transforms data into the desired form to facilitate querying and further analysis.
Scaling with Apache Spark: Glue Jobs and Apache Spark’s distributed computing capabilities enable the automatic parallelization of data processing tasks across a cluster of compute resources, ensuring the scalability and efficient handling of large datasets. In this way, Spark enabled the overall architecture to process large volumes of smart meter data in a timely manner.
Saving Transformed Data to AWS S3: Once the data cleaning and transformation steps are completed, processed data are stored back in AWS S3, making them readily accessible for further analysis and visualization.
Note that in our data analytics pipeline, we implement a comprehensive data cleaning process that identifies and manages data anomalies. We use robust statistical techniques to either exclude or correct these anomalies, thus ensuring accurate and reliable data analytics outcomes. Specifically, we leverage the Z-score method for identifying and dealing with extreme values in our datasets. Detected outliers are evaluated in context to determine whether they represent legitimate extreme conditions or erroneous data points. If the latter, they are excluded from further analysis to prevent skewing our results. For managing missing data, we implement imputation methods depending on the nature and extent of missing data. If the data are missing completely at random, we use listwise deletion methods, whereas in the case of systematic missing data, we use the median imputation technique.
Following the preparation of raw data, the next step is to facilitate access to the transformed data in order to avoid complex data loading prior to further analysis or visualization. On that front, two AWS services were leveraged, namely, AWS Glue crawlers and AWS Athena for schema detection and interactive querying, respectively. The two services and their respective roles in the overall sequence are described as follows:
Schema Detection with AWS Glue Crawler: Before data can be queried in Athena, they need to be cataloged. Hence, an AWS Glue crawler was introduced to automatically discover the structure of the processed data by inspecting the data in the designated AWS S3 location. In particular, this service scans the processed data files in AWS S3 and infers the schema based on the file structure, data formats, and patterns. It extracts metadata, such as column names and data types, and partitions them into a metadata catalog, enabling Athena to later identify the structure of the data. In this way, any different structures or formats will be automatically discovered and filed as a different schema. In essence, the metadata catalog serves as a central repository for storing and organizing the discovered schema information. It provides a unified view of the processed data, making it easier for users to query and analyze the data using Athena.
Table Creation in Athena: One further step before allowing the access to the transformed energy data for further analysis was to create tables that will serve as a logical representation of the data, enabling users to execute SQL queries against them. The metadata tables created by the Glue crawler are easily accessed in AWS Athena through the detected schema. On that front, an Athena table that is accessed using SQL statements was set up. Athena was utilized to analyze consumption/generation patterns, perform aggregations, and filter the data to derive insights from the transformed dataset before proceeding to data visualization.
As a final step of the data transformation pipeline, these processes were automated to ensure efficient and timely data-processing workflows. Precisely, to achieve this, the triggering of Glue jobs and the detection of schema changes were scheduled in specific time intervals. The specific tasks are described below:
Triggering Glue Jobs: AWS Glue allows the scheduling of Glue jobs, which perform data cleaning and transformation operations. Therefore, the triggering of the deployed Glue job was set up to run during the arrival of new data in AWS S3. This automation ensured that data cleaning and transformation processes are consistently performed, keeping the transformed data up to date.
Glue Crawler for Schema Detection: By scheduling Glue crawlers, the detection of schema changes in the transformed data was automated. Therefore, the crawlers can scan the data in AWS S3 and update the metadata catalog, capturing any modifications in the data source. This ensures that any changes in the transformed data are reflected in subsequent analyses.
By automating these processes, we managed to save time, reduce manual effort, and ensure that data are always up to date and readily available for analysis.
3.2.4. QuickSight for Interactive Visualization
Following the transformation of data and automation of the ETL pipeline, the next step was the development of a visualization dashboard for processed data and insights. Amazon QuickSight [
35] was utilized as an interactive dashboard to monitor consumption trends, identify patterns, and explore time-related insights from our data. QuickSight integrates with AWS Athena, allowing efficient querying and retrieval of relevant data. Additionally, QuickSight leverages the SPICE (Super-fast, Parallel, In-memory Calculation Engine) dataset for accelerated query performance, which enables rapid data exploration and analysis. To leverage the capabilities of SPICE, the processed data from the ETL process stored in AWS S3 are imported into QuickSight through the Athena Table based on the defined queries. It is specifically designed to accelerate query performance and enhance interactivity when working with large datasets, while it also allows QuickSight to store a copy of the imported dataset in an in-memory-optimized format, importing only the new data at the refresh rate. On top of this, the data within the SPICE engine are transformed and optimized for rapid analysis, eliminating the need to query the underlying data source (in this case, Athena) repeatedly. Last, the SPICE dataset allows for rapid filtering, aggregation, and calculation operations, resulting in near-instantaneous response times when generating visualizations, exploring energy trends, and applying filters, ultimately facilitating faster and more efficient decision making in the digital transformation of the energy sector.
To ensure up-to-date insights, the SPICE dataset in QuickSight is refreshed every 30 min. This is achieved through a scheduled data refresh mechanism provided by QuickSight. By configuring the refresh rate, the dataset is automatically updated with the latest data, ensuring real-time analysis and visualization.
Once the data are retrieved from Athena, QuickSight provides an interface to create visualizations and plots. By using various chart types, such as line and bar charts or heatmaps, patterns can be visualized. For this work, interactive line charts were created, where relevant columns, such as timestamp, values, and smart meter identifiers, were selected from the retrieved data. QuickSight also enables users to select specific smart meters (i.e., energy assets) for visualization. On that front, dashboard filters were customized so that users can define filters based on specific criteria, such as selecting a particular date range or choosing specific devices for visualization. These filters enable users to focus on specific subsets of data and derive insights tailored to their requirements. Snapshots from the developed QuickSight dashboard can be seen in
Figure 3.
4. Data-Driven Energy Insights and Automated Reporting
Data-driven insights are critical for microgrids, as they enable the optimization of energy generation and consumption, real-time monitoring and control, demand response management, predictive maintenance, grid planning and expansion, and energy market integration. By leveraging data insights, microgrid operators can make informed decisions, improve operational efficiency, enhance grid reliability, and maximize the benefits of distributed energy resources.
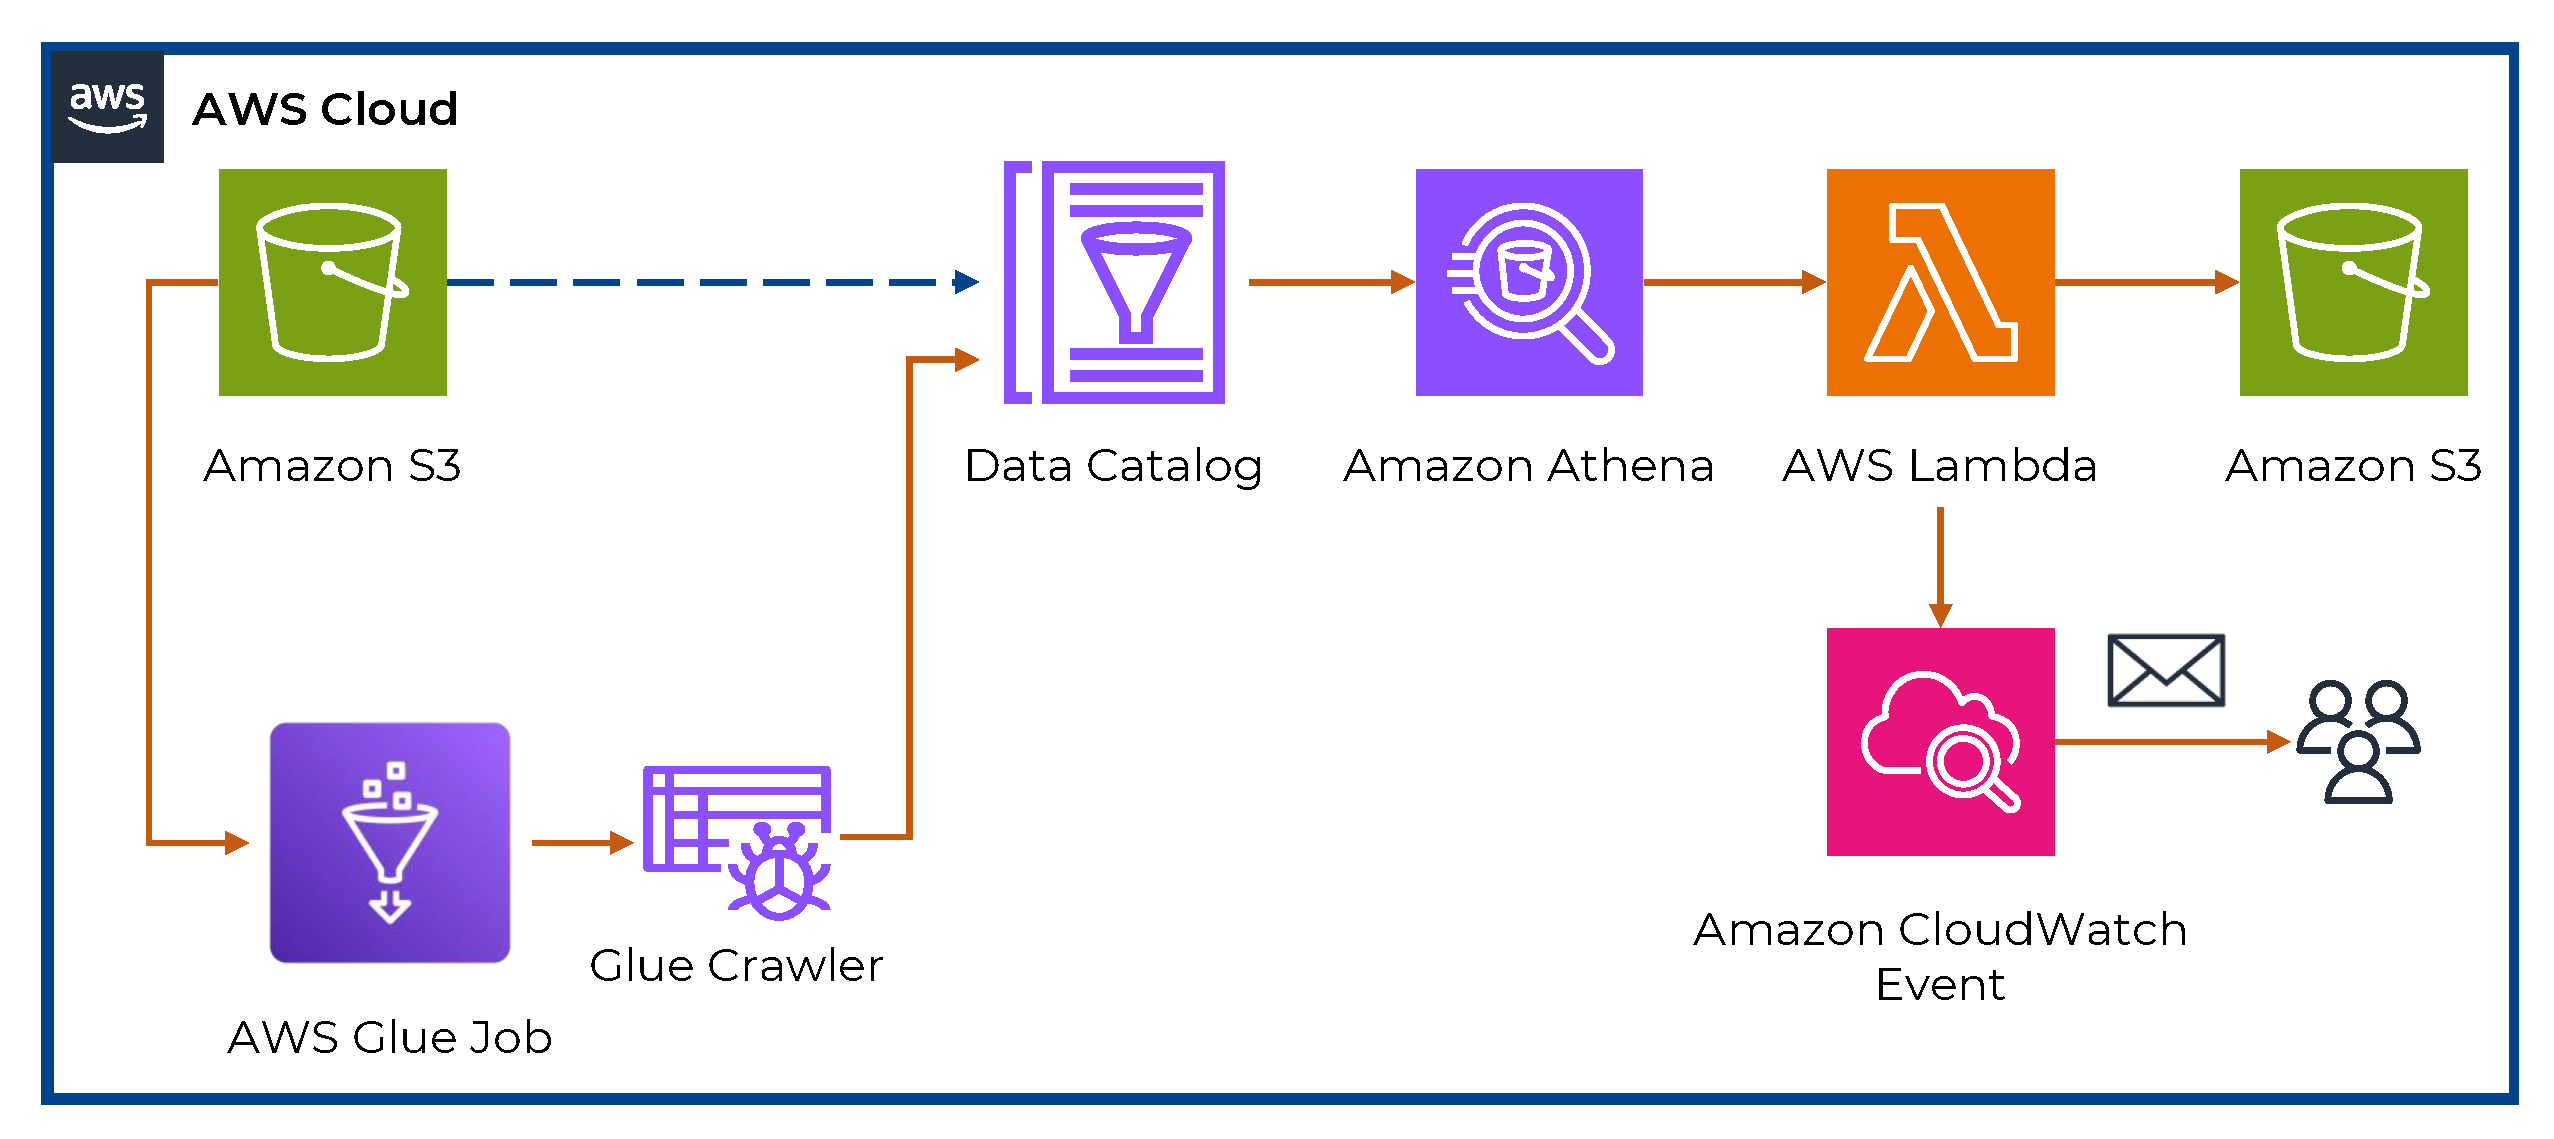
Consequently, a mechanism to realize data-driven insights and automated reports was developed as part of this work. With respect to the latter, a Python-based AWS Lambda [
36] function was developed. The Lambda function acts as a serverless computing service that can be triggered by events; in this case, it is triggered by a scheduled time interval. In the following sections, the step-by-step process to create this service is thoroughly described.
The digital architecture utilized to process, analyze, and create the necessary insights and reporting mechanism is illustrated in
Figure 4. In the following sections, the various tools and their integration are described in depth.
4.1. Creating the Lambda Function
The Lambda function, developed in Python, leverages libraries such as Pandas, Matplotlib, Seaborn, Scipy, Scikit-learn, and FPDF for data processing, visualization, and PDF generation. The function was designed to extract relevant data from the transformed data stored in the S3 bucket, perform the necessary calculations and analyses, and generate a comprehensive report. The Python script for generating the data-driven insights report was containerized into an image, uploaded to Amazon Elastic Container Registry (ECR), and then utilized via a Lambda function equipped with the custom container image as the runtime environment. When configuring the Lambda function, the desired memory and timeout settings were defined, along with any necessary environmental variables. Additionally, the appropriate IAM (Identity and Access Management) roles and permissions were assigned to the Lambda function to access the required AWS services, namely, S3 and Athena.
4.2. Accessing Transformed Data from Athena
To access the transformed data from the Athena table, the Lambda function image utilizes the AWS SDK (Software Development Kit) for Python, also known as Boto3 [
37]. Boto3 allows integration with AWS services, including Athena. The Lambda function executes SQL queries against the Athena table to retrieve the required data for generating energy data insights and reports. The results of the queries are retrieved as dataframes for further processing and analysis. The queried data are then processed and analyzed using the Python libraries discussed above.
4.3. Triggering the Lambda Function
The Lambda function can typically be triggered in multiple ways. In this work, the Lambda function was scheduled to run at specific time intervals, namely, monthly and yearly, to generate reports and inform the microgrid’s stakeholders about the underlying energy consumption/generation profiles and provide insights. For this purpose, Amazon CloudWatch Events [
38] was used to schedule the execution of the Lambda function, where the trigger is set to specific dates and times, once per month and once per year. The generated report is saved to a designated location in an S3 bucket, while an automated email is also sent to the stakeholders with the aforementioned report attached.
4.4. PDF Report Generation with Data-Driven Energy Insights
The Lambda function performs a series of analyses to derive insights from the smart meter data. Specifically, this includes bar plots of total energy imported/exported in various timeframes and heatmaps of energy data, alongside relevant statistical findings of energy consumption/generation to provide a deeper understanding of patterns. The automated PDF reports provide valuable information about trends, statistical findings, and seasonalities.
5. Data-Driven Energy Insights: Results
In this section, the data-driven insights for the microgrid under consideration are presented, along with results that demonstrate the potential that data-driven insights possess in the context of microgrids. The data utilized for this analysis were extracted after the 1-year-long operation of the microgrid and the physical and digital architecture. In the following sections, the quantitative results are presented, along with the methodology utilized to extract the insights.
5.1. Weekday vs. Weekend Profiles
Our initial data analysis focused on distinguishing operational irregularities in the microgrid during weekdays versus weekends. This microgrid, part of an educational facility, was anticipated to consume less energy over the weekend. Analyzing the collected data confirmed a marked difference in energy consumption patterns between these two periods. Specifically, the GSHP recorded high energy usage over the weekend, approximating almost 90% of the consumption seen during the weekdays. Further probing revealed that staff working over the weekend were inadvertently overheating not just their workspaces but the entire facility, including unused classrooms. Regarding the EV charger, data revealed that its median usage was lower over the weekend due to the reduced activity at the facility, although a typical pattern of evening charging was observed over both weekend evenings (i.e., Saturday and Sunday evenings). The results from this analysis are presented in
Figure 5. Our study found that, as an average, the GSHP was operational for at least one hour during 98.9% of the weekends. The average energy consumption during the weekend periods reached 89.3% of the average weekday usage. The average GSHP power consumption per hour during weekdays and weekends is presented in
Figure 5 (left). It is obvious that the consumption pattern is quite similar, and moreover, it can be observed that during 8 h of the 24 h day, the average hourly consumption is higher during the weekends (03:00–04:00, 07:00–08:00, etc.).
Similar patterns were detected for the EV charger; the EV was plugged in and charging the EV for at least an hour during 66% of the weekend. The energy consumption during the weekend periods represented 37.2% of the corresponding weekday energy consumption. These findings underscore the distinct energy usage patterns of these devices over weekdays and weekends. The daily average EV power consumption is presented in
Figure 5 (right). Although, the facilities were not operational, the daily average power used for charging was found to be 0.38 kW on Saturdays and 0.26 kW on Sundays.
5.2. Exploitation of Economy 7 Tariffs
Another significant market arrangement that was utilized as an input during the analysis was the presence of an Economy 7 tariff arrangement between the microgrid and the utility. Economy 7 is a tariff deployed in the UK market to incentivize the usage of electricity during “off-peak” periods, with a lower cost per unit of energy consumed. For the microgrid utilized in this work, the Economy 7 tariff off-peak period is 00:00 until 07:00, while the peak period (i.e., the period with a higher tariff per unit of energy consumed) is from 07:00 until 00:00. The data analysis demonstrated that the prevalent portion of the microgrid’s energy consumption occurred during the high-peak period (07:00–00:00), leading to increased costs and overall underutilized potential should a part of this demand be shifted in time and occur within the off-peak period.
Specifically, in
Figure 6, the power consumption/generation patterns for the monitored energy assets (ASHP, EV charger, GSHP, and PV) and the rest of the demand that is not monitored and is calculated indirectly (denoted as
P_Unknown and calculated by extracting the total consumption of the monitored assets from the consumption monitored at the microgrid mains while considering self-consumption for PV production) are depicted. From the data presented in
Figure 6, it is evident that the off-peak period is underutilized with the majority of the power being absorbed by the ASHP, EV charger, and GSHP during the peak period, after 07.00. For example, from a quantitative standpoint, the analysis showed that 70.6% of the GSHP demand over the whole year occurred during the peak period. The GSHP represents a significant proportion of the overall consumption, meaning that should the microgrid shift part of the load to the off-peak period, for example, by pre-heating the facilities or reducing the heating demand after working hours, the cost associated with the GSHP can be reduced.
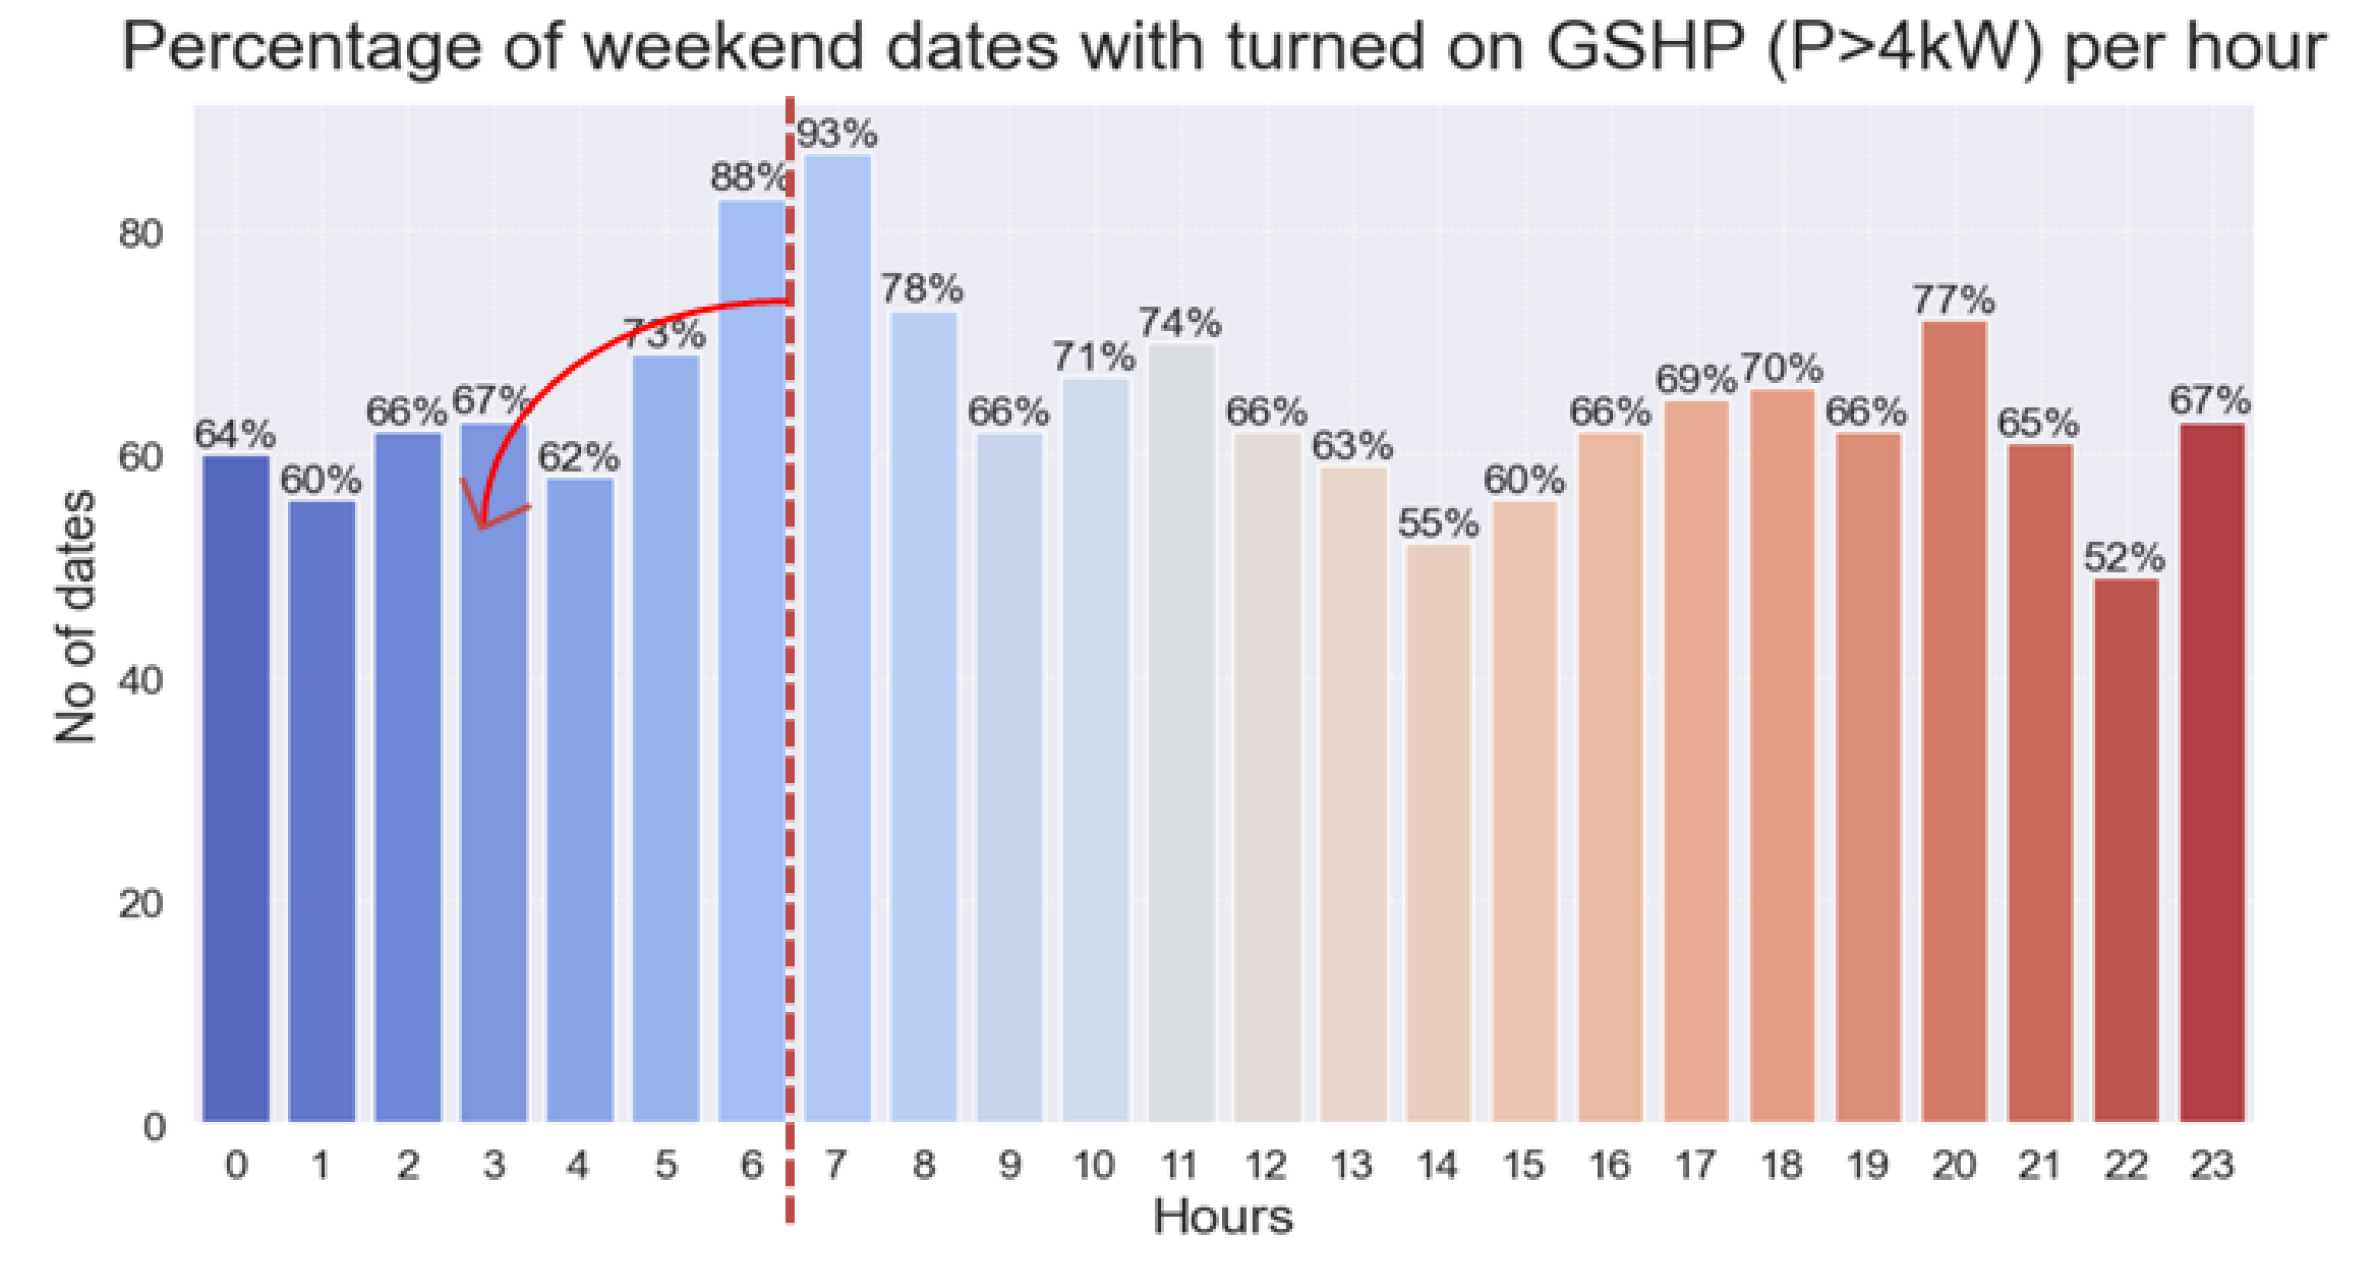
When focusing on the weekend peak and off-peak periods, the GSHP usage was also occurring mainly during peak periods. In
Figure 7, the percentage of weekend dates with GSHP utilization, calculated on an hourly basis, is presented. The results showcase a significant insight into GSHP utilization. The already-significant weekend GSHP utilization mainly occurred during peak periods (for example, 93% of weekend dates exhibited GSHP utilization between 07:00 and 08:00), introducing additional costs that could potentially be avoided.
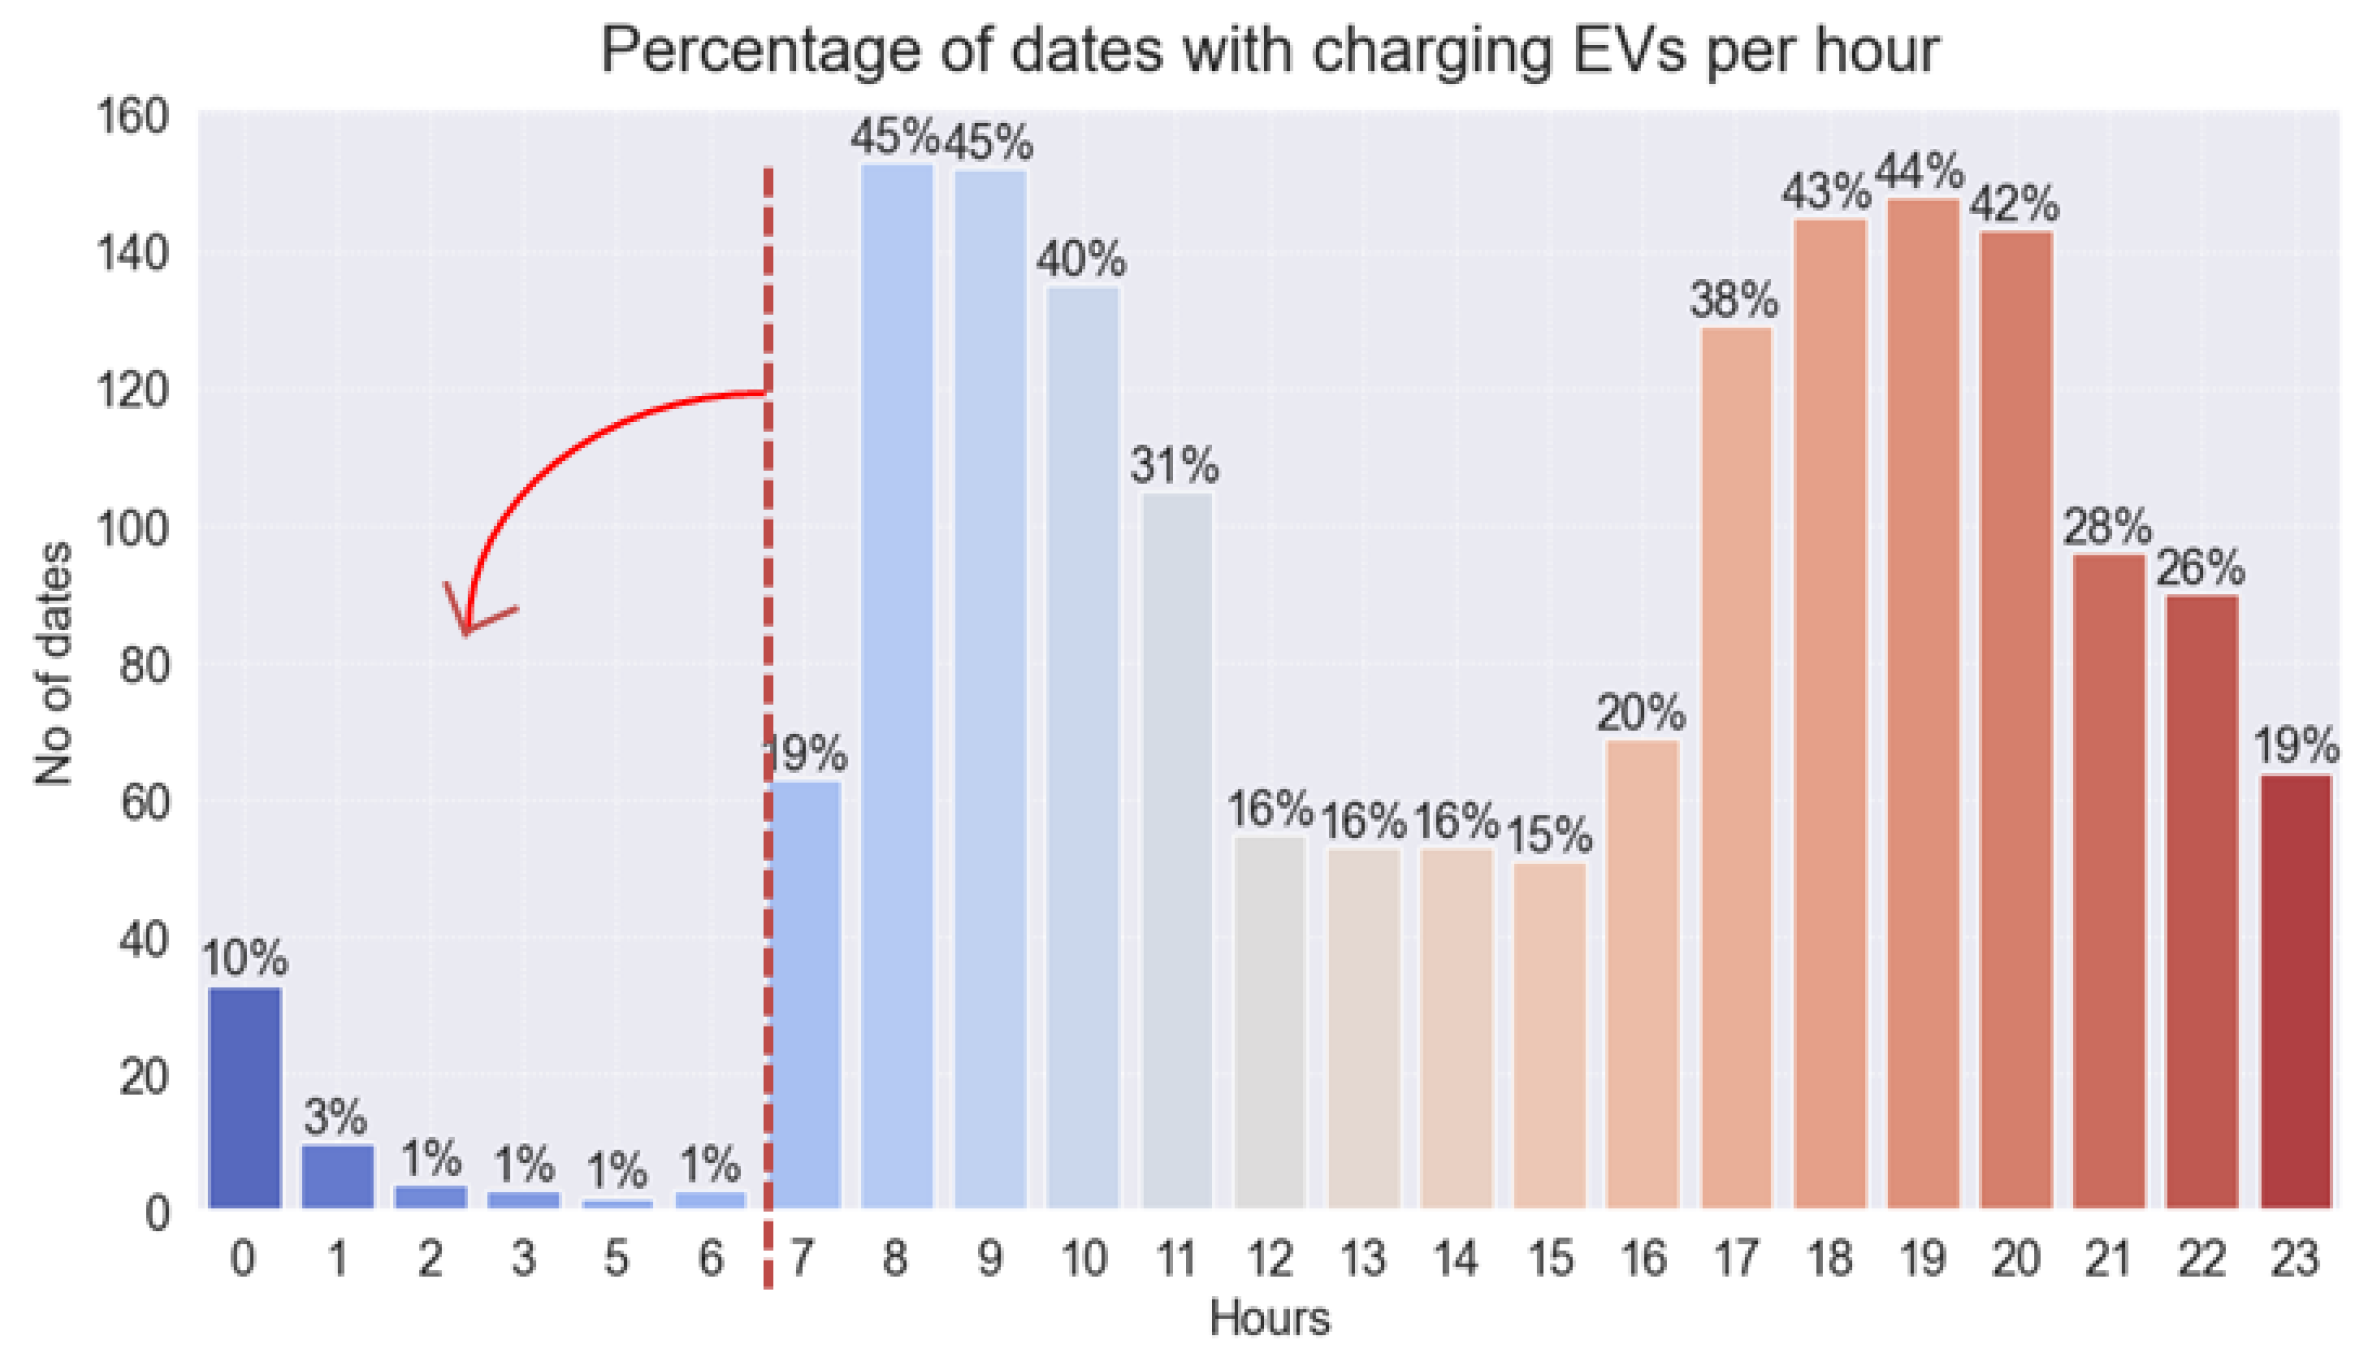
The percentage of dates with EV charging, calculated on an hourly basis, is presented in
Figure 8. EV charging was found to be the most evidently underexploited with respect to Economy 7 tariff incentives, as showcased by the predominant EV charging occurring right after the off-peak period. Specifically, 96.7% of EV charging was happening during peak periods.
Leveraging the detailed data collected by the edge intelligence, a recommendation was made to encourage the shifting of certain loads, such as EV charging and GSHP operation, to the off-peak period at night through direct or indirect control mechanisms. This strategic load shifting would not only maximize cost savings but also alleviate strain on the network during peak periods.
5.3. Consumption under PV Production
The final examined feature utilized by our data analytics algorithms is related to the market arrangement between the microgrid and the utility. Due to the nature of the arrangement, the microgrid has the incentive to maximize self-consumption, behind the meter, via PV production. In order to benefit from the arrangement, microgrid consumption should coincide with PV production to the greatest extent possible. The analysis revealed suboptimal utilization of that arrangement, as seen from the results exported for the summer period shown in
Figure 9. Note that PV production is higher during summer due to typically higher irradiance and temperatures, and hence, any potential underutilization of the incentive would be more cost-significant during the summer period. In
Figure 9, the hourly average power consumption and generation from the monitored energy assets, including the indirect calculation of the residual microgrid demand, denoted by
P_Unknown, is illustrated. It is evident that significant GSHP and residual demand is active outside the period of PV production, meaning that shifting this demand to coincide with PV production would produce additional financial benefits in the form of cost reduction for the microgrid.
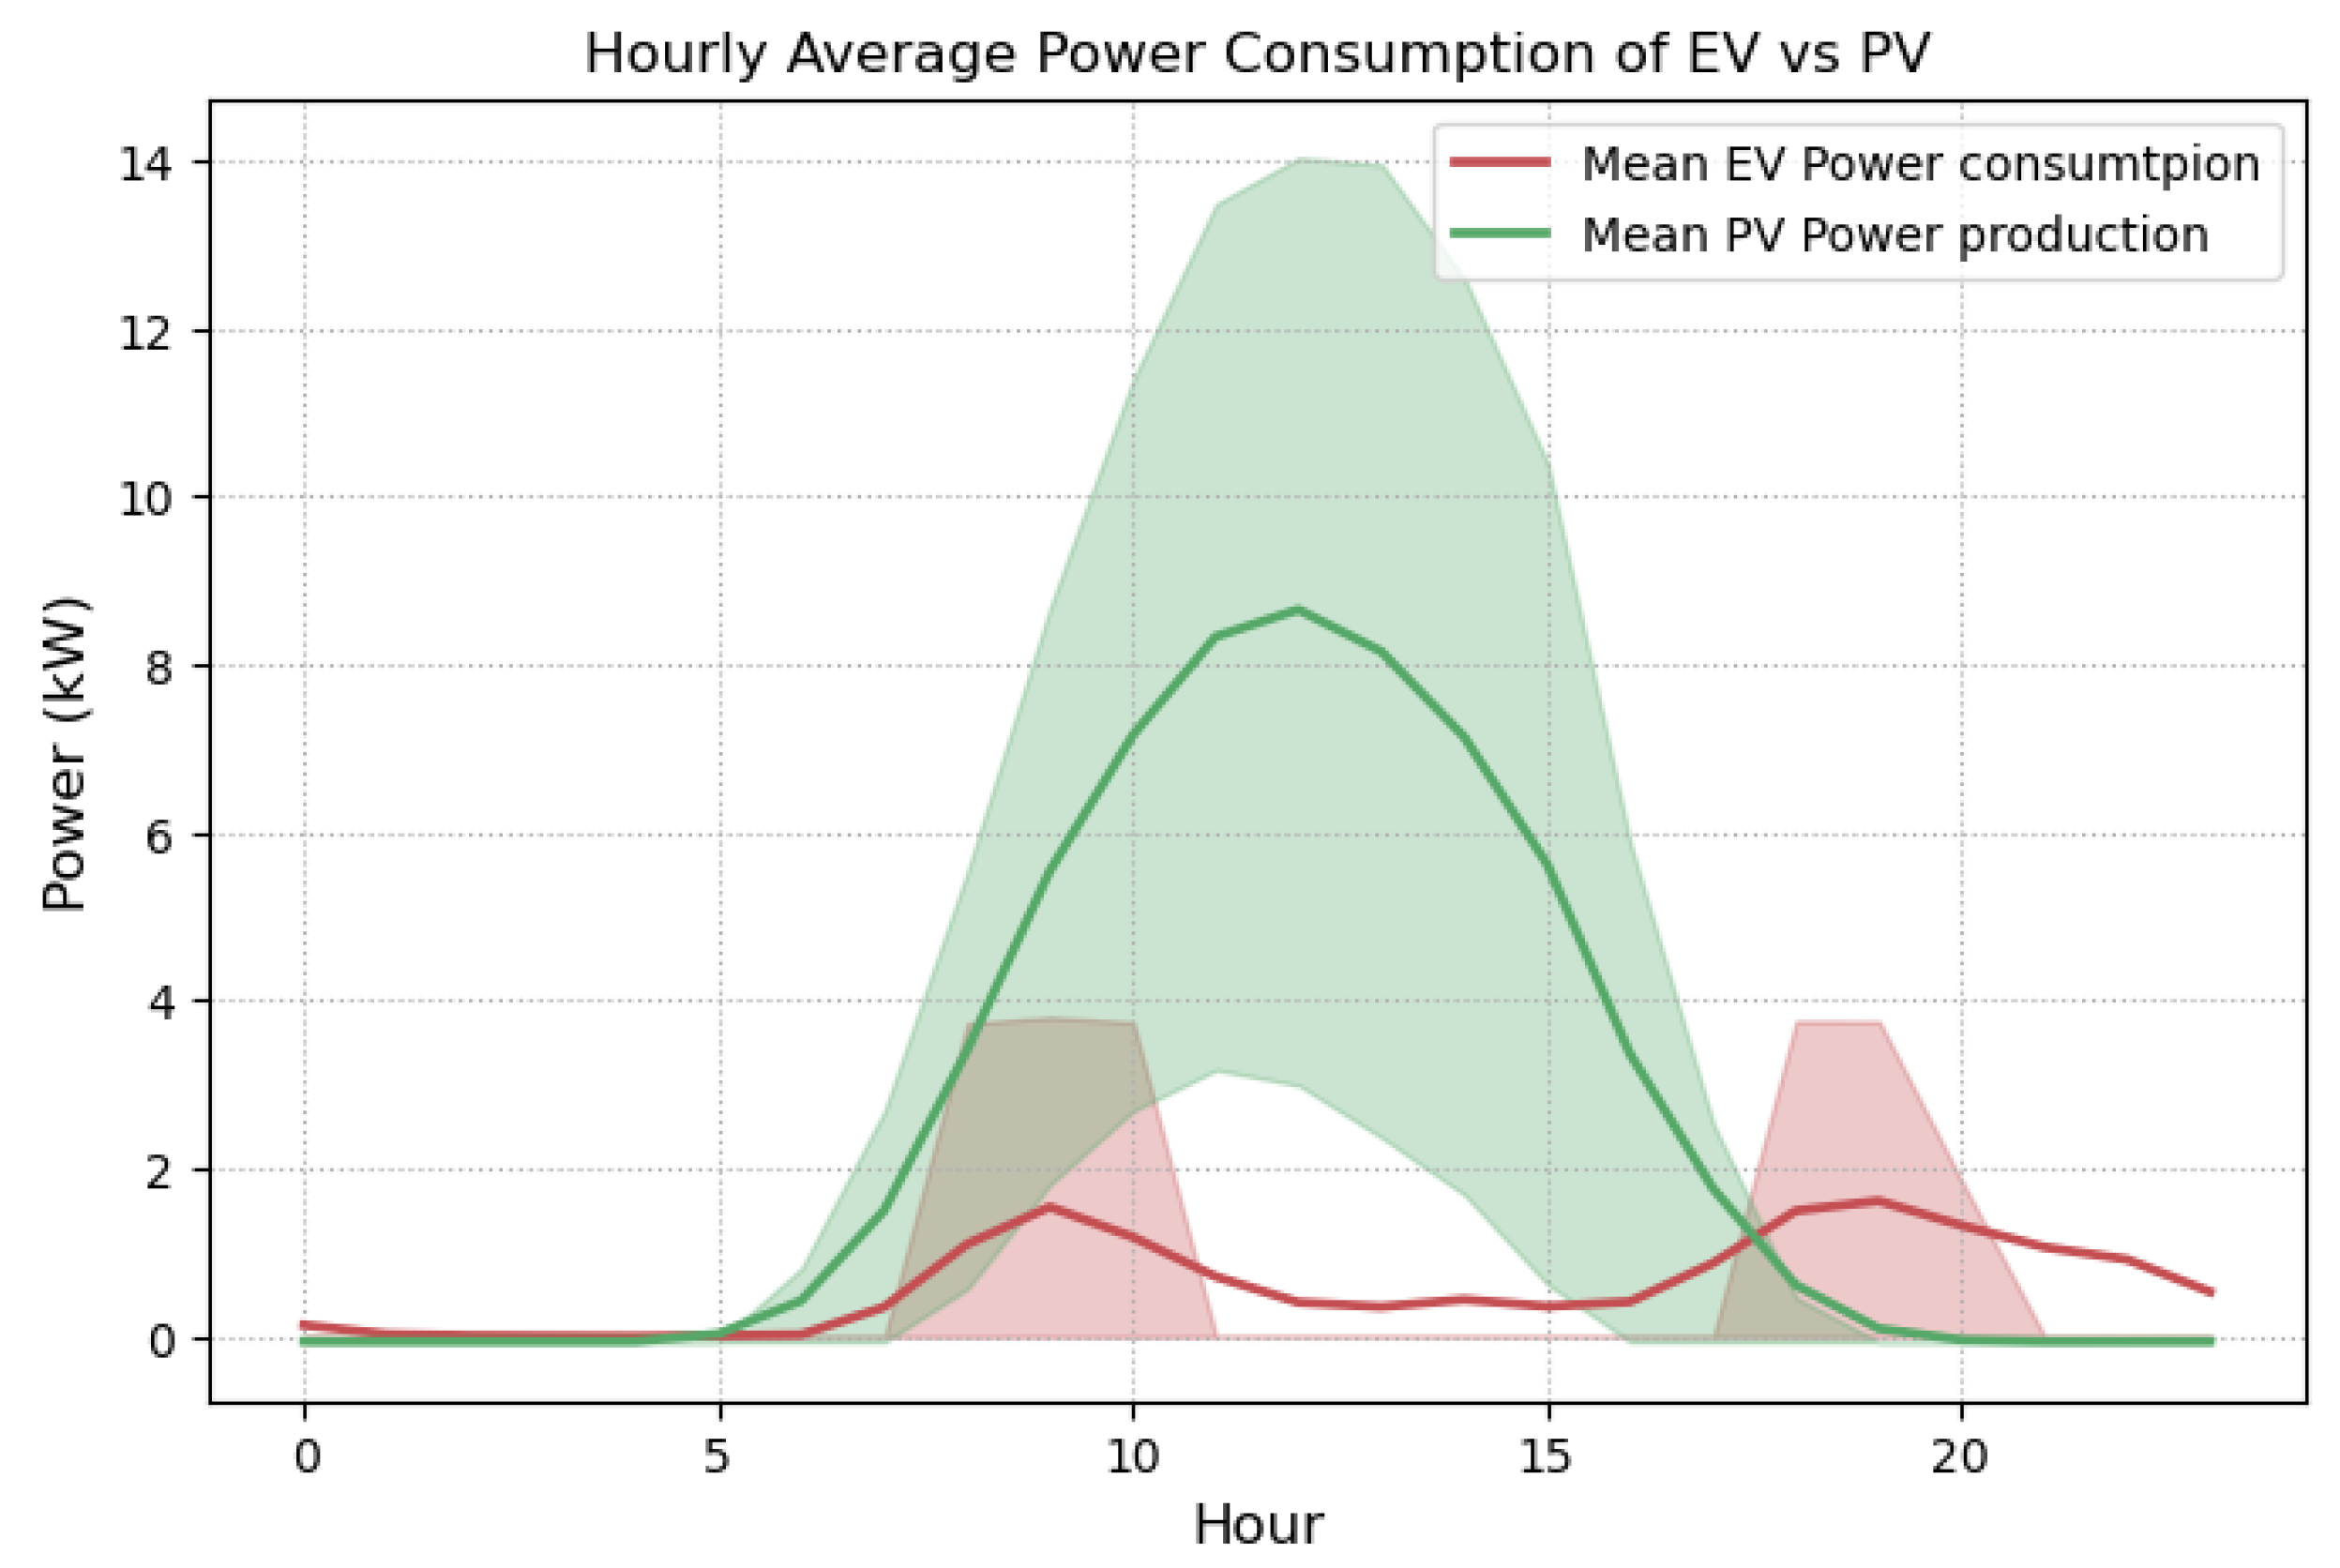
When solely analyzing the EV charger data, significant EV consumption occurring right after the end of PV production (refer to
Figure 10) was observed. The microgrid personnel was often plugging in the EV at around 17.00 to pre-charge it for the next working day, which, on average, was coinciding with the decrease in PV production.
Similarly, GSHP consumption was observed to peak before PV production, with another slightly lower peak being observed in the evening, as depicted in
Figure 11. The presence of this higher GSHP demand before and after PV production means that the incentive to maximize self-consumption through PV was not exploited by the GSHP activation schedule.
In addition to the qualitative analysis presented above, various quantitative results were also extracted from the data analysis and are presented below in order to provide a deeper understanding of and insights into the microgrid operation:
The GSHP was operational on 98.9% of weekend dates; the microgrid operator should utilize this information to investigate whether this consumption is necessary during non-working days.
Weekends’ GSHP consumption amounts to 89.3% of weekdays’ GSHP consumption; this insights exhibits the extent of GSHP utilization during the weekends, with similar actions required to investigate whether this consumption can be avoided.
On 66% of weekend dates, there was EV charging, meaning that there was some activity that required the EV to travel and then plug in for charging on the majority of the weekends. Weekends’ EV charging consumption equals 37.2% of weekdays’ EV charging consumption.
A total of 96.7% and 70.6% of the EV charging and GSHP load, respectively, is consumed outside the off-peak period, meaning that the majority of EV and GSHP consumption coincided with higher tariffs.
Assuming that control over solely the EV and GSHP was enabled and that the demand could be shifted in time to take advantage of the PV self-consumption incentive and the Economy 7 tariff, the following could be achieved:
The estimated total energy imported would be 104,996.8 kWh, comparing to the actual imported energy over a one-year period at 117,493.7 kWh;
An 18.4% reduction in the microgrid’s cost over the investigated 12-month period could be achieved.
The analysis of energy data insights derived from the microgrid highlighted key areas of untapped potential that could significantly reduce energy imports and, thus, lower costs and the CO2 footprint. The key points identified are related to addressing disparities in energy consumption between weekdays and weekends, implementing load-shifting strategies during peak periods, and aligning energy consumption with PV production curves. These findings demonstrate the power of data-driven analytics in identifying opportunities for the operational optimization of microgrids, contributing to a sustainable and efficient energy future. These findings serve as a valuable guide for other microgrid projects seeking to improve operational costs and energy efficiency.
6. Discussion and Conclusions
Despite microgrids being investigated and deployed at scale over the past decade, a significant lack of research on the practical implementation of data analytics can be observed. As a result, microgrids are often underutilized, meaning that untapped potential is not being capitalized on from financial and environmental standpoints. This paper demonstrates the practical implementation of an end-to-end physical and digital architecture that enables the collection, processing, and analysis of data stemming from a microgrid using smart meter data at high sampling rates and thus provides a benchmarked solution for microgrid applications. Specifically, a complete physical architecture based on typically already-available hardware components has been employed to interface with the energy assets of the microgrid. From a software standpoint, the proposed local algorithms have been deployed in cybersecure, scalable, and flexible Docker containers to further enhance the replicability and adoption of the scheme. In addition, a holistic cloud-based scheme has been deployed utilizing AWS cloud computing resources in order to realize multiple tasks relating to data collection, organization, processing, compliance, transformation, and, most importantly, analysis and insight extraction. The latter is accomplished through a unique combination and utilization of AWS services, tailored to the technical characteristics of the microgrid and the nature of the data used. The architecture is further enhanced by a tailored cloud-hosted dashboard and an automatic reporting mechanism, demonstrating unique merits for microgrid owners, operators, and other stakeholders. The mechanism proposed, deployed in a real-world microgrid in Brighton, UK, was employed to extract data analytics with respect to long-term operational trends that were captured through the data analytics tools developed and documented via the proposed automatic reporting toolbox.
The current research presents a practical and adaptable digital architecture for data analytics in microgrids, making significant contributions to both academic and industrial realms. We have successfully deployed and validated this architecture within a live microgrid setting. The real-world application of our design has underscored its potential to transform microgrid operation and management practices by revealing untapped potential and informing decision making. Moving forward, the authors aim to augment the proposed framework by incorporating an optimization and control mechanism. This system would leverage the insights extracted from our data analytics toolbox to make informed, automated control decisions, thus maximizing the efficiency of microgrid operations.
Moreover, our architecture has far-reaching applicability beyond the single microgrid where it was implemented. Given the universality of the challenges and opportunities present in various microgrids worldwide, we anticipate that our architecture could be adopted and adapted to suit different geographical, climatic, and load conditions. This architecture, when incorporated with locally suitable energy resources, holds immense potential to improve microgrid management and optimize energy usage. Finally, as the volume of data increases with the expansion of the microgrid and the addition of new IoT devices, the demand for computational resources and storage capacity will also escalate. This could potentially pose a challenge in scenarios where these resources are constrained. Future research and development efforts could also focus on exploring more efficient data handling and processing techniques to address this concern, further enhancing the architecture’s scalability and performance in varied real-world scenarios.


 ,
, 