Article

A Mass-In-Mass Metamaterial Design for Harvesting Energy at a Broadband Frequency Range

1
Department of Mechanical Engineering, Georgia Southern University, Statesboro, GA 30458, USA
2
Department of Mechanical Engineering, Wisconsin University, Green Bay, WI 53706, USA
*
Authors to whom correspondence should be addressed.
Energies 2023, 16(16), 5883; https://doi.org/10.3390/en16165883
Submission received: 23 May 2023 / Revised: 20 July 2023 / Accepted: 4 August 2023 / Published: 9 August 2023

Abstract

:
A novel deterministic method to harvest energy within a broadband frequency (0~25 kHz) from a mass-in-mass metamaterial is presented herein. Traditional metamaterials are composed of multiple materials (named as resonators and matrix) with different mechanical properties (e.g., stiffness, density). In this work, the stiffnesses of matrix materials are altered systematically to allow diversified property mismatches between the constituent components to introduce local resonance in the unit cell. While local resonance leverages wave energy passing through the acoustic metamaterials trapped within the relatively soft matrix as dynamic strain energy, a strategic and deterministic methodology is investigated to obtain a broadband local resonance frequency. The frequency band can then be utilized to harvest the trapped energy by embedding a smart material inside the matrix which is capable of electromechanical transduction (e.g., lead zirconate titanate). This concept has been proved numerically by harvesting energy at a broadband frequency with a power density of ~10 μW/in2. Finally, an experimental study is performed to prove the hypothesis proposed in this article.

1. Introduction

The concept of low-power energy harvesters has been well-researched and transformed into many practical applications over the last decades [1,2,3,4,5,6,7]. To extract energy from the environment, scientists have been employing piezoelectric beams or cantilever-based geometry. The physics of structural resonance at a certain frequency is utilized by conventional energy harvesters to extract dynamic strain energy. Recently, researchers are interested in broadband energy harvesting using linear or non-linear vibration mechanisms [8,9]. In this regard, manmade metamaterials are considered as potential energy harvesting tools.
In recent decades, electromagnetic metamaterials [10,11,12,13,14,15,16,17] have been the subject of extensive research to make use of their intriguing properties, such as bandgap [18], wave guiding, one-way energy transmission, and so on. Following the photonic footprint, elastodynamic metamaterials or phononic crystals [19,20,21,22,23] have been developed and used to extract numerous useful features in kilo- or Mega-Hertz range applications. Band gap and local resonance band manipulation in acoustic metamaterials are being exploited for energy harvesting applications [24,25]. It is well-established that either local resonance or Bragg scattering cause frequency band gaps in metamaterials. While conventional high-frequency stop bands can be formed by multiple scattering (Bragg) of the periodic inclusions [26,27,28,29,30,31], low-frequency vibrations can be created or manipulated by adding locally resonant components to the phononic crystals [31,32,33,34,35]. Since the local resonance bands are the portals for the localized trapping of wave energy, these locally resonant metastructures enable band gaps at wavelengths much longer than the lattice size, and this technique is becoming a good choice for efficient energy harvesting [36,37,38,39,40]. Sugino et al. [41] proposed a prototype of a locally resonant energy harvesting metastructure containing several small cantilever beams with tip masses acting as mechanical resonators. Despite the need for harvesting energy at broadband frequencies, most of the reported works focus on harvesting energy at a specific frequency.
To overcome these limitations, in this study, a mass-in-mass system (MIMS) is proposed to harvest energy at broadband frequencies [42,43]. MIMS, an acoustic metamaterial with engineered inclusions, is frequently used as a predictive tool to manipulate band gaps and local resonances in elastodynamic problems. It is a specific type of acoustic metamaterial design that utilizes nested masses to achieve desired acoustic properties. It is a structural arrangement where smaller masses are embedded within larger masses, creating a hierarchical structure that influences the propagation of sound waves and enhances local resonance characteristics. Usually, a locally resonant medium consists of a heavy core embedded into a soft matrix. We have hypothesized that the local resonance in matrix material allows for a weakly dispersive zone (WDZ) with a high density of states which can be pivoted to harvest energy at broadband frequencies. In many studies, the size effect and/or volumetric dependency of the local resonators on the respective band gaps are reported [26,44]; however, the manipulation of matrix properties on frequency bands has not been studied extensively. Therefore, in this study, the possibilities of manipulating frequency bands through the alteration of the matrix properties have been explored. Furthermore, the effect of stiffness of the softer materials in an MIMS is investigated in a systematic manner to observe its influence on broadband energy harvesting capabilities.

2. Model Configurations and Computational Approach

In this study, a 2-dimensional MIMS is considered to induce local resonance phenomena in the unit cell. These phenomena can trap elastic energy locally which can then be harvested as usable electric energy. Therefore, the design of the unit should contain geometric features and material combinations that are sufficient to induce local resonance. In this respect, a multi-layered MIMS with repetitive mismatch in material properties is proposed to achieve local resonance at a wider range of frequency. To design a 1 in2 unit cell, initially, a heavy core (R1) is placed inside a circular ring (R2). A softer material (M1), say, rubber, is used to seal the space between R1 and R2. A similar MIMS was also proposed by Huang et al. [43]. However, an elliptical ring (R3) is added at the center of the unit cell to further enhance the anisotropic property of the system (Figure 1a). Finally, the unit cell is placed in a 1 × 1 square inch matrix. The material properties and dimensions of the components in the unit cell are listed in Table 1.
Since the stiffness mismatch between the mating components in a unit cell is a key factor to generate local resonance, in this work, the stiffnesses of the matrices (M1–M3) are varied systematically with an objective to harvest energy at broadband frequencies. In this process material properties of the resonating components (R1–R3) are kept unchanged while the stiffness ratios between adjacent components are varied. For better comparison and comprehension, only one matrix’s stiffness is altered in a single investigation set, while the stiffnesses of the other two matrices are unaffected. For example, if the property of M1 is to be varied, the properties of the other two matrices (M2 and M3) are kept constant. Similarly, if the property of M2 is to be varied, M1’s and M3’s properties remain constant.

3. Determination of Dispersion Curves

Due to the complexity of the analytical formulation of the unit cell, the Finite Element Method is adopted for dispersion analysis [45]. By periodically arranging the unit cells, the entire structure is considered infinite in both the x and y directions. Therefore, at each of the unit cell’s boundaries, the Bloch–Floquet periodic [30,31] boundary condition is applied. It can be noted that the Bloch–Floquet periodic boundary condition assumes infinite repetition of the geometries in the periodic direction. These boundary conditions are based on the Floquet theory applicable for small-amplitude vibrations of spatially periodic structures. The theory states that the solution can be sought in the form of a product of two functions. One follows the periodicity of the structure, while the other follows the periodicity of the excitation. The problem can be solved on a unit cell of periodicity by applying the corresponding periodicity conditions to each of the two components in the product. The generalized wave equation in a composite material can be written as:
C i j k l x m u k , l ( x m , t ) + u l , k ( x m , t ) + f i x m = ρ x m u i ¨ ( x m , t )
where the constitutive matrix, C i j k l , containing material properties and the density, ρ , of the system are the functions of space x m ( m = 1 ,   2 ) . Let the body force f x m be constant. Assuming no periodicity along the x 3 direction and decoupling the phase component, the displacement solution can be found as follows:
u i x m , t = n 2 n 1 A i n 1 n 2 exp i k m x m · exp i G m x m · exp i k 3 x 3 · exp ( i ω t )
where   k m and G m are the wave number and the component of the reciprocal lattice vector along m -th direction, respectively. Here, m takes the values 1 and 2. G m can be expressed as G m = 2 π n m / D m , where D m is the periodicity of the cells in the m -th direction. The A i n 1 n 2 is the amplitude of the wave modes for particle displacement along i , and n 1   and   n 2 are the integer numbers between   and   + . After substituting Equation (2) in Equation (1), one can obtain the Bloch eigen value problem as:
ω 2 ρ ( x m ) n 2 n 1 A i n 1 n 2 exp i k m + G m x m 1 2 C i j k l x m k m + G m 2 δ m j [ n 1 n 2 A k n 1 n 2 exp ( i ( k l + G l ) x l ) + n 1 n 1 A l n 1 n 2 exp i k k + G k x k ] = 0
Equation (3) is then multiplied with the Bloch operator with Bloch transformed weighting factor and integrated over the entire domain. After applying periodic boundary conditions, the weak form of the Bloch equation is solved only within the irreducible Brillouin Zone (BZ) [46]. In the reciprocal space or in k-space, the center of the unit cell is denoted by the letter Γ , whereas the horizontal edge and the corner points are denoted by X and M, respectively (Figure 1a). Furthermore, the number of amplitudes in the Equation (3) is reduced for each wave number (k) point. Thus, the n 1   and   n 2 are reduced from infinity, and the truncated set of Bloch mode expansions [47] are used in the solution method. Based on the periodic lattice’s high symmetry points, the appropriate reduced order basis function is chosen. Next, the Finite Element discretization is performed using triangular elements. Based on a series of convergence studies, the elements’ sizes are kept to a minimum of 1/10 of the corresponding minimum wavelength occurring in any material type. The Bloch displacement amplitudes are discretized using an isoparametric shape function ( N i ( x ) ) suitable for the triangular elements for each combination of n 1   and   n 2 in their truncated series, as follows:
A n 1 n 2 = i = 1 3 N i x Ʌ i
Applying the discretization equations and periodic boundary conditions, the weak form of the Bloch equation reduces to an algebraic eigenvalue problem K k ω 2 M V ~ = 0 , where V ~ is the discrete Bloch amplitude vector, which is periodic within the unit cell. The K(k) and M are the global stiffness and mass matrices, respectively, obtained by integrating the element-level matrices. Detailed expressions for K and M can be found in reference [47]. The solutions of the eigen value problem provide the dispersion curves for the proposed periodic media. In this study, the solutions are determined using the commercial FEM solver COMSOL Multiphysics, and the results are processed using MATLAB. The dispersion relation of irreducible BZ is shown in Figure 1b. Note that the wave vector is normalized by the length of the unit cell ‘a’.
Figure 1. (a) Unit cell constituents and Brillouin zone, (b) dispersion curve, red rectangle captures the presence of local resonance frequency, (c) normalized density of states, (d) displacement mode shape ‘s’, (e) mode ‘p’ indicated in dispersion relation.
Energies 16 05883 g001

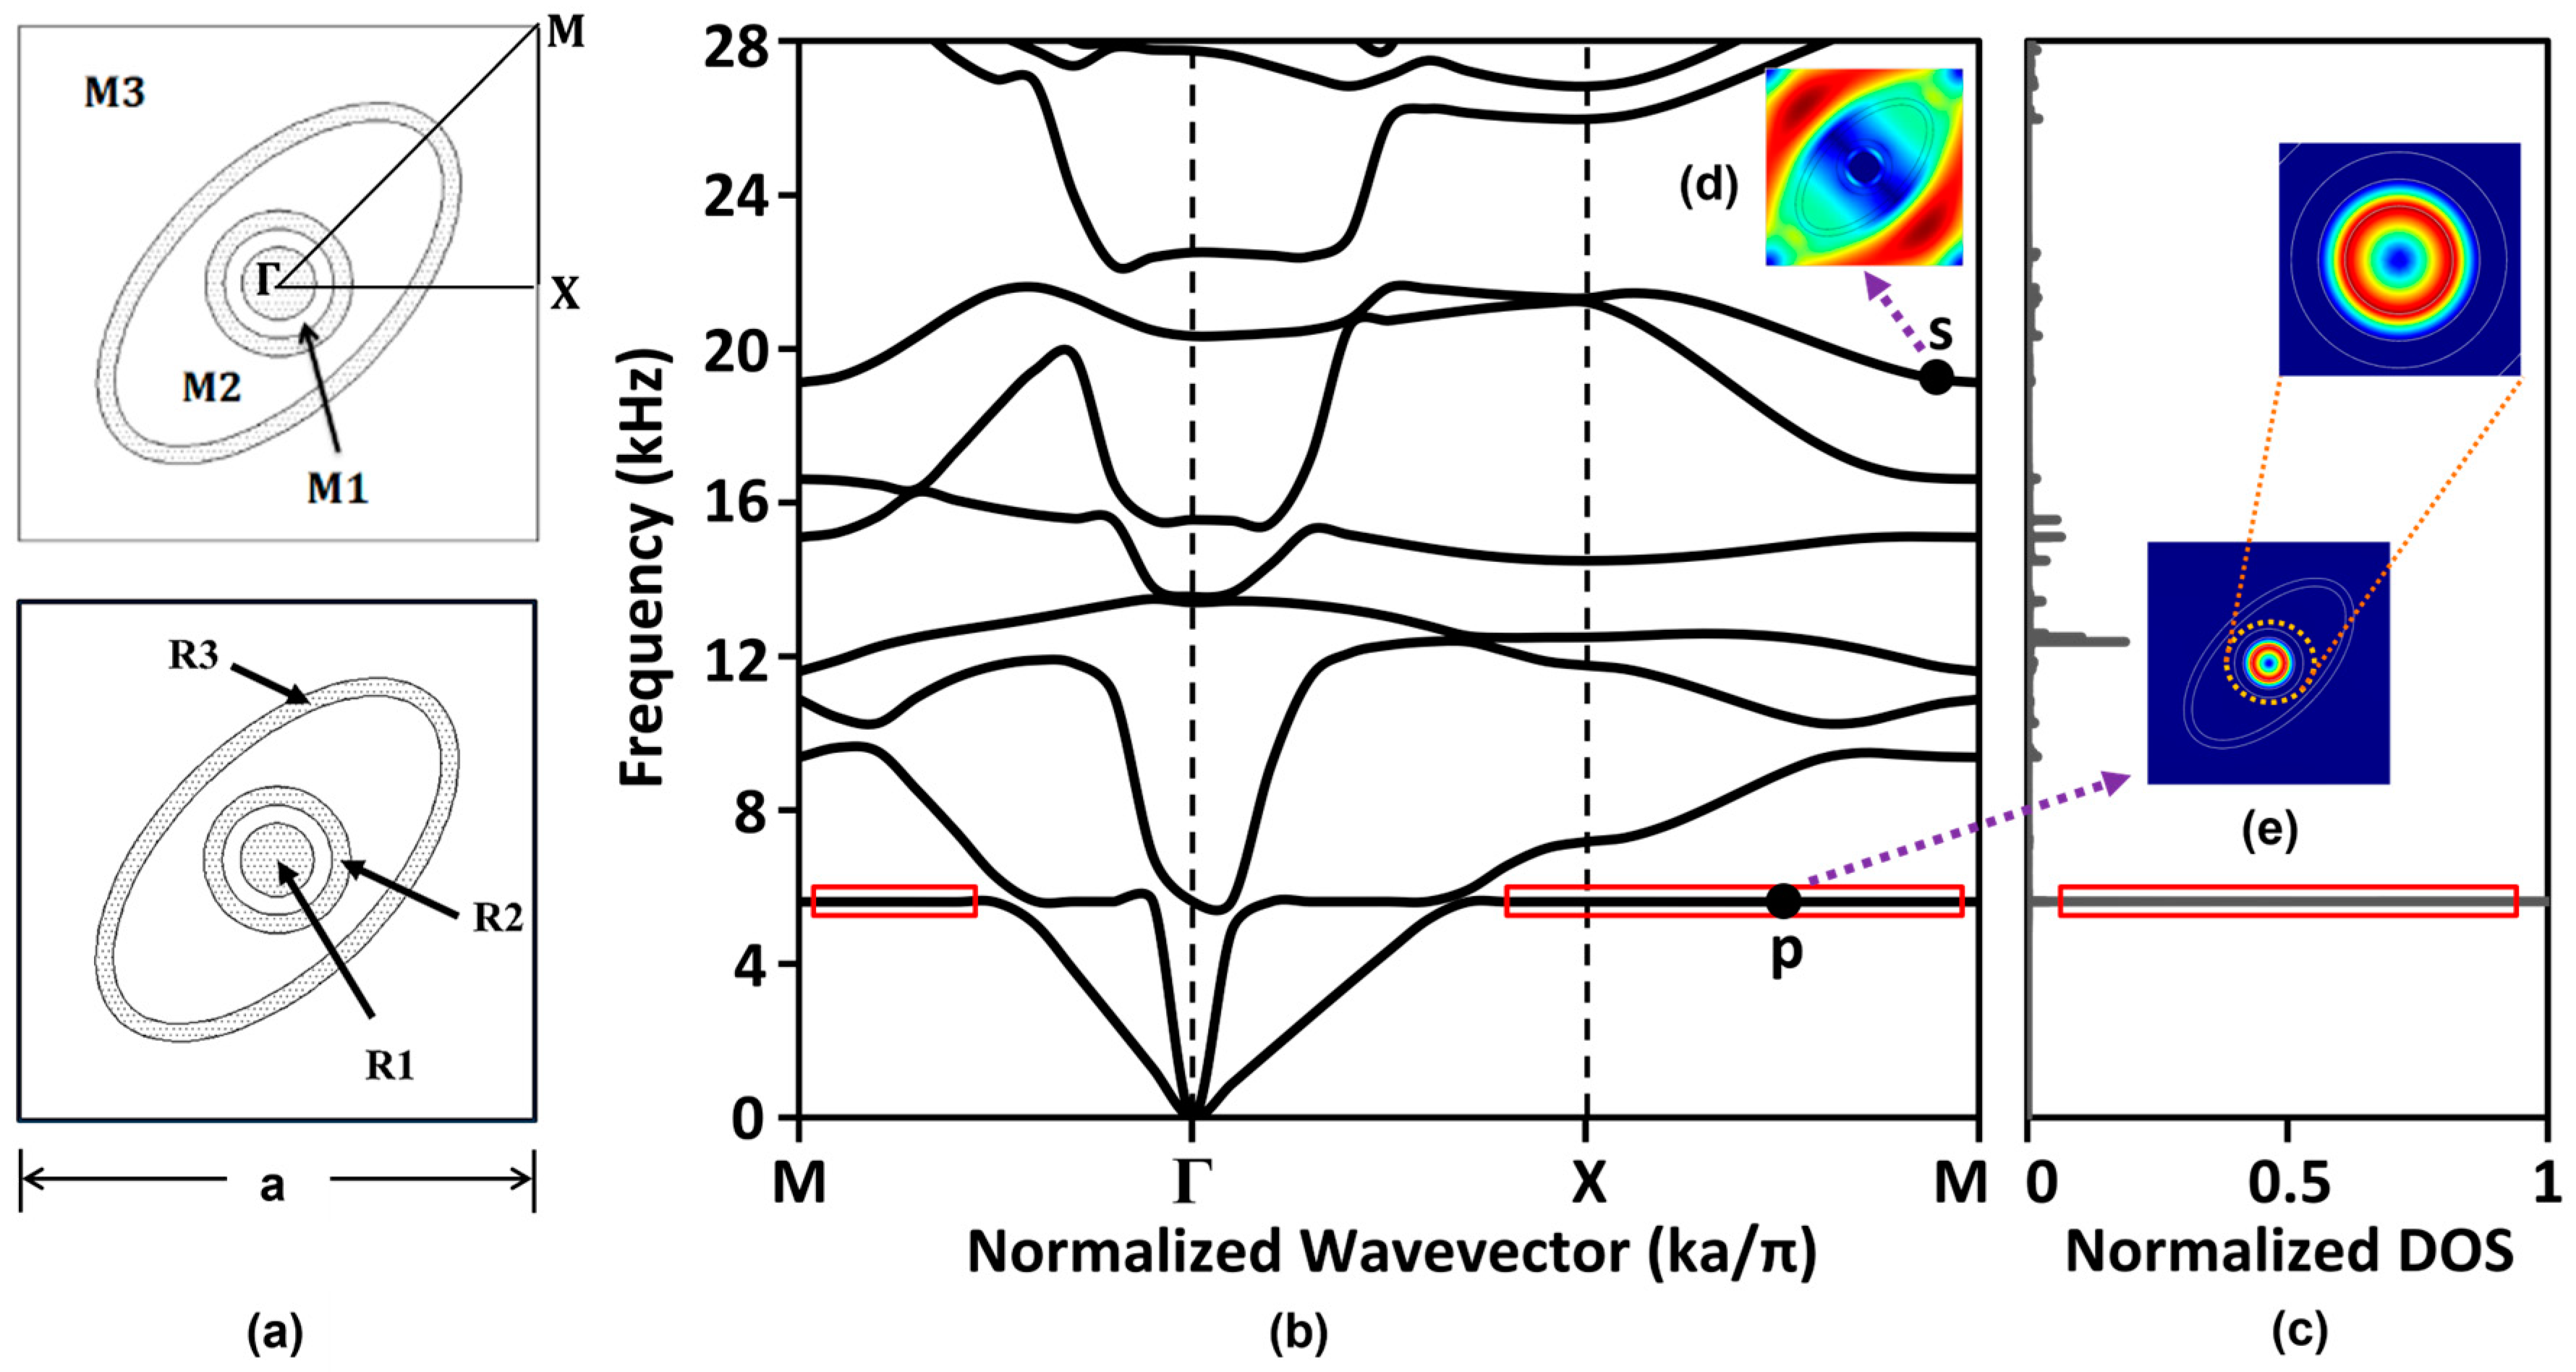
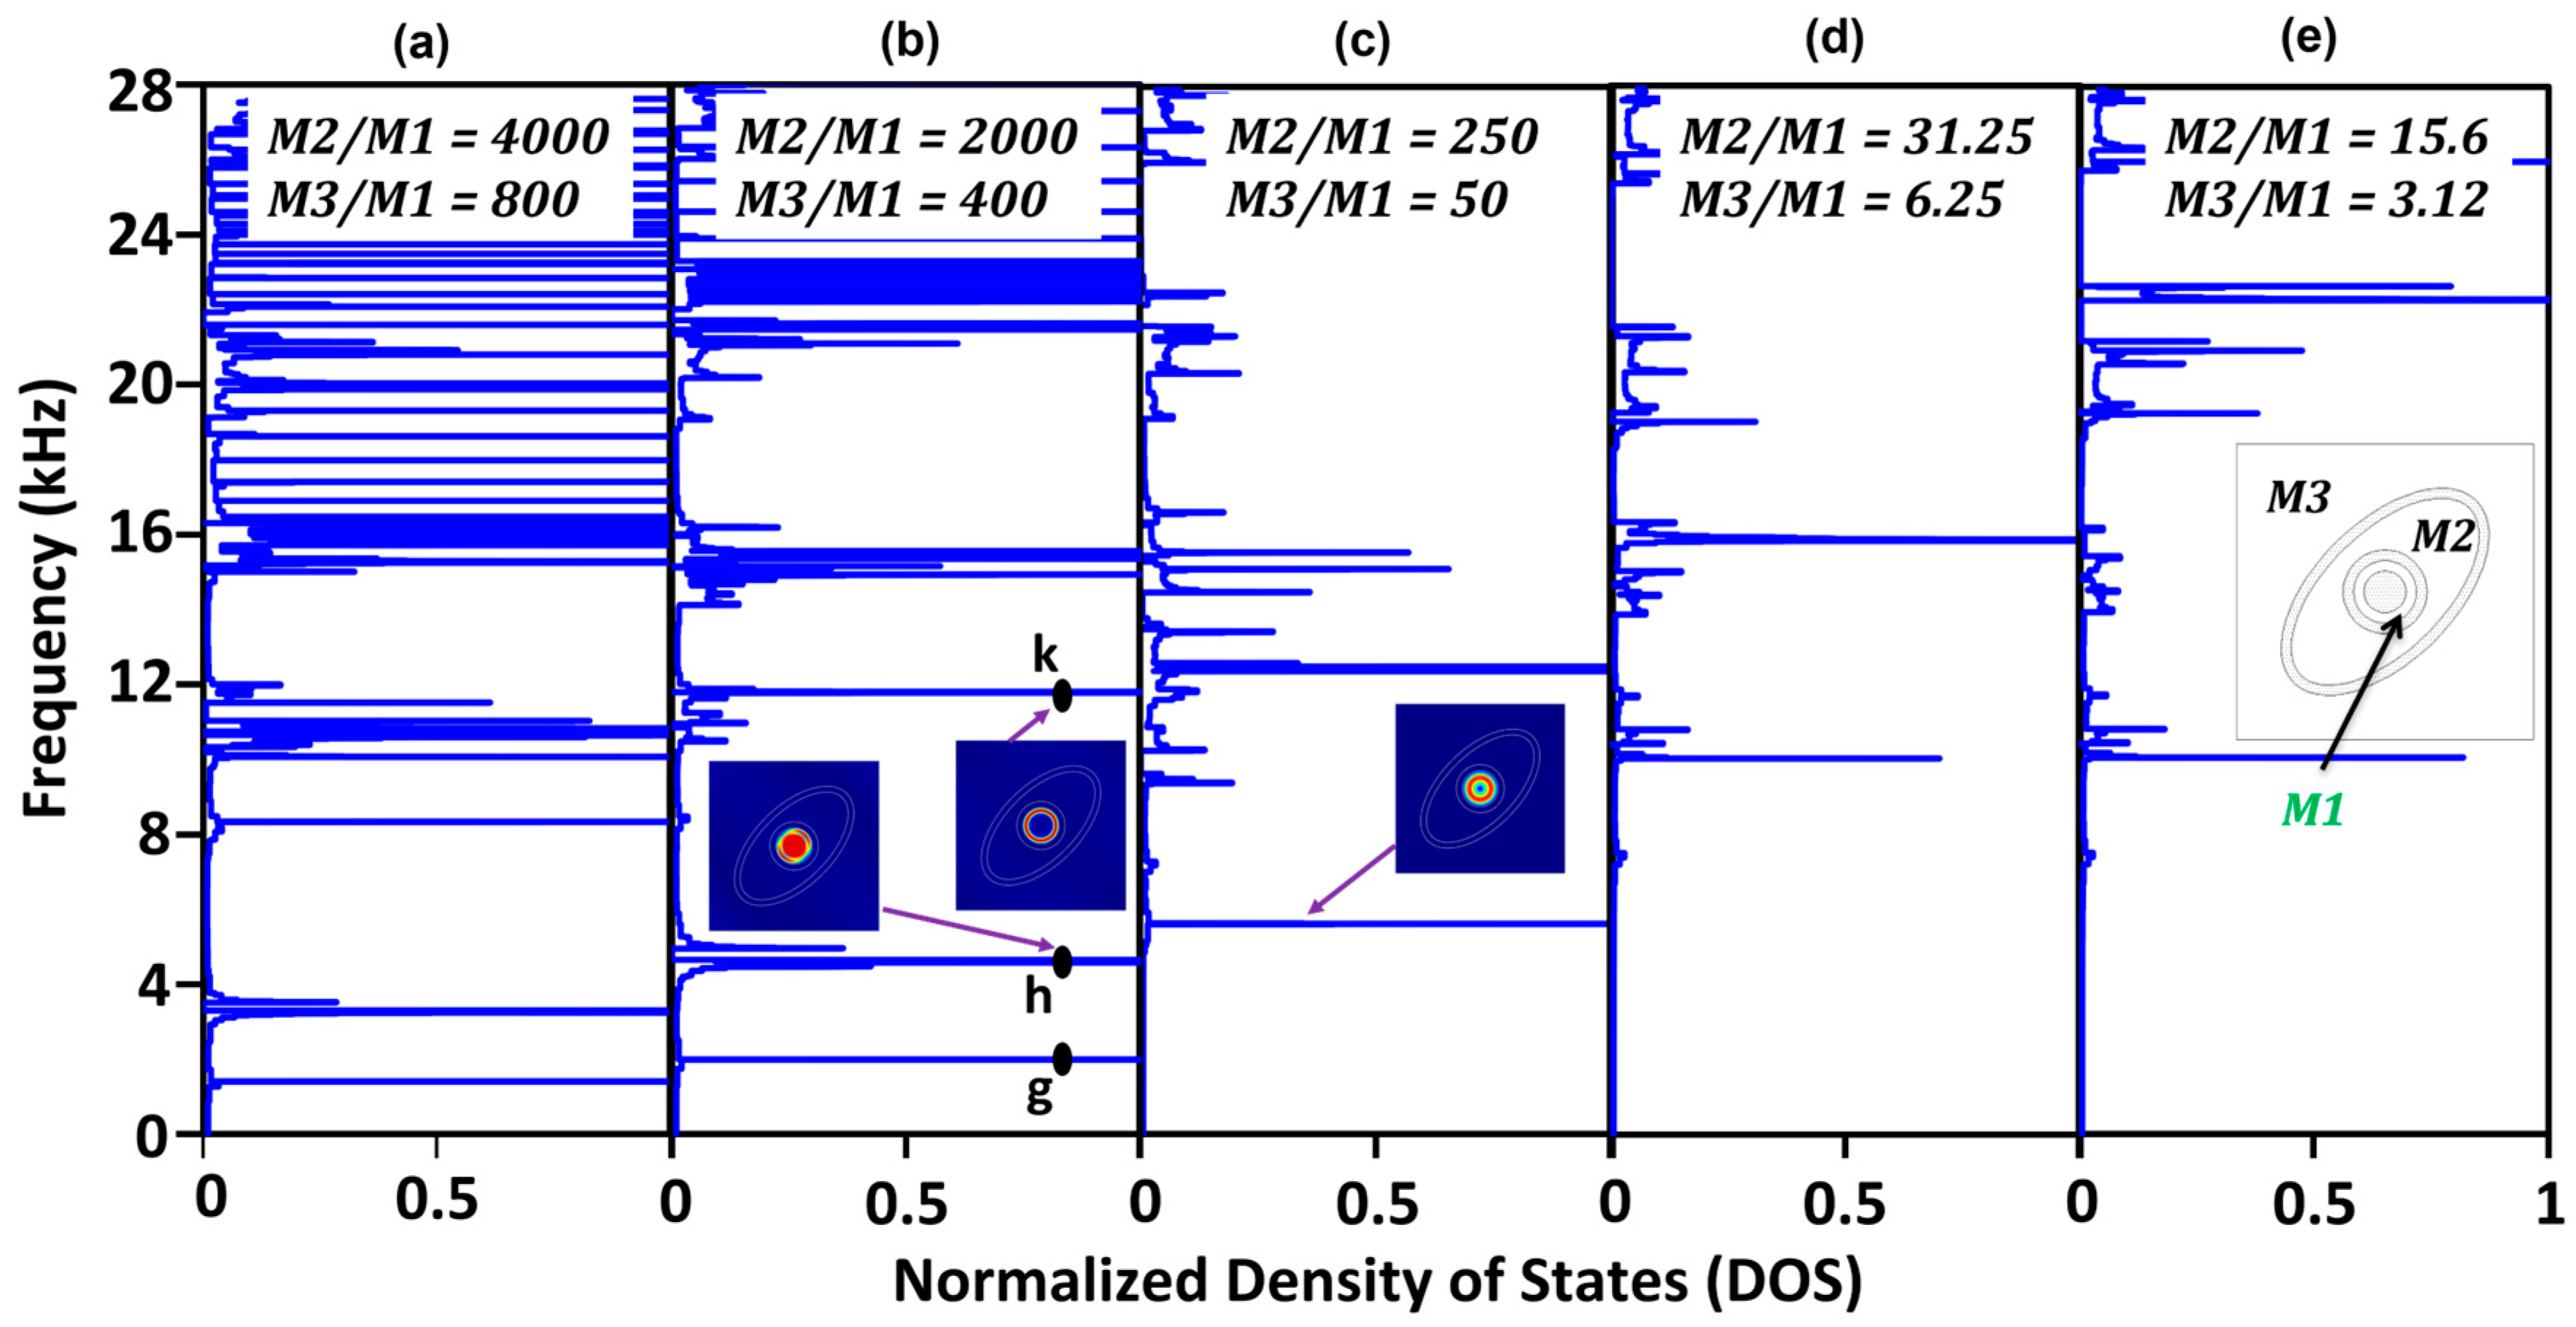
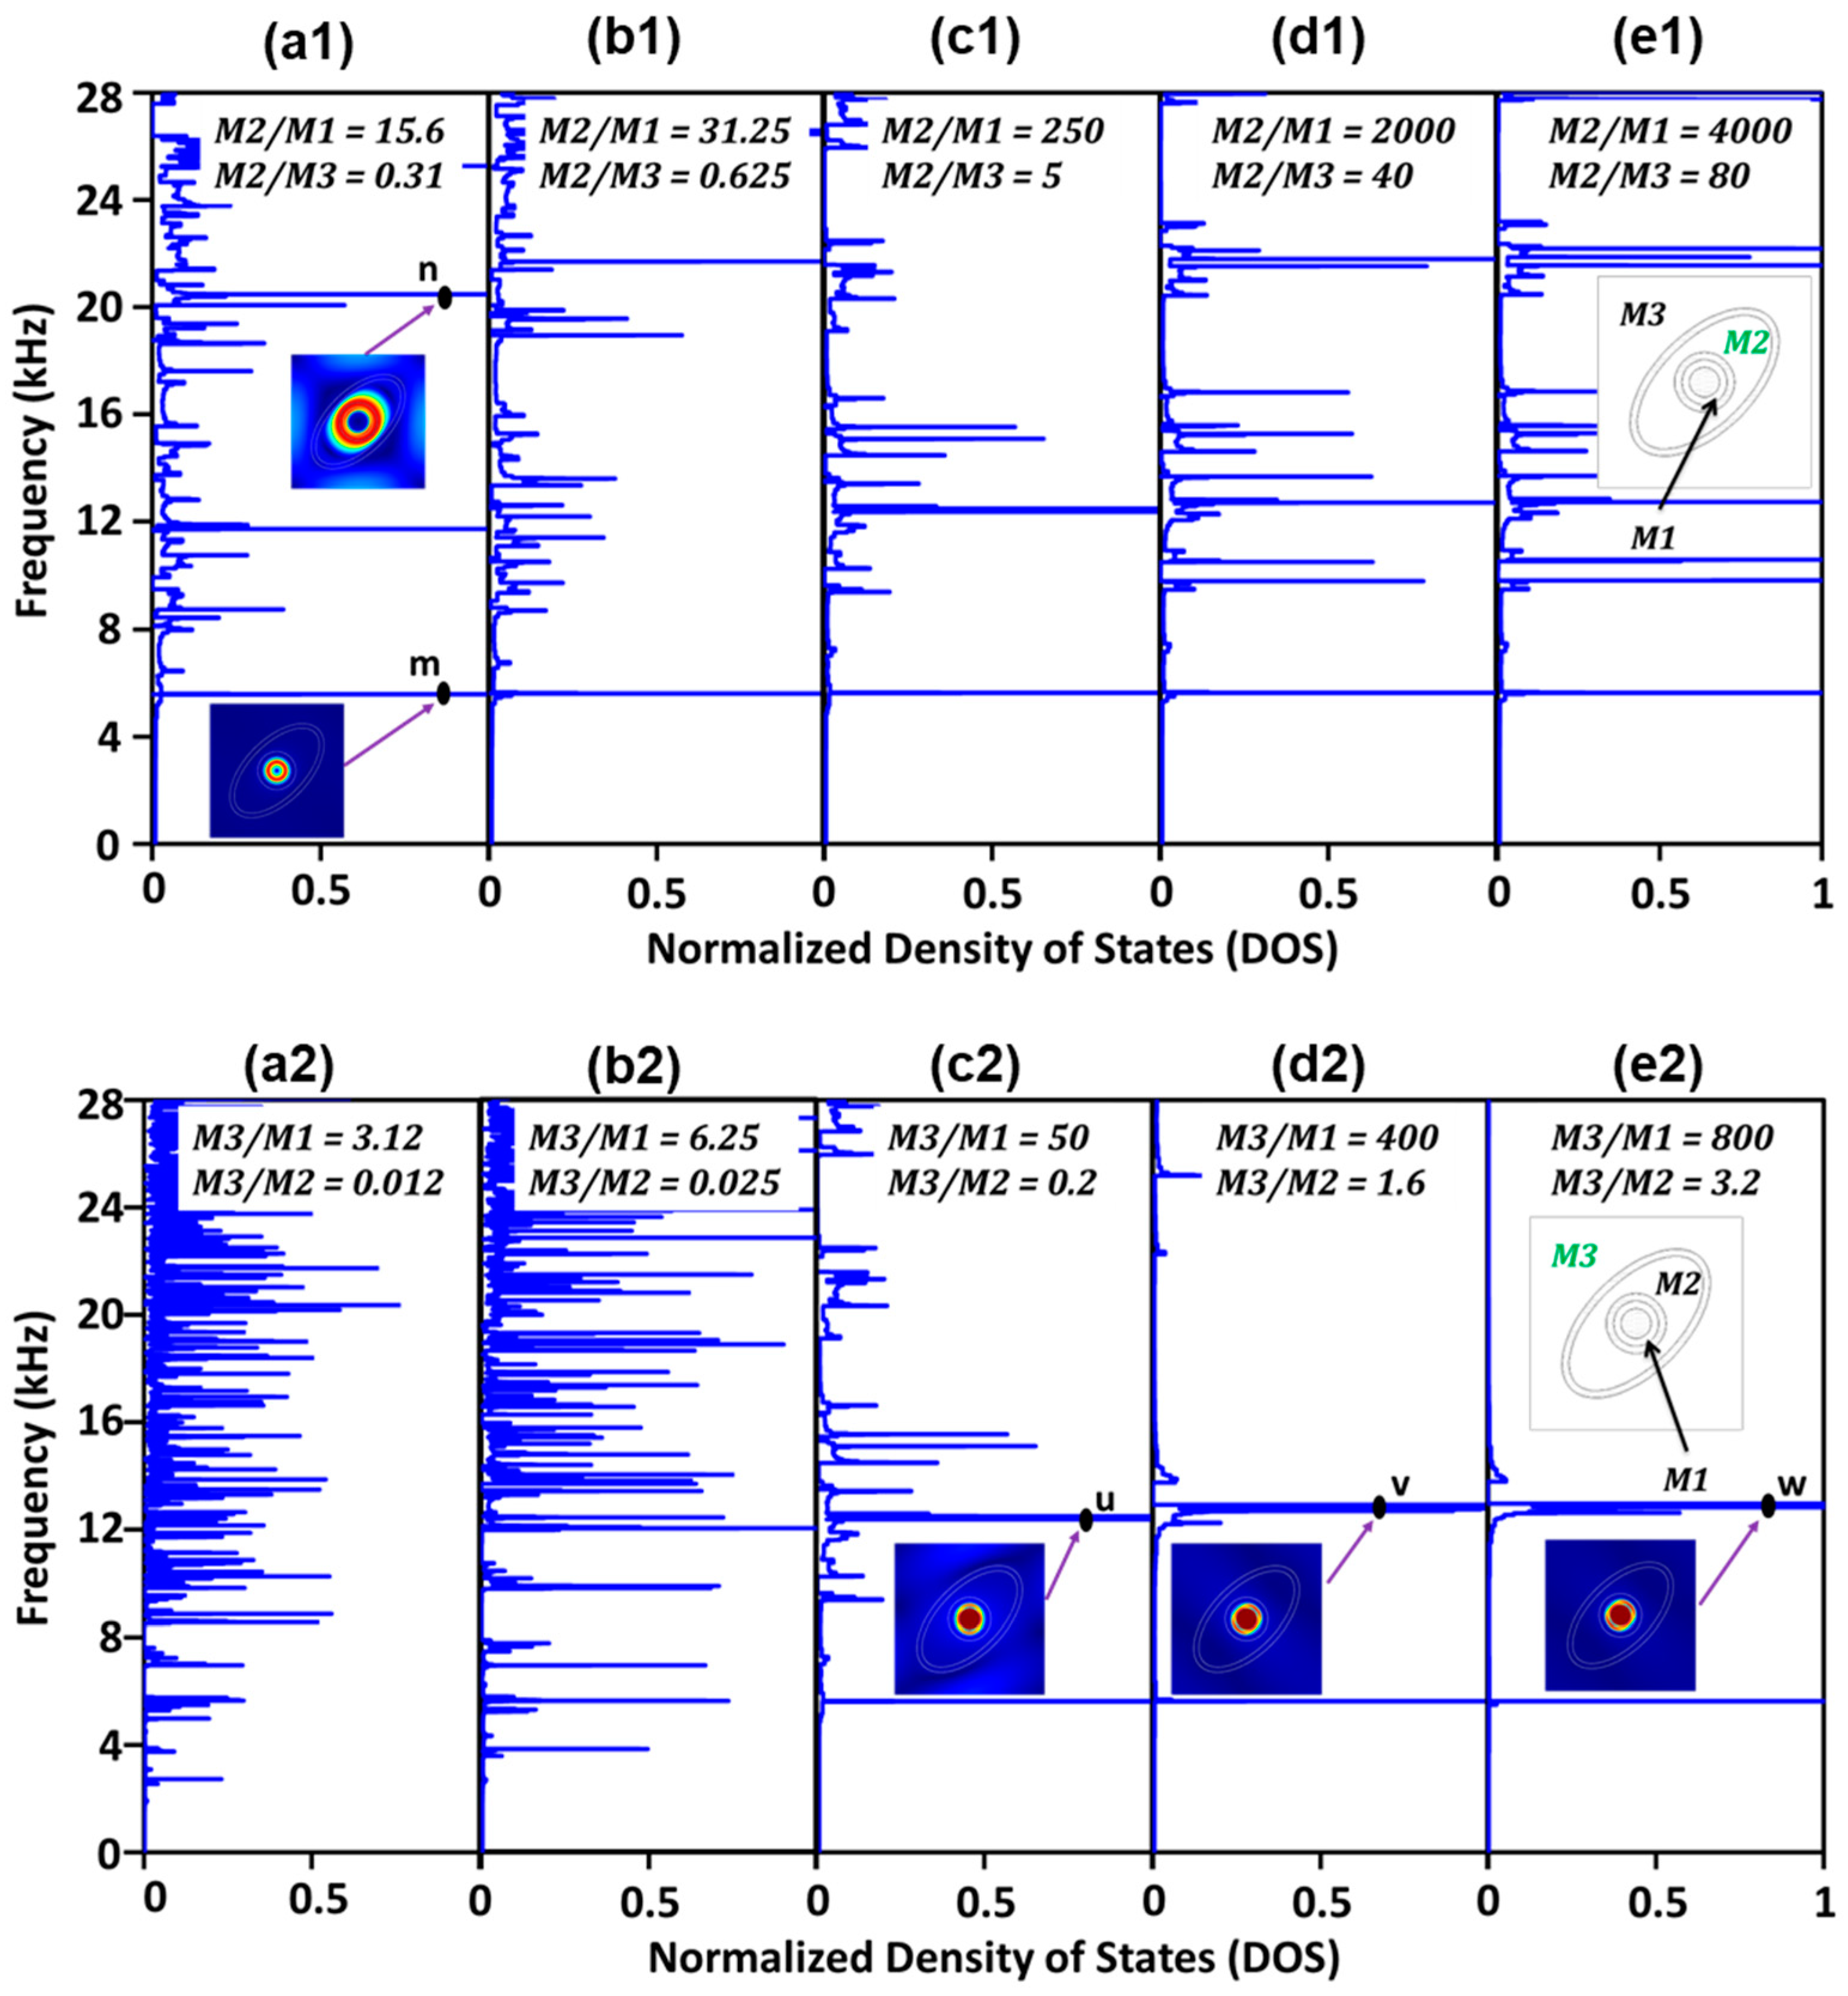
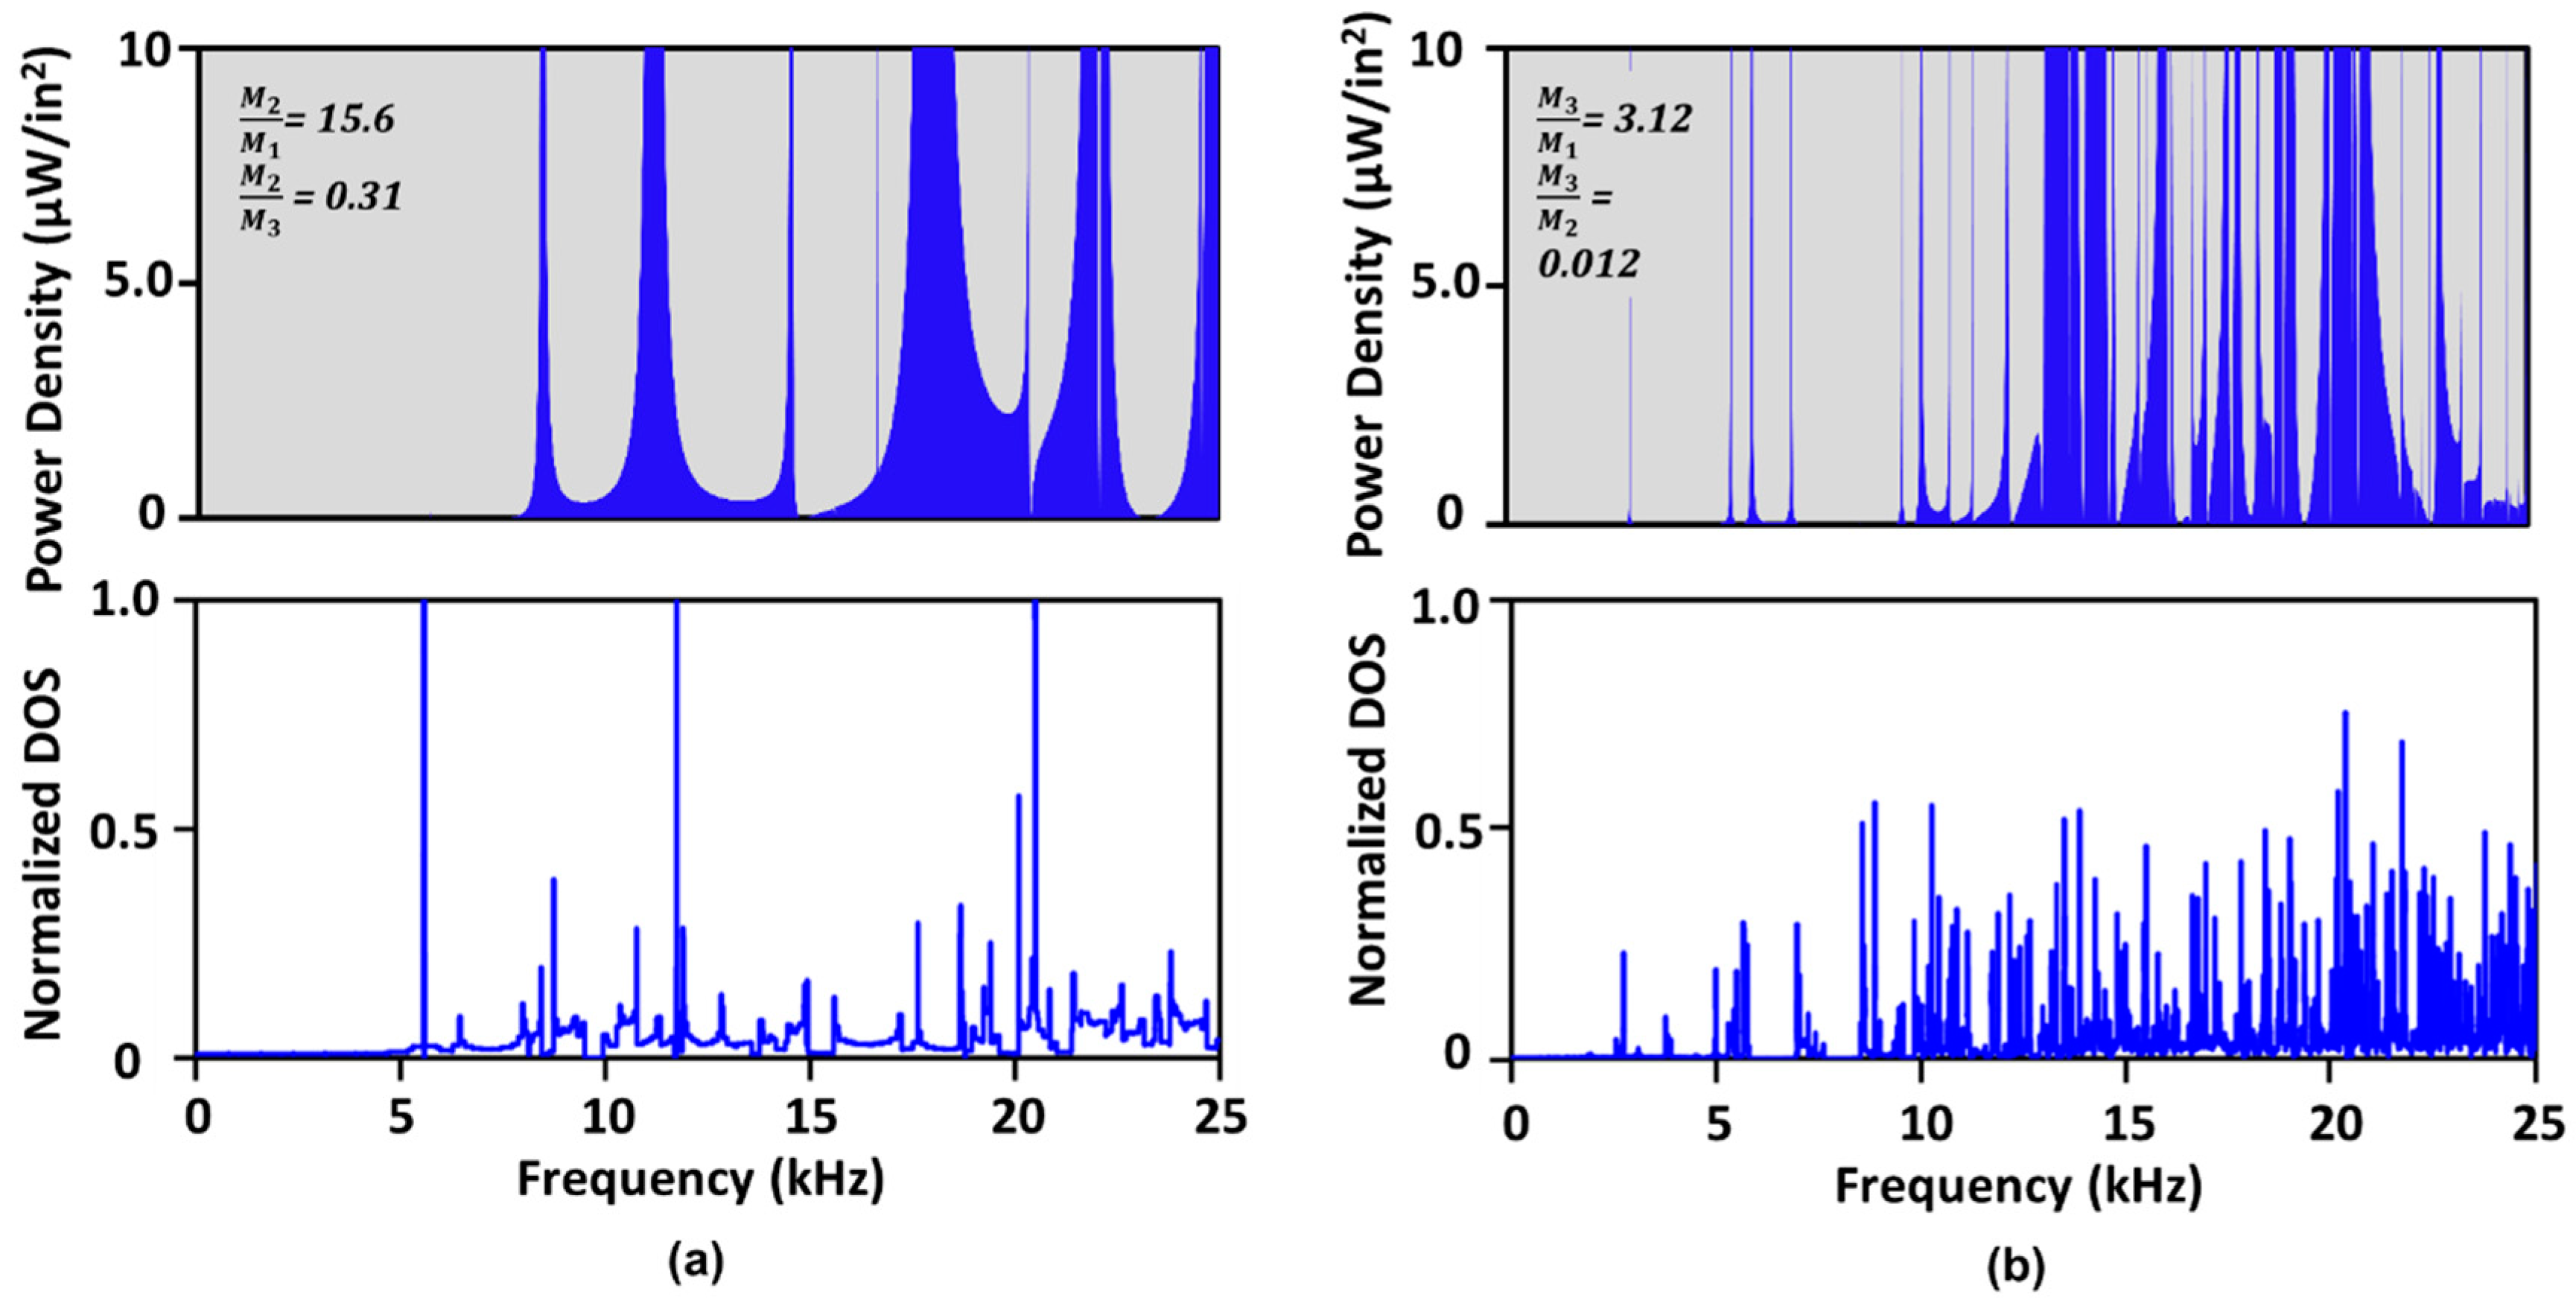
4. Density of States

The density of states (DOS) is a measure of a number of eigenmodes available at a specific frequency. A high DOS at a specific frequency level means that there are multiple modes available for occupation. The maximum DOS can be obtained where the frequency band is almost straight in the dispersion curve, which means the group velocity is close to zero and the wave energy is trapped inside the structure. A high DOS or a straight band also indicates a localized resonance in the structure. A DOS of zero means that no modes can be occupied at that frequency level and is termed a stop band. For highly dispersive unimodal wave motion, the DOS is very small but not zero. For targeting local resonance and energy harvesting, a high DOS pick is required. The DOS is calculated from the dispersion relation using Equation (5). In calculating the DOS, the total wave number d k is computed for each frequency d ω = 1   H z level.
D O S ω = 1 π d k d ω

5. Influence of Matrix Stiffness on Local Resonance Bands

A normalized DOS plot for the geometry in Figure 1b is illustrated in Figure 1c. One almost straight band (marked in Figure 1b) for a wide range of wave vectors is observed, along with other highly dispersive bands. Many resonance modes are present at that frequency level, which corresponds to a high DOS (marked in Figure 1c). A high DOS implies the presence of a local resonance band at that frequency where most of the wave energy is either occupied or stored/trapped inside the components of the system. In other words, wave energy does not propagate through the structure, but stays at the element, and the group velocity of the wave is nearly zero. In this model, it is evident that the straight band originates from the local resonance at the M1 and R1 interface (Figure 1e) at 5.62 kHz (location ‘p’ in Figure 1b). In highly dispersive modes, the wave energy can easily propagate through the structure (Figure 1d at 19.12 kHz, location ‘s’ in Figure 1b), and consequently, the DOS is significantly low.
Matrix-1 (M1) is placed in connection with Resonator-1 (R1) and Resonator-2 (R2) and assumed to be the softest component (say, rubber) of the cell with an initial stiffness of 10 × 106 Pa. The stiffness ratios between M1 and other matrices are measured as 250 (M2/M1) and 50 (M3/M1). The stiffness ratio between M2 and M3 remained constant (M2/M3 = 5) during the alteration of M1 stiffness. One local resonance band is observed at 5.62 kHz with such a configuration (Figure 1c and Figure 2c). Recall that this band is generated due to the local resonance at the M1 and R1 interface (mode shape in Figure 1e). Now, by reducing the wave speed in M1 by decreasing its stiffness and thereby increasing the stiffness ratio (M2/M1 = 2000, M3/M1 = 400), the same local resonance band is moved down to 1.99 kHz (see Figure 2b, bullet ‘g’). Additionally, two new local resonance bands are introduced at 4.6 kHz (Figure 2b, bullet ‘h’) and at 11.8 kHz (Figure 2b, bullet ‘k’), where the second band results from the local resonance of both Resonator-1 and Matrix-1 (mode shape of bullet ‘h’), and the third band is purely from Matrix-1’s resonance (mode shape of bullet ‘k’).
Many dispersive modes are prominent with a very low DOS; however, bands beyond 21.5 kHz are the local resonance bands, and the wave energy is trapped inside the softest component of the cell (here, Matrix-1). Beyond 21.5 kHz, the wavelength is too small to excite other components of the structure except for the softest materials. Since the wave speed is directly proportional to the material’s stiffness and the applied wave frequency, a further decrease in Matrix-1’s stiffness consequently lowers the corresponding resonance bands of the structures (Figure 2a). However, with the increase in the matrix’s stiffness, the wave speed in the component increases, and the stiffness ratios between M1 and other matrices is decreased, which results in higher dispersive behavior of the structure. Thus, with a higher Matrix-1 stiffness, the local resonance band, which is formed due to the local resonance of Matrix-1, disappears from the investigated frequency region (Figure 2d,e).
Matrix-2 is placed in between Resonator-2 and Resonator-3, and the initial stiffness is considered as 2.5 × 10⁹ Pa. In altering M2’s stiffness, the stiffness ratio between M3 and M1 remains at 50. Since the resonance band noticed at 5.62 kHz depends on the local resonance at the R1 and M1 interface, the change in the stiffness of M2 does not contribute any change on this band (Figure 3(a1)–(e1)). However, a new resonance band is introduced at 20.5 kHz (Figure 3(a1)) when M2’s stiffness is considered to be 156.25 × 10⁶ Pa, and the stiffness ratios are reduced to 15.6 (M2/M1) and 0.31 (M2/M3). This new band is mainly formed at the interface of R2 and M2 (mode shape of bullet ‘n’) due to a decreased wave speed and a smaller stiffness ratio between Matrix-2 and the softest components (M1) of the cell. A slight local resonance of Matrix-1 is also evident in this resonance mode since the stiffness ratio between M2 and M1 is not high enough (~15). It is expected that more resonance bands can be found beyond 28 kHz for a lower stiffness of Matrix-2.
Matrix-3 is positioned outside Resonator-3 and acts as the boundary component of the unit cell. A stiffness ratio M2/M1 = 250 is maintained during the variation in M3’s stiffness. No change in the resonance band at 5.62 kHz is observed for increased stiffness of Matrix-3 since the band is dependent on the R1 and M1 interface (Figure 3(c2–e2)). However, a small DOS pick is observed at around 12.9 kHz (bullet ‘u’ in Figure 3(c2)) which increases as the stiffness of M3 increases. M1 and R1 are the principal vibrating elements at this frequency, whereas a small vibration amplitude is observed for other components of the cell (mode shape in Figure 3(c2)). When the stiffness ratio between M3 and M1 becomes higher due to the increase in M3’s stiffness, the vibration becomes concentrated toward the softest component (M1) of the cell and allows a high DOS (Figure 3(d2–e2) and their mode shapes). Alternatively, when the stiffness of Matrix-3 decreases to 62.5 × 10⁶ Pa (Figure 3(b2)) and 31.25 × 10⁶ Pa (Figure 3(a2)), the stiffness ratios between M3 and M1 reduce to only ~6 and ~3, respectively. Due to the very low stiffness ratio, both components act as a single element and are excited at almost the same frequencies. Hence, slightly dispersive modes are observed with a higher DOS on those stiffness levels. Despite M3 having the largest volume fraction compared to the combined components in the unit cell, it can be treated as the softest element in the structure, which allows for a significant number of low dispersive modes (Figure 3(a2,b2)).

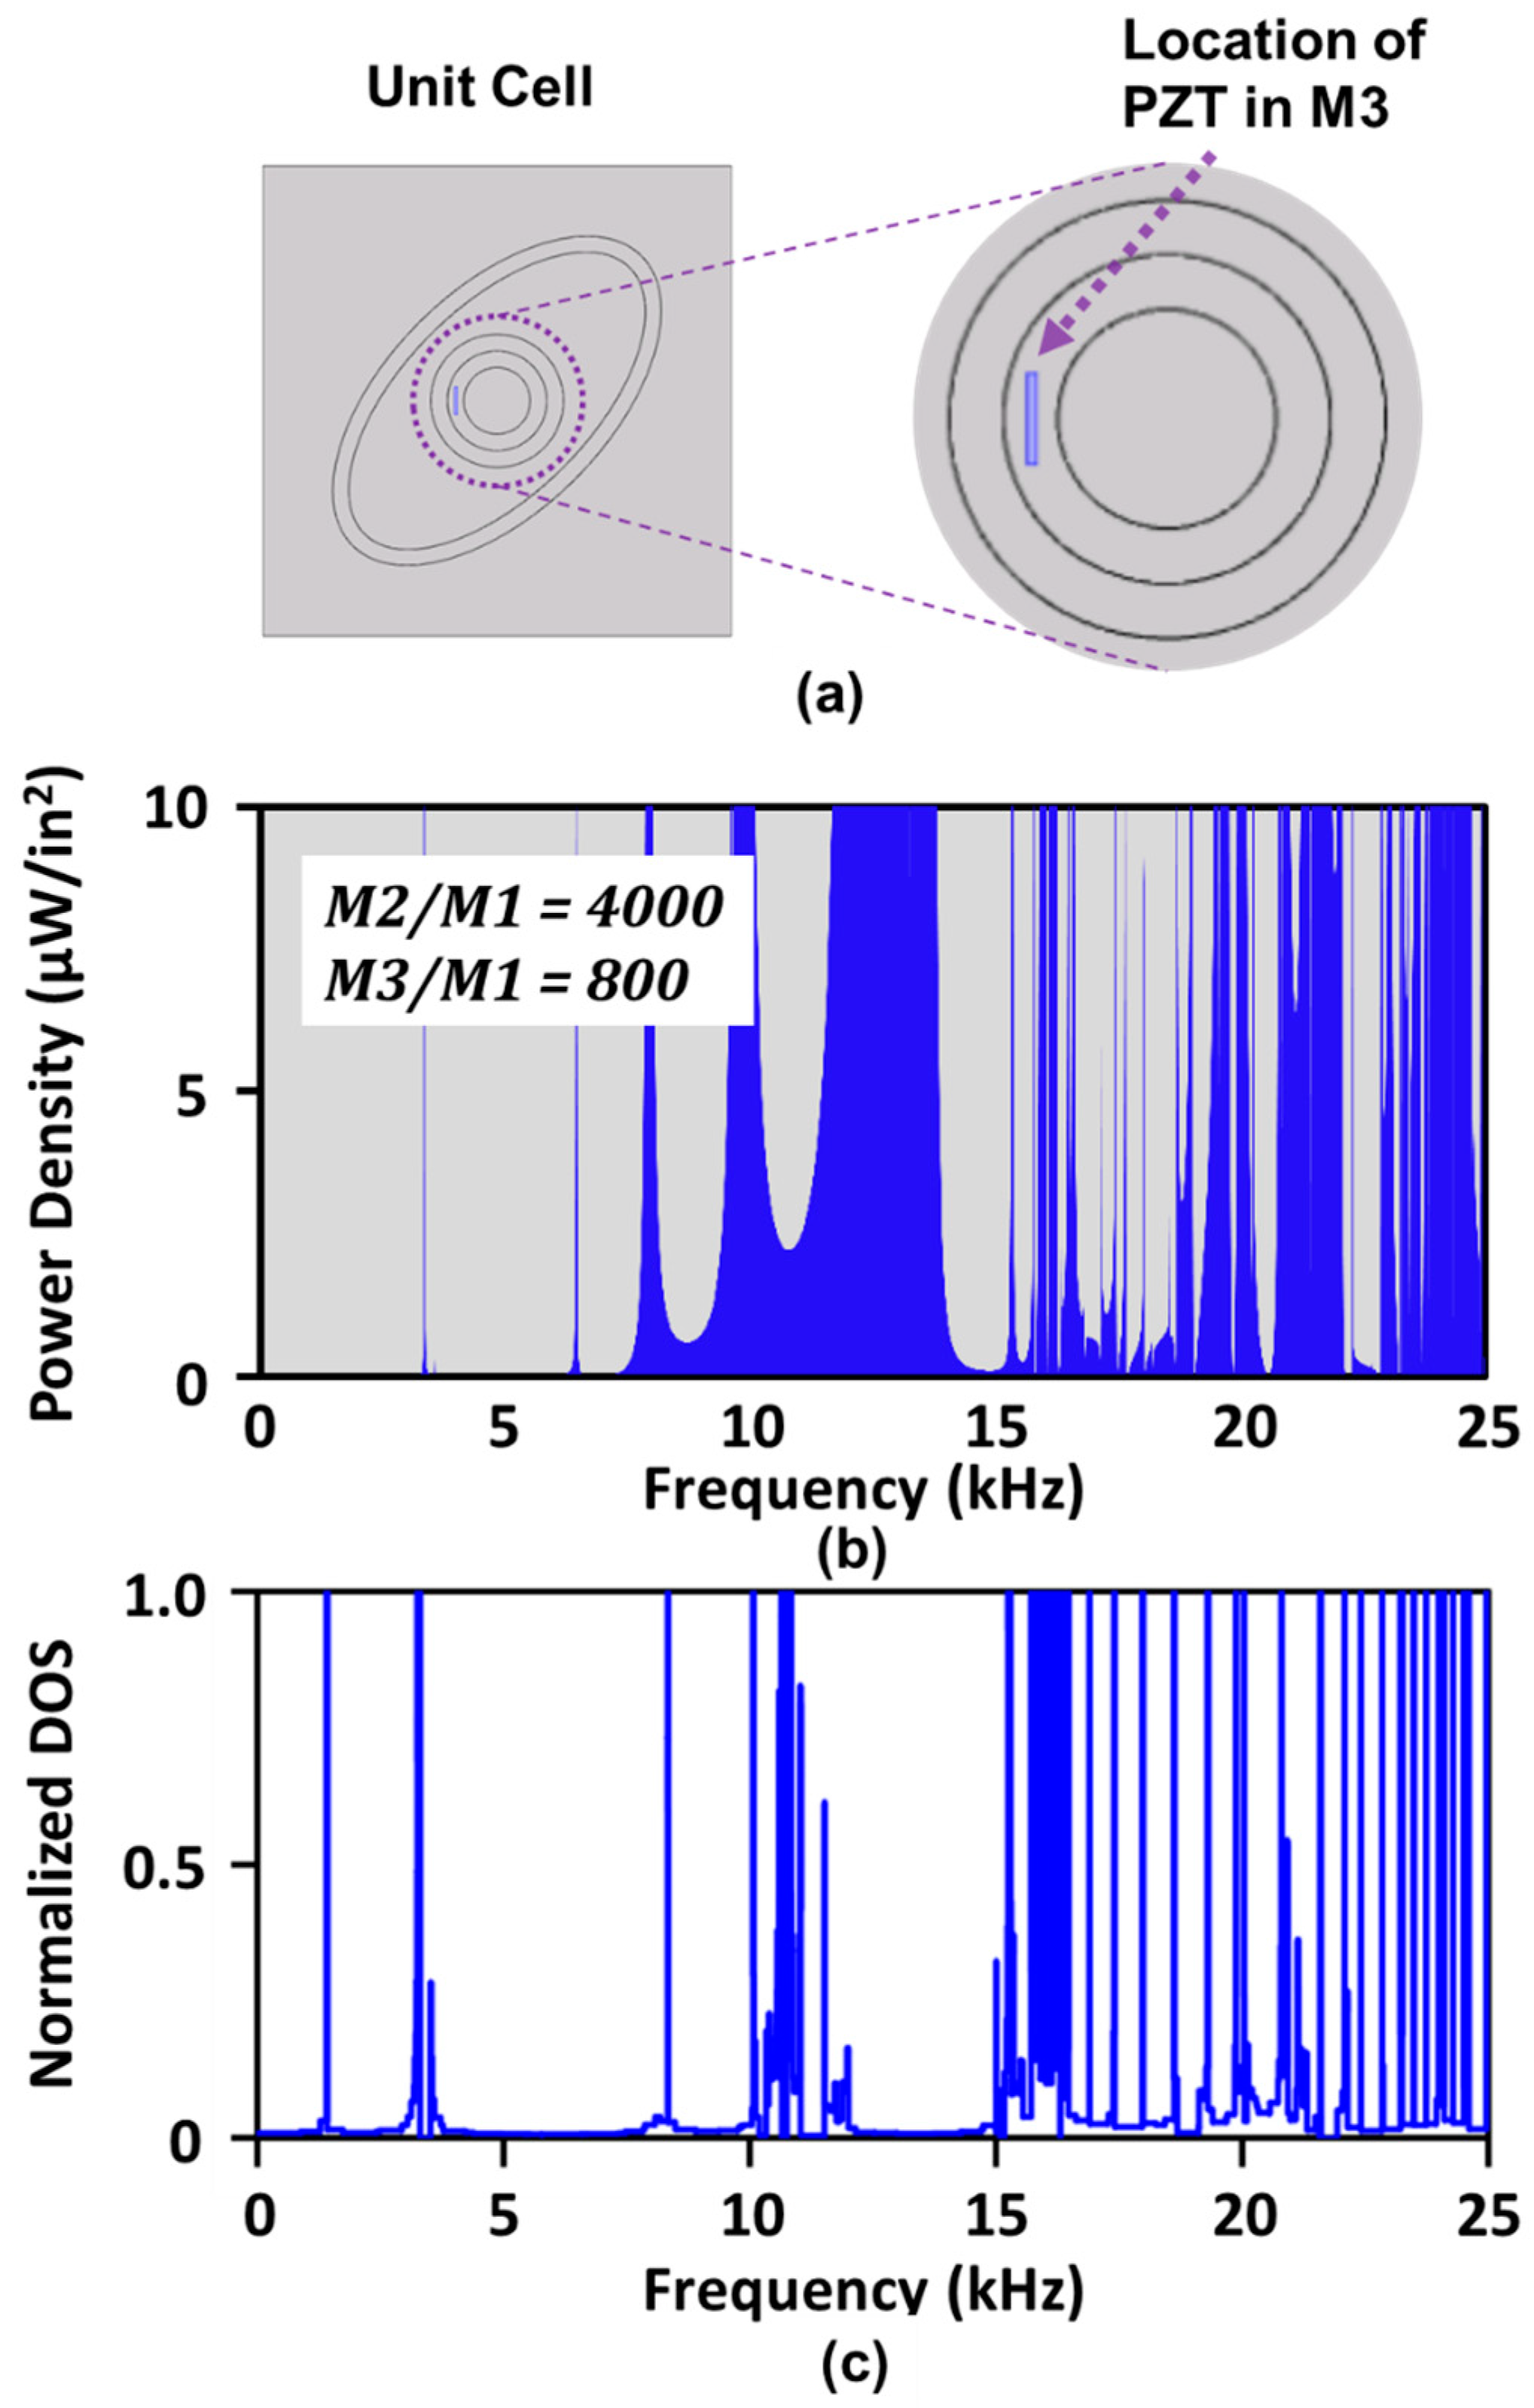
6. Broad Band Energy Harvesting

To illustrate the broad-band resonances and the energy harvesting at these frequencies, the dispersion relation and corresponding DOS study are used as a predictive tool. As demonstrated earlier, by manipulating the matrix stiffnesses of a unit cell, the local resonance can be generated within a frequency range. Based on the displacement mode shapes, it is evident that the induced local resonances can arrest acoustic energy. The harvesting of such energy at local resonance frequencies has already been demonstrated in [48,49]. Therefore, in this study, a numerical analysis is performed to harvest energy within these broadband frequencies. Since, in all cases, the innermost matrix M1 undergoes local resonances in unique ways to arrest dynamic wave energies, it is logical to embed an energy conversion material into this matrix. Researchers have been utilizing various kinds of energy-harvesting materials for this purpose [50,51]. As proof of the possibility to harvest energy from a broadband frequency as hypothesized, a rectangular piezoelectric material (PZT-5H) is placed into the unit cell (Figure 4a) in M1. Using the geometric configurations and material properties detailed in Figure 2a and Figure 3(a1,a2), a parametric frequency domain study is performed using COMSOL Multiphysics. The resulting power densities are calculated for a unit external displacement (1 mm) excitation. The results are shown in Figure 4 and Figure 5, where the power densities and the corresponding DOS across a frequency range of 0~25 kHz are reported. In Figure 4b,c, the power densities have higher values (~10 μ W / i n 2 ) when the DOS have maximum normalized value (i.e., 1). It can be noted that at some higher values of the DOS (i.e., ~2 kHz), there is no power output, which is due to the orientation of the PZT. A different amount of power can be harvested by manipulating the orientation and the number of PZTs, which is not in the scope of the current study. Using the present orientation of the PZT, it is evident in Figure 4b that the power densities are consistently higher (10–12 kHz and 15–25 kHz), where the DOS have higher normalized magnitudes. In other words, since a higher DOS at a specific frequency corresponds to the generation of local resonance, the energy trapped into the structure is being extracted by PZT at that frequency. As the number of higher-order DOS can be increased by manipulating the matrix stiffness and thereby a continually higher-order DOS can be generated in a broadband frequency range, it is possible to harvest energy from this broadband frequency range. This claim is also illustrated in Figure 5a,b. Therefore, usable and consistent harvesting of acoustic energy at a range of frequencies can be achieved using the proposed design methodology.

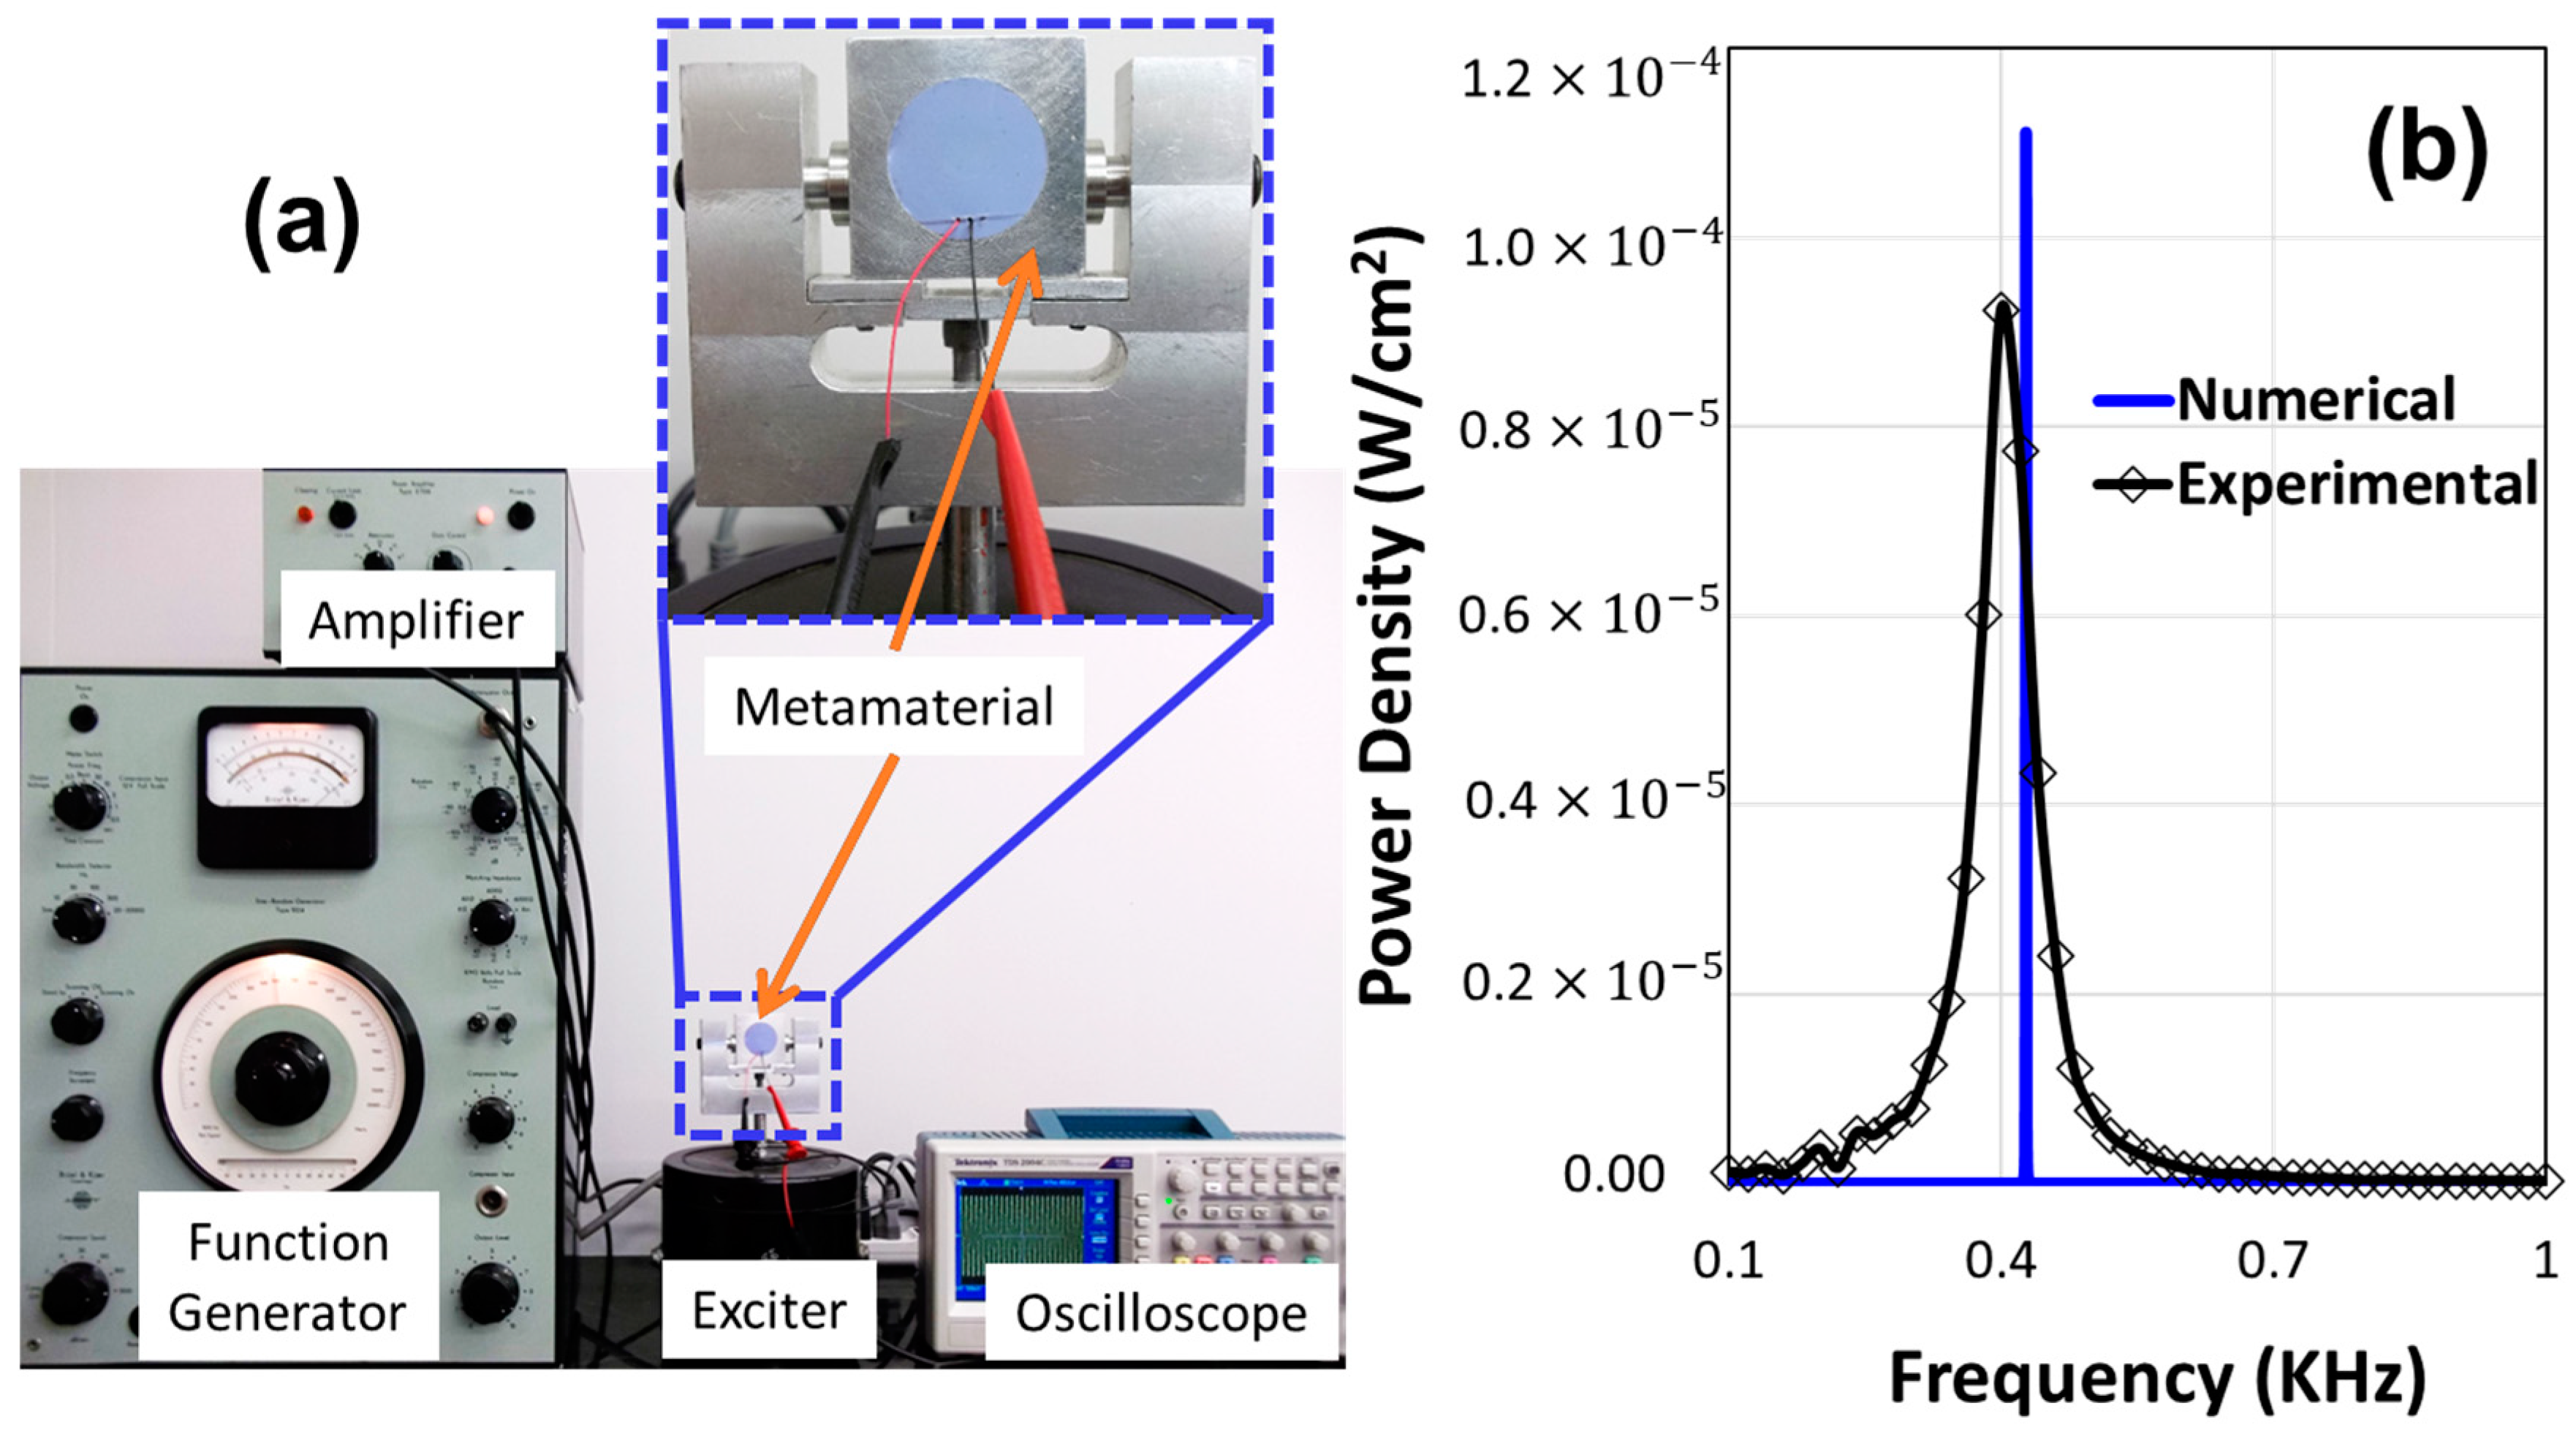
7. Experimental Investigation

To validate the hypothesis (increased energy output at higher DOS) presented above, an experimental study is performed. While setting up the experimental study, a simpler version of the unit cell model is considered as the fabrication of the actual simulated model would be complex and time consuming for the current state of research. The simplified model is presented in Figure 6i, which consists of a lead core embedded in a rubber matrix. The diameters of the lead core and the rubber matrix are ~0.5 in and ~1 in. An aluminum frame houses the matrix–core combination and makes the cell a ~1.44 in X ~1.44 in X ~0.55 in prism. The Young’s modulus of the lead, rubber matrix, and aluminum are considered to be ~13.5 GPa, ~0.98 MPa, and 68.9 GPa.
Initially, a numerical study is performed to identify the presence of DOS peaks. For simplicity, the analysis is performed for a frequency range of 0 to 1 kHz. In this frequency range, four local resonance modes have been identified, and the resulting DOS peaks are presented in Figure 6ii. These four mode shapes are sequentially named as ‘P’, ‘Q’, R’, and ‘S’. Based on the mode shapes, an appropriate PZT orientation is necessary to harvest energy from various modes. As an example, the tentative PZT orientation to harvest energy in modes P and Q are presented in Figure 6iii.
For experimental demonstration, mode Q is selected to harvest energy, as this position is demonstrated in Figure 4a. Hence, a PZT disc is placed in the matrix material as shown in Figure 6iii. The experimental setup is described in Figure 7a. In both experimental and numerical studies, the unit cell is excited with a controlled displacement amplitude for a frequency range of 0–1 kHz. During experimental setup, a vibration exciter from B and K (type 4809) is utilized to induce harmonic displacement excitations. The resulting power density is shown in Figure 7b. It has been noticed that a power output peak can be found at about ~0.41 kHz from the experimental study. The numerical result supports the experimental outcome strongly with a power peak at about ~0.42 kHz. Because of instrumentation imperfections and real-life considerations, the experimental profile holds a Gaussian distribution compared to the numerical outcome. In Figure 6ii, it can be observed that a DOS peak is available at ~0.42 kHz corresponding to local resonance mode Q. Hence, it can be concluded that a power output peak can be obtained corresponding to a DOS peak.
In Figure 7b, it can be noticed that the power density peak is only observed at ~0.41 kHz even though three additional DOS peaks are available in Figure 6ii. This is because the initial vibration modes are distinct or in-principle (e.g., translation or rotation) modes. Hence, the placement and/or orientation of the PZT material is crucial for harvesting energy from individual modes. With the increase in frequency, the vibration modes become a mix of translation and rotation. Thus, significant power output can be observed, if not the maximum, in those mixed modes irrespective of the PZT positioning/orientation.

8. Conclusions

In this work, a deterministic approach to develop a broadband energy harvesting system by inducing local resonance phenomena in an MIMS over a range of frequencies is reported. In this regard, the stiffnesses of the matrix materials are altered systematically to generate locally resonant bands within a frequency range. In the weakly dispersive locally resonant zone, where the frequency band is almost straight, the wave energy becomes trapped/stored in the components of the unit cell with a low transmission coefficient for a wide band of frequencies. This zone can be treated as a stop band. As the straight frequency band is attributed to the DOS, an increased number of DOS signals the presence of this stop band where the trapped energy can be harvested by embedding an energy conversion device (e.g., a piezoelectric wafer). In this study, a frequency domain analysis between 0~25 kHz shows that almost ~10 μ W / i n 2 power can be harvested from the WDZ by manipulating the constituent matrix stiffness of the proposed unit cell. An experimental study is performed by considering locally available materials and simple geometry of the unit cell. While the experimental results show a relationship between the DOS and harvested power density, a good agreement has been established between the numerical and experimental results.

Author Contributions

Conceptualization, H.A. and R.A.; methodology, H.A.; software, R.A.; validation, H.A. and R.A.; formal analysis, H.A.; investigation, R.A.; resources, R.A.; writing—original draft preparation, H.A.; writing—review and editing, H.A. and R.A.; project administration, H.A.; All authors have read and agreed to the published version of the manuscript.

Funding

This research received no external funding.

Data Availability Statement

The data that support the findings of this study are available from the corresponding author upon request.

Conflicts of Interest

The authors have no conflict of interest to declare.

References

  1. Ahmed, R.U.; Banerjee, S. Low frequency energy scavenging using sub-wave length scale acousto-elastic metamaterial. AIP Adv. 2014, 4, 117114. [Google Scholar] [CrossRef]
  2. Ahmed, R.; Adiba, A.; Banerjee, S. Energy scavenging from acousto-elastic metamaterial using local resonance phenomenon. In SPIE Smart Structures and Materials + Nondestructive Evaluation and Health Monitoring; SPIE: San Diego, CA, USA, 2015; Volume 9431. [Google Scholar]
  3. Anton, S.R.; Sodano, H.A. A review of power harvesting using piezoelectric materials (2003–2006). Smart Mater. Struct. 2007, 16, R1–R21. [Google Scholar] [CrossRef]
  4. Beeby, S.P.; Tudor, M.J.; White, N.M. Energy harvesting vibration sources for microsystems applications. Meas. Sci. Technol. 2006, 17, R175–R195. [Google Scholar] [CrossRef] [Green Version]
  5. Cook-Chennault, K.A.; Thambi, N.; Sastry, A.M. Powering MEMS portable devices—A review of non-regenerative and regenerative power supply systems with special emphasis on piezoelectric energy harvesting systems. Smart Mater. Struct. 2008, 17, 043001. [Google Scholar] [CrossRef] [Green Version]
  6. Du, C.; Zhou, D.; Guo, H.-H.; Pang, Y.-Q.; Shi, H.-Y.; Liu, W.-F.; Su, J.-Z.; Singh, C.; Trukhanov, S.; Trukhanov, A.; et al. An ultra-broadband terahertz metamaterial coherent absorber using multilayer electric ring resonator structures based on anti-reflection coating. Nanoscale 2020, 12, 9769–9775. [Google Scholar] [CrossRef]
  7. Kozlovskiy, A.L.; Shlimas, D.I.; Zdorovets, M.V. Synthesis, structural properties and shielding efficiency of glasses based on TeO2-(1-x)ZnO-xSm2O3. J. Mater. Sci. Mater. Electron. 2021, 32, 12111–12120. [Google Scholar] [CrossRef]
  8. Firoozy, P.; Khadem, S.E.; Pourkiaee, S.M. Broadband energy harvesting using nonlinear vibrations of a magnetopiezoelastic cantilever beam. Int. J. Eng. Sci. 2017, 111, 113–133. [Google Scholar] [CrossRef]
  9. Fang, S.; Miao, G.; Chen, K.; Xing, J.; Zhou, S.; Yang, Z.; Liao, W.-H. Broadband energy harvester for low-frequency rotations utilizing centrifugal softening piezoelectric beam array. Energy 2022, 241, 122833. [Google Scholar] [CrossRef]
  10. Veselago, V.G. The electrodynamics of substances with simultaneously negative values of ε and μ. Phys.-Uspekhi 1968, 10, 509–514. [Google Scholar] [CrossRef]
  11. Smith, D.R.; Pendry, J.B.; Wiltshire, M.C.K. Metamaterials and Negative Refractive Index. Science 2004, 305, 788–792. [Google Scholar] [CrossRef] [Green Version]
  12. Pendry, J.B.; Holden, A.J.; Robbins, D.J.; Stewart, W.J. Magnetism from conductors and enhanced nonlinear phenomena. IEEE Trans. Microw. Theory Tech. 1999, 47, 2075–2084. [Google Scholar] [CrossRef] [Green Version]
  13. Chen, L.; Ma, Q.; Luo, S.S.; Ye, F.J.; Cui, H.Y.; Cui, T.J. Touch-Programmable Metasurface for Various Electromagnetic Manipulations and Encryptions. Nano-Micro Small 2022, 18, 2203871. [Google Scholar] [CrossRef] [PubMed]
  14. Ma, Q.; Gao, W.; Xiao, Q.; Ding, L.; Gao, T.; Zhou, Y.; Gao, X.; Yan, T.; Liu, C.; Gu, Z.; et al. Directly wireless communication of human minds via non-invasive brain-computer-metasurface platform. eLight 2022, 2, 11. [Google Scholar] [CrossRef]
  15. Gao, X.; Ma, Q.; Gu, Z.; Cui, W.Y.; Liu, C.; Zhang, J.; Cui, T.J. Programmable surface plasmonic neural networks for microwave detection and processing. Nat. Electron. 2023, 6, 319–328. [Google Scholar] [CrossRef]
  16. Du, C.; Zhou, D.; Guo, H.-H.; Pang, Y.-Q.; Shi, H.-Y.; Liu, W.-F.; Singh, C.; Trukhanov, S.; Trukhanov, A.; Xu, Z. Active control scattering manipulation for realization of switchable EIT-like response metamaterial. Opt. Commun. 2021, 483, 126664. [Google Scholar] [CrossRef]
  17. Khan, S.A.; Ali, I.; Hussain, A.; Javed, H.M.; Turchenko, V.A.; Trukhanov, A.V.; Trukhanov, S.V. Synthesis and Characterization of Composites with Y-Hexaferrites for Electromagnetic Interference Shielding Applications. Magnetochemistry 2022, 8, 186. [Google Scholar] [CrossRef]
  18. Smirnova, E.I.; Mastovsky, I.; Shapiro, M.A.; Temkin, R.J.; Earley, L.M.; Edwards, R.L. Fabrication and cold test of photonic band gap resonators and accelerator structures. Phys. Rev. Spec. Top.-Accel. Beams 2005, 8, 091302. [Google Scholar] [CrossRef] [Green Version]
  19. Liu, Z.; Chan, C.T.; Sheng, P. Analytic model of phononic crystals with local resonances. Phys. Rev. B 2005, 71, 014103. [Google Scholar] [CrossRef] [Green Version]
  20. Mei, J.; Liu, Z.; Wen, W.; Sheng, P. Effective Mass Density of Fluid-Solid Composites. Phys. Rev. Lett. 2006, 96, 024301. [Google Scholar] [CrossRef] [Green Version]
  21. Wu, Y.; Lai, Y.; Zhang, Z.-Q. Effective medium theory for elastic metamaterials in two dimensions. Phys. Rev. B 2007, 76, 205313. [Google Scholar] [CrossRef] [Green Version]
  22. Ahmed, H.; Ghosh, S.; Sain, T.; Banerjee, S. Hybrid Bessel beam and metamaterial lenses for deep laparoscopic nondestructive evaluation. J. Appl. Phys. 2021, 129, 165107. [Google Scholar] [CrossRef]
  23. Indaleeb, M.M.; Ahmed, H.; Beard, S.; Banerjee, S. Nondestructive evaluation (NDE) of multilayered attenuative structures using ultrasonic Bessel beams. Mech. Syst. Signal Process. 2023, 187, 109960. [Google Scholar] [CrossRef]
  24. Ahmed, H.; Ahmed, R.; Indaleeb, M.M.; Banerjee, S. Multifunction acoustic modulation by a multi-mode acoustic metamaterial architecture. J. Phys. Commun. 2018, 2, 115001. [Google Scholar] [CrossRef]
  25. Hossain, A.; Mustahseen Mobashwer, I.; Mohammadsadegh, S.; Trisha, S.; Susanta, G.; Sourav, B. Investigation of wave trapping and attenuation phenomenon for a high symmetry interlocking micro-structure composite metamaterial. In Smart Structures and NDE for Energy Systems and Industry; SPIE: Denver, CO, USA, 2019; p. 109730W. [Google Scholar]
  26. Hsu, J.-C. Local resonances-induced low-frequency band gaps in two-dimensional phononic crystal slabs with periodic stepped resonators. J. Phys. D Appl. Phys. 2011, 44, 55401–55409. [Google Scholar] [CrossRef]
  27. Fan, L.; Zhang, S.-y.; Zhang, H. Transmission characteristics of double negativity acoustic metamaterials studied with fluid impedance theory. J. Acoust. Soc. Am. 2011, 129, 2483. [Google Scholar] [CrossRef]
  28. Norris, A. Periodic metal structures for acoustic wave control. J. Acoust. Soc. Am. 2011, 130, 2359. [Google Scholar] [CrossRef]
  29. Krynkin, A.; Umnova, O.; Chong, A.Y.B.; Taherzadeh, S.; Attenborough, K. Predictions and measurements of sound transmission through a periodic array of elastic shells in air. J. Acoust. Soc. Am. 2010, 128, 3496–3506. [Google Scholar] [CrossRef]
  30. Phani, A.S.; Woodhouse, J.; Fleck, N.A. Wave propagation in two-dimensional periodic lattices. J. Acoust. Soc. Am. 2006, 119, 1995–2005. [Google Scholar] [CrossRef]
  31. Riaz, A.; Banerjee, S. Wave Propagation in Metamaterial Using Multiscale Resonators by Creating Local Anisotropy. Int. J. Mod. Eng. 2013, 13, 9. [Google Scholar]
  32. Hirsekorn, M.; Delsanto, P.P.; Batra, N.K.; Matic, P. Modelling and simulation of acoustic wave propagation in locally resonant sonic materials. Ultrasonics 2004, 42, 231–235. [Google Scholar] [CrossRef]
  33. Oudich, M.; Li, Y.; Assouar, B.M.; Hou, Z. A sonic band gap based on the locally resonant phononic plates with stubs. New J. Phys. 2010, 12, 083049. [Google Scholar] [CrossRef]
  34. Caballero, D.; Sánchez-Dehesa, J.; Rubio, C.; Mártinez-Sala, R.; Sánchez-Pérez, J.V.; Meseguer, F.; Llinares, J. Large two-dimensional sonic band gaps. Phys. Rev. E 1999, 60, R6316–R6319. [Google Scholar] [CrossRef] [PubMed] [Green Version]
  35. Chesnais, C.; Boutin, C.; Hans, S. Effects of the local resonance on the wave propagation in periodic frame structures: Generalized Newtonian mechanics. J. Acoust. Soc. Am. 2012, 132, 2873–2886. [Google Scholar] [CrossRef] [PubMed]
  36. Liu, Z.; Zhang, X.; Mao, Y.; Zhu, Y.Y.; Yang, Z.; Chan, C.T.; Sheng, P. Locally Resonant Sonic Materials. Science 2000, 289, 1734–1736. [Google Scholar] [CrossRef]
  37. Krushynska, A.O.; Kouznetsova, V.G.; Geers, M.G.D. Towards optimal design of locally resonant acoustic metamaterials. J. Mech. Phys. Solids 2014, 71, 179–196. [Google Scholar] [CrossRef]
  38. Krushynska, A.O.; Miniaci, M.; Kouznetsova, V.G.; Geers, M.G.D. Multilayered Inclusions in Locally Resonant Metamaterials: Two-Dimensional Versus Three-Dimensional Modeling. J. Vib. Acoust. 2017, 139, 024501. [Google Scholar] [CrossRef] [Green Version]
  39. Moscatelli, M.; Ardito, R.; Driemeier, L.; Comi, C. Band-gap structure in two- and three-dimensional cellular locally resonant materials. J. Sound Vib. 2019, 454, 73–84. [Google Scholar] [CrossRef]
  40. Comi, C.; Marigo, J.-J. Homogenization Approach and Bloch-Floquet Theory for Band-Gap Prediction in 2D Locally Resonant Metamaterials. J. Elast. 2020, 139, 61–90. [Google Scholar] [CrossRef] [Green Version]
  41. Sugino, C.; Erturk, A. Analysis of multifunctional piezoelectric metastructures for low-frequency bandgap formation and energy harvesting. J. Phys. D Appl. Phys. 2018, 51, 215103. [Google Scholar] [CrossRef]
  42. Huang, H.H.; Sun, C.T. Wave attenuation mechanism in an acoustic metamaterial with negative effective mass density. New J. Phys. 2009, 11, 013003. [Google Scholar] [CrossRef]
  43. Huang, H.H.; Sun, C.T.; Huang, G.L. On the negative effective mass density in acoustic metamaterials. Int. J. Eng. Sci. 2009, 47, 610–617. [Google Scholar] [CrossRef]
  44. Ahmed, R.; Ahmed, H. Understanding the Influence of Resonators on Frequency Band Gaps in Sonic Crystal Metamaterials. In Proceedings of the ASME 2021 Conference on Smart Materials, Adaptive Structures and Intelligent Systems, Online, 14–15 September 2021. [Google Scholar]
  45. Elabbasi, N. Modeling Phononic Band Gap Materials and Structures. Available online: https://www.comsol.com/blogs/modeling-phononic-band-gap-materials-and-structures/ (accessed on 22 April 2022).
  46. Brillouin, L. Wave Propagation in Periodic Structures; Dover Publications, Inc.: New York, NY, USA, 1953; p. 255. [Google Scholar]
  47. Hussein, M. Band Structure Calculations by Modal Analysis. In IUTAM Symposium on Recent Advances of Acoustic Waves in Solids; Wu, T.-T., Ma, C.-C., Eds.; Springer: Dordrecht, The Netherlands, 2010; Volume 26, pp. 319–324. [Google Scholar]
  48. Zhang, S.; Wu, J.H. Low-Frequency Broadband Energy Harvesting Based on Locally Resonant Phononic Crystals. In Proceedings of the ASME 2013 International Mechanical Engineering Congress and Exposition, San Diego, CA, USA, 15–21 November 2013. [Google Scholar]
  49. Ahmed, R.; Madisetti, D.; Banerjee, S. A sub-wavelength scale acoustoelastic sonic crystal for harvesting energies at very low frequencies (<~1 kHz) using controlled geometric configurations. J. Intell. Mater. Syst. Struct. 2017, 28, 381–391. [Google Scholar] [CrossRef]
  50. Turchenko, V.A.; Trukhanov, S.V.; Kostishin, V.G.; Damay, F.; Porcher, F.; Klygach, D.S.; Vakhitov, M.G.; Lyakhov, D.; Michels, D.; Bozzo, B.; et al. Features of structure, magnetic state and electrodynamic performance of SrFe12−xInxO19. Sci. Rep. 2021, 11, 18342. [Google Scholar] [CrossRef] [PubMed]
  51. Kozlovskiy, A.L.; Alina, A.; Zdorovets, M.V. Study of the effect of ion irradiation on increasing the photocatalytic activity of WO3 microparticles. J. Mater. Sci. Mater. Electron. 2021, 32, 3863–3877. [Google Scholar] [CrossRef]
Figure 2. Manipulation of DOS (local resonance) by altering stiffness ratios between M1 and other matrices (M2, M3) of the cell and keeping stiffness ratio between M2 and M3 unchanged (M2/M3 = 5). (a) M2/M1 = 4000 and M3/M1 = 800; (b) M2/M1 = 2000 and M3/M1 = 400, (c) M2/M1 = 250 and M3/M1 = 50, (d) M2/M1 = 31.25 and M3/M1 = 6.25, (e) M2/M1 = 15.6 and M3/M1 = 3.12. Bullet ‘g’, ‘h’, and ‘k’ are on local resonance band. Mode shapes of bullet ‘h’ and ‘k’ are shown on (b).
Energies 16 05883 g002
Figure 3. Manipulation of DOS by altering stiffness ratios: (a1e1) between M2 and other matrices (M1, M3) of the cell where a ratio M3/M1 = 50 is fixed; (a2e2) between M3 and other matrices (M1, M2) of the cell where a ratio M2/M1 = 250 is fixed. Bullet ‘m’, ‘n’, ‘u’, ‘v’, and ‘w’ are on local resonance band. Mode shapes corresponding to these bullets are shown right beside each other.
Energies 16 05883 g003
Figure 4. (a) Placement of PZT-5H in the unit cell; (b) and (c) show power densities and corresponding normalized DOS when M2/M1 = 4000 and M3/M1 = 800.
Energies 16 05883 g004
Figure 5. Power densities and corresponding normalized DOS when (a) M2/M1 = 15.6 and M2/M3 = 0.31, (b) M3/M1 = 3.12 and M3/M2 = 0.012.
Energies 16 05883 g005
Figure 6. (i) Components of unit cell for experimental study, (ii) mode shapes corresponding to the higher DOS, (iii) top and front views of the unit cell after embedding the PZT according to ‘P’ and ‘Q’ modes.
Energies 16 05883 g006
Figure 7. (a) Experimental setup to excite the unit cell, (b) comparison of experimentally found power densities and numerically found DOS.
Energies 16 05883 g007
Table 1. Properties of the components of the unit cell.
Component NameOuter Dimensions (Inch)Stiffness
(Pa)
Density
(kg/m3)
Poisson’s Ratio
M1Diameter—0.212110 × 1069800.49
M2Major Radius—0.4
Minor Radius—0.2
2.5 × 10912500.38
M31 × 1 Square0.5 × 10910500.49
R1Diameter—0.141413 × 10911,3100.435
R2Diameter—0.2828100 × 10929500.31
R3Major Radius—0.435
Minor Radius—0.235
100 × 10929500.31
Disclaimer/Publisher’s Note: The statements, opinions and data contained in all publications are solely those of the individual author(s) and contributor(s) and not of MDPI and/or the editor(s). MDPI and/or the editor(s) disclaim responsibility for any injury to people or property resulting from any ideas, methods, instructions or products referred to in the content.

