Brief Report

Impact of Bypass Diode Fault Resistance Values on Burnout in Bypass Diode Failures in Simulated Photovoltaic Modules with Various Output Parameters

1
Faculty of Engineering, Osaka Electro-Communication University, 18-8 Hatsucho, Osaka 575-0063, Japan
2
Graduate School of Engineering, Osaka Electro-Communication University, 18-8 Hatsucho, Osaka 575-0063, Japan
3
National Institute of Technology, Ube College, 2-14-1 Tokiwadai, Yamaguchi 755-009, Japan
4
National Institute of Technology, Yonago College, 4448 Hikonacho, Tottori 683-0854, Japan
5
National Institute of Technology, Oshima College, 1091-1 Komatsu, Yamaguchi 742-2106, Japan
6
National Institute of Technology, Tsuyama College, 624-1, Numa, Okayama 708-0824, Japan
*
Author to whom correspondence should be addressed.
Energies 2023, 16(16), 5879; https://doi.org/10.3390/en16165879
Submission received: 23 June 2023 / Revised: 24 July 2023 / Accepted: 5 August 2023 / Published: 8 August 2023
(This article belongs to the Special Issue Photovoltaic Solar Cells and Systems: Fundamentals and Applications)

Abstract

:
The bypass diode (BPD), a protective element in a photovoltaic system (PVS), occasionally fails as a result of lightning damage. In this study, using various resistance values, we investigated the burnout risk of PV modules experiencing BPD failures through experiments that replicated conditions in which a BPD fails. Specifically, we evaluated the electric power generated by the failed BPD as we varied the faulty resistance value. Furthermore, we examined the impact of the failure resistance value of the BPD on PV module burnout. The results indicated that the power consumption of a BPD is particularly high, ranging from approximately 2 to 10 Ω when the PV module operates at its maximum power point. In addition, when the load is disconnected, the risk of heat generation is significantly higher, at BPD fault resistance values of approximately 0.1–10 Ω. Moreover, a faulty BPD with a resistance of approximately 0.1–10 Ω poses a high risk of burnout, particularly during load disconnection, owing to the increased heat generated by a BPD failure.

1. Introduction

The escalating severity of global climate change requires urgent efforts toward achieving a decarbonized society, which has been explored from various perspectives. Photovoltaic systems (PVSs) have emerged as promising solutions to address this challenge [1]. However, with the increasing popularity of PVS installations, the instances of PVS failures owing to natural disasters and accidents have also increased [2]. In particular, during natural disasters, the bypass diode (BPD), a protective element in a PV module, occasionally fails as a result of lightning damage. Such BPD failures pose a significant risk of burning [3]. PVS burnout failures must be avoided in PVSs, which are often installed on residential and building roofs. Avoiding failures and accidents that lead to the burning of PVSs is crucial and requires a comprehensive understanding of the underlying causes. In our previous surveys on lightning damage to PVS installations, we observed that the BPDs in damaged PV modules fail, depending on a wide range of electrical characteristics, ranging from short-circuits to open-circuit failures [4,5,6]. In addition, some faulty BPDs suffered severe burnout damage, whereas others generated heat without exhibiting visible changes. We inferred that the electrical characteristics of a BPD determine whether the failure develops into burnout. Therefore, the relationship between BPD failure resistance and heat generation should be elucidated to prevent PVS burnout due to BPD failure. Therefore, we posit that the fault resistance value of the BPD plays a crucial role in burnout outcomes, motivating an in-depth investigation into its impact on both burnout and electric power generated within the PV module. However, a previous report reproduced the condition of a three-cluster PV module with an open-circuit voltage (VOC) of 32.7 V, a short-circuit current (ISC) of 8.95 A, and a fill factor (F.F.) of 0.806 [7,8]. The actual output of a PV module differs depending on the cell size, solar cell material, and cell connection method.
In this study, we aimed to elucidate the burnout risk of PV modules experiencing BPD failures through experiments that replicated the conditions leading to BPD failures in PV modules for different ISC, VOC, and F.F. values. Specifically, we evaluated the electric power generated by the faulty BPD as we varied the faulty resistance value, and we examined the burnout risk when BPD failures occur in PV modules at different ISC and VOC values.

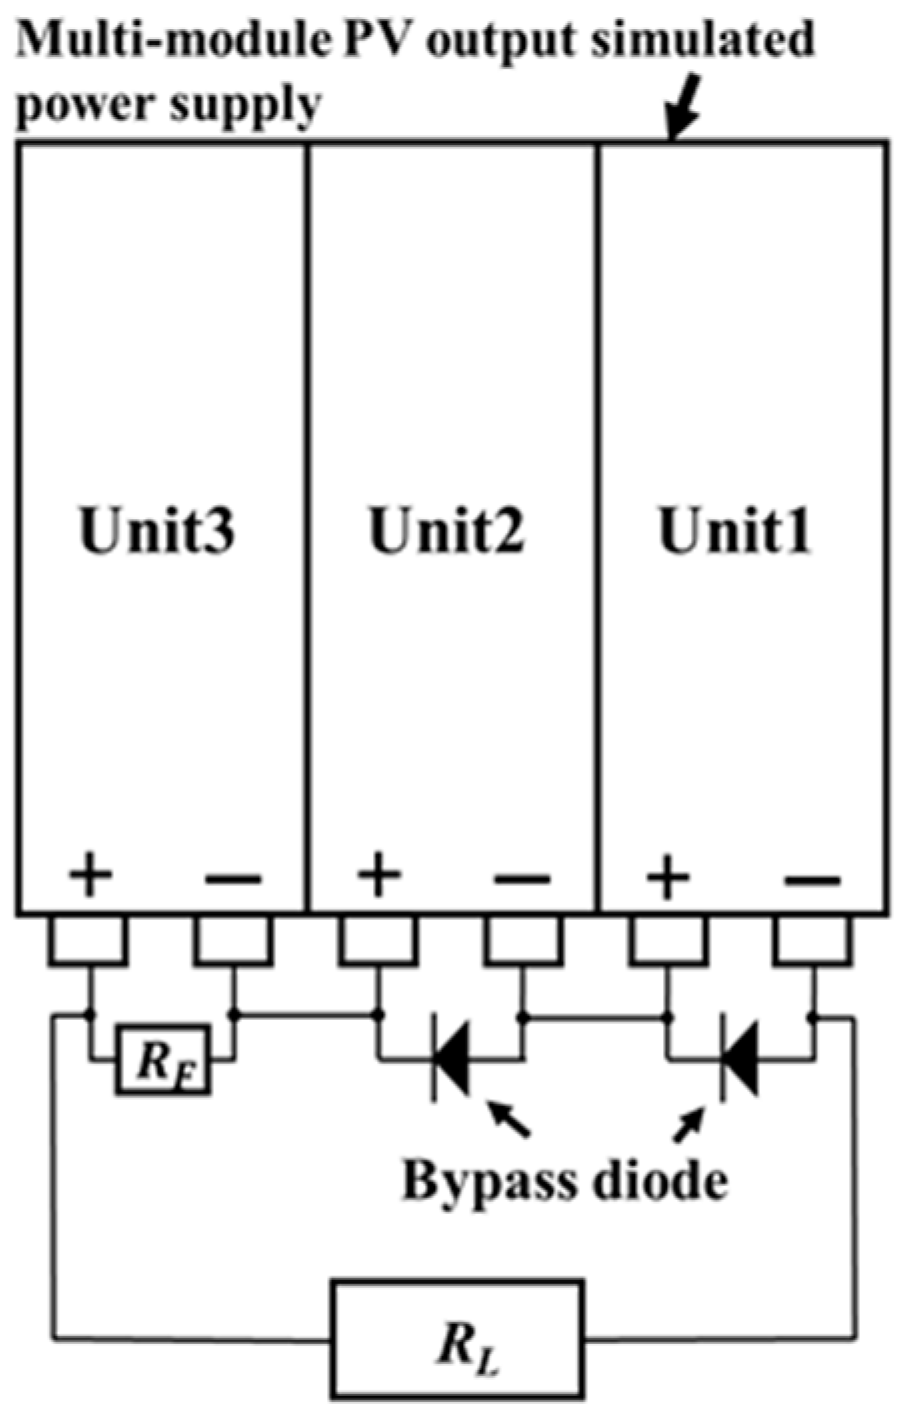
2. Materials and Methods

Figure 1 shows an overview of the experiment to simulate BPD failure in a PV module. In this test, we used a multimodule simulated power supply (Nippon Kernel System Co., Ltd., MEP12281) that can simulate the current–voltage (I–V) characteristics of the PV modules to reproduce a three-cell-string PV module. A Schottky barrier diode (SBD) (FSQ30A045, Kyocera Corp., repetitive peak reverse voltage 45 V, average rectified current 30 A) was connected to the power supply units, Units 1 and 2, to simulate a parent BPD. An electronic load RL (RIGOL, DL3031A) or a variable resistor (RSSD 25X158, 1 Ω) was used to simulate BPD failure in a PV module. This simulation aimed to replicate a PV module with a single BPD failure by connecting the load or resistor to a power supply unit (Unit 3) at various resistance values (RF), ranging from 0.1 to 50 Ω. Hereafter, it is referred to as the “BPD failure simulation PV module”. The output of each power supply unit (cell string) was used to assess the potential risk of burnout when a BPD failure occurred at different resistance values (RF) in PV modules with different short-circuit currents (ISC), open-circuit voltages (VOC), and fill factors (F.F.). The I–V characteristics of the BPD failure simulation PV module were measured using the aforementioned power supply output. Simultaneously, the terminal voltage and current of the resistance RF, which simulated the BPD failure, were measured. The objective was to assess the heat generation occurring during BPD failure by analyzing the electrical power dissipated across RF. These measurements were conducted while operating the output of the BPD failure simulation PV module at the maximum power point.

3. Results and Discussions

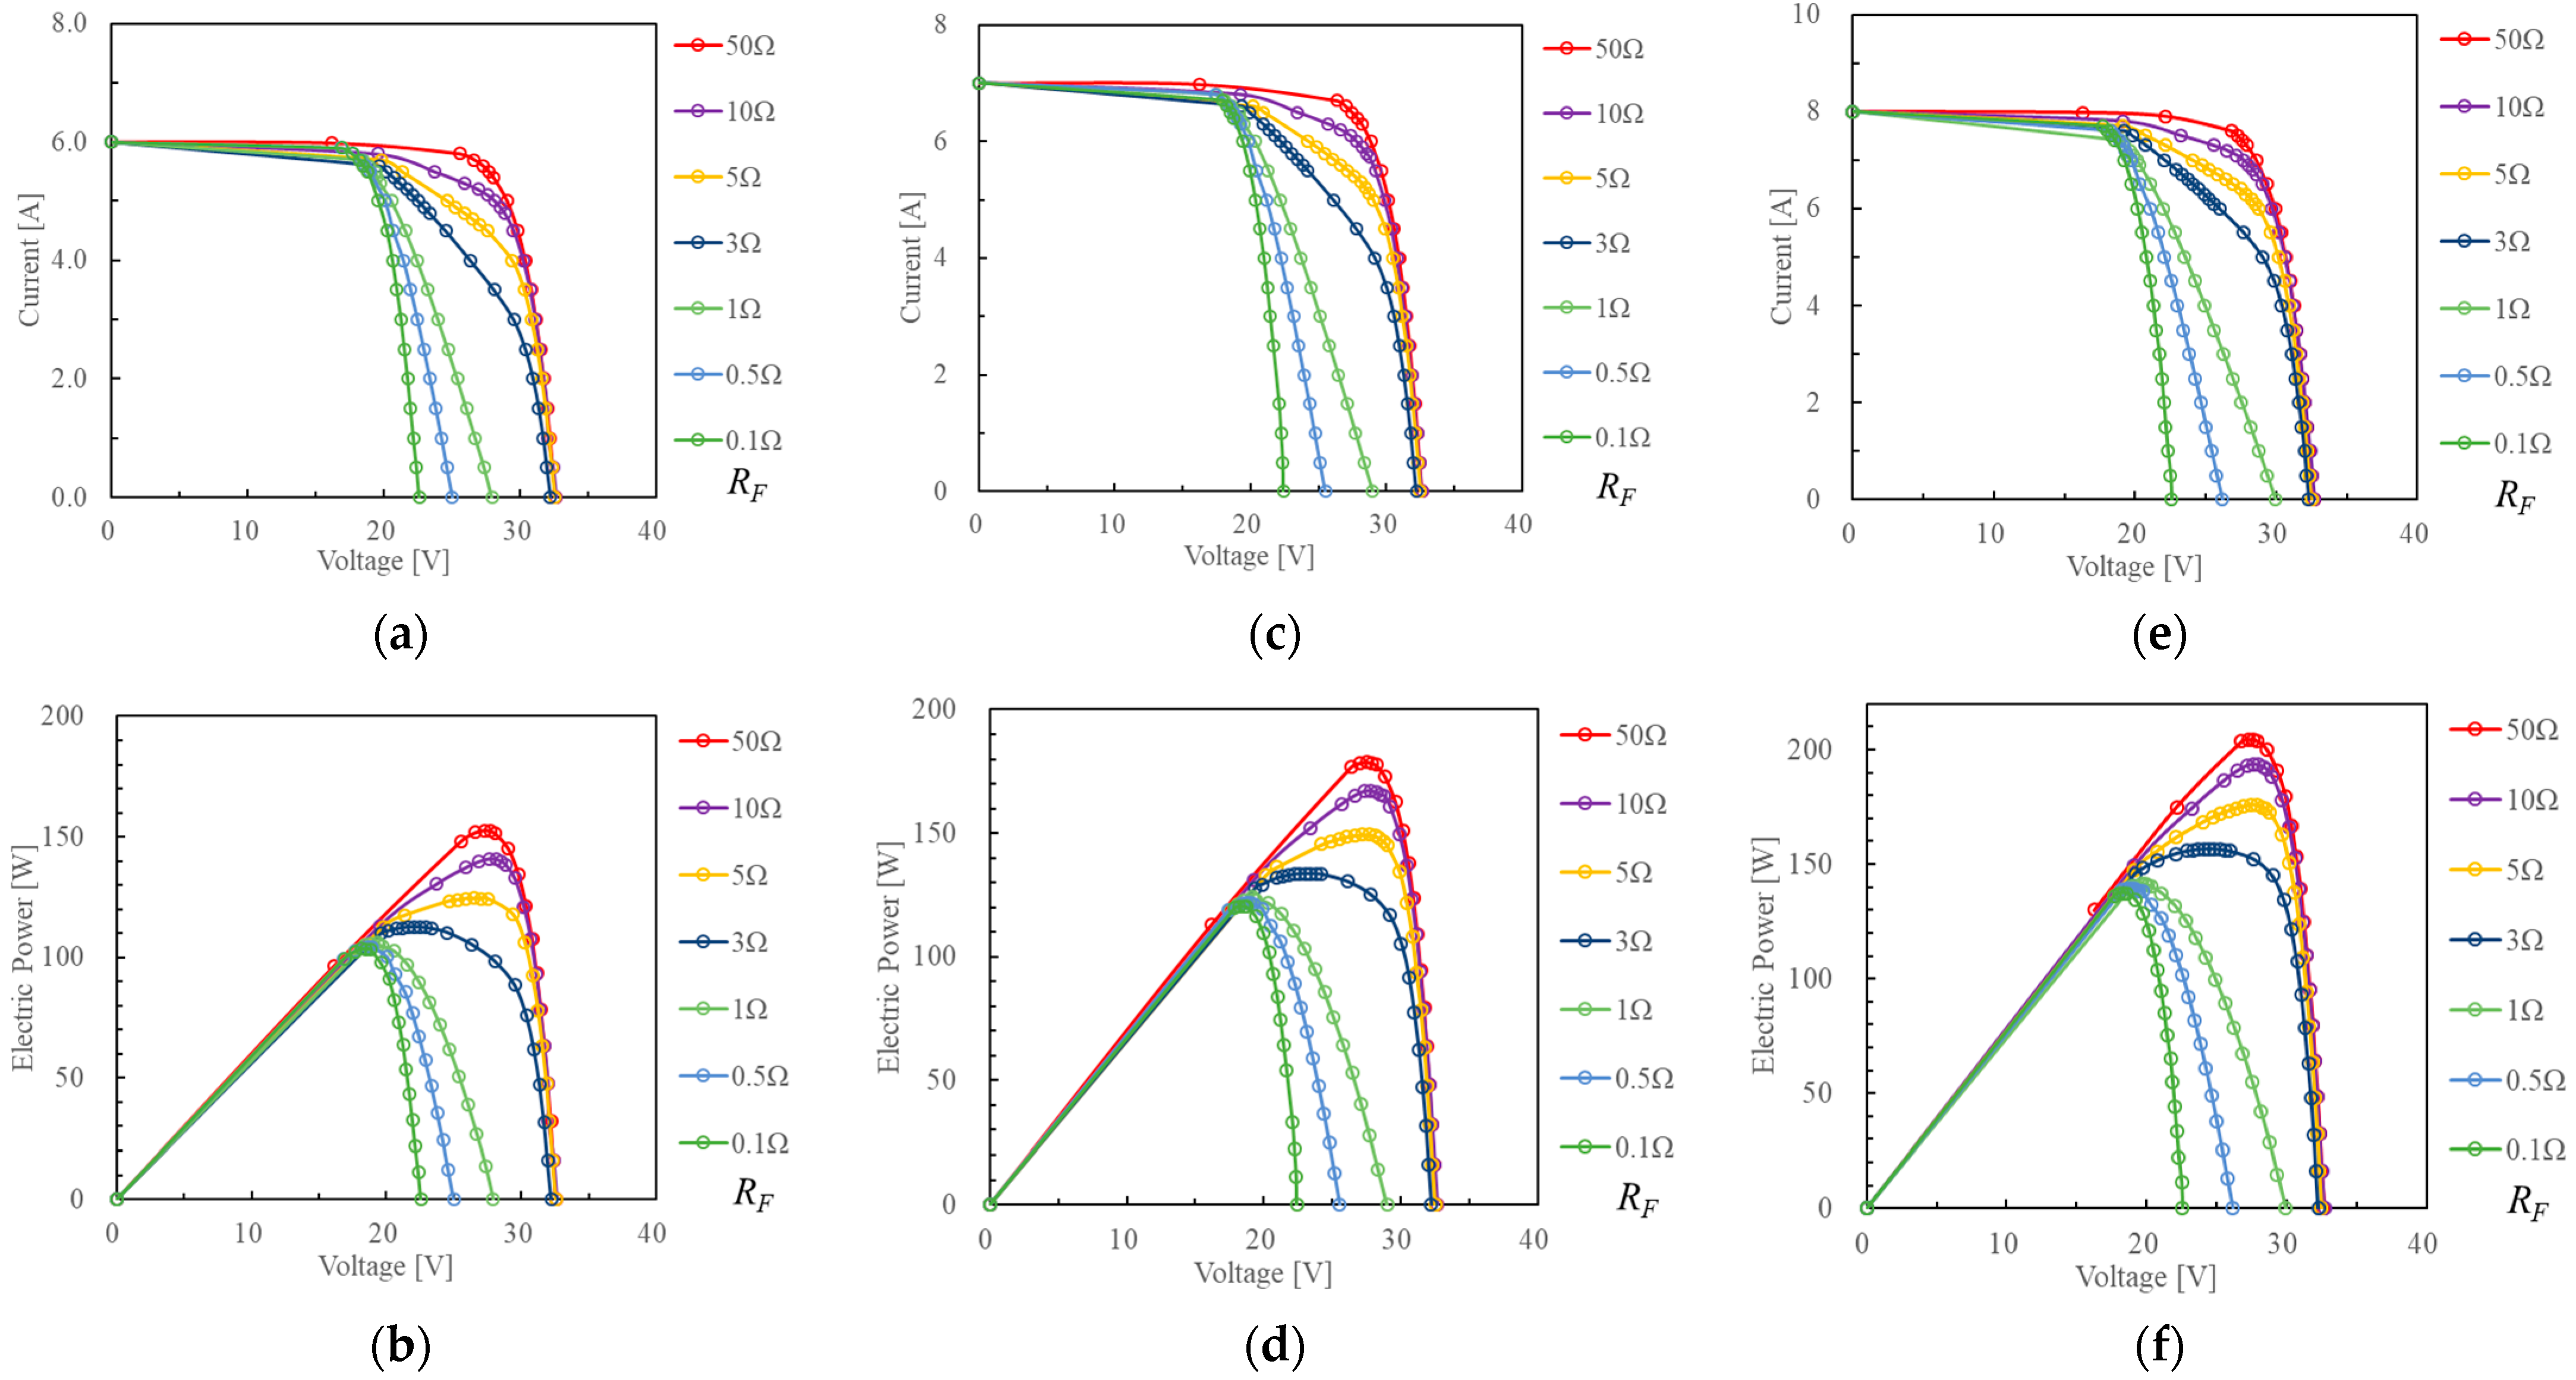
3.1. Verification of Burnout Risk of Faulty BPD in BPD Fault Simulation PV Modules at Short-Circuit Currents

Figure 2 shows the RF dependence of the I–V and power–voltage (P–V) characteristics of the BPD failure simulation PV module for each short-circuit current. The output of the multi-module power supply (cell string) in the same test was an open-circuit voltage VOC = 10.9 V and a short-circuit current ISC = 6.0, 7.0, and 8.0 A. Because the three power supply units were connected in series, the VOC at the output end of the BPD failure simulation PV module was 32.7 V, as shown in Figure 1. As shown in Figure 2, when the RF of the BPD decreased, the open-circuit and operating voltages decreased, owing to a decrease in the operating voltage of the cluster with RF (Unit 3).
Figure 3 depicts the BPD RF and electric power dissipated across RF in PV modules with BPD failure at different ISC values. This analysis focuses on the heat generation of RF when the PV module with BPD failure supplies electric power to the load at the maximum power point. As shown in Figure 3, the electric power reaches its maximum when RF ranges from 4 to 6 Ω for any ISC. The maximum electric power values for RF were measured as 12.6, 10.9, and 8.8 W for Isc = 8.0, 7.0, and 6.0 A, respectively. Moreover, higher Isc values result in larger PV output, leading to increased electric power dissipation across RF.
Figure 4 shows the variation in the electric power in RF with respect to the output end of the simulated PV power supply in an open state. This configuration simulated a state in which the load is disconnected temporarily, such as during periodic inspections. As shown in Figure 4, the electric power reached its maximum at approximately 1 Ω for all ISC values. Additionally, the maximum electric power values of RF were 70.0, 60.9, and 52.4 W for ISC = 8.0, 7.0, and 6.0 A, respectively. The results indicated that these values were five times greater than those obtained by simulating the load operation, as shown in Figure 3.

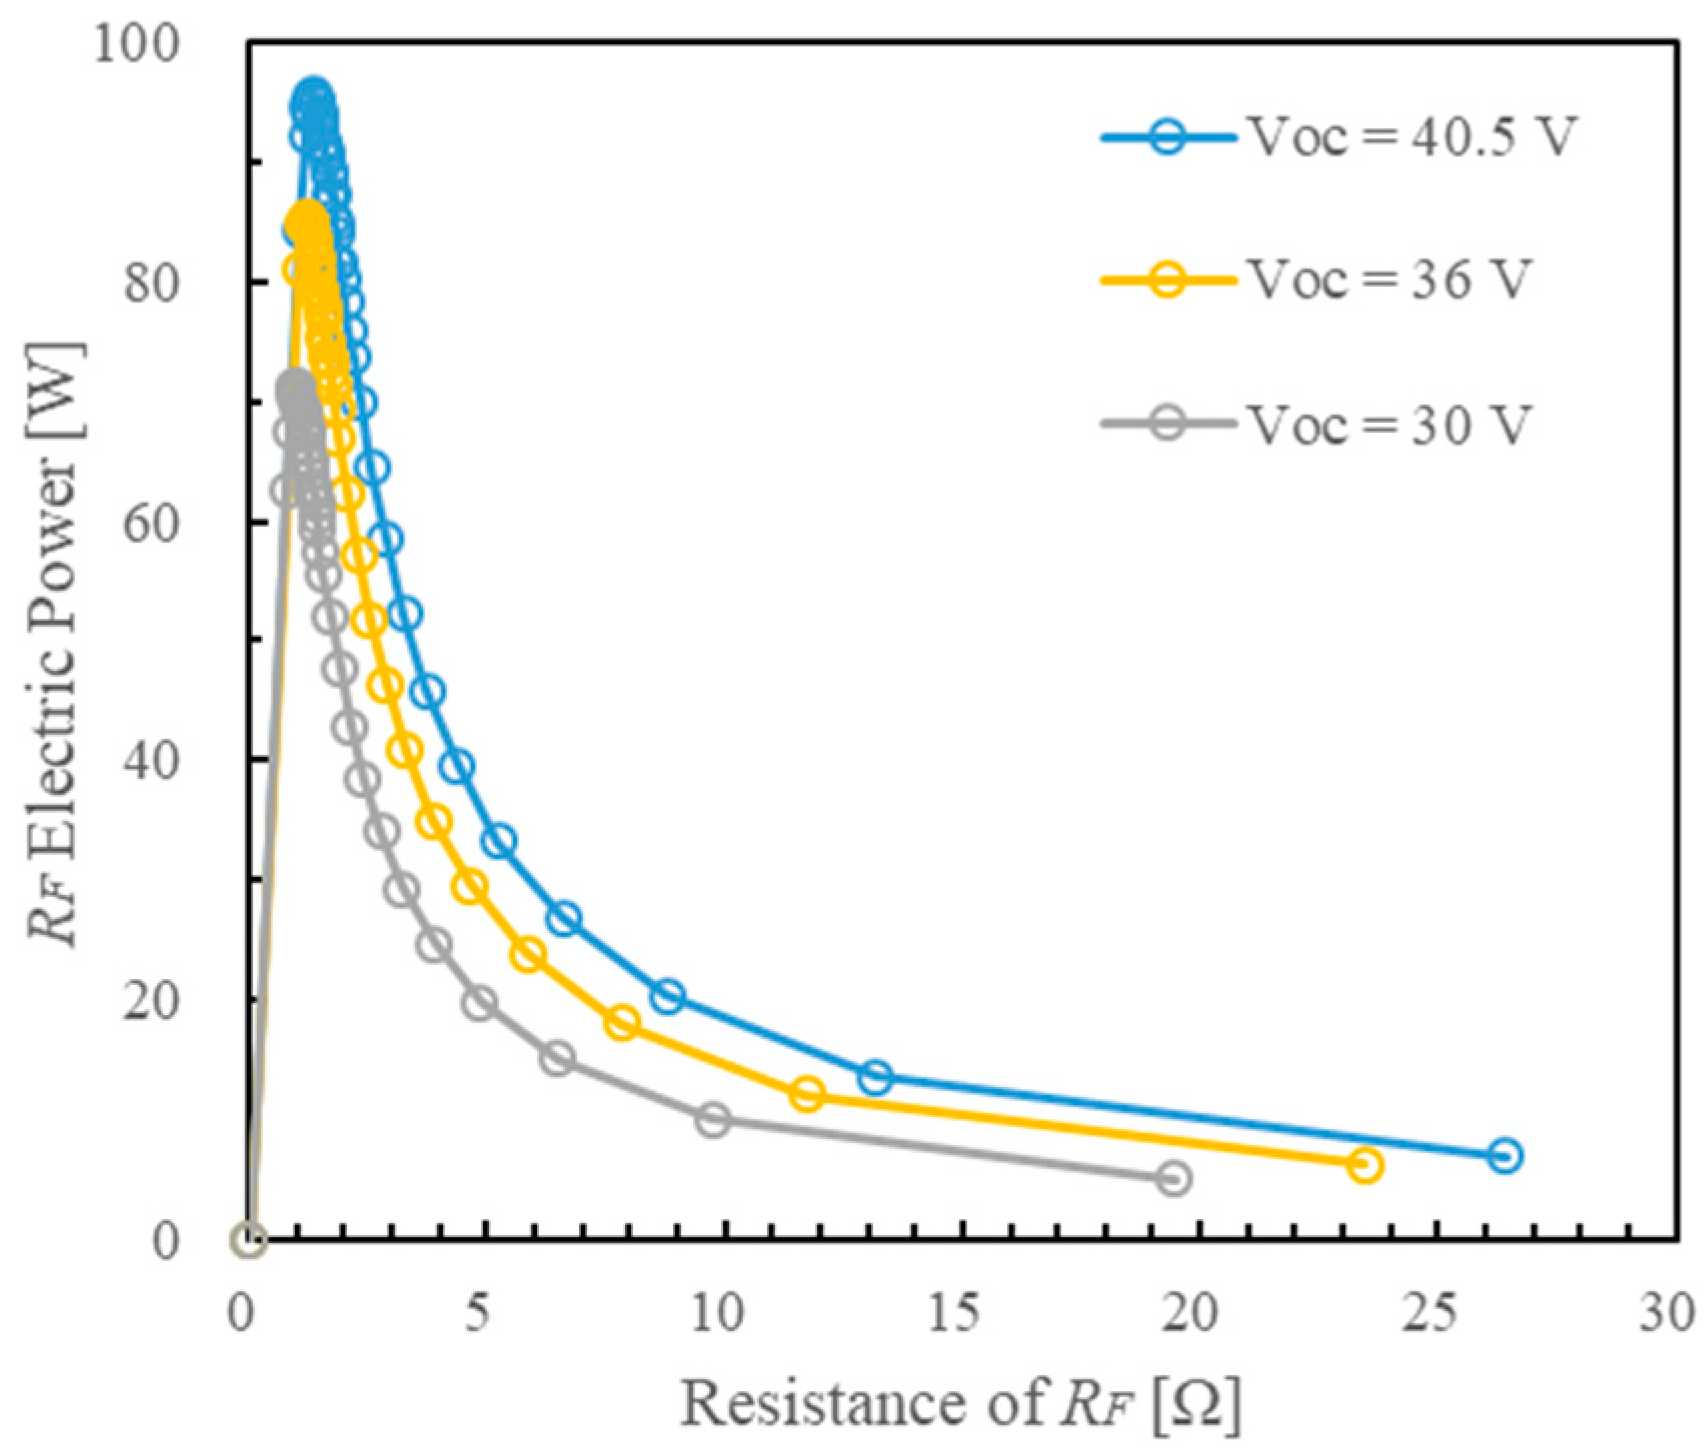
3.2. Verification of Burnout Risk of Faulty BPDs in the BPD Fault Simulation PV Module at Different Open-Circuit Voltages

Figure 5 shows the RF dependence of the I–V and P–V characteristics of the BPD failure simulation PV module at various VOC values. The multi-module power supply yielded VOC values of 10.0, 12, and 13.5 V at ISC = 8.95 A. Because the three power supply units were connected in series, the VOC values at the output ends of the BPD failure simulation PV module were 30, 36, and 40.5 V. As shown in Figure 5, a decrease in the RF of the BPD led to a decrease in the open-circuit and operating voltages. This was because the operating voltage of the cluster with RF (Unit 3) decreased.
Figure 6 shows the relationship between the fault simulation resistance RF and the electric power dissipated across RF when the BPD fault simulation PV module, operating at its maximum power point, was subjected to various VOC values. This configuration replicates the heat generation scenario of a faulty BPD when a PV module with a faulty BPD operates under load conditions. The electric power dissipated by RF increased when RF was approximately 3–5 Ω. In addition, a higher VOC resulted in higher output from the BPD failure simulation PV module, consequently leading to increased electric power dissipation by RF. The maximum electric power values of the RF were 17.3, 15.2, and 12.4 W when VOC = 40.5, 36, and 30 V, respectively. When VOC was large, the output of the PV module was also large, resulting in a larger dissipated PRF.
Figure 7 shows the relationship between the failure simulation resistance RF and electric power dissipated across RF when the output end of the simulated PV module, with one faulty BPD, was in an open state. The electric power of the RF reached its maximum when the RF was approximately 1 Ω. Additionally, the maximum electric power values of RF were 95.80, 86.0, and 71.4 W when VOC was 40.5, 36, and 30 V, respectively. These results indicated that the values were five times greater than those observed under the conditions of the simulated load operation, as depicted in Figure 3.

3.3. Verification of Burnout Risk of Faulty BPD in BPD Fault Simulation PV Module with Different Fill Factors

Figure 8 shows the I–V and P–V characteristics of the BPD failure simulation PV module at each RF. A decrease in the RF of the BPD led to a decrease in the open-circuit and operating voltages because the operating voltage of the cell string with RF (Unit 3) decreased.
Figure 9 shows the electric power consumed at different RF values when the output of the BPD failure simulation PV module operated at the maximum power point. The PVS operated under maximum power point tracking (MPPT) control using inverters. Therefore, the electric power dissipated by the failed BPD (RF) during PVS operation was evaluated based on the BPD failure simulation PV module operating at the maximum power point. The electric power of the RF in the BPD failure simulation PV module reached its maximum at approximately 2, 3, 3.5, and 4 Ω for F.F. = 0.6, 0.7, 0.75, and 0.8, respectively. Additionally, the PV modules with larger fill factors exhibited higher RF values, maximizing the electric power dissipated by RF. The maximum electric power values of the RF were 14.4, 12.8, 11.6, and 10.3 W for F.F. = 0.8, 0.75, 0.7, and 0.6, respectively. When F.F. was large, the PV output was also large, resulting in higher electric power dissipation by RF. Figure 10 shows the electric power dissipated by different RF values when the output end of the BPD failure simulation PV module was open. This experiment assumed a state in which the load was disconnected, owing to periodic inspections of the PVS. As shown in Figure 10, the maximum electric power was reached when RF was approximately 1 Ω for all F.F. values. Additionally, the maximum electric power dissipated by RF was 76.6, 72.6, 67.8, and 58.0 W when F.F. = 0.8, 0.75, 0.7, and 0.6, respectively. These values were more than five times the electric power dissipated by RF under load conditions for any F.F. Therefore, the BPD failure of the PV module under the load of a disconnected PV system poses a particularly high risk of burning.

4. Discussion

This study investigated the relationship between the failed BPD resistance and power dissipation of a BPD when its PV modules fail at varying ISC, VOC, and F.F. values. The results indicated that the power consumption of the failed BPD is particularly high, ranging from approximately 2 to 10 Ω when the PV module operates at its maximum power point. This is attributed to the failed BPD (RF) and the grid load being connected in parallel, which maximizes the circulating current flowing in the RF under the specified conditions. In addition, when the load is disconnected, the risk of heat generation is significantly higher at BPD fault resistance values of approximately 0.1–10 Ω. Furthermore, when the load is disconnected, the heat generated by the BPD is significantly higher than when the grid load is connected, as the energy of the PV module is consumed by the failed BPD. Therefore, a BPD failure with a resistance of approximately 0.1–10 Ω poses a high risk of burnout, particularly during load disconnection, owing to the increased heat generated by the failed BPD. This study did not examine the partial shading of modules in a PV array containing a PV module with a failed BPD. The characteristics of RF and the heat generated by the failed BPD under these conditions should also be investigated in the future.
BPD failures are often caused by lightning strikes. SBDs, which are often used in BPDs, have a lower peak reverse voltage than PN junction diodes. Therefore, we can easily assume that they are vulnerable to overvoltage, such as lightning. Diodes used as BPDs often have a rated forward current of 15–30 A. As SBDs frequently fail due to lightning, the use of PN junction diodes or SiC SBDs with a high peak reverse voltage and a higher-rated forward current than 30 A is considered effective in reducing lightning-induced BPD failures. We also believe that insufficient thermal design of the junction box in which the BPD is housed influences failure and burnout after failure, due to the energization of the BPD for a long period of time. Improving the thermal design of the junction box would also contribute to limiting the transition from failure to burnout of BPDs.

5. Conclusions

We conducted tests on PV modules with different ISC, VOC, and F.F. values to simulate conditions in which one BPD fails at various resistance values. Furthermore, we examined the impact of the faulty BPD’s resistance values on PV module burnout. The results indicate that the electric power reaches its maximum when RF is within the range of 2–10 Ω for any ISC. Notably, a large ISC results in a large PV output, resulting in increased electric power dissipation in RF. At a higher ISC, the PV output also increases, leading to higher electric power dissipation in the RF. A larger F.F. results in increased PV output and higher electric power dissipation in the RF.
Furthermore, when the load at the PV module’s output is disconnected, the electric power reaches its maximum in the BPD failure PV module when the RF is approximately 1 Ω for all ISC, VOC, and F.F. values. The RF consumed more than five times as much power as when the load was connected. Therefore, when a BPD failure occurs during both PVS load operation and load disconnection, the failure is more likely to occur at a BPD failure resistance value of approximately 0.1–10 Ω. This type of failure leads to an increase in electric power within the faulty BPD, thereby increasing the burnout risk. Notably, when a load is disconnected from a PVS with BPD failure, the electric power of the faulty BPD failure becomes five times greater than the value during the load operation, further escalating the burnout risk. Therefore, special precautions must be taken when disconnecting a load from a PVS with BPD failure, such as operating in low-light conditions or shielding the light-receiving surface of a PV module.

Author Contributions

Conceptualization, T.H.; methodology, T.H., I.N., M.F., N.I. and S.O.; validation, T.H. and T.A.; resources, T.H.; data curation, T.H. and T.A.; writing—original draft preparation, T.H.; writing—review and editing, T.H., I.N., M.F., N.I. and S.O.; supervision, T.H.; project administration, T.H.; funding acquisition, T.H. All authors have read and agreed to the published version of the manuscript.

Funding

This work was supported by JSPS KAKENHI (Grant No. JP21H01580).

Data Availability Statement

Data will be made available on request.

Acknowledgments

The authors would like to thank T. Koyama, S. Kondo, and T. Watanabe for their technical assistance with the experiments.

Conflicts of Interest

The authors declare no conflict of interest.

References

  1. Plan, S.E. Agency for Natural Resources and Energy, Ministry of Economy, Trade and Industry Japan. 2022. Available online: https://www.enecho.meti.go.jp/about/whitepaper/2020pdf/whitepaper2020pdf_3_3.pdf (accessed on 4 August 2023).
  2. Ministry of Economy, Trade and Industry; Agency for Natural Resources and Energy. Japan‘s Energy 10 Questions for Understanding the Current Energy Situation; Ministry of Economy, Trade and Industry; Agency for Natural Resources and Energy: Tokyo, Japan, 2022. [Google Scholar]
  3. Köntges, M.; Kurtz, S.; Packard, C.; Jahn, U.; Berger, K.A.; Kato, K.; Friesen, T.; Liu, H.; Van Iseghem, M.; Wohlgemuth, J.; et al. Review of Failures of Photovoltaic Modules; International Energy Agency: Paris, France, 2014; Available online: https://repository.supsi.ch/9645/1/IEA-PVPS_T13-01_2014_Review_of_Failures_of_Photovoltaic_Modules_Final.pdf (accessed on 4 August 2023).
  4. Oke, S.; Sakai, H.; Tottori, H.; Shimizu, Y.; Nanno, I.; Hamada, T.; Ishikura, N.; Fujii, M. Characteristics and risks of broken bypass diode with induced lightning. In Proceedings of the Grand Renewable Energy, Yokohama, Japan, 17–22 June 2018. [Google Scholar]
  5. Oke, S.; Sakai, H.; Tottori, H.; Shimizu, Y.; Choo, N.; Nanno, I.; Hamada, T.; Ishikura, N.; Fujii, M. I-V characteristics of broken bypass diode on PV module. In Proceedings of the 35th EU-PVSEC, Brussels, Belgium, 24–28 September 2018; pp. 1996–2000. [Google Scholar]
  6. Oke, S. Influence of induced lightning on photovoltaic power generation equipment. Annu. Meet. Rec. IEE Jpn. 2019, 6, S6. [Google Scholar]
  7. Hamada, T.; Nakamoto, K.; Nanno, I.; Ishikura, N.; Fujii, S.O.M. Effect of failure characteristics of bypass diode in photovoltaic solar module on burnout. J. Inst. Elect. Instal. Engnr. Jpn. 2022, 42, 16–17. (In Japanese) [Google Scholar]
  8. Azuma, T. Study on the Relationship between Power Consumption and Electrical Characteristics of a Failed BPD during Load Operation of a Photovoltaic Module with Bypass Diode Failure. In Proceedings of the Grand Renewable Energy 2022 International Conference (GRE2022), Tokyo, Japan, 13–20 December 2022. [Google Scholar]
Figure 1. Overview of reproduction test of PV module with BPD failure.
Energies 16 05879 g001
Figure 2. PV module I–V and P–V characteristics at each fault resistance value. (a) I–V curve at ISC = 6 A; (b) P–V curve at ISC = 6 A; (c) I–V curve at ISC = 7 A; (d) P–V curve at ISC = 7 A; (e) I–V curve at ISC = 8 A; (f) P–V curve at ISC 8 = A.
Energies 16 05879 g002
Figure 3. Relationship between the electric power (PRF) and fault resistance value (RF) of a faulty BPD when the BPD failure simulation PV module (ISC = 6.0, 7.0, and 8.0 A) operates at the maximum power point.
Energies 16 05879 g003
Figure 4. Relationship between PRF and RF of the faulty BPD when the BPD failure simulation PV module (ISC = 6.0, 7.0, and 8.0 A) operates under no-load conditions.
Energies 16 05879 g004
Figure 5. PV module I–V and P–V characteristics at each fault resistance value. (a) I–V curve at VOC = 30 V; (b) P–V curve at VOC = 30 V; (c) I–V curve at VOC = 36 V; (d) P–V curve at VOC = 36 V; (e) I–V curve at VOC = 40.5 V; (f) P–V curve at VOC = 40.5 V.
Energies 16 05879 g005
Figure 6. Relationship between PRF and RF of the faulty BPD when the BPD failure simulation PV module (VOC = 40.5, 36, and 30 V) operates at the maximum power point.
Energies 16 05879 g006
Figure 7. Relationship between PRF and RF of the faulty BPD when the BPD failure simulation PV module (VOC = 40.5, 36, and 30 V) operates with no load.
Energies 16 05879 g007
Figure 8. PV module I–V and P–V characteristics at each RF. (a) I–V curve at F.F. = 0.6; (b) P–V curve at F.F. = 0.6; (c) I–V curve at F.F. = 0.7; (d) P–V curve at F.F. = 0.7; (e) I–V curve at F.F. = 0.75; (f) P–V curve at F.F. = 0.75; (g) I–V curve at F.F. = 0.8; (h) P–V curve at F.F. = 0.8.
Energies 16 05879 g008
Figure 9. Relationship between PRF and RF of the faulty BPD when the BPD failure simulation PV operates at the maximum power point.
Energies 16 05879 g009
Figure 10. Relationship between PRF and RF of the faulty BPD when the BPD failure simulation PV module is in the no-load condition.
Energies 16 05879 g010
Disclaimer/Publisher’s Note: The statements, opinions and data contained in all publications are solely those of the individual author(s) and contributor(s) and not of MDPI and/or the editor(s). MDPI and/or the editor(s) disclaim responsibility for any injury to people or property resulting from any ideas, methods, instructions or products referred to in the content.

