Article

Mass Transfer Analysis of CO2-Water-Rock Geochemical Reactions in Reservoirs

1
School of Petroleum Engineering, Northeast Petroleum University, Daqing 163318, China
2
Sanya Offshore Oil & Gas Research Institute, Northeast Petroleum University, Sanya 572025, China
*
Author to whom correspondence should be addressed.
Energies 2023, 16(16), 5862; https://doi.org/10.3390/en16165862
Submission received: 2 July 2023 / Revised: 25 July 2023 / Accepted: 31 July 2023 / Published: 8 August 2023
(This article belongs to the Special Issue CO2 Enhanced Oil Recovery and Carbon Sequestration)

Abstract

:
It is difficult to exploit low-permeability reservoirs, and CO2 flooding is an effective method to improve oil recovery from low permeability reservoirs. However, in the process of CO2 flooding, acidic fluids dissolved in formation water will react with rock to cause dissolution and precipitation, resulting in pores and precipitates, changing the evolution law of seepage channels, destroying formation integrity, and affecting the effect of CO2 oil displacement. The change in rock’s physical properties and the mass transfer law between CO2-water-rock are unclear. This paper considers the coupling effects of seepage, mechanics, and chemistry when CO2 is injected into the formation. The mass transfer model of CO2-water-rock in the geochemical reaction process is established on this basis. The physical properties of the reservoir after CO2 injection are quantitatively studied based on the microscopic mechanism of chemical reaction, and the migration law of solute in the reservoir rock during CO2 flooding under the coupling effects of multiple fields is clarified. The experimental results show that with the increase in reaction time, the initial dissolution reaction of formation rocks will be transformed into a precipitation reaction of calcite, magnesite, and clay minerals. The porosity and permeability of the rocks near the well first increase and then decrease. The far well end is still dominated by dissolution reactions, and the average values of formation porosity and permeability show an upward trend. Although the dissolution reaction of CO2-water-rock can improve the physical properties of reservoir rocks to a certain extent, the mutual transformation of the dissolution reaction and precipitation reaction further exacerbates the heterogeneity of formation pore structure, leading to the instability of CO2 migration, uneven displacement, and destruction of formation stability. The research results of this paper solve the problem of quantitative calculation of physical parameters under the coupling effect of multiple fields after CO2 injection into reservoirs and can predict the changes in formation physical properties, which can provide a certain theoretical basis for evaluating formation integrity and adjusting CO2 injection under the condition of CO2 flooding.

1. Introduction

Currently, the recovery rate of most oil reservoirs in the world is less than 60%, so secondary oil recovery is needed, which limits the development scope of oil reservoirs and increases the exploitation cost [1,2,3]. In the petroleum exploitation industry, tertiary oil recovery is needed when secondary oil recovery is no longer economical. That is, a miscible liquid such as CO2 is often injected to displace the remaining oil in the reservoir [4,5,6]. There have been many studies on the multi-field coupling of geological bodies during CO2 oil displacement. The practice has proven that CO2 flooding, as a gas flooding method, has unique supercritical properties that can improve reservoir fluid properties, reduce interfacial tension, extract oil and gas resources stored in pores and micro-fractures, and significantly improve crude oil recovery [7,8,9]. However, in the process of CO2 flooding, the acidic fluid dissolved in the formation water will react chemically with the ore rock. The chemical reaction changes the micromorphology and pore structure of the rock surface, softens and deforms the particles of the rock skeleton, and changes the evolution law of seepage channels, thus affecting oil displacement efficiency.
In order to understand the interaction between CO2-water-rock, many scholars have combined indoor experiments and numerical simulations to obtain the reaction laws of different minerals [10]. Law D. [11], Ketzer [12], Andre L. [13], and Wandrey et al. [14]. conducted static reaction experiments at high temperatures and pressure. These experimental results indicate that carbonate and silicate minerals have been dissolved to different degrees. In the later stage of the experiment, carbonate mineral precipitation represented by calcite usually appears, and in some cases, silicate mineral precipitation represented by feldspar also occurs. Xu et al. [15] conducted reaction experiments between CO2 fluid and sandstone, analyzing the interaction between CO2 fluid and various sandstone minerals. Based on a simplified reactive solute transport model, Credoz et al. [16] found that carbonate minerals are the most reactive minerals in the system. Gaus et al. [17] conducted static experiments and dynamic simulation studies and found that the effective diffusion coefficient of CO2 is very small. After thousands of years, the influence range in the caprock is only a few meters. Gherardi et al. [18] used the multiphase fluid migration simulation software TOUGHREACT V4.13 to simulate the caprock in the CO2 storage system of abandoned gas fields. They proposed that calcite was the main mineral to control the porosity and permeability of the caprock during the simulation. These studies effectively improve understanding of the microscopic mechanism of chemical reactions under CO2 storage conditions.
Research has shown that the acidified solution formed by the dissolution of CO2 can exist in the formation for thousands of years, so the influence of the CO2-water-rock reaction on the physical properties of reservoir rocks cannot be ignored. Angeli et al. [19] and Erickson [20] studied the microstructural changes of shale when supercritical CO2 passes through shale caprocks. The results indicate that when the pore pressure accumulates, the fracture is more likely to reactivate, thereby increasing the possibility of CO2 infiltration. Acidic CO2 fluids usually decrease the permeability of sandstone reservoirs, and the impact is much greater than the porosity. The CO2-water-rock interaction experiment conducted by Shiraki et al. [21] shows that the porosity of the core has not changed after the experiment. However, a small amount of kaolinite is generated in the core and blocks the pore throat, leading to a significant decrease in permeability. Wigand et al. [22] conducted indoor experimental research on the sealing performance of caprocks after CO2 injection. The experimental results showed that CO2 did not overflow upwards along the pre-existing fractures in the core but rather precipitated in the form of carbonate minerals in the fractures. They formed a thin carbonate shell between the caprock and the cement, thereby preventing the leakage of CO2 gas. Bildstein et al. [23] used different reactive solute transport simulation software to simulate the impact of CO2 injection on the caprock. The porosity of the caprock has obviously changed in the simulated ten thousand years. However, the reaction only happened within a few meters of the interface between the reservoir and the caprock, and there was no leakage. Under the action of CO2-rich fluid, carbonate cement and alkali minerals such as feldspar in clastic rock are dissolved, forming intragranular dissolved pores of feldspar or intergranular pores between quartz particles, which significantly improves its porosity and permeability [24,25]. In summary, the reaction between CO2 and formation minerals is an important mechanism for developing secondary pores and dissolution-type reservoirs in deep reservoirs. The CO2 injection time may range from decades to hundreds of years, but the period for risk assessment in the later injection stage needs to be extended to thousands of years or even longer. In addition, the influence of geochemical reaction processes should also be considered when studying the influence of physical and chemical processes on the sealing ability of caprock in the geological period. After injecting CO2 into the formation, the primary minerals of the reservoir will capture the acidic fluid, and a series of chemical reactions will occur to generate secondary minerals, which are sealed in the form of carbonates in the formation and will have an impact on the reservoir rocks [26,27]. Dissolving carbonate cement will increase the permeability of the reservoir, improve the physical properties of the carbonate reservoir, and improve the efficiency of CO2 flooding. However, the precipitation reaction of clay minerals caused by CO2 injection can also block the pore throat, causing a decrease in reservoir porosity and permeability values and decreasing oil displacement efficiency. Although the above research qualitatively explains the formation change after CO2 injection, analyzes the chemical reaction between the formation and acidic fluid, and obtains the change in chemical composition of the reservoir rock, the quantitative change law of the reservoir physical properties and the mass transfer law between CO2-water-rock under the coupling of multiple fields have not been clarified.
In this paper, the coupling effect of seepage, mechanics, and chemistry is considered after CO2 injection, and the geochemical reaction process of the reservoir after acid fluid injection is simulated by TOUGHREACT V4.13 software. Combined with the solute transport law and chemical reaction mechanism, a mass transfer model of CO2-water-rock was established. Based on the microscopic mechanism of chemical reaction, the changes in physical properties of reservoirs after CO2 injection are quantitatively studied, and the migration law of solute in reservoir rocks during CO2 flooding under the coupling effect of multiple fields is clarified.

2. Mass Transfer Model for Reservoirs

2.1. Model Building

The contact of CO2 with primary reservoir minerals will trigger physical and chemical changes, including multiphase fluid flow, solute migration, and chemical reactions between fluid and formation minerals [28,29]. Part of the injected CO2 is dissolved in the formation water, forming carbonic acid and decomposing into H+ and HCO3 ions. Dissolved ions in the water phase react with minerals in the formation, resulting in precipitation or dissolution of newly formed or original minerals, which changes the porosity and permeability of the reservoir. The above geochemical reactions determine the effect of injecting carbon dioxide to improve reservoir recovery. In order to further explore the migration law of solutes in reservoir rocks during CO2 flooding, this paper simulates the geochemical reaction process between acid fluid and reservoir after CO2 gas is continuously injected into the formation using TOUGHREACT V4.13 software. A reservoir mass transfer model is established based on solute transport laws and chemical reaction mechanisms, and the influence of chemical reactions on CO2 migration in formations are studied. TOUGHREACT, a multiphase fluid migration simulation software, is suitable for various solute reactions and geochemical migration systems. The software can simulate the movement of multiphase and multi-component reaction solutes in porous and fractured media under isothermal or non-isothermal conditions and various underground thermodynamic and chemical reaction processes in a large range of geochemical conditions. In this paper, the solute transport reaction model is used to couple substance transport and chemical reaction, and an accurate description of the migration process of CO2 solute in reservoir rocks during a chemical reaction is realized.

2.1.1. Solute Transport

The flow control equation for single-phase flow is:
ϕ ρ f t = ρ f q + ρ f Q a ,
in the formula, ϕ is the porosity of the rock, %; ρf is the fluid density, kg·m−3; t is the flow time, s; q is the volume flux of the liquid, m3·m−2·s−1; and Qa is the volume source term, s−1.
The phenomenon of molecular diffusion according to Fick’s first law is described by the authors of [30]. This law indicates that the diffusion flux of a substance in a solution is proportional to the concentration gradient.
J j = D j C j ,
in the formula, Jj is the diffusion flux of substance j, kg·m−2·s−1; Dj is the diffusion coefficient of substance j, m2·s−1; and Cj is the volume concentration of substance j, kg·m−3. Integrate the diffusion flux within the volume to obtain Fick’s second law [31]:
C j t = [ J j ] = [ D j C j ] .
By combining material diffusion, fluid flow, and chemical reactions, the material transport equilibrium equation is obtained:
ϕ C j t = ϕ D j C j q C j r = 1 N r 1000 v r M r b = 1 N b 1000 v b M b ,
in the formula, r represents the liquid phase substance r; Nr is the number of liquid phase substances; νr is the reaction rate of liquid phase substance r, mol·m−3·s−1; Mr is the molar mass of liquid phase substance r, g/mol; b represents solid-liquid phase substance b; Nb is the number of solid-liquid phase substances; νb is the reaction rate of solid-liquid phase substance b, mol·m−3·s−1; and Mb is the molar mass of solid-liquid phase substance b, g/mol. The left side of Equation (4) represents the accumulation term. The first term on the right side of Equation (4) represents the change in material diffusion; the second represents the change in flow migration; the third represents the liquid phase reaction amount; and the fourth represents the solid-liquid reaction amount.

2.1.2. Precipitation and Dissolution of Minerals

The precipitation and dissolution of reservoir minerals are important characteristics of the CO2 flooding process. The mass transfer model considers the precipitation or dissolution of minerals as a chemical reaction between solutes and minerals and uses the mineral saturation index to determine the saturation state of minerals [32,33,34]. The calculation formula for the mineral saturation index is:
S I x = lg x = 1 N P c x , i γ x , i K x       ( i = 1 , 2 , P ) ,
in the formula, x represents a certain mineral; i represents the i ion in mineral x; P is the number of ions in mineral x; NP is the number of mineral species in the rock; Cx,i is the molar concentration of the i ion in mineral x, mol·m−3; γx,i is the activity coefficient of the i ion in mineral x, dimensionless; Kx is the equilibrium constant of mineral x; and SIx is the saturation index of mineral x. If SIx < 0, the x mineral is unsaturated and will undergo dissolution. If SIx = 0, the x mineral is saturated with no precipitation or dissolution. If SIx > 0, the x mineral is in a supersaturated state, and precipitation occurs.

2.1.3. Chemical Reaction Rate

Calculate the reaction rate of mineral dissolution or precipitation using the Lasaga [35] reaction rate model:
v x = ± λ x c x η x = 1 , , N P
in the formula, vx represents the reaction rate of x mineral dissolution or precipitation, mol·m−3·s−1, with a positive value indicating dissolution and a negative value indicating precipitation; λx is the reaction rate constant of x mineral, which is temperature dependent; Cx is the molar concentration of x mineral, mol·m−3; and η is the reaction order, which depends on the reaction mechanism and can be determined experimentally.

2.1.4. Porosity and Permeability

The effect of CO2 aqueous solution on rocks can be divided into particle self-dissolution and mineral dissolution. The erosion of chemical reactions on rocks is far greater than dissolution. The dissolution amount of rock surface particles caused by the formation water can be ignored. This calculation considers the increase or decrease in porosity caused by chemical dissolution and precipitation reactions, which refers to the decrease in the volume of minerals participating in chemical reactions in the reservoir rock as an increase in pore volume. According to the chemical equilibrium equation, the quality change of a certain mineral participating in a chemical reaction in the reservoir rock is:
m t = n M t = ρ V ϕ t ,
in the formula: m is the mass of a certain mineral participating in the chemical reaction, g; t’ is the reaction time, s; n is the amount of substance in the mineral, mol; M is the molar mass of the mineral, g/mol; ρ is the density of the mineral, g/cm3; and V is the volume of the rock, cm3.
Due to the simultaneous occurrence of chemical reactions among multiple minerals in reservoir rocks, the volume reduction of the minerals participating in the chemical reactions in the reservoir rocks can be superimposed and expressed as follows:
ϕ t ' = 1 V x = 1 N P n x t ' M x ρ x ,
in the formula: ϕ t represents the change in porosity, %; nx is the amount of substance of x mineral, mol; Mx is the molar mass of x mineral, g/mol; and ρx is the density of x mineral, g/cm3.
The volume change of a single mineral after a chemical reaction can be obtained by multiplying its molar volume by the reaction rate and then by the reaction time. The changes in the porosity of interlayer rocks caused by chemical reactions can be attributed to the volume changes of minerals participating in chemical reactions, and the porosity of rocks can be calculated from the changes in mineral composition [36]:
ϕ = 1 x = 1 N p φ x ,
φ x = V x V s + V p ,
in the equation: φx is the molar volume fraction of x mineral in the rock, %; Vx is the volume of x mineral, cm3; Vs is the volume of solid in the rock, cm3; and Vp is the pore volume of the rock, cm3.
The change in permeability of a single rock unit can be calculated from the change in porosity. According to the Carman–Kozeny [37,38] formula, the change in permeability is:
k 1 = k 0 1 ϕ 0 2 1 ϕ 1 2 ϕ 1 ϕ 0 3 ,
in the equation: ϕ0 is the porosity of the rock in the grid unit before participating in chemical reactions, %; ϕ1 is the porosity of the rock in the grid unit after participating in chemical reactions, %; k0 is the permeability of the rock in the grid unit before participating in chemical reactions, m2; and k1 is the permeability of the rock in the grid unit after participating in chemical reactions, m2.

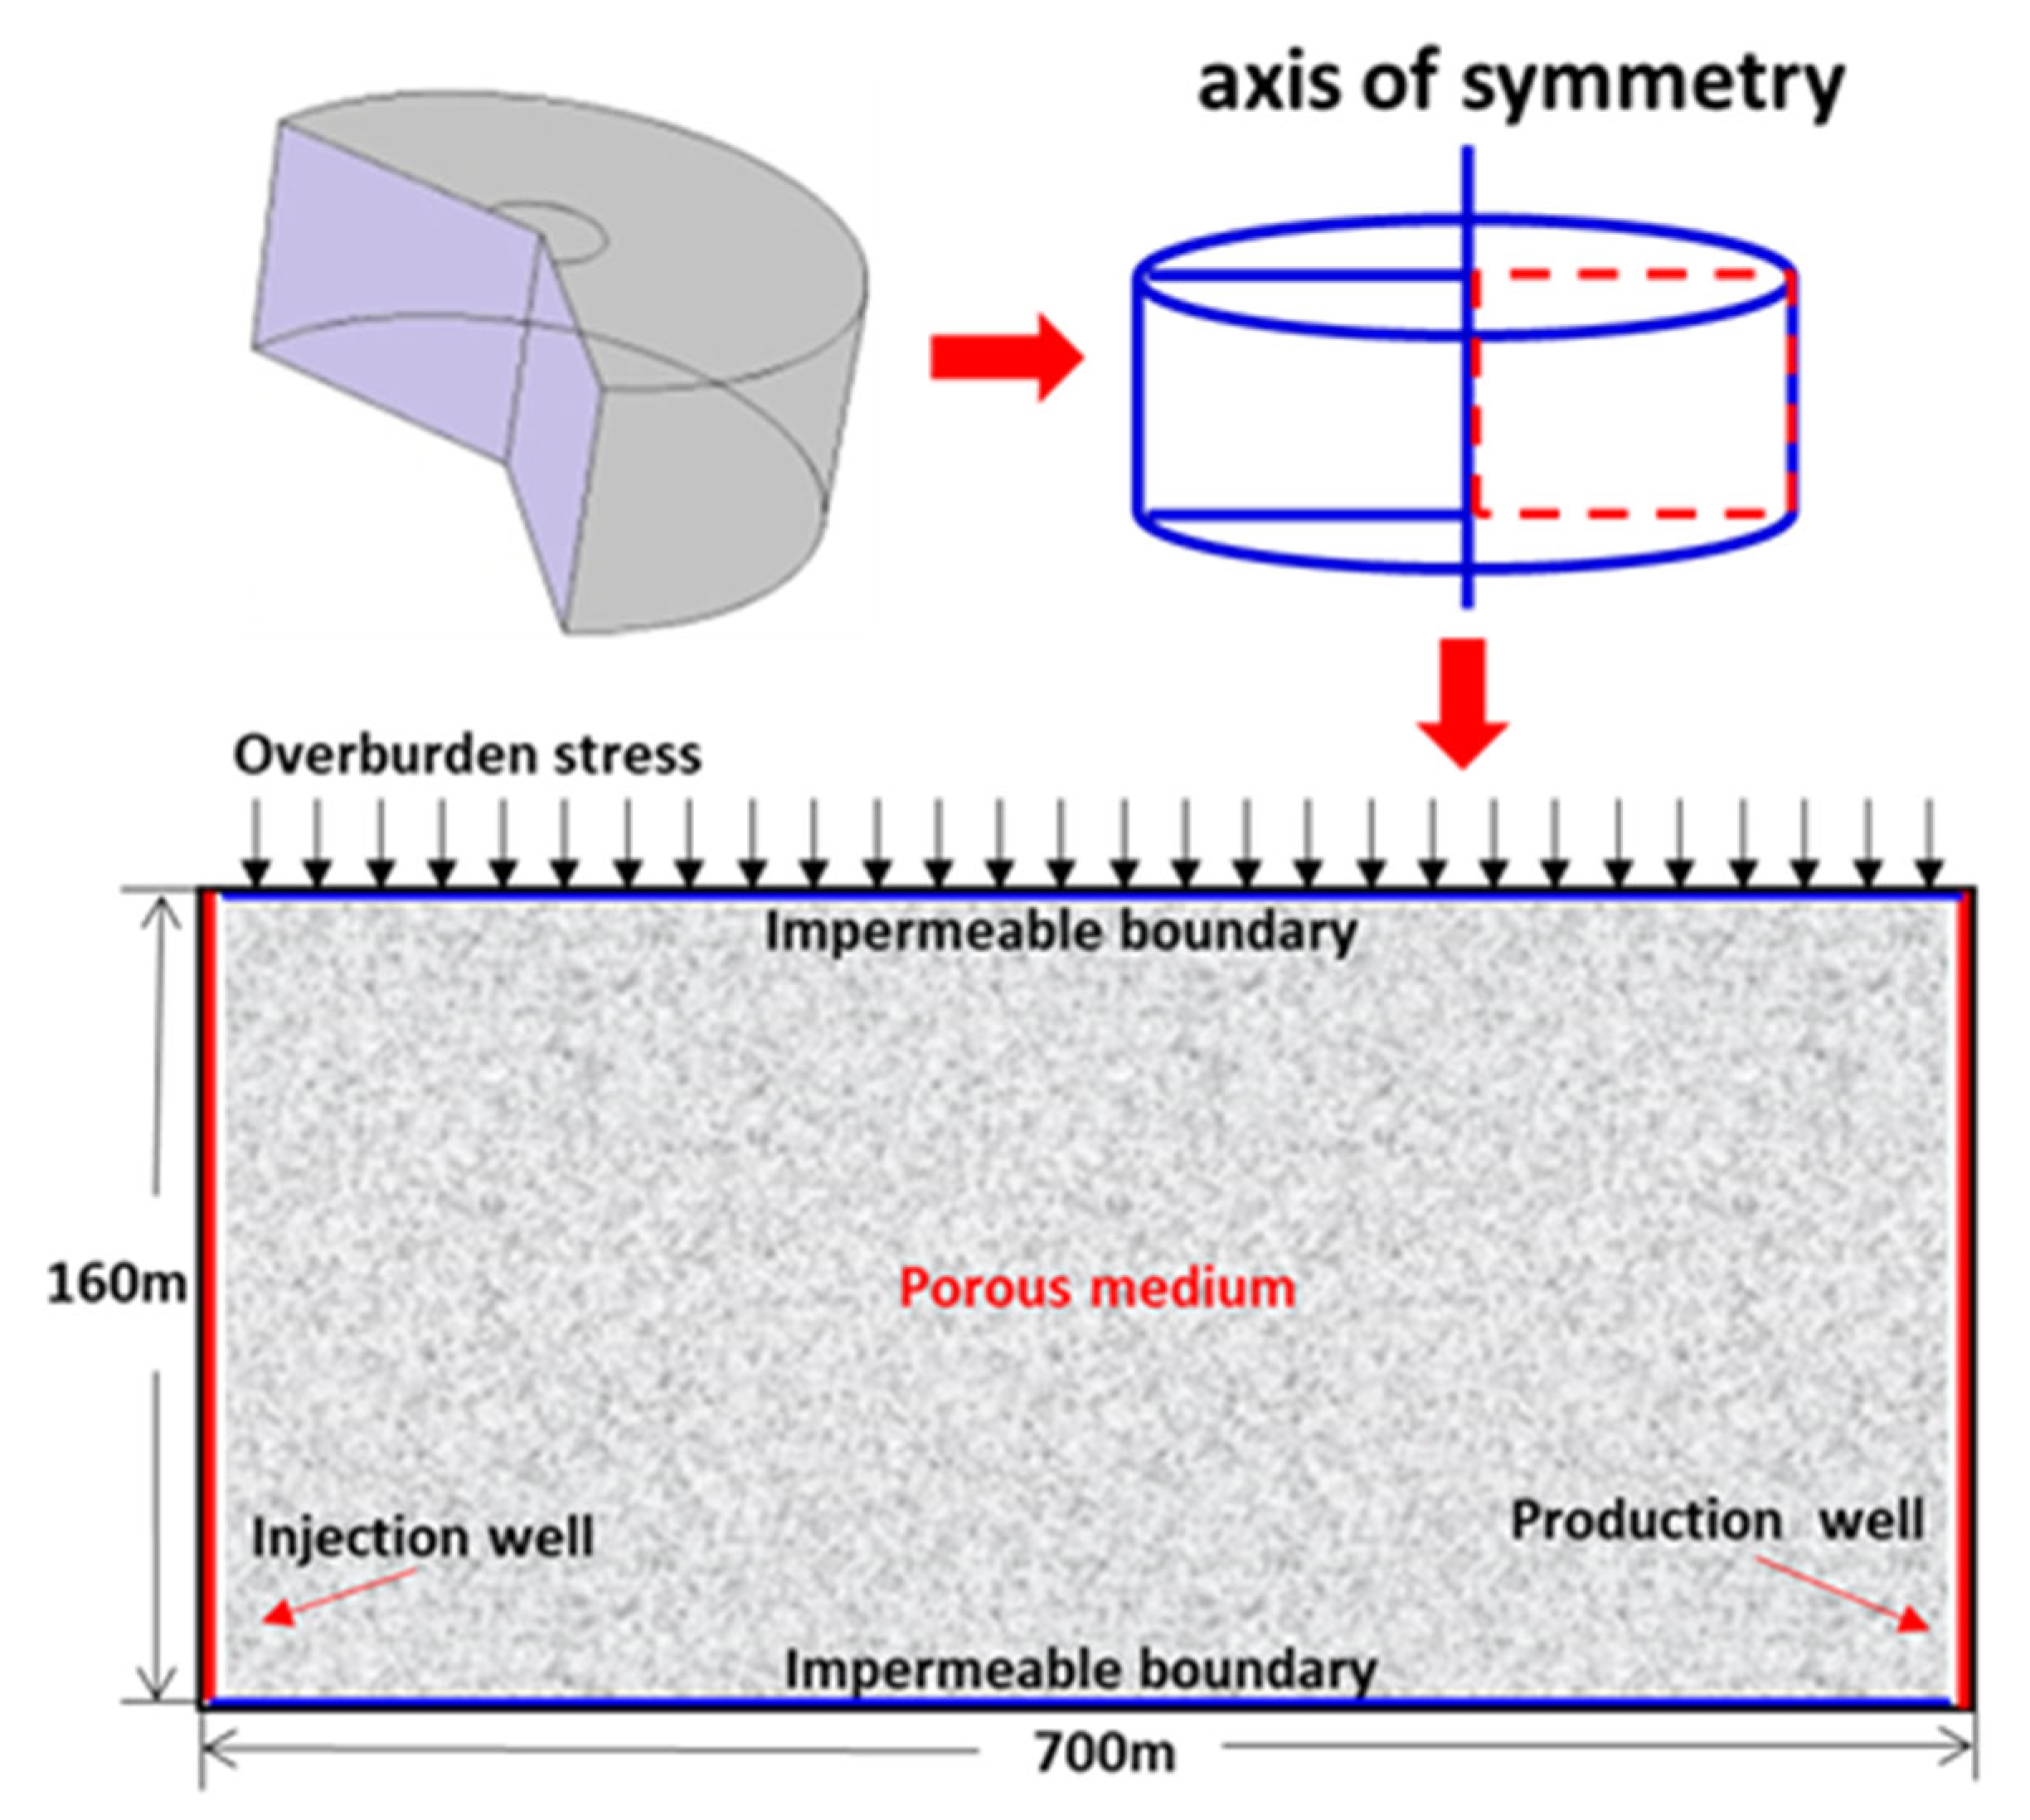
2.2. Initial and Boundary Conditions
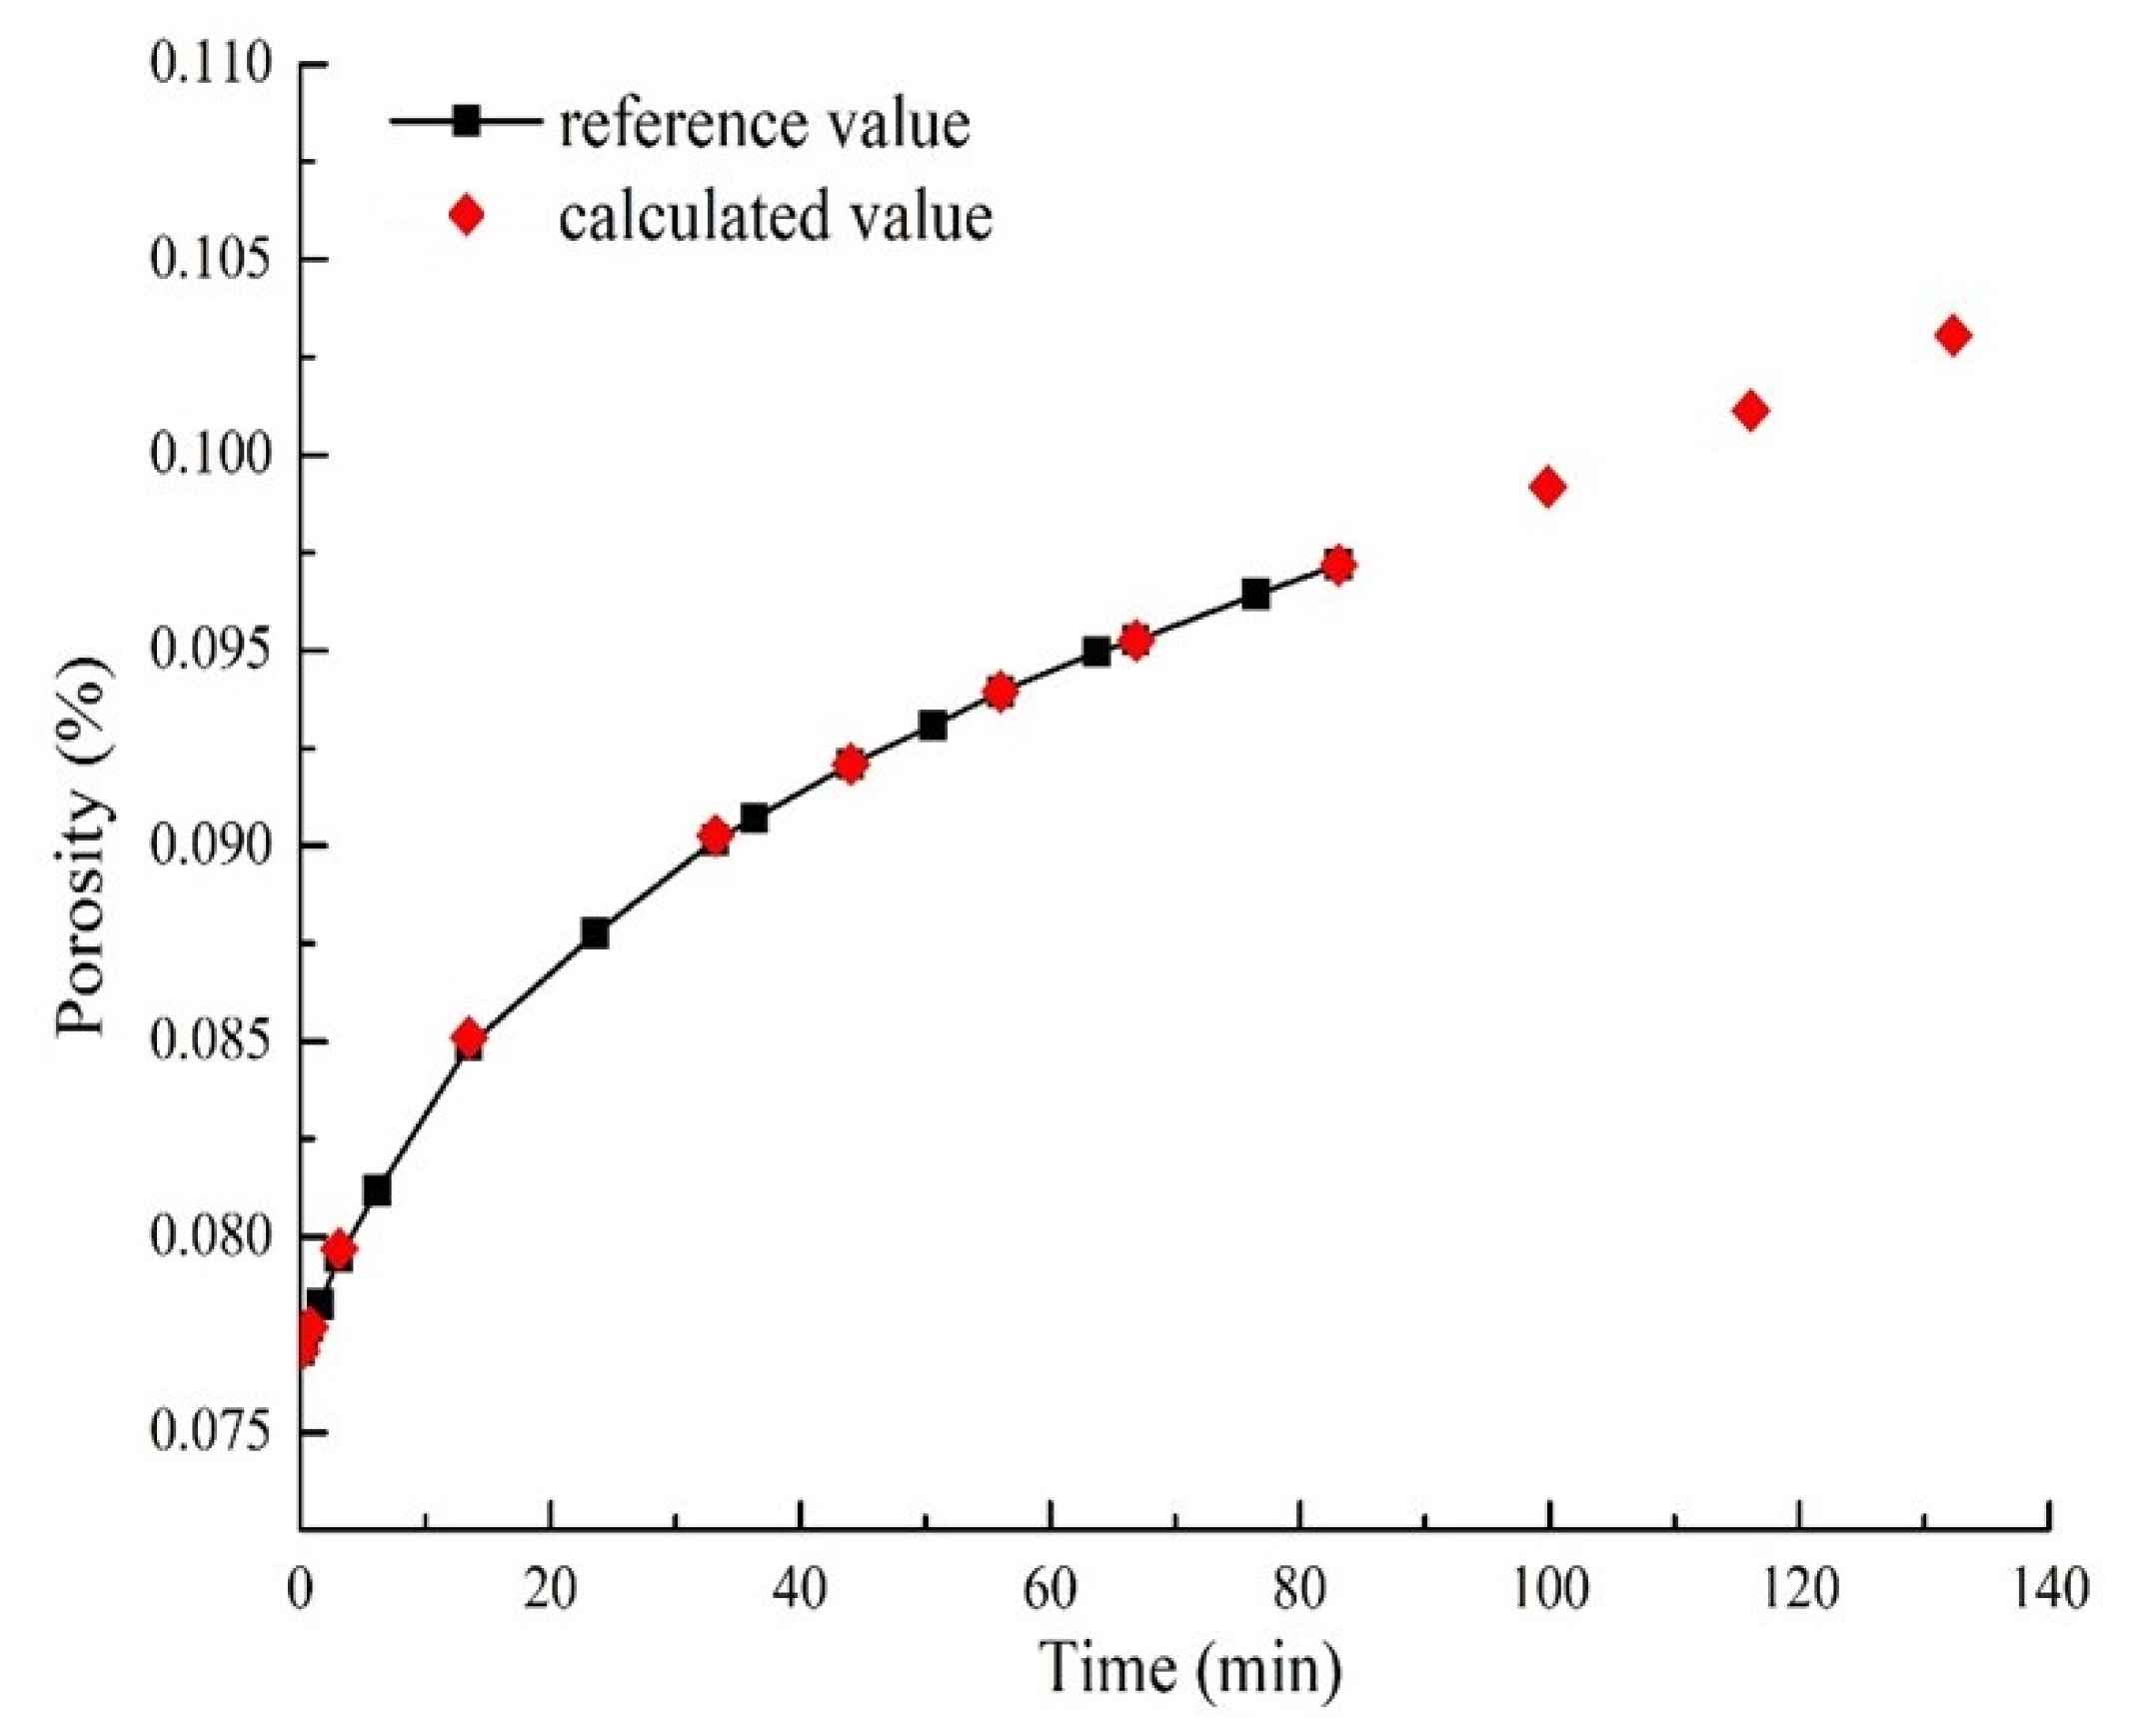
When establishing the model, it is assumed that the reservoir has good physical properties and is an isotropic body composed of uniform capillary bundles. A two-dimensional radial model is used to model the formation. The wellbore is the axis of symmetry. In order to better analyze the coupling process of chemical dissolution, fluid pressure, and formation deformation, this model mainly refers to the actual situation of on-site injection wells and production wells. The left end of the model is the injection well, and the right end is the production well. The alternating injection method of water and gas with a gas-water ratio of 1:1 is adopted, with an injection rate of 50 t/day at the injection end and a production rate of 10 t/day at the production end. The injection and production ends are divided into 100 m × 10 m grids, respectively. Under the action of temperature and pore pressure, the stratum mechanical model under the action of CO2 geochemical reaction is obtained, as shown in Figure 1.

3. Model Validation

To verify that the mass transfer model of CO2-water-rock in the geochemical reaction process conforms to the influence law of CO2 on rock dissolution, the parameters selected by Luquot and Gouze [39] in the limestone reservoir sample experiment are used to verify the model established in this paper. The experimental samples come from the Middle Jurassic Mondaville Formation oolitic limestone in the Paris Basin, France. The experiment assumes that the formation is a homogeneous model, and initial porosity and permeability are used to fit the pore throat ratio and other parameters of the formation rock before the chemical reaction occurs. Valid data are treated with an error range of 2% and the average value as the initial parameter of the model. See Table 1 for specific parameter settings.
The model established in the second section of the article is used to simulate the chemical reaction of rocks and the migration process of formation fluids. The Ca2+ concentration values in the formation fluid, the rock porosity values, and the rock permeability values are obtained by numerical simulation. By comparing the calculated values of the model with the actual reference values, the variation curves of the Ca2+ concentration in formation fluid (Figure 2), the rock porosity (Figure 3), and the rock permeability (Figure 4) at different times are obtained.
According to Luquot’s experimental method, the ordinate is set as the change of Ca2+ concentration in formation fluid, and t = 0 is defined as the time when CO2-saturated brine begins to permeate the sample [39].
By comparing the experimental results in Figure 2, Figure 3 and Figure 4, it can be seen that the Ca2+ concentration in formation fluid, the rock porosity, and the rock permeability calculated by the model established in this paper are in good agreement with the actual reference values, which verifies that the model can accurately simulate the dissolution of CO2 on rocks and the migration process of formation fluid. As shown in Figure 2, the concentration of Ca2+ suddenly increased at the initial stage of the reaction, gradually decreased with the progress of the reaction, and finally stabilized. This phenomenon occurs because magnesium calcite is dissolved by saturated carbonic acid solution at the initial stage of the reaction, which leads to a rapid increase in Ca2+ concentration in the formation fluid. Because the concentration of Ca2+ in formation fluid is much higher than that of Mg2+, the minimum complex in formation fluid is continuously dissolved, which makes the concentration of Mg2+ gradually increase, calcite precipitate, and the concentration of Ca2+ decrease. With the chemical reaction approaching equilibrium, the concentration of Ca2+ also tends to be stable. By analyzing the experimental results in Figure 3 and Figure 4, it can be seen that the porosity and permeability of rocks are increased to different degrees with the progress of the reaction due to CO2 dissolution. Compared with permeability, the calculated value of rock porosity is more consistent with the actual reference value. The calculation error is because the model only considers the macrostructural changes in rock caused by the mineral reaction. In contrast, the complex microstructural parameters in rock are fitted by the model and ignore the special situation that mineral particles will block the small pore throat during pore throat migration.

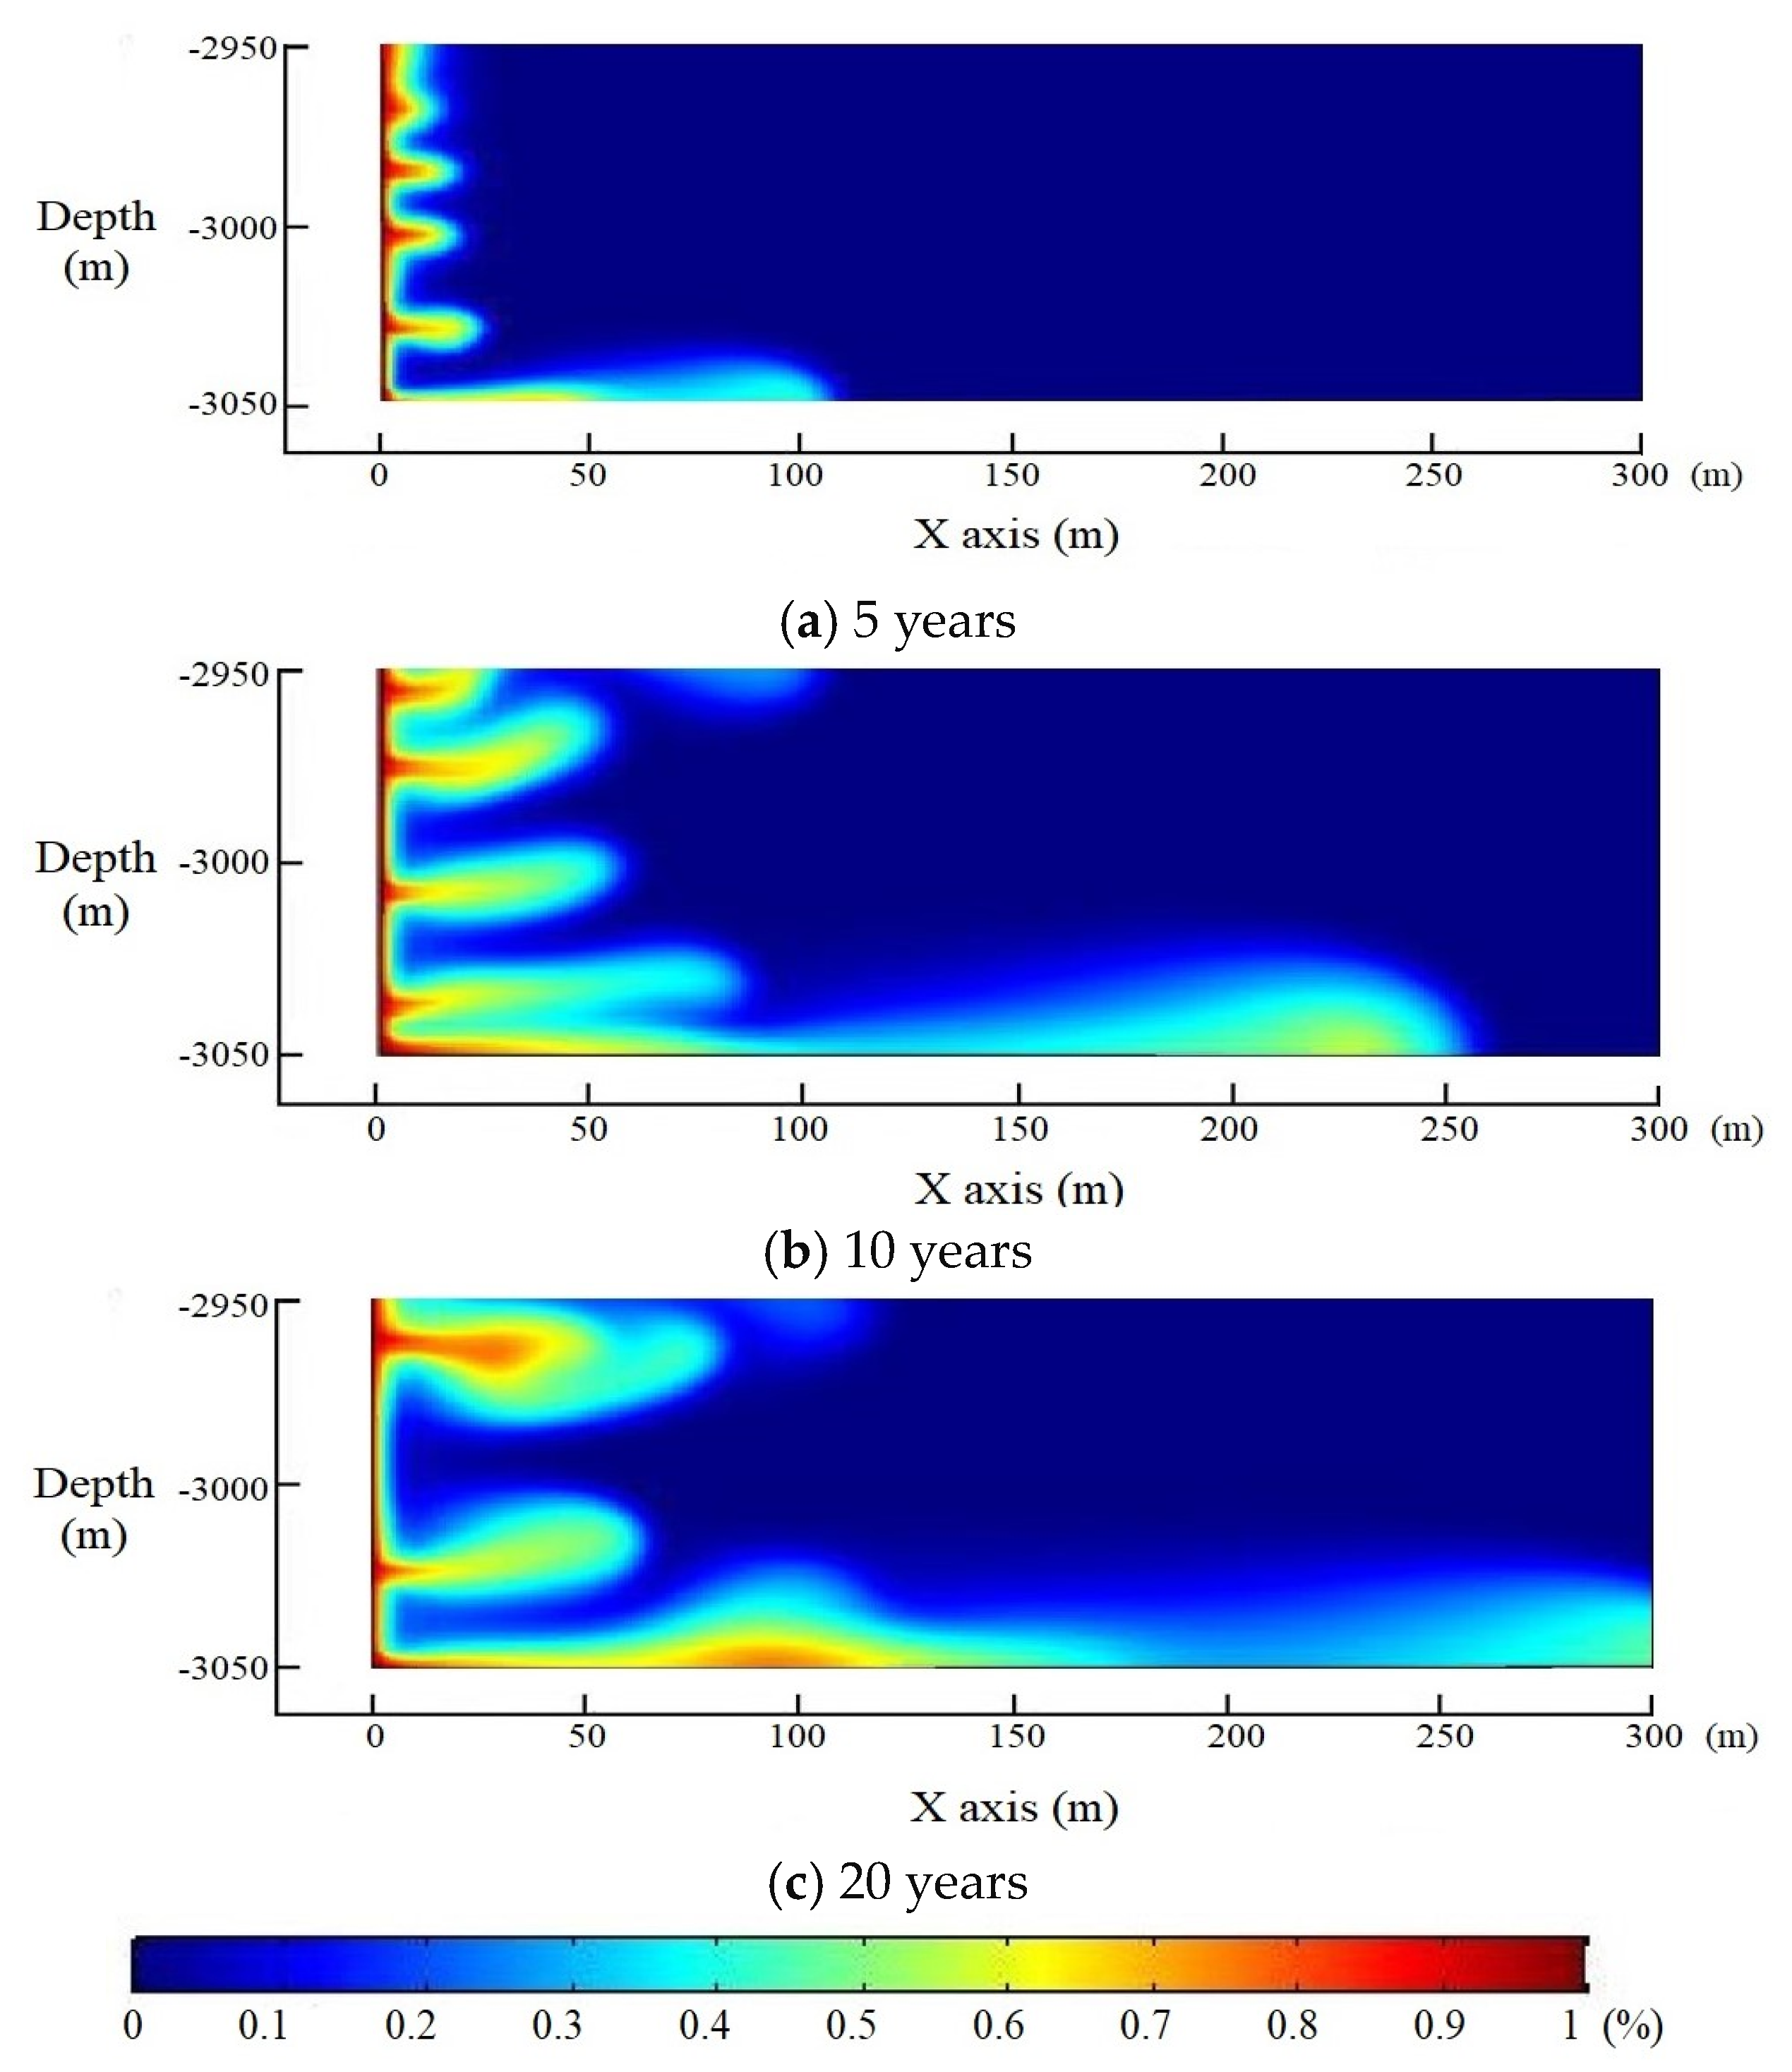
4. Model Application

Apply the CO2-water-rock mass transfer model established in this article to analyze the changes in the physical properties of sandstone reservoirs after CO2 injection and the migration law of solutes in reservoir rocks during CO2 flooding. The experimental data comes from the Rotliegend sandstone formation at a depth of approximately 3000 m underground in the Netherlands [40]. The Rotliegend sandstone formation mainly comprises quartz and other minerals such as dolomite, K-Feldspar, kaolinite, and illite in small amounts. The average porosity and permeability of the formation are 0.18 and 200 mD, respectively. In the experiment, it is assumed that the formation is a homogeneous model. The injection well is located in the center of the model. In the simulation, during the first 20 years, CO2 was injected into the oil well at a constant rate of 1 million tons/year. The simulation time is 500 years. The specific parameter settings of the model are shown in Table 2.
During the reaction of CO2 aqueous solution with minerals, the change of ion concentration in the solution is mainly controlled by the reaction rate of dissolution or precipitation on the mineral surface. In the simulation, the geochemical reactions and the reaction kinetic parameters of each mineral are shown in Table 3, and the reaction rate equations of each mineral are shown in Table 4.
The geochemical reaction rate equation of the main minerals in the Rotliegend sandstone reservoir is combined with the CO2-water-rock mass transfer model established in the second section of this paper, and the physical properties change the model of rock minerals under the action of CO2 aqueous solution. The model involves the solution of several nonlinear equations, which involve the geochemical reactions of the main minerals and the complex multi-component equilibrium of solutions. The author uses TOUGHREACT V4.13 software to simulate the geochemical reaction process of the reservoir after CO2 injection and uses PHREEQC 2.11 software to calculate the chemical reaction kinetic parameters such as mineral composition, mineral saturation, mineral dissolution and precipitation rate, and the change of solution ion concentration, and then brings them into the porosity and permeability calculation equations established by the ODS and PDE interfaces in COMSOL 6.0 software, and uses incomplete LU decomposition to solve the nonlinear equations in the model. By numerical simulation, the changes in porosity and permeability of Rotliegend sandstone reservoirs under the action of CO2 aqueous solution were obtained for a simulation time of 500 years. The results of porosity changes are shown in Figure 5. The results of permeability changes are shown in Figure 6.
According to the results of the change in reservoir porosity in Figure 5, the reservoir porosity shows an increasing trend after CO2 gas injection. The porosity of the reservoir near the injection end changes most significantly, and the porosity increases from 0.18 to 0.38 in 500 years, which is about 1.1 times the initial porosity of the reservoir. The porosity at the top of the reservoir increases more significantly than that at the bottom of the reservoir. This phenomenon occurs because CO2 injected into the reservoir will migrate to the top under the action of gas buoyancy. However, the vertical migration distance is limited due to the obstruction of the caprock. Part of the CO2 gas is dissolved in formation water and reacts with reservoir rocks, resulting in the density difference of the formation fluid. Depending on the fluid density difference, CO2 aqueous solution migrates in the horizontal direction, so the reservoir porosity gradually increases in a pinnate shape along the deep direction of the reservoir. The horizontal increase range of reservoir porosity is approximately 225.0 m. After 500 years, the average porosity of reservoirs within this range has increased to about 0.30. Comparing the results of reservoir porosity changes under different simulation times, it can be seen that over time, the vertical reservoir porosity is gradually affected by gas buoyancy, while the horizontal reservoir porosity shows a deceleration in growth. When the simulation time is 100 years, the change in porosity is not significantly affected by gas buoyancy. The horizontal porosity growth range is 119.3 m, and the average growth rate is 1.19 m/year. When the simulation time is 200 years, the porosity increase at the top of the reservoir is significantly higher than that at the bottom of the reservoir, and the horizontal porosity growth range spreads to 150.0 m, with an average growth rate of 0.75 m/year. When the simulation time is 500 years, the porosity at the top of the reservoir is much higher than that at the bottom of the reservoir, and the horizontal porosity growth range spreads to 225.0 m, with an average growth rate of 0.45 m/year.
Comparing the results of porosity change in Figure 5 with those of permeability change in Figure 6, it can be seen that the variation law of reservoir permeability is consistent with that of reservoir porosity. After CO2 gas injection, the reservoir permeability also shows an upward trend. Affected by gas buoyancy and fluid density differences, the rock permeability near the injection end and the reservoir’s top increases significantly. The reservoir permeability increases from 20 mD to 70 mD, about 2.5 times the initial permeability. Comparing the changes in reservoir permeability under different simulation times, it can be seen that the reservoir permeability in the horizontal direction shows a deceleration in growth over time. When the simulation time is 100 years, the horizontal reservoir permeability change range is 126.7 m, and the average growth rate is 1.27 m/year. When the simulation time is 200 years, the range of horizontal reservoir permeability changes has extended by 46.6 m, with an average growth rate of 0.87 m/year. When the simulation time is 500 years, the variation range of reservoir permeability in the horizontal direction extends by 53.4 m, with an average growth rate of 0.45 m/year.
The above analysis found that the reservoir’s porosity and permeability near the injection end changed most significantly after injecting CO2 gas. In order to conduct a more detailed analysis of the changes in porosity and permeability at different reservoir locations, the author simulated the changes in reservoir porosity and permeability within a range of 24 m around the injection well at 5, 20, 50, and 100 years. The results of porosity changes are shown in Figure 7, and the results of permeability changes are shown in Figure 8.
According to Figure 7, after injecting CO2 gas, the overall porosity of the reservoir shows an upward trend. With the passage of gas injection time, the growth rate of porosity gradually decreases. During the initial five years of gas injection, the porosity of the reservoir within a 3 m range centered around the injection well significantly increased, while the porosity of the far wellbore beyond this range was not significantly affected. After 20 years of CO2 injection, the porosity in different reservoir locations shows a rapid growth trend. The average porosity of the reservoir increased from 0.18 to 0.28, with an average growth rate of 0.005/year. However, the reservoir porosity in the range of 4 m at the injection end decreased locally. It is found that the reason for this phenomenon is that the formation rocks in this range are transformed from the initial dissolution reaction to the precipitation reaction of calcite, magnesite, and clay minerals. The precipitation of calcite and clay minerals easily blocks pores and throats, leading to decreased porosity near the injection end. After 50 years of CO2 injection, the far end of the well is still dominated by dissolution reactions, but the growth rate of porosity gradually slows down. The average porosity of the reservoir at the far end of the well increased from 0.28 to 0.30, with an average growth rate of 0.0007/year. The area dominated by precipitation reactions near the injection end is expanded to 14 m. After 100 years of gas injection, the rock porosity within 24 m near the injection end does not change, and the porosity remains at about 0.28. The porosity at the far end of the well is still increasing slowly, from 0.30 to 0.32, with an average growth rate of 0.0004/year.
Comparing Figure 7 and Figure 8, it can be seen that after CO2 gas is injected, the change law of reservoir permeability is consistent with that of porosity, and the overall trend is upward. However, the variation in permeability at different reservoir locations is quite different. After five years of gas injection, the permeability of different reservoir locations increased significantly, and the average permeability of the reservoir increased rapidly from 20 mD to 48 mD, with an average growth rate of 5.6 mD/year. The permeability near the injection end increased the most, reaching 50.5 mD. With the increase in reaction time, the average permeability of the reservoir increased from 48 mD to 52 mD after 20 years of gas injection, with an average growth rate of 0.25 mD/year. However, the formation within 10.5 m from the injection point began to undergo a precipitation reaction, and the reservoir permeability in this range decreased again. After 50 years of gas injection, the permeability of the reservoir at the far end continued to increase, from 52 mD to 56 mD, with an average growth rate of 0.13 mD/year. The permeability of the reservoir near the injection end continued to decrease due to the precipitation reaction. After 100 years of gas injection, the far end of the well is still dominated by the dissolution reaction, and the precipitation amount is always less than the dissolution amount. The permeability continues to increase from 56 mD to 62 mD, with an average growth rate of 0.12 mD/year. The reservoir permeability near the injection end is further reduced to 45 mD. From the simulation results of porosity and permeability, it can be seen that from the macroscopic physical properties, the geochemical reaction between CO2-water-rock can improve the porosity and permeability characteristics of the reservoir to some extent after CO2 gas is injected into the formation, which is helpful to improve the oil displacement efficiency.
Based on understanding the variation law of reservoir porosity and permeability, the authors further studied the migration law of CO2 in the reservoir by calculating CO2 saturation in reservoir fluid by numerical simulation. The experimental results are shown in Figure 9.
Analysis of Figure 9 shows that after CO2 gas is injected into the reservoir, part of the gas will be dissolved in formation water, and there is a density difference between the formed miscible fluid and formation water. This density difference causes the miscible interface to move forward in a finger shape in the horizontal direction. With the increasing mixing of CO2 gas and formation water, the density difference at the leading edge of CO2 gas and formation water decreases, gradually weakening the interface’s forward movement behavior at the leading edge of miscible fluid. In the vertical direction, due to gravity, the CO2 displacement solution will gradually displace laterally along the bottom of the reservoir, and the displacement efficiency will increase with the increase in reservoir depth. Comparing the CO2 saturation of reservoirs at different times in Figure 9, it can be found that in the early stage of injection, CO2 migration is relatively stable, the miscible migration front is regular, and CO2 saturation decreases uniformly from the near well end to the far well end. In the horizontal direction, the average migration velocity of CO2 in the middle and upper parts of the reservoir is about 4.6 m/year. Influenced by gravity, the forward migration distance of CO2 at the bottom of the reservoir is about 100 m, and the average migration speed is about 20.0 m/year. In the middle stage of injection, the migration of CO2 fluctuated, the shape of the miscible front was irregular, and the vertical CO2 saturation of the reservoir was significantly different. The average horizontal migration velocity of CO2 in the middle and upper parts of the reservoir is about 8.5 m/year. The CO2 at the bottom of the reservoir moves forward by 250 m, and the average migration speed is about 30.0 m/year. It is found that the migration speed of CO2 in the middle stage of injection is faster than that in the early stage of injection, mainly because the CO2-water-rock reaction in the reservoir changes the pore structure of reservoir rocks, forms a channel that is easier for fluid to flow, and accelerates the migration speed of CO2. At the later injection stage, the fingering migration characteristics of CO2 were significantly weakened, and the vertical CO2 saturation difference between reservoirs further increased. In the horizontal direction, the average migration velocity of CO2 in the middle and upper parts of the reservoir is about 1.5 m/year. The CO2 at the bottom of the reservoir moves forward by 300 m, and the average migration speed is about 5.0 m/year. The main reason for the slowdown of the CO2 migration rate in the later injection stage is the formation rocks’ transformation from the initial dissolution reaction to the precipitation reaction. Sediment blocks pores and throats, reduces formation porosity and permeability, slows CO2 migration, leads to increased formation of microstructure heterogeneity, aggravates the instability of the CO2 migration front, and affects CO2 oil displacement efficiency.

5. Conclusions

Based on the coupling effect of seepage, mechanics, and chemistry after CO2 gas is injected into the formation, this paper establishes the geochemical reaction and solute transport model. The TOUGHREACT software is used to simulate the geochemical reaction process of the reservoir after CO2 injection, and the changing rules of the macroscopic physical properties and microstructure of the reservoir under the geochemical reaction conditions are obtained. The quantitative changes in reservoir physical properties after CO2 injection under the coupling of multiple fields are clarified, and the migration law of solute in reservoir rocks during CO2 flooding under the action of geochemical reactions is revealed.
At the initial stage of CO2 gas injection, the porosity and permeability of the reservoir increased due to the dissolution reaction of rocks near the injection end. With the diffusion and migration of CO2 and the progress of the chemical reaction, formation rocks are transformed from the initial dissolution reaction to the precipitation reaction of calcite, magnesite, and montmorillonite. The porosity and permeability of rocks near the well end decreased. At the same time, the dissolution reaction was still dominant at the far well end, and the porosity and permeability of rocks at the far well end continued to increase. The geochemical reaction between CO2-water-rock changes the pore structure of reservoir rocks. The dissolution reaction forms a channel that is easy for fluid to flow through, while the precipitation reaction blocks some pores and throats. The coexistence of the two reactions increases the heterogeneity of the formation microstructure, exacerbates the instability of the CO2 migration front, destroys formation stability, and affects the CO2 flooding effect. This research conclusion helps predict the changes in reservoir physical properties after CO2 gas injection and is of great significance for evaluating formation integrity and guiding CO2 injection.

Author Contributions

Conceptualization, R.X. and T.Y.; validation, R.X.; resources, X.H.; writing—original draft preparation, R.X.; writing—review and editing, J.Q. and J.F. All authors have read and agreed to the published version of the manuscript.

Funding

This work is financially supported by the National Natural Science Foundation of China (No. 52174001); the National Natural Science Foundation of China (No. 52004064); the key Research and Development project of Hainan Province, “Research on Real-time Intelligent Sensing Technology for Closed-loop Drilling of Oil and Gas Reservoirs in Deepwater Drilling” (ZDYF2023GXJS012); and Heilongjiang Provincial Government and Daqing Oilfield’s first batch of the scientific and technological key project, “Research on the Construction Technology of Gulong Shale Oil Big Data Analysis System” (DQYT-2022-JS-750).

Data Availability Statement

Data are available on request from the authors.

Conflicts of Interest

The authors declare no conflict of interest.

References

  1. Han, X.; Feng, F.P.; Yan, M.S.; Cong, Z.Y.; Liu, S.Y.; Zhang, Y.H. CO2–Water–Rock Reaction Transport Via Simulation Study of Nanoparticles-CO2 Flooding and Storage. Sustain. Energy Technol. Assess. 2022, 50, 101736. [Google Scholar] [CrossRef]
  2. Emad, A.; Doaa, S.M.; Yujie, Y.; Stefan, I. Influence of Clay Content on CO2-Rock Interaction and Mineral-Trapping Capacity of Sandstone Reservoirs. Energies 2023, 16, 3489. [Google Scholar]
  3. Khetib, Y.; Zunez, S. Integrated Pipeline and Wells Transient Behavior of CO2 Injection Operations: Flow Assurance Best Practices. In Proceedings of the PSIG Annual Meeting, San Antonio, TX, USA, 16–19 May 2023; p. PSIG-2325. [Google Scholar]
  4. Wang, C.; Cui, M.L.; Wang, K.; Wei, Y.; Wang, K.Y.; Gao, H. Full-Scale Experimental Study on the Effect of CO2 Flooding on Storage-Seepage Capacity of Tight Sandstone Reservoirs. ACS Omega 2023, 8, 11897–11907. [Google Scholar] [CrossRef]
  5. Li, S.Q.; Chen, Z.; Li, W.; Yan, T.; Bi, F.Q.; Tong, Y.S. An FE Simulation of the Fracture Characteristics of Blunt Rock Indenter under Static and Harmonic Dynamic Loadings Using Cohesive Elements. Rock Mech. Rock Eng. 2023, 56, 2935–2947. [Google Scholar] [CrossRef]
  6. Ao, X.; Wang, B.B.; Rao, Y.X.; Zhang, L.; Wang, Y.; Tang, H.K. Effect of CO2 Corrosion and Adsorption-Induced Strain on Permeability of Oil Shale: Numerical Simulation. Energies 2023, 16, 780. [Google Scholar] [CrossRef]
  7. Song, R.; Tang, Y.; Wang, Y.; Xie, R.Y.; Liu, J.J. Pore-Scale Numerical Simulation of CO2–Oil Two-Phase Flow: A Multiple-Parameter Analysis Based on Phase-Field Method. Energies 2023, 16, 82. [Google Scholar] [CrossRef]
  8. Lin, R.; Yu, Z.H.; Zhao, J.Z.; Dai, C.L.; Sun, Y.P.; Ren, L.; Xie, M.K. Experimental Evaluation of Tight Sandstones Reservoir Flow Characteristics under CO2–Brine–Rock Multiphase Interactions: A Case Study in the Chang 6 Layer, Ordos Basin, China. Fuel 2022, 309, 122167. [Google Scholar] [CrossRef]
  9. Han, X.; Feng, F.P.; Cong, Z.Y. Dynamic Evaluation Method of Caprock Microscopic Sealing in CO2 Sequestration Project. Geofluids 2020, 2020, 2648692. [Google Scholar] [CrossRef] [Green Version]
  10. Cui, G.D.; Zhu, L.H.; Zhou, Q.C.; Ren, S.R.; Wang, J.Y. Geochemical reactions and their effect on CO2 storage efficiency during the whole process of CO2 EOR and subsequent storage. Int. J. Greenh. Gas Control 2021, 108, 103335. [Google Scholar] [CrossRef]
  11. Law, D.; Meer, L.; Gunter, W.D. Modeling of Carbon Dioxide Sequestration in Coalbeds: A Numerical Challenge. In Proceedings of the 6th International Conference on Greenhouse Gas Control Technologies, Cairns, Australia, 1 July 2001. [Google Scholar]
  12. Ketzer, J.M.; Iglesias, R.; Einloft, S.; Dullius, J.; Ligabue, R.; De, L.V. Water–Rock–CO2 Interactions in Saline Aquifers Aimed for Carbon Dioxide Storage: Experimental and Numerical Modeling Studies of the Rio Bonito Formation (Permian), Southern Brazil. Appl. Geochem. 2009, 24, 760–767. [Google Scholar] [CrossRef]
  13. Andre, L.; Audigane, P.; Azaroual, M.; Menjoz, A. Numerical Modeling of Fluid-Rock Chemical Interactions at the Supercritical CO2-Liquid Interface During CO2 Injection into a Carbonate Reservoir, the Dogger Aquifer (Paris Basin, France). Energy Convers. Manag. 2007, 48, 1782–1797. [Google Scholar] [CrossRef]
  14. Wandrey, M.; Pellizari, L.; Zettlitzer, M.; Würdemann, H. Microbial Community and Inorganic Fluid Analysis during CO2 Storage within the Frame of CO2SINK–Long-Term Experiments under in Situ Conditions. Energy Procedia 2011, 4, 3651–3657. [Google Scholar] [CrossRef] [Green Version]
  15. Xu, T.; Zheng, L.; Tian, H. Reactive Transport Modeling for CO2 Geological Sequestration. J. Pet. Sci. Eng. 2011, 78, 765–777. [Google Scholar] [CrossRef] [Green Version]
  16. Credoz, A.; Bildstein, O.; Jullien, M.; Raynal, J.; Pétronin, J.C.; Lillo, M.; Geniaut, G. Experimental and Modeling Study of Geochemical Reactivity between Clayey Caprocks and CO2 in Geological Storage Conditions. Energy Procedia 2009, 1, 3445–3452. [Google Scholar] [CrossRef] [Green Version]
  17. Gaus, I.; Azaroual, M.; Czernichowski, L.I. Reactive Transport Modelling of the Impact of CO2 Injection on the Clayey Cap Rock at Sleipner (North Sea). Chem. Geol. 2005, 217, 319–337. [Google Scholar] [CrossRef]
  18. Gherardi, F.; Xu, T.; Pruess, K. Numerical Modeling of Self-limiting and Self-Enhancing Caprock Alteration Induced by CO2 Storage in A Depleted Gas Reservoir. Chem. Geol. 2007, 244, 103–129. [Google Scholar] [CrossRef] [Green Version]
  19. Angeli, M.; Soldal, M.; Skurtveit, E.; Aker, E. Experimental Percolation of Supercritical CO2 through A Caprock. Energy Procedia 2009, 1, 3351–3358. [Google Scholar] [CrossRef]
  20. Erickson, K.P.; Lempp, C.; PuLlmann, H. Geochemical and Geo-Mechanical Effects of scCO2 and Associated Impurities on Physical and Petrophysical Properties of Permotriassic Sandstones (Germany): An Experimental Approach. Environ. Earth Sci. 2015, 74, 4719–4743. [Google Scholar] [CrossRef]
  21. Shiraki, R.; Dunn, T.L. Experimental Study on Water–Rock Interactions during CO2 Flooding in the Tensleep Formation, Wyoming, USA. Appl. Geochem. 2000, 15, 270–279. [Google Scholar] [CrossRef]
  22. Wigand, M.; Carey, J.W.; Schütt, H.; Spangenberg, E.; Erzinger, J. Geochemical Effects of CO2 Sequestration in Sandstones under Simulated in Situ Conditions of Deep Saline Aquifers. Appl. Geochem. 2008, 23, 2735–2745. [Google Scholar] [CrossRef]
  23. Bildstein, O.; Kervevan, C.; Lagneau, V.; Delaplace, P.; Credoz, A.; Audigane, P.; Jullien, M. Integrative Modeling of Caprock Integrity in the Context of CO2 Storage: Evolution of Transport and Geochemical Properties and Impact on Performance and Safety Assessment. Oil Gas Sci. Technol. Rev. IFP 2010, 65, 485–502. [Google Scholar] [CrossRef] [Green Version]
  24. Kang, X.; Hu, W.; Cao, J.; Jin, J.; Wu, H.; Zhao, Y.; Wang, J. Selective Dissolution of Alkali Feldspars and Its Effect on Lower Triassic Sandy Conglomerate Reservoirs in the Junggar Basin, Northwestern China. Geol. J. 2018, 53, 475–499. [Google Scholar] [CrossRef]
  25. Wang, H.; Alvarado, V.; Bagdonas, D.A.; McLaughlin, J.F.; Kaszuba, J.P.; Grana, D.; Campbell, E.; Ng, K. Effect of CO2-Brine-Rock Reactions on Pore Architecture and Permeability in Dolostone: Implications for CO2 Storage and EOR. Int. J. Greenh. Gas Control 2021, 107, 103283. [Google Scholar] [CrossRef]
  26. Tao, J.; Meng, S.; Li, D.; Rui, Z.; Liu, H.; Xu, J. Analysis of CO2 Effects on Porosity and Permeability of Shale Reservoirs under Different Water Content Conditions. Geoenergy Sci. Eng. 2023, 226, 211774. [Google Scholar] [CrossRef]
  27. Lamy-Chappuis, B.; Angus, D.; Fisher, Q.; Grattoni, C.; Yardley, B.W. Rapid Porosity and Permeability Changes of Calcareous Sandstone due to CO2-Enriched Brine Injection. Geophys. Res. Lett. 2014, 41, 399–406. [Google Scholar] [CrossRef] [Green Version]
  28. Matteo, E.N.; Scherer, G.W. Experimental Study of the Diffusion-Controlled Acid Degradation of Class H Portland Cement. Int. J. Greenh. Gas Control 2012, 7, 181–191. [Google Scholar] [CrossRef]
  29. Yeh, G.T.; Tripathi, V.S. A Model for Simulating Transport of Reactive Multispecies Components: Model Development and Demonstration. Water Resour. Res. 1991, 27, 3075–3094. [Google Scholar] [CrossRef]
  30. Koichi, A. Simulation for Memory Effect of Fick’s First Law. Proc. Indian Acad. Sci. Chem. Sci. 2009, 121, 5601–5605. [Google Scholar]
  31. Li, T.; Gao, H.; Ni, J.; Wang, C.; Cheng, Z.; Xue, J.; Luo, K. Research on the Differential Oil Producing in the Various Scale Pores under Different CO2 Flooding Modes with A Fluid Distribution Pore Classification Method. Energy Fuels 2023, 37, 3775–3784. [Google Scholar] [CrossRef]
  32. Adebayo, A.R.; Isah, A.; Mahmoud, M.; Al-Shehri, D. Effects of Foam Microbubbles on Electrical Resistivity and Capillary Pressure of Partially Saturated Porous Media. Molecules 2020, 25, 3385. [Google Scholar] [CrossRef]
  33. Steefel, C.I.; Lasaga, A.C. A Coupled Model for Transport of Multiple Chemical Species and Kinetic Precipitation/Dissolution Reactions with Application to Reactive Flow in Single Phase Hydrothermal Systems. Am. J. Sci. 1994, 294, 529–592. [Google Scholar] [CrossRef]
  34. Benson, S.M.; Perrin, J.C.; Krause, M.; Kuo, C.W.; Miljkovic, L. Experimental Investigations of Multiphase Flow and Trapping in Saline Aquifers—Annual Report 2007; Stanford University: Stanford, CA, USA, 2008. [Google Scholar]
  35. Lasaga, A.C.; Soler, J.M.; Ganor, J.; Burch, T.E.; Nagy, K.L. Chemical Weathering Rate Laws and Global Geochemical Cycles. Geochim. Cosmochim. Acta 1994, 58, 2361–2386. [Google Scholar] [CrossRef]
  36. Genuchten, V. A Close-Form Equation for Predicting the Hydraulic Conductivity of Saturated Soils. Soil Sci. Soc. Am. J. 1980, 44, 892–898. [Google Scholar] [CrossRef] [Green Version]
  37. Kozeny, J. Ueber Kapillare Leitung Des Wassers Im Boden. Sitzungsber Akad. Wiss. Wien 1927, 136, 271–306. [Google Scholar]
  38. Carman, P.C. Permeability of Saturated Sands, Soils and Clays. J. Agric. Sci. 1939, 29, 263–273. [Google Scholar] [CrossRef]
  39. Luquot, L.; Gouze, P. Experimental Determination of Porosity and Permeability Changes Induced by Injection of CO2, into Carbonate Rocks. Chem. Geol. 2009, 265, 148–159. [Google Scholar] [CrossRef]
  40. Ranganathan, P.; Van-Hemert, P.; Rudolph, E.S.J.; Zitha, P.Z. Numerical Modeling of CO2 Mineralisation during Storage in Deep Saline Aquifers. Energy Procedia 2011, 4, 4538–4545. [Google Scholar] [CrossRef] [Green Version]
Figure 1. The formation mechanical model under the action of the CO2 geochemical reaction.
Energies 16 05862 g001
Figure 2. The variation curve of the Ca2+ concentration in formation fluid at different times.
Energies 16 05862 g002
Figure 3. The variation curve of the rock porosity at different times.
Energies 16 05862 g003
Figure 4. The variation curve of the rock permeability at different times.
Energies 16 05862 g004
Figure 5. Numerical simulation results of reservoir porosity change over 500 years.
Energies 16 05862 g005aEnergies 16 05862 g005b
Figure 6. Numerical simulation results of reservoir permeability change over 500 years.
Energies 16 05862 g006
Figure 7. Results of porosity changes at different reservoir locations.
Energies 16 05862 g007
Figure 8. Results of permeability changes at different reservoir locations.
Energies 16 05862 g008
Figure 9. Numerical simulation of reservoir CO2 saturation.
Energies 16 05862 g009
Table 1. Formation parameter settings of oolitic limestone in the Middle Jurassic Mondaville Formation.
Formation Water Composition (mol/L)
Na+1.0Ca2+8.25 × 10⁻³Mg2+0.16 × 10⁻³Cl1.0CO20.8
Formation water pH 3.21 Mineral composition Ca0.99Mg0.01CO3 Chemical reaction equation CaCO 3   +   H + Ca 2 +   +   HCO 3 -
Initial pore radius
(μm)
Initial pore throat ratio
(%)
Pore throat length ratio
(%)
Single pore surface density
(kg/m2)
Initial formation temperature
(°C)
Initial formation pressure
(MPa)
Initial porosity
(%)
Initial permeability
(m2)
Equilibrium constant K
100 5 13.3 20 100 10 7.5 3.5 × 10⁻¹⁴ 0.168
Table 2. Model parameter settings.
Formation Water Composition (mol/kg H2O)
H+1.64 × 10⁻⁸Al3+5.57 × 10⁻⁷Ca2+0.1610SiO28.64 × 10−4
Fe2+6.12 × 10⁻³K+0.5100Mg2+0.0344OH5.66 × 10−5
Main mineral content (%)
Quartz0.51K-Feldspar0.07Dolomite0.14Kaolinite0.03
Initial pore radius
(μm)
Initial pore throat ratio
(%)
Pore throat length ratio
(%)
Single pore surface density
(kg/m2)
Initial formation temperature
(°C)
Initial formation pressure
(MPa)
Initial porosity
(%)
Initial permeability
(m2)
100515505028182.0 × 10−14
Table 3. Geochemical reaction and reaction kinetic parameters of each mineral.
Chemical Reaction EquationEquilibrium Constant KReaction Rate Constant λ
Quartz SiO 2 aq −3.629−13.90
Kaolinite + 6 H + 5 H 2 O + 2 Al 3 + +   2 SiO 2 aq 5.4706−12.00
Dolomite   +   2 H + Ca 2 + +   Mg 2 + +   2HCO 3 1.6727−9.222
K-Feldspar   +   4 H + 2 H 2 O   +   K + + Al 2 + + 3 SiO 2 −0.344−13.00
Table 4. Reaction rate equation for each mineral.
Quartz v = 11.432 × M 24.89 0.67 276 e 10.84 T 1 I A P K
Dolomite v = 1.26 α H + + 1.74 α H 2 C O 3 + 2.05 α H 2 O 1.25 α H C O 3
K-Feldspar v = 3 . 028 × M 1 . 432 0 . 67 119 . 3 e 7.95 T α H + 0.5 + 0.189 e 7.95 T + 1.32 × 10 9 e 4.54 T α H + 0.3 1 I A P K
Kaolinite v = 0.017 × M 0.009 0.67 3.64 × 10 - 5 e - 3.42 T a H + 0.7 + 5.09 × 10 - 10 e - 2.67 T + 1.21 × 10 - 14 e - 2.15 T a H + - 0.472 1 - I A P K
Notes: v represents the reaction rate of mineral dissolution or precipitation, mol·m−3·s−1, the positive value represents dissolution, and the negative value represents precipitation; M is the molar mass of a mineral, g/mol; T represents the reaction temperature, K; IAP represents the ion activity product, which is the product of the content of anions and cations that make up a certain salt in an aqueous solution; K is the equilibrium constant; α represents the equilibrium conversion rate of reactants, %, α = Initial   concentration   of   reactants     Equilibrium   concentration   of   reactants Initial   concentration   of   reactants × 100 % .
Disclaimer/Publisher’s Note: The statements, opinions and data contained in all publications are solely those of the individual author(s) and contributor(s) and not of MDPI and/or the editor(s). MDPI and/or the editor(s) disclaim responsibility for any injury to people or property resulting from any ideas, methods, instructions or products referred to in the content.

