Article

Design and Performance Analysis of a Grid-Connected Distributed Wind Turbine

1
Department of Electrical and Computer Engineering, Texas Tech University, Lubbock, TX 79409, USA
2
National Wind Institute, Texas Tech University, Lubbock, TX 79409, USA
*
Author to whom correspondence should be addressed.
Energies 2023, 16(15), 5778; https://doi.org/10.3390/en16155778
Submission received: 22 June 2023 / Revised: 24 July 2023 / Accepted: 1 August 2023 / Published: 3 August 2023
(This article belongs to the Section A3: Wind, Wave and Tidal Energy)

Abstract

:
The utilization of wind energy has become increasingly popular in the United States and many European countries due to its abundant nature and optimized design. While existing wind turbines are predominantly large-scale and not suitable for standalone or distributed power production, Lubbock County in West Texas offers a diverse range of renewable energy options to meet its energy needs. The region relies heavily on utility-scale wind energy sources to supply power to the Texas Grid, replacing conventional fossil fuel-based systems. Currently, standalone solar PV systems are the preferred choice for renewable energy generation. However, West Texas possesses an ample supply of wind energy that can be harnessed to establish a microgrid and provide standalone power to rural communities. Distributed wind energy offers localized power generation, reducing transmission losses and grid strain, while conventional wind farms require long-distance transmission, leading to efficiency gains. By employing the latest technology and optimizing efficiency, even in low-scale generation, a 6-kilowatt permanent magnet alternator-based distributed wind turbine has been designed. This paper focuses on analyzing the techno-economic aspects of implementing this wind turbine in a real-world scenario, taking into account wind attributes, such as velocity and available power, at the specific location.

1. Introduction

To improve the socio-economic growth of a country, sustainable and energy-efficient delivery of energy to end-users is vital. Several countries plan to transform their energy infrastructure to reflect natural resource availability while ensuring grid stability [1,2]. At present, most of the world’s energy is generated by fossil fuel-based power plants, which negatively impact the environment [3,4,5]. The technique of converting fossil fuels into electric energy directly increases the ozone layer depletion rate and causes frequent acid rain [5,6]. Besides these impacts, several harmful chemicals now imbalance the ideal ingredient ratios of air required for safe breathing [7]. As shown in the report regarding global energy generation, large-scale renewable-based electricity generation can directly minimize the use of fossil fuel generators [8,9,10,11,12,13,14,15]. Indeed, the renewable energy conversion technique has a very low impact on the environment compared to fossil fuel-based system, and its environmental impact is negligible as it produces fully clean energy via clean natural sources [16,17,18,19,20]. Compared to large-scale central renewable energy plants, smaller-scale renewable energy systems that use microgrids and/or distributed energy systems have fewer or almost no negative impacts on the environment [21,22]. A common example of this is the small-sized off-grid rooftop solar system. In Texas, however, after wind, solar power has good prospects to improve the overall percentage of renewable energy-based electricity generation [23]. Energy generation using wind has become a common trend. In the past, the kinetic energy from wind was used to propel ships, for irrigation, to pumping water, power windmills, etc. Currently, kinetic energy derived from wind is predominantly used to efficiently generate electricity [24,25,26]. To obtain higher efficiency from wind energy generation, the minimum average wind speed required is around 6.5 m/s. But in the context of West Texas, the average wind velocity is around 8.5 m/s [27]. These available average wind speeds can be used to harness power derived from larger-scale wind energy, as well as create opportunities for distributed and/or standalone wind turbines, particularly in rural communities and ranches [28]. However, at present, standalone wind turbine technology has a lower possibility of commercialization and availability than solar and diesel generators [29,30]. However, several recent studies indicate that increased development of off-grid small-scale wind energy in Texas’ coastal regions has attractive economic benefits [31]. Texas is home to various rural communities and traditional ranches that receive electricity from electric co-operatives. Distributed wind systems can be installed in diverse locations, including urban areas, providing greater flexibility and minimizing visual and environmental impacts, which can often be challenging for large-scale conventional wind farms. These electric co-operatives are considering integrating distributed energy resources into their service territory, as well as providing incentives to their members to participate in virtual power plant programs [32,33,34,35]. High-speed distributed wind energy systems could be developed in West Texas communities with high potential for power production. Various types of small family-owned farms and ranches are established in these areas, and most of them currently use diesel/natural gas generators to provide backup power supply [5]. Although a few wind turbines have been efficiently designed, they have not been widely installed and operated due to economic factors and poor performance during natural disasters [6]. Figure 1 shows the current wind farm establishments in Texas [36].
In modern times, using the latest technology design is essential to harnessing wind energy in the high wind-speed regions to improve the overall performance and longevity of the system [36,37]. Two of the most common methods of integrating wind turbines are microgrid-based and standalone wind turbines as distributed energy resources [37]. Generally, a wind energy system has three main blocks for energy conversion: the turbine blade system, coupling mechanism between the blade and the rotor, and rotor system [8]. However, the coupling gear system is not mandatory in the low-speed system because of its lower efficiency and higher cost, as well as its greater noise production and regular maintenance [32]. To build a high-speed standalone high-efficiency wind energy system, researchers usually focus on the design of the turbine blades and Permanent Magnet Alternator (PMG). Several types of blade foils are already implemented in NACA and NREL line-ups; however, they are not suitable for every location. Numerous NACA foils are used to analyze NREL because of their greater availability, low maintenance requirements, and cost-effectiveness for a small-sized wind turbine blade system [26,27,28,29,30,31,32]. Taking weather diversity into account, different types of foils are analyzed. Besides blade foil analysis and blade design, this study focuses on the system’s cost-effectiveness and improvements in grid resiliency. Grid resiliency refers to the ability of a power grid to withstand and quickly recover from disruptions, such as power outages, natural disasters, or cyber-attacks. Figure 2 shows the proportional causes of grid outages in the US.
A resilient power system is essential for ensuring the reliable and secure delivery of electricity to homes, businesses, and other customers [8,38]. There are several key factors that contribute to the resiliency of a power grid, including the diversification of energy sources, such as wind, solar, hydro, and natural gas, which can help to reduce the risk of power outages by reducing dependence on any one source [39,40,41,42]. Grid modernization or upgrading the power grid using smart grid technology, such as advanced sensors and control systems, can help to detect and respond to disruptions more quickly and effectively [43]. Adding Energy Storage Systems (ESS), such as batteries, can store excess energy during periods of low demand and release it during periods of high demand, helping to maintain stability in the grid [44]. Redundancy and backup systems, such as backup generators, when put in place, can help to ensure that power can be restored quickly in the event of an outage, and protecting the power grid from cyber-attacks through the use of secure networks and other cybersecurity measures is essential for ensuring its resiliency [39,40,41]. Building a resilient power grid requires a combination of technical and operational measures designed to ensure that the grid can withstand and quickly recover from disruptions [42]. This approach will help to maintain the reliability and security of the power grid and ensure that electricity is delivered to customers when and where it is needed [43,44]. Microgrids and modern smart grids are often considered the best way to improve resiliency and overall efficiency.
Microgrids are often defined as a local energy grid with distributed generation, energy storage, and possible load management capabilities [44,45,46,47]. It operates as a entity separate from the traditional centralized power grid and can function both while connected to the main grid and while disconnected from it (island mode) [48]. Microgrids are designed to provide reliable and resilient power supply to critical areas, communities, and infrastructure [45]. They can be composed of various energy sources, such as renewable energy resources, fossil fuel-based generators, and energy storage systems [49,50]. A standard microgrid schematic is shown in Figure 3.
Taking these limitations into account, the targeted aims of this research work are to analyze the wind scenarios in Lubbock, TX, and develop the available wind power this is suitable to create a cost-effective distributed wind system that can effectively and efficiently work as a distributed energy source to improve resiliency.

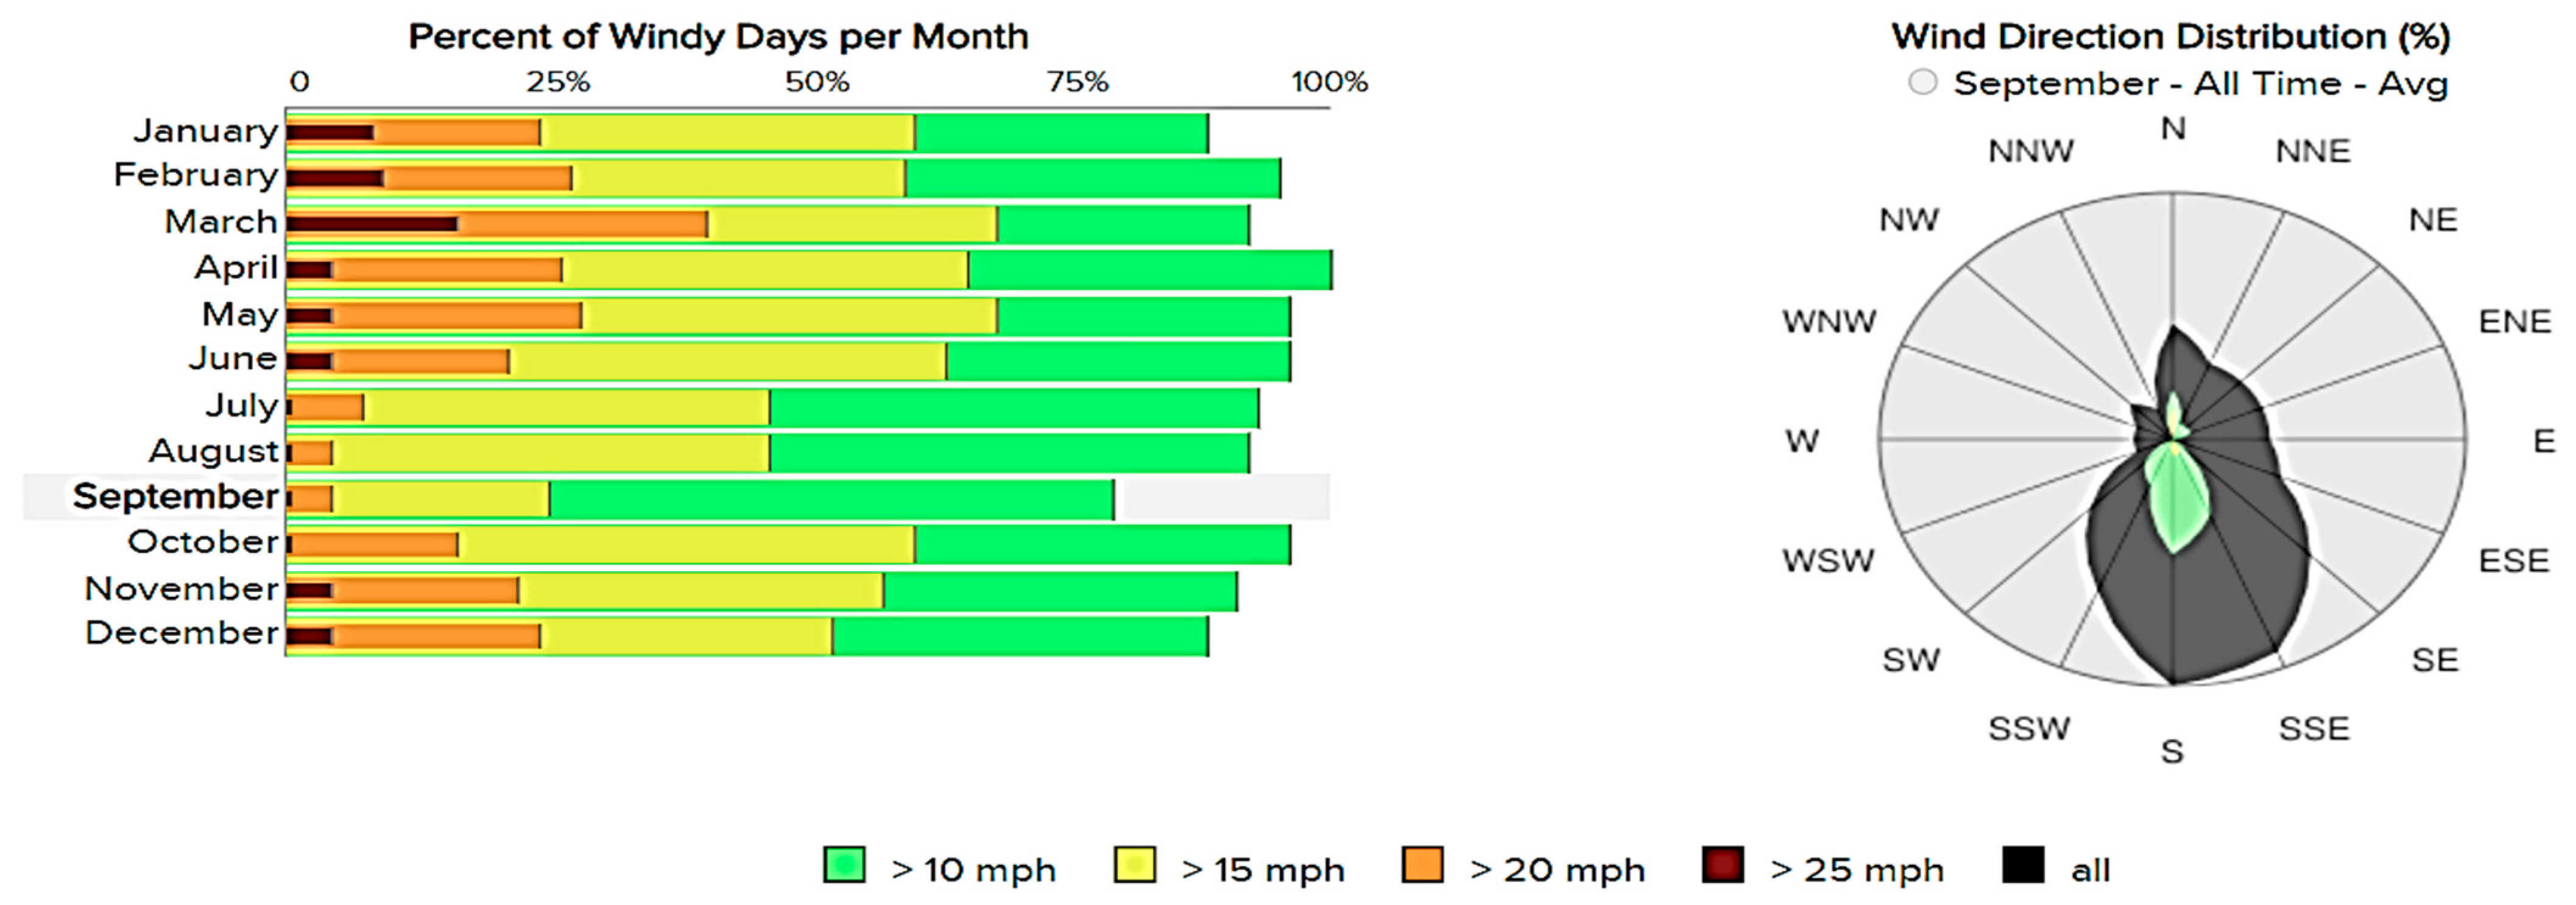
2. Wind Scenarios in Lubbock
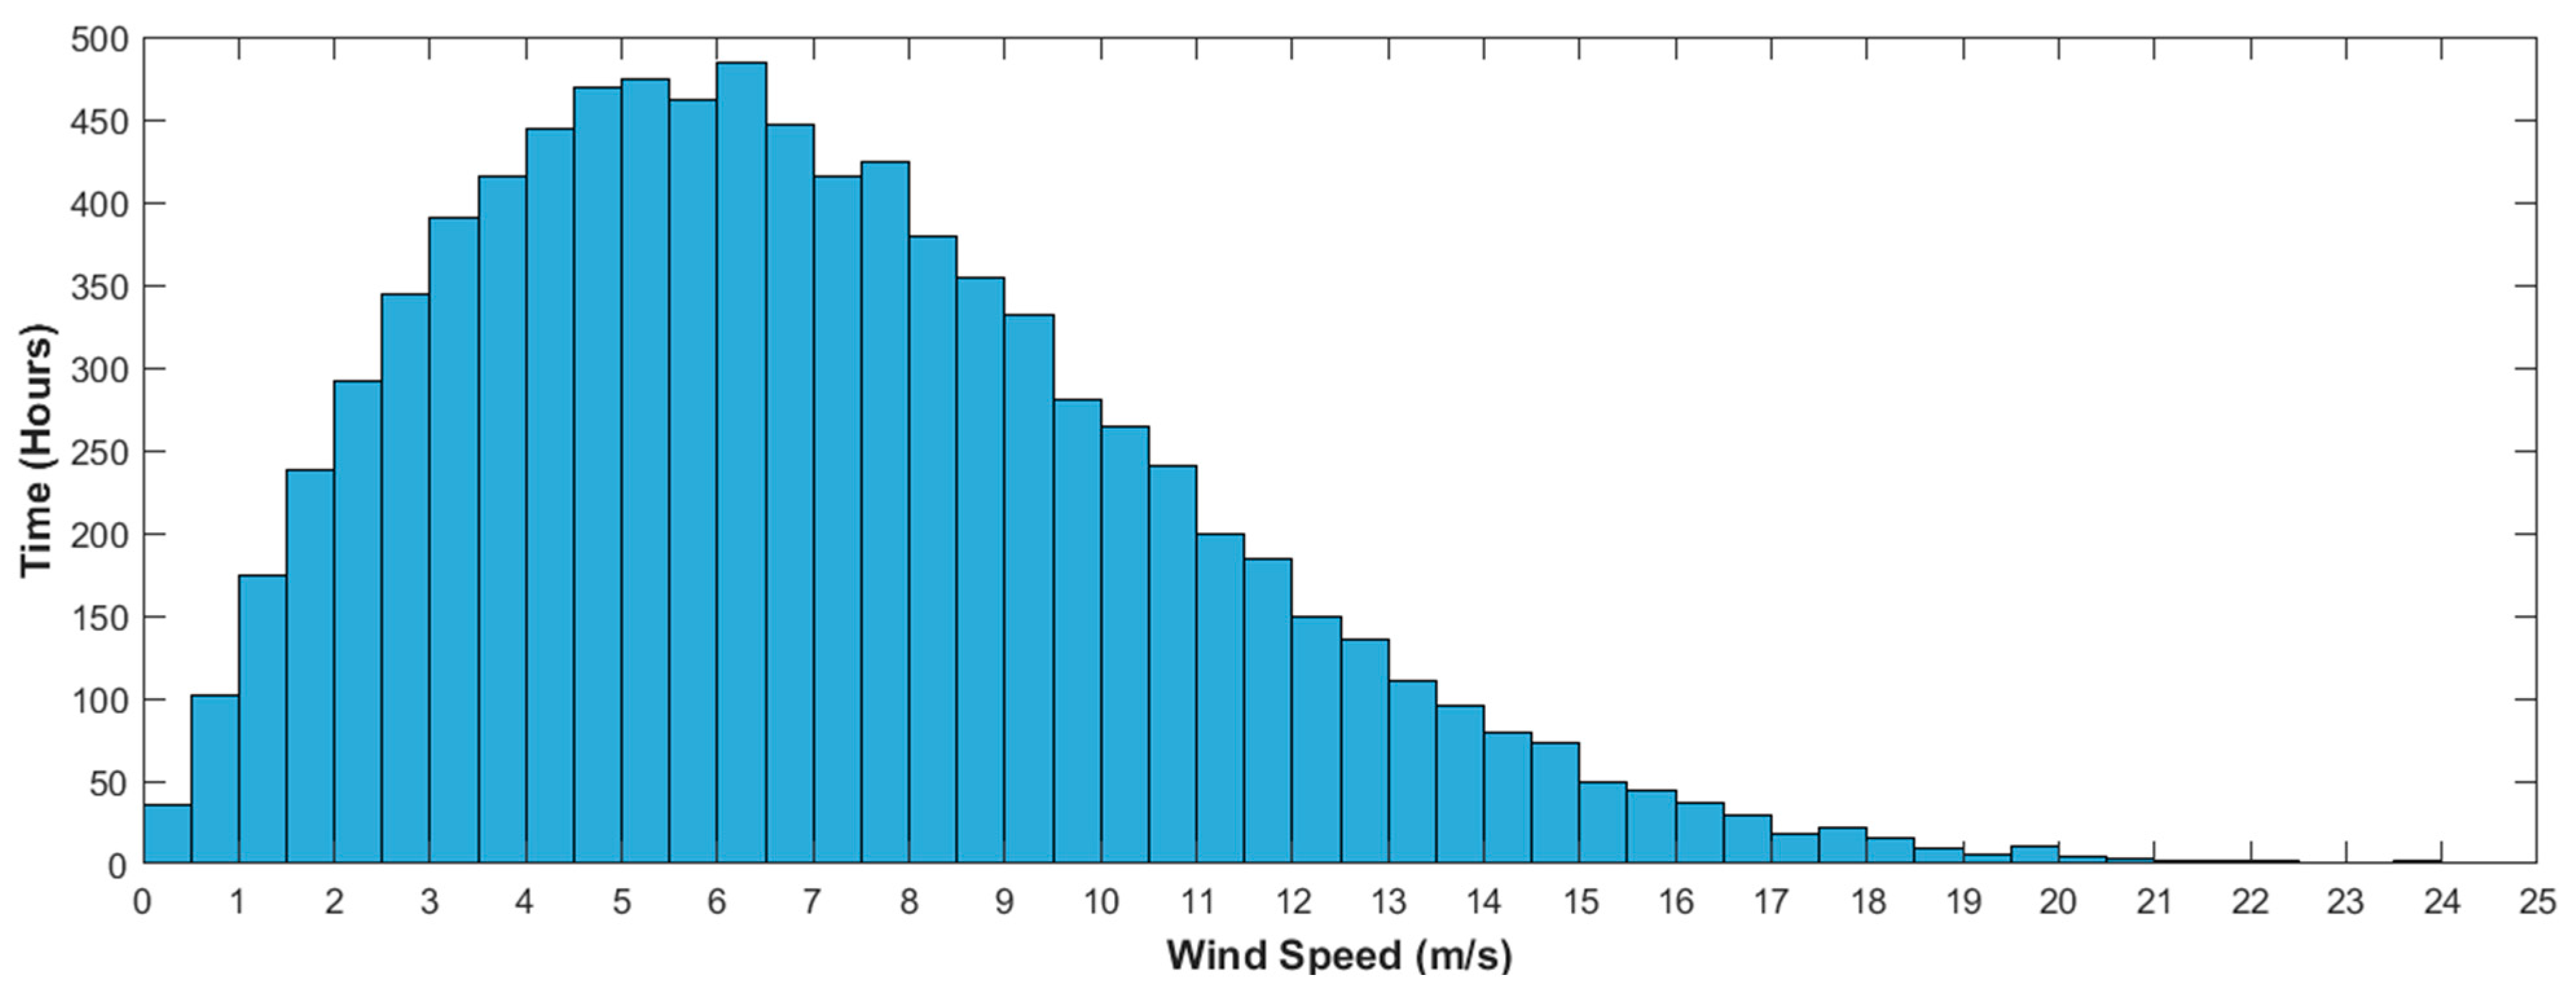
Lubbock is one of the largest cities in West Texas. The metropolitan area of Lubbock, TX, has a population of over 330,000 [39,40,41,42,43]. Due to its economic, academic, and healthcare-related growth, Lubbock has been labeled a “Hub City”. As part of the National Wind Institute (NWI) research center is based at Texas Tech University (TTU), the city has become a wind energy research and technology hub, with multiple ongoing research projects taking place in the local area [38]. On the other hand, Reese Technology Centre (RTC), which is a research facility located in a former US Air Force base near Texas Tech University (TTU), collaborates with West Texas Mesonet by consistently collecting wind and solar data to explore the renewable potential of West Texas [51,52,53]. These organizations are studying the performance of large-scale turbines under typical wind conditions and the applications of wind energy as a distributed energy resource. A historical data analysis was conducted during this study. Figure 4 shows the average monthly wind speed data of Lubbock, TX.

2.1. Data Analysis

The primary objective of studying wind data in this area is to examine the average wind speeds, along with the maximum and minimum wind speeds, in different seasons to calculate the wind energy potentials. Texas Mesonet uses an anemometer to measure the available wind velocity at a height of 10 m from the ground. The Weibull view of recorded data is shown in Figure 4, where the mean wind speed is around 26 mph, i.e., 11.62 m/s, and the maximum velocity is 32 mph, i.e., 14.3062 m/s, which is well above the average values required for conventional distributed small-scale wind power generation.

2.2. Height Determination

Since the study’s primary goal is to improve our utility grid’s overall resiliency by integrating more distributed wind turbines to serve households in Lubbock, TX, the height that we used was within the standard limit for a suburban area [15].
According to the wind power law, the wind speeds can be calculated at any reference point via the equation shown in [19,23,24]:
v = v 0 h h 0 α
where v = Wind Velocity, v 0 = Wind Velocity at the height of reference, h = Height (Measured), h 0 = Height (Reference), and α = Frictional Coefficient. In a small town or suburban city, the Frictional Coefficient is α = 1/3 = 0.33 (according to Equation (1)). At the proposed height of 100 feet, the wind velocity can be measured as follows:
v = v 0 h h 0 α = 11   m s 1   ( Y e a r l y   a v e r a g e )
A Histogram of the MESONET site data at a height of 10 m is shown in Figure 5.

2.3. Air Density

Air density plays a significant role in wind power generation, which changes with the change in temperature [19]. The average temperature (°C) in the Lubbock region is 28 °C, i.e., 82 F. The air density value changes at different temperatures are listed in Figure 6 [19,25].

2.4. Maximum Power Calculation

Considering the maximum construction limit in a suburban area and maximum wind velocity, the desired output power is considered to be 6 kW [15] (Equation (1)). As stated by Betz Law, for wind power extraction, kinetic energy extraction of over 59.3% is not possible for any wind turbine system. Maximum available power can be calculated using this law [19,22], which is given as follows:
P a v a i l a b l e = 1 2 ρ A v 3 C P
where the swept area (rotor blade) A = πr2, and the Betz limit coefficient CP = 0.37. Considering the maximum output power of the low-speed turbine,   P a v a i l a b l e = 6 kW (desired), Height (Pole) = 20 m, Blades Count = 3, and Radius of the Blade Swept Area r = 2.5 m. Hence, the blade’s swept area will be A = π r 2 = 19.635   m 2 . As shown by the wind velocity in section III.B, v = 12 m/s or 18 mph, and the density of the air, ρ = 1.165 kg/m3 for the generalized temperature of 30 °C, i.e., 86 F; thus, the theoretical maximum accessible power for 6000 Watts of output power (desired) will be found using Equation (2), which is defined as follows:
P a v a i l a b l e = 1 2 ρ A v 3 C P = 1 2 × 1.165 × 19.635 × 12 3 × 0.40 = 6202.46   W 6   k W
Given the available power and wind velocity, a suitable turbine blade can be used, which will be quite efficient for the planned case.
In consideration of the swift area being 19.635 m, efficiency can be obtained as follows:
E f f i c i e n c y ,   η = T o t a l   e x t r a c t e d   p o w e r A v a i l a b l e   e n e r g y × 100 = 77 %

3. Design of Six-Kilowatt Wind Turbine
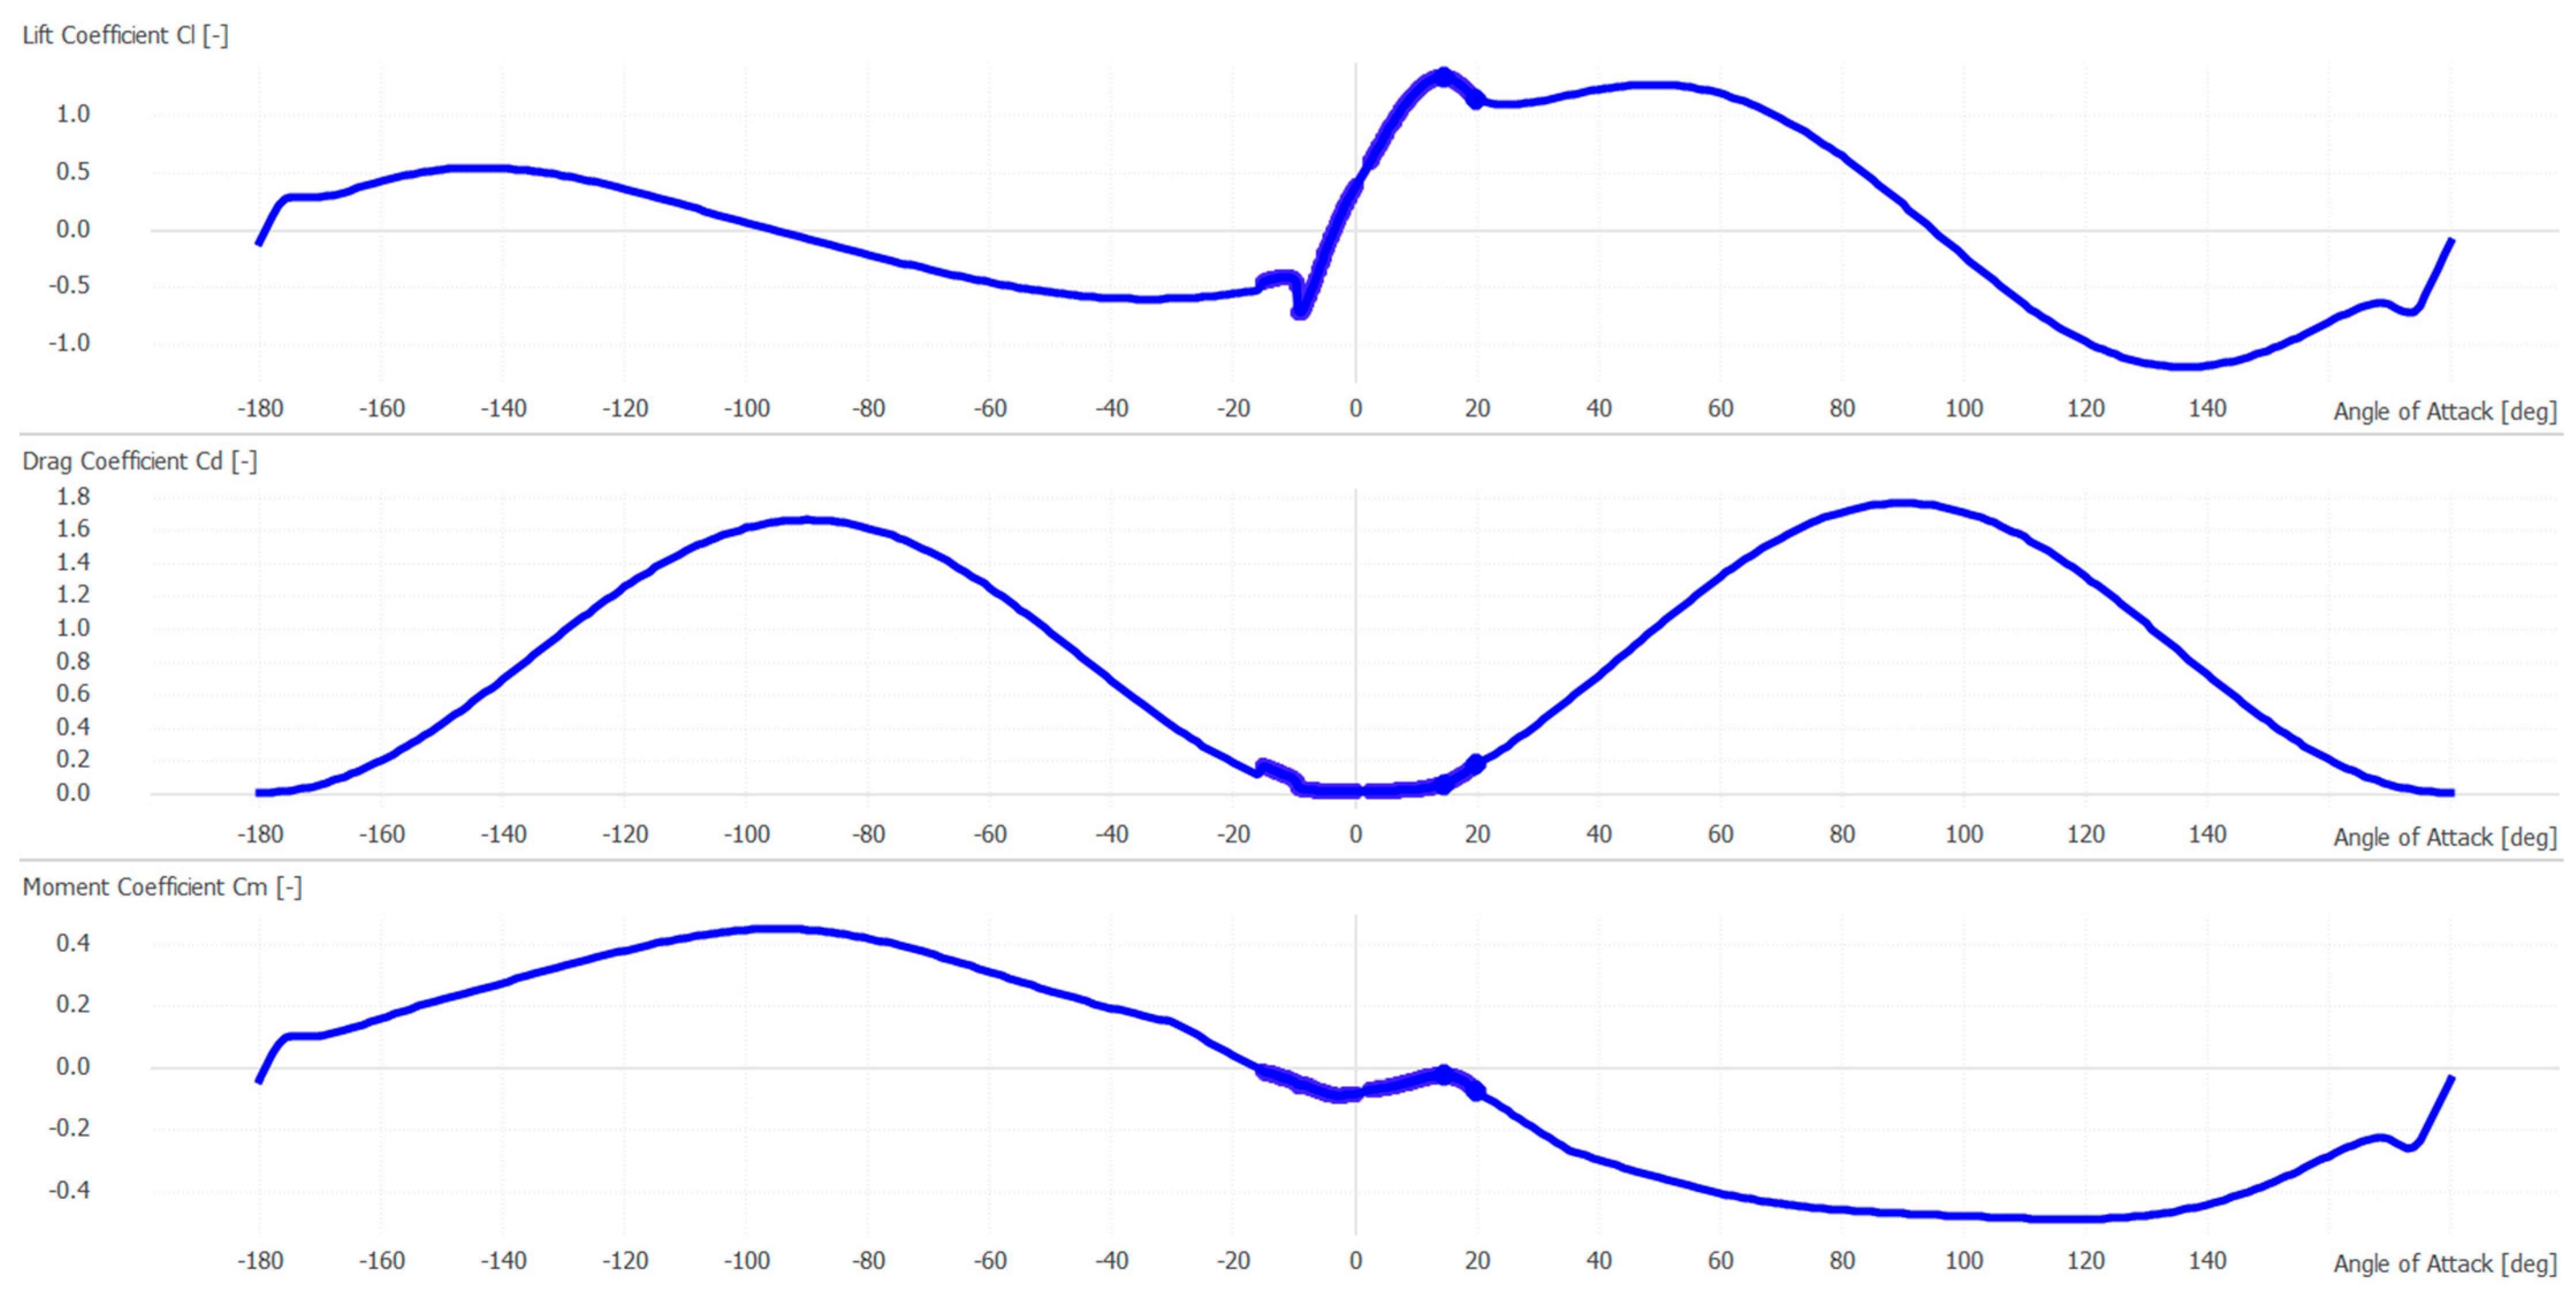
Before building a wind turbine system, regardless of whether it is small or large in size, there are some major factors that determine the design procedure of the system.

3.1. Blade Design

A standalone wind turbine with a maximum capacity of 6 kW has been simulated using NACA 2101 airfoil. Figure 7 shows the pressure distribution on the selected airfoil. After choosing the airfoil, an analysis of airfoil pressure distribution and polar extrapolation was conducted. Airfoil pressure distribution refers to the distribution of pressure around the surface of an airfoil as it moves through the air. The pressure distribution is a crucial factor involved in determining the lift and drag forces acting on the airfoil, which, in turn, determine its performance.
Airfoil polar extrapolation is a method used to predict the performance of an airfoil at different flight conditions based on its lift and drag characteristics. An airfoil polar is a graph that shows the Lift Coefficient (Cl) on the vertical axis and the Drag Coefficient (Cd) on the horizontal axis for a given airspeed and Angle Of Attack (AoA). The polar is generated by testing the airfoil in a wind tunnel using the Computational Fluid Dynamics (CFD) simulations performed via Qblade software version no 2.0.6.3.
Figure 8 shows the extrapolated scenarios for Lift Coefficient (Cl), Drag Coefficient (Cd), and Moment Coefficient (Cm) based on a 360-degree angle of attacks using the chosen airfoil.
The chord of a wind turbine blade is the distance from the leading edge (the front of the blade) to the trailing edge (the back of the blade) [12]. The chord length is one of the most important geometric parameters in blade design, as it affects the blade’s aerodynamic performance and structural efficiency [19]. Longer chords generally result in greater lift and lower drag, but they also require more material, making the blade heavier and more expensive. The thickness of a wind turbine blade is the distance between the upper and lower surfaces of the blade. Blade thickness affects the blade’s stiffness and strength, as well as its aerodynamic performance [12]. Thicker blades are generally stronger, but they also have a greater drag due to the increased thickness of the boundary layer of air around the blade [12]. The twist of a wind turbine blade refers to the change in the angle of attack along the length of the blade. Blade twist is an important design parameter that affects the blade’s performance and load distribution. The twist is typically designed to be greater near the root of the blade and decrease toward the tip to ensure that the blade can maintain a relatively constant angle of attack along its length, even as the speed of the airflow changes with blade radius. Figure 9 shows the blade chord, thickness, and twist properties.
Considering the parameters shown in Figure 9, the final blade design shown in Figure 10 is achieved by considering the wind turbine blade’s chord, thickness, and twist as important design parameters that affect its aerodynamic performance, structural efficiency, and load distribution. Optimal values for these parameters are determined through a combination of computational simulations using Qblade, with the goal being to achieve maximum energy capture using minimal loads and structural stresses.

3.2. Permanent Magnet Alternator

THHN and TFFN are two types of electrical wiring that are commonly used in PMA construction. THHN stands for Thermoplastic High Heat-Resistant Nylon-Coated, and it is a type of single conductor electrical wire [11,54]. It is rated for 600 volts and 90 °C, and it is designed to withstand high temperatures. TFFN, on the other hand, stands for Tinned Copper Stranded Flexible Fixture wire. TFFN wire is similar to THHN wire, but it is designed to be more flexible and commonly used in applications in which the wire needs to bend or be easily manipulated. TFFN wire is also rated for 600 volts and 90 °C and made from tinned copper [55]. THHN and TFFN can both be used for winding applications, depending on the specific requirements of the application. THHN wire is generally used in applications that require a more rigid wire, while TFFN wire is used in applications that require a more flexible wire [11,13]. Since durability and lower maintenance are one of the design goals, THHN winding wire was selected for the design. In order to calculate the number of poles, the rotating machine equation was used.
S R a t e d = 120 × f N
where S R a t e d , f, and N are rated, frequency, and the number of poles, respectively.
Moreover, to generate maximum energy, a bigger magnetic field is required to make the generator more compact. This process was derived from the following equation:
ϕ g = B a v × π × D × L P
where ϕ g = Magnetic Flux, B a v = Flux Density (Average), D = Stator Diameter (Inner), and L = Stator Length.
Figure 11 shows the 3D design of the permanent magnet alternator, and the detailed designed parameters for the desired output are given in Table 1.

4. Result Analysis

Distributed wind turbines, which are also known as small wind turbines, can bring several economic and resiliency benefits to communities [48]. One of the key advantages is cost savings created by generating their own electricity; communities can reduce their dependence on the grid and, thus, lower their energy bills. This outcome can be particularly beneficial for remote or rural communities, for whom energy costs are often higher; distributed wind turbines can provide communities with a source of renewable energy that is not dependent on the larger grid. This outcome can help to increase energy security and reduce the risk of power outages [48,56].

4.1. Power Generation

To calculate the economic and resiliency benefits, two cases were compared. In both cases, a small community load profile was considered, which had an average daily load demand of 100 kWh and a maximum peak demand of 14.29 kW, as shown in Figure 12.
A comprehensive demand analysis, including monthly peak demand identification and load factor, was conducted for commercially available battery and system converter size consideration; the peak monthly load demands are shown in Figure 13.
The peak demand was calculated by considering the maximum load consumption in a month, and the monthly load factor was calculated by dividing total monthly energy demand by peak demand.
Both the base case and proposed case system architectures are shown in Figure 14. In case 1, i.e., grid-only mode, we considered utility as the sole supply source to the load. However, case 2 consists of a 6-kilowatt grid-connected distributed wind turbine with a 47.1% capacity factor, 20-kilowatt-hour Li-ion batteries as a storage system, and an 8-kilowatt system converter. The Li-ion battery has an expected lifetime of 17 years, according to the manufacturer, whereas the overall analysis period is 25 years. Therefore, a replacement battery was considered for the 17th year. The detailed information on the proposed system is tabulated in Table 2.

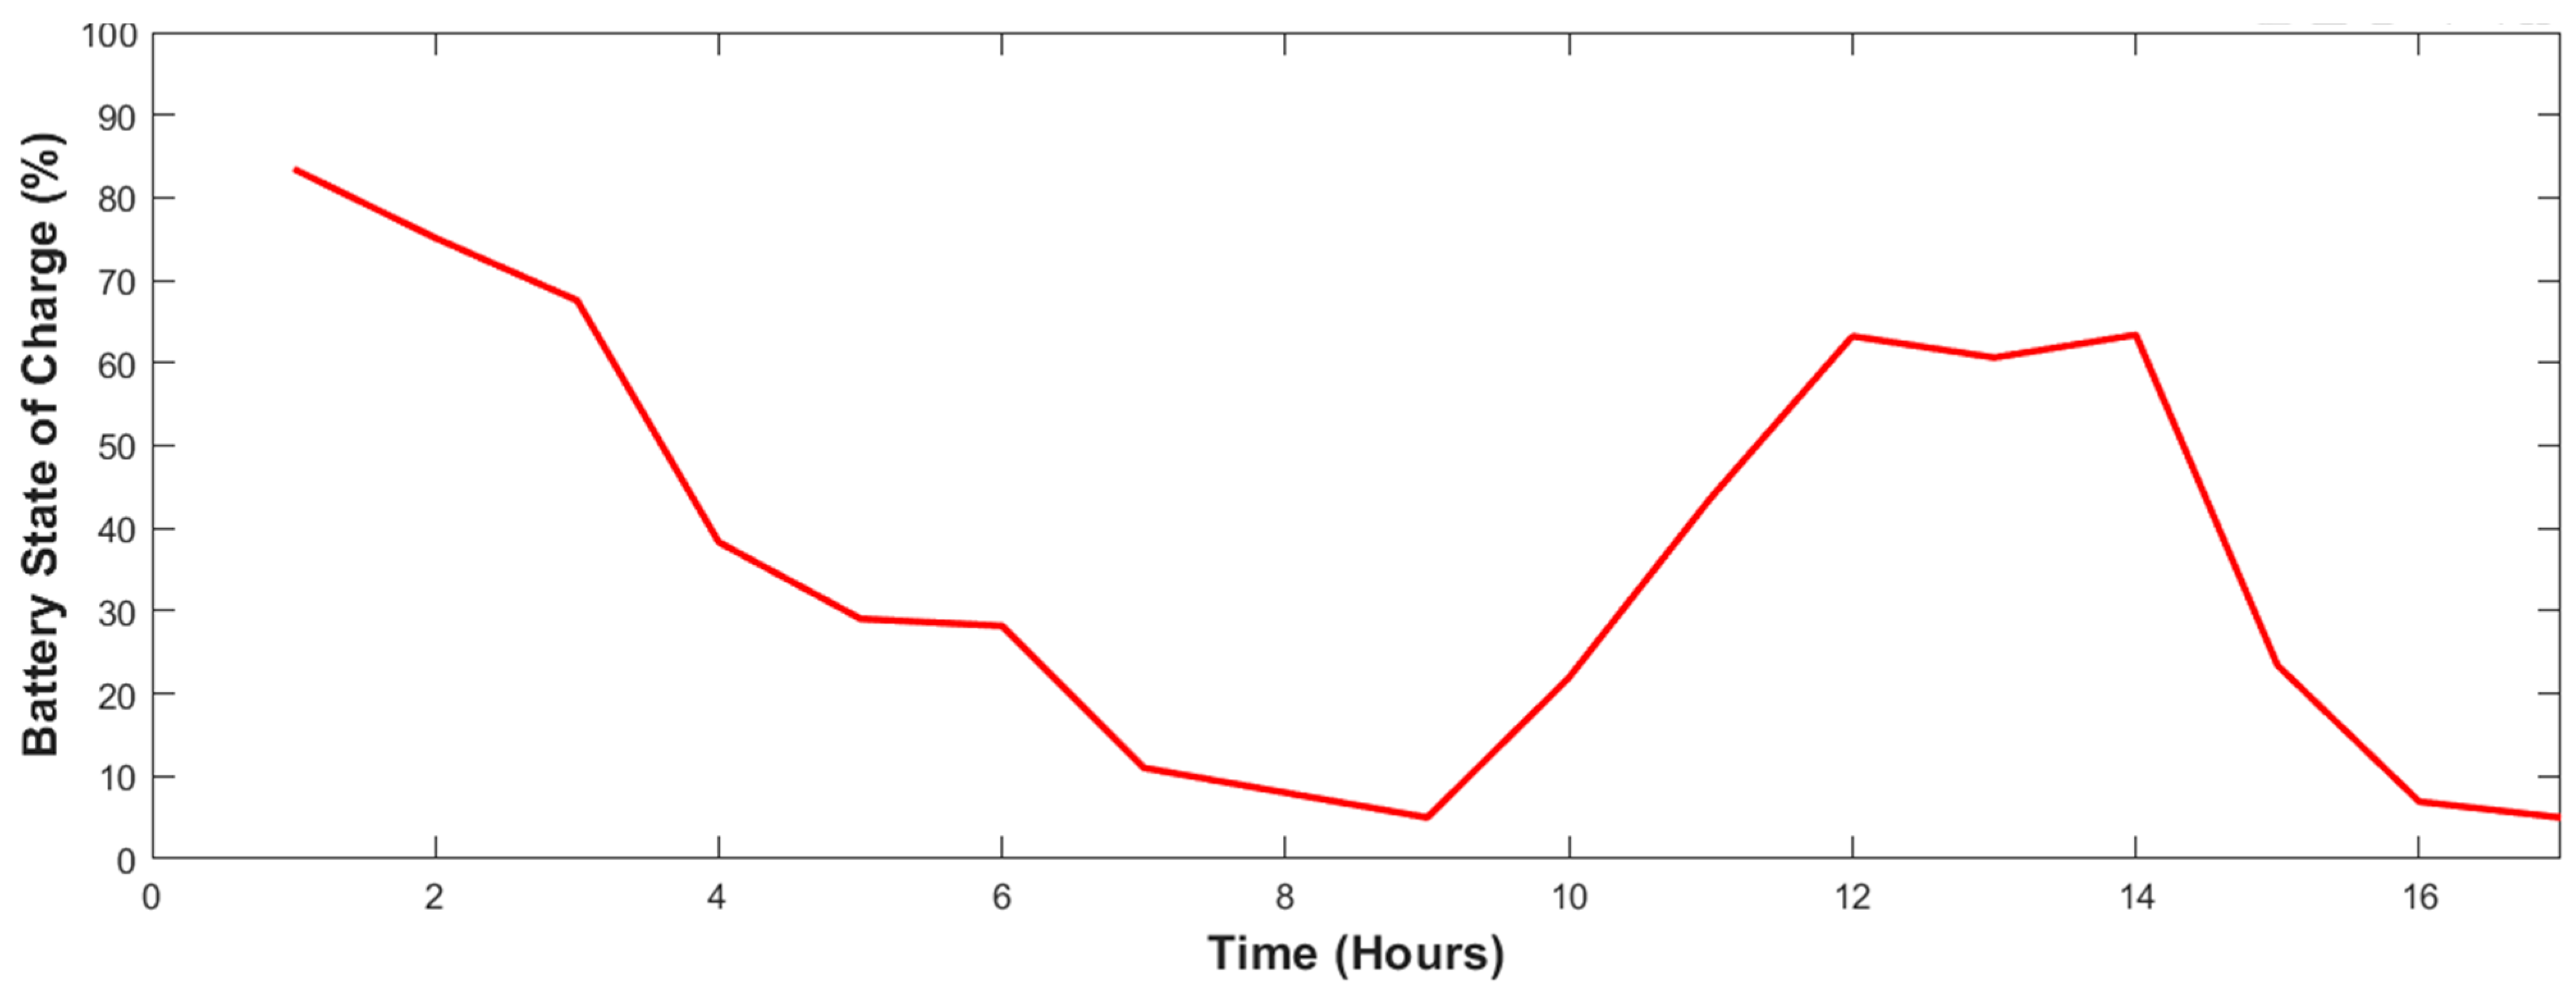
4.2. Resiliency Analysis

To evaluate the resilience of a power grid, time series analysis can be a useful tool. Time series analysis involves the statistical modeling and analysis of data that are collected over time, with the goal of identifying patterns, trends, and anomalies [57]. A time series analysis has been conducted to determine the resiliency period of the proposed system, as shown in Figure 15. The maximum resiliency time of the proposed system is 16 h.
Figure 16 illustrates the battery state of charge during the 16 h of outage, during which period no load priority was considered. In the beginning of the outage, the battery state of charge was 83%, whereas toward the end of the outage, it fell to 5%, as declared using HOMER Pro version 3.14.2.
Although, during outage, the distributed wind turbine mostly generated maximum power, on two occasions, it was unable to generate power due to the lack of a sufficient wind speed. The renewable penetrated power generated by the distributed horizontal axis wind turbine is shown in Figure 17.
The relationship between battery SoC and renewable penetration can be obtained by comparing Figure 16 and Figure 17. At the beginning of the outage, the wind turbine’s power generation and battery-stored energy were operating at maximum efficiency. Battery discharge was expedited when there was no power generation from the wind turbine.

4.3. Economic Benefits

For the purpose of computing the techno-economic analysis of the proposed DER-based system, some economic data are required [50]. The project lifetime, nominal discount rate, inflation rate, and emission penalty for the project location can be found in [50,51]. Considering the economic data required for this analysis, a number of economic formulas are considered, as shown in Equations (5)–(8), in which C refers to cost.
Total Annualized Cost,
C a n n u a l ,   i = ( C c a p i t a l + C o p e r a t i o n   a n d   m a i n t a n c e + C r e p l a c e m e n t + C f u e l ) i
where the operation and maintenance cost of a system is considered as the cost associated of operating and maintaining that system. The total operation and maintenance cost of the system is the sum of the costs of each system component, and for the grid, the operation and maintenance cost is the annual cost of buying power from the grid minus any revenue generated by selling power to the grid.
Cost of Energy,
C o s t   o f   e n e r g y = C a n n u a l ,   i   E t o t a l   l o a d   s e r v e d
Capital Recovery Factor,
C R F   i ,   N = i   1 + i N ( 1 + i ) N 1
where the Discount Rate is i, and N represents the number of years.
Total Net Present Value,
C N P V = C a n n u a l ,   t o t a l C c a p i t a l   r e c o v e r y   f a c t o r
A detailed techno-economic comparison between the two cases is shown in Table 3.
The proposed system adds 6.0 kW of wind generation capacity, and 20 kWh of battery capacity will reduce the operating costs to $1387/year and have a simple payback period of 15.4 years and an IRR of 3.82%. The cumulative cash flows of both grid only and DER grid-connected to the grid are shown in Figure 18.

4.4. Environmental Benefits

Small wind turbines are a clean and renewable energy source that do not produce greenhouse gas emissions or other pollutants [2,56]. A comprehensive emission analysis was conducted for both grid-only and grid-tied 6-kilowatt distributed horizontal axis wind turbines with a 100-kilowatt daily community load to evaluate the benefits. On average, the carbon emission is 380 g per kWh, whereas the sulfur dioxide and nitrogen di oxide emissions are marginally low at about 2 g and 1 g per kWh, respectively [58,59]. Considering the emission rate, detailed comparisons between GHG elements are shown in Table 4.
As shown in Table 4, the overall emission reduction generated by the proposed grid-connected distributed turbine is over 50%.

5. Conclusions

This research work examines the potential of distributed wind energy in Lubbock, which is located in West Texas, where an average wind speed of 11.6 m/s provides a reliable source of electricity generation through appropriate turbine utilization. The design and analysis of a 6-kilowatt distributed wind turbine were conducted to assess its ability to harness the energy from this high wind flow, as conventional wind farm setups are typically lengthy and commercially oriented. The study focused on wind data analysis, determining the optimal turbine blade foil combination, as well as designing a robust and compact rotor for the distributed turbine system. The dimensions of the blade were carefully calculated to maximize wind coverage within the available high wind speeds. The economic and resiliency potentials of distributed wind turbines were evaluated, revealing multiple benefits for communities, including cost savings, enhanced energy independence, local job creation, community ownership, and environmental advantages. In conclusion, the study demonstrates that distributed wind turbine systems in Lubbock, TX, have significant potential to play a crucial role in the economics of national energy generation and can improve resilience during grid outages.

Author Contributions

M.M.: Conceptualization, methodology, data collection, data analysis, writing—original draft, and writing—review and editing. M.C.: Writing—review and editing and project administration. K.E.K.S.: Methodology, data analysis, writing—review and editing, and visualization. R.B.: Data collection, data analysis, and writing—review and editing. O.A.: Draft manuscript preparation, review and editing, and visualization. S.B.: Conceptualization, writing—review and editing, supervision, and funding acquisition. All authors have read and agreed to the published version of the manuscript.

Funding

This work was supported by the US Department of Defense (DOD)’ s Environmental Security Technology Certification Program (ESTCP) (No. W912HQ20C0022).

Data Availability Statement

Data sharing is not applicable to this article.

Acknowledgments

The authors of this article would like to acknowledge the help and support provided by the Department of Electrical and Computer Engineering and the National Wind Institute (NWI) of Texas Tech University, as well as that provided by the Texas Water Development Board (TWDB), which shared the TexMesonet wind data, and the Global Laboratory for Energy Asset Management and Manufacturing (GLEAMM).

Conflicts of Interest

The authors declare no conflict of interest.

Nomenclature

NACANational Advisory Committee for Aeronautics
NRELNational Renewable Energy Laboratory
BESSBattery Energy Storage System
DHAWTDistributed Horizontal Axis Wind Turbine
SoCState of Charge
ClLift Coefficient
CdDrag Coefficient
CmMoment Coefficient
AoAAngle of Attack
PMAPermanent Magnet Alternator
ASwift Area
hHeight
mMass of Air, kg
vWind Velocity, m/s
ρAir Density, kg/m3
CPBetz Limit Coefficient
αFrictional Coefficient
pStatic Pressure, kPa
VVolume of Air, m3
ηEfficiency, %
NRated Speed
fFrequency
PPole Quantity
ϕgMagnetic Flux
BavFlux Density
DStator Diameter
LStator Length
TTemperature, °C
IRRInvestment Return Rate

References

  1. Bilal, M.; Araya, G.; Birkelund, Y. Preliminary Assessment of Remote Wind Sites. Energy Procedia 2015, 75, 658–663. [Google Scholar] [CrossRef] [Green Version]
  2. Tentzerakis, S.T.; Papathanassiou, S.A. An Investigation of the Harmonic Emissions of Wind Turbines. IEEE Trans. Energy Convers. 2007, 22, 150–158. [Google Scholar] [CrossRef]
  3. Hanselman, D. Brushless Permanent Magnet Motor Design; Magna Physics Pub: Orono, ME, USA, 2003. [Google Scholar]
  4. Ahsanullah, K.; Dutta, R.; Fletcher, J.; Rahman, M.F. Design of an interior permanent magnet synchronous machine suitable for direct drive wind turbine, 2nd IET. In Proceedings of the Renewable Power Generation Conference (RPG), Beijing, China, 9–11 September 2013; pp. 1–4. [Google Scholar]
  5. Fei, W.; Luk, P.C.K. A new technique of cogging torque suppression in direct-drive permanent-magnet brushless machines. In Proceedings of the IEEE International Electric Machines and Drives Conference 2009, Miami, FL, USA, 3–6 May 2009; pp. 1332–1340. [Google Scholar]
  6. Liu, T.; Huang, S.; Deng, Q.I.; Pu, Q.; Huang, K. Effect of the number of slots per pole on the performance of permanent magnet generator direct-driven by wind turbine. In Proceedings of the IEEE International Conference on Electrical Machines and Systems (ICEMS), Beijing, China, 20–23 August 2011; pp. 1–4. [Google Scholar]
  7. Ocak, C.; Uygun, D.; Cetinceviz, Y.; Demir, E.; Gungor, Y. Performance aspects and verifications of in-runner and out-runner permanent magnet synchronous generator designs of the same magnet structure for low-speed wind systems. In Proceedings of the 11th International Conference on Environment and Electrical Engineering (EEEIC), Venice, Italy, 18–25 May 2012. [Google Scholar]
  8. Neumann, T.W.; Tompkins, R.E. Line start motor designed with NdFeB permanent magnet. In Proceedings of the 8th International Workshop on Rare Earth Magnets and their Application, Dayton, OH, USA, 8–11 June 1985; pp. 77–89. [Google Scholar]
  9. Schubel, P.J.; Crossley, R.J. Wind Turbine Blade Design Review. Wind. Eng. 2012, 36, 365–388. [Google Scholar] [CrossRef]
  10. Wende, W.; Jingcun, G.; Gouliang, X.; Yong, C. High efficiency and energy-saving DC brushless motors. In Electrical Energy Conference; Institution of Engineers: Barton, ACT, Australia, 1987; pp. 499–502. [Google Scholar]
  11. Mhango, L.M.C. Benefits of Nd-Fe-B magnet in brushless DC motor design for aircraft applications. In Proceedings of the 4th IET International Conference on Electrical Machines and Drives, London, UK, 13–15 September 1989; pp. 76–79. [Google Scholar]
  12. Murshed, M.; Arafat, M.Y.; Razzak, M.A. Analysis of Air Foils and Design of Blades for a Low-Speed 250W Vertical Axis Wind Turbine Suitable for Coastal Areas of Bangladesh. In Proceedings of the 2019 5th International Conference on Advances in Electrical Engineering (ICAEE), Dhaka, Bangladesh, 26–28 September 2019. [Google Scholar]
  13. Arafat, Y.; Murshed, M.; Razzak, M.A. Design and Analysis of an In-Runner Permanent Magnet Alternator for Low-Speed Wind Turbine. In Proceedings of the 4th International Conference on the Developments in Renewable Energy Technology (ICDRET), Dhaka, Bangladesh, 7–9 January 2016; pp. 1–5. [Google Scholar]
  14. General Cable. Building Wire and Cable for Commercial and Residential Applications; General Cable: Highland Heights, KY, USA, 2012. [Google Scholar]
  15. Lee, G.-C.; Kang, S.-M.; Jung, T.-U. Permanent magnet structure design of outer rotor radial flux permanent magnet generator for reduction cogging torque with the design of experiment. In Proceedings of the International Conference on Electrical Machines and Systems, Busan, Republic of Korea, 26–29 October 2013; pp. 315–319. [Google Scholar]
  16. Arafat, M.Y.; Murshed, M.; Hasan, M.M.; Razzak, M.B. Impacts of Cogging Torque and Its Reduction for an External Rotor Permanent Magnet Alternator. In Proceedings of the 5th IEEE International Conference on Informatics, Electronics, and Vision (ICIEV), Dhaka, Bangladesh, 13–14 May 2016; pp. 1–6. [Google Scholar]
  17. Wang, T.; Wang, L.; Zhong, W.; Xu, B. Large-scale wind turbine blade design and aerodynamic analysis. Chin. Sci. Bull. 2012, 57, 466–472. [Google Scholar] [CrossRef] [Green Version]
  18. Ramachandra, T.V.; Shruti, B.V. Wind energy potential mappings in Karnataka, India, using GIS. Energy Convers. Manag. 2005, 46, 1561–1578. [Google Scholar] [CrossRef]
  19. Murshed, M.; Arafat, Y.; Razzak, M.A. Design of blades for a low-speed 400W wind turbine suitable for coastal area of Bangladesh. In Proceedings of the 3rd International Conference on Green Energy and Technology (ICGET), Dhaka, Bangladesh, 11 September 2015. [Google Scholar]
  20. Ullah, M.H.; Hoque, T.D.; Hasib, M.M.a. Current Status of Renewable Energy Sector in Bangladesh and a Proposed Grid-Connected Hybrid Renewable Energy System. Int. J. Adv. Renew. Energy Res. 2012, 1, 618–627. [Google Scholar]
  21. Padate, A. Tidal and wind energy and wind energy conversion duo. Int. J. Renew. Sustain. Energy 2013, 2, 163–166. [Google Scholar]
  22. Kubik, M.L.; Coker, P.J.; Hunt, C. Using meteorological wind data to estimate turbine generation output: A sensitivity analysis. In Proceedings of the World Renewable Energy Congress, Linkoping, Sweden, 8–13 May 2011. [Google Scholar]
  23. Balal, A.; Murshed, M. Implementation and comparison of Perturb and Observe, and Fuzzy Logic Control on Maximum Power Point Tracking (MPPT) for a Small Satellite. J. Soft Comput. Decis. Support Syst. 2021, 8, 14–18. [Google Scholar]
  24. Panofsky, H.; Dutton, J. Atmospheric Turbulence: Models and Methods for Engineering Applications; Pennsylvania State University; John Wiley and Sons: New York, NY, USA, 1984. [Google Scholar]
  25. Stevenson, R. Discourse, power, and energy conflicts: Understanding Welsh renewable energy planning policy. Environ. Plan. C Gov. Policy 2009, 27, 512–526. [Google Scholar] [CrossRef]
  26. Swofford, J.; Slattery, M. Public attitudes of wind energy in Texas: Local communities in close proximity to wind farms and their effect on decision-making. Energy Policy 2010, 38, 2508–2519. [Google Scholar] [CrossRef]
  27. Toke, D.; Breukers, S.; Wolsink, M. Wind power deployment outcomes: How can we account for the differences? Renew. Sustain. Energy Rev. 2008, 12, 1129–1147. [Google Scholar] [CrossRef]
  28. U.S. Department of Energy. 20% Increasing Wind Energy’s Contribution to U.S. Electricity Supply; U.S. Department of Energy: Washington, DC, USA, 2008.
  29. Warren, C.R.; Birnie, R.V. Re-powering Scotland: Wind farms and the “energy or environment” debate. Scott. Geogr. J. 2009, 125, 97–126. [Google Scholar] [CrossRef]
  30. Warren, C.R.; Lumsden, C.; O’Dowd, S.; Birnie, R.V. ‘Green on Green’: Public perceptions of wind power in Scotland and Ireland. J. Environ. Plan. Manag. 2005, 48, 853–875. [Google Scholar] [CrossRef]
  31. Warren, C.R.; McFayden, M. Does community ownership affect public attitudes to wind energy? A case study from southwest Scotland. Land Use Policy 2010, 27, 204–213. [Google Scholar] [CrossRef]
  32. Wilson, E.J.; Stephens, J.C. Wind Deployment in the United States: States, Resources, Policy, and Discourse. Environ. Sci. Technol. 2009, 43, 9063–9070. [Google Scholar] [CrossRef] [Green Version]
  33. Wolsink, M. Wind power and the NIMBY-myth: Institutional capacity and the limited significance of public support. Renew. Energy 2000, 21, 49–64. [Google Scholar] [CrossRef]
  34. Mohamed, M.H.; Ali, A.M.; Hafiz, A.A. CFD analysis for H-rotor Darrieus turbine as a low-speed wind energy converter. Int. J. Eng. Sci. Technol. 2015, 18, 1–13. [Google Scholar] [CrossRef] [Green Version]
  35. Raghunatha, A. Direct-Drive Permanent Magnet Synchronous Generator Design for Hydrokinetic Energy Extraction. Master’s Thesis, Missouri University of Science and Technology, Rolla, MO, USA, 2013; pp. 19–60. [Google Scholar]
  36. Map of the Month: Wind Energy in Texas. Available online: https://nri.tamu.edu/blog/2017/december/map-of-the-month-wind-energy-in-texas (accessed on 4 April 2023).
  37. Alaskari, M.; Abdullah, O.; Majeed, M.H. Analysis of Wind Turbine Using QBlade Software. IOP Conf. Ser. Mater. Sci. Eng. 2019, 518, 032020. [Google Scholar] [CrossRef]
  38. Aguirre, B.; Dynes, R.R.; Kendra, J.; Connell, R. Institutional Resilience and Disaster Planning for New Hazards: Insights from Hospitals. J. Homel. Secur. Emerg. Manag. 2005, 2, 1–17. [Google Scholar] [CrossRef]
  39. Allenby, B.; Fink, J. Toward Inherently Secure and Resilient Societies. Science 2005, 309, 1034–1036. [Google Scholar] [CrossRef] [Green Version]
  40. Berke, P.R.; Campanella, T.J. Planning for post disaster resiliency. Ann. Am. Acad. Political Soc. Sci. 2006, 604, 192–207. [Google Scholar] [CrossRef] [Green Version]
  41. Borg, I.; Lingoes, J.C. Multidimensional Similarity Structure Analysis; Springer: New York, NY, USA, 1987. [Google Scholar]
  42. Bradley, D.; Grainger, A. Social resilience as a controlling influence on desertification in Senegal. Land Degrad. Dev. 2004, 15, 451–470. [Google Scholar] [CrossRef]
  43. Brooks, N.; Adger, N.W.; Kelly, M.P. The determinants of vulnerability and adaptive capacity at the national level and the implications for adaptation. Glob. Environ. Change A 2005, 15, 733–752. [Google Scholar] [CrossRef]
  44. Bruneau, M.; Chang, S.E.; Eguchi, R.T.; Lee, G.C.; O’Rourke, T.D.; Reinhorn, A.M.; Shinozuka, M.; Tierney, K.; Wallace, W.A.; Von Winterfeldt, D. A Framework to Quantitatively Assess and Enhance the Seismic Resilience of Communities. Earthq. Spectra 2003, 19, 733–752. [Google Scholar] [CrossRef] [Green Version]
  45. Buckle, P. Assessing social resilience. In Disaster Resilience: An Integrated Approach; Paton, D., Johnston, D., Eds.; Charles C Thomas: Springfield, IL, USA, 2006; pp. 88–103. [Google Scholar]
  46. Alegria, E.; Brown, T.; Minear, E.; Lasseter, R.H. CERTS microgrid demonstration with large-scale energy storage and renewable generation. IEEE Trans Smart Grid 2014, 5, 937–943. [Google Scholar] [CrossRef]
  47. Panora, R.; Gehret, J.; Furse, M.; Lasseter, R.H. Real-world Performance of a CERTS microgrid in Manhattan. IEEE Trans. Sustain. Energy 2014, 5, 1356–1360. [Google Scholar] [CrossRef]
  48. Parhizi, S.; Lotfi, H.; Khodaei, A.; Bahramirad, S. State of the Art in Research on Microgrids: A Review. IEEE Access 2015, 3, 890–925. [Google Scholar] [CrossRef]
  49. Akorede, M.F.; Hizam, H.; Pouresmaeil, E. Distributed energy resources and benefits to the environment. Renew. Sustain. Energy Rev. 2010, 14, 724–734. [Google Scholar] [CrossRef]
  50. Bayindir, R.; Hossain, E.; Kabalci, E.; Perez, R. A comprehensive study on microgrid technology. Int. J. Renew. Energy Res. 2014, 4, 1094–1107. [Google Scholar]
  51. Riayatsyah, T.M.I.; Geumpana, T.A.; Fattah, I.M.R.; Mahlia, T.M.I. Techno-Economic Analysis of Hybrid Diesel Generators and Renewable Energy for a Remote Island in the Indian Ocean Using HOMER Pro. Sustainability 2022, 14, 9846. [Google Scholar] [CrossRef]
  52. King, C.W.; Gülen, G.; Cohen, S.M.; Nuñez-Lopez, V. The system-wide economics of a carbon dioxide capture, utilization, and storage network: Texas Gulf Coast with pure CO2-EOR flood. Environ. Res. Lett. 2013, 8, 034030. [Google Scholar] [CrossRef]
  53. Subburaj, A.S.; Kondur, P.; Bayne, S.B.; Giesselmann, M.G.; Harral, M.A. Analysis and Review of Grid Connected Battery in Wind Applications. In Proceedings of the 2014 Sixth Annual IEEE Green Technologies Conference, Corpus Christi, TX, USA, 3–4 April 2014. [Google Scholar]
  54. Chamana, M.; Schmitt, K.E.K.; Bhatta, R.; Liyanage, S.; Osman, I.; Murshed, M.; Bayne, S.; MacFie, J. Buildings Participation in Resilience Enhancement of Community Microgrids: Synergy between Microgrid and Building Management Systems. IEEE Access 2022, 10, 100922–100938. [Google Scholar] [CrossRef]
  55. Arafat, Y.; Murshed, M.; Razzak, M.A. Design and analysis of an outer rotor permanent magnet alternator for a low-speed wind turbine. In Proceedings of the 3rd International Conference on Green Energy and Technology (ICGET), Dhaka, Bangladesh, 11 September 2015; pp. 1–7. [Google Scholar]
  56. Marqusee, J.; Becker, W.; Ericson, S. Resilience and economics of microgrids with PV, battery storage, and networked diesel generators. Adv. Appl. Energy 2021, 3, 25. [Google Scholar] [CrossRef]
  57. Shaltout, M.L.; Yan, Z.; Palejiya, D.; Chen, D. Tradeoff analysis of energy harvesting and noise emission for distributed wind turbines. Sustain. Energy Technol. Assess. 2015, 10, 12–21. [Google Scholar] [CrossRef]
  58. Bhatta, R.; Shrestha, R.; Negri, C.; Schmitt, K.; Murshed, M.; Chamana, M.; Illham, O.; Bayne, S. Feasibility of a Real-world Test Microgrid Facility to Provide Economic and Resiliency Benefits in Extreme Weather Conditions. In Proceedings of the 2022 IEEE Power & Energy Society Innovative Smart Grid Technologies Conference (ISGT), Novi Sad, Serbia, 10–12 October 2022. [Google Scholar] [CrossRef]
  59. U.S. Department of Energy’s Office of Energy Efficiency and Renewable Energy. In Land-Based Wind Market Report, 2022nd ed.; U.S. Department of Energy: Washington, DC, USA, 2022.
Figure 1. Wind map of Lubbock, TX.
Energies 16 05778 g001
Figure 2. Proportional causes of outages.
Energies 16 05778 g002
Figure 3. Schematic of a standard grid-connected microgrid.
Energies 16 05778 g003
Figure 4. Annual wind speed data and wind direction of Lubbock, TX.
Energies 16 05778 g004
Figure 5. Collected wind speed data histogram for Lubbock, TX.
Energies 16 05778 g005
Figure 6. Relationship between air density and temperature.
Energies 16 05778 g006
Figure 7. Airfoil pressure distribution.
Energies 16 05778 g007
Figure 8. Extrapolated lift (Cl), drag (Cd), and moment (Cm) coefficients.
Energies 16 05778 g008
Figure 9. Blade chord, thickness, and twist properties.
Energies 16 05778 g009
Figure 10. Design of turbine blades with chord and twist properties.
Energies 16 05778 g010
Figure 11. A 3D presentation of designed permanent magnet alternator.
Energies 16 05778 g011
Figure 12. Load profile required for economic and resiliency benefit analysis.
Energies 16 05778 g012
Figure 13. Monthly peak demand curve.
Energies 16 05778 g013
Figure 14. System architectures used to determine the economic benefits and resiliency period.
Energies 16 05778 g014
Figure 15. Time series data of proposed grid-connected DER system.
Energies 16 05778 g015
Figure 16. Battery SoC during outage.
Energies 16 05778 g016
Figure 17. Power generated by distributed wind turbine during outage.
Energies 16 05778 g017
Figure 18. Cumulative cash flow over the project’s lifetime.
Energies 16 05778 g018
Table 1. Major parameters of the designed PMA.
ParametersValue
Rated Power (Pout)6500 W
Reference Speed (N)100 rpm
Voltage (V)24 V
Permanent Magnet Depth (LPM)10.0 mm
Stator Slots Amount (Q)54
Poles (P)34
Air-Gap (g)1.0 mm
Stator Diameter (Outer) (Sout)208 mm
Stator Diameter (Inner) (Sin)92 mm
Stator Length (L)61 mm
Rotor Diameter (Outer) (Rout)292 mm
Rotor Diameter (Inner) (Rin)270 mm
Table 2. Distributed energy resource summary.
Distributed Wind TurbineBatterySystem Converter
QuantityValueUnitsQuantityValueUnitsQuantityValueUnits
Total Rated Capacity6kWEnergy In2965kWh/yrHours of Operation8374h/yr
Mean Output2.83kWEnergy Out2865kWh/yrEnergy Out23,848kWh/yr
Capacity Factor47.1%Storage Depletion18.8kWh/yrEnergy In24,586kWh/yr
Total Production24,757kWh/yrLosses119kWh/yrLosses738kWh/yr
Wind Penetration67.8%Annual Throughput2924kWh/yrCapacity8kW
Hours of Operation8253h/yrAutonomy4.63hrMean Output2.72kW
Levelized Cost0.035$/kWhExpected Life17yrMaximum Output8kW
Table 3. Detailed techno-economic comparisons of systems.
EconomicsUnitsGrid OnlyGrid and DER
Discount Rate%3%3%
Annual Inflation%3%3%
Project Life TimeYears2525
Total Net Present Value$$83,795.64$64,985.94
Levelized Cost of Energy$/kWh$0.09$0.0667
Cost of Energy Reduction%023.00%
Capital Investment$0$30,300
Replacement$0$7100
Salvage$0$7092
Operation and Maintenance$$83,795.64$34,678
Emission Penalty Rate$/ton$12/ton$12/ton
Emission Penalty$$276$114
Capital Return Rate%03.82%
Simple Payback PeriodYears015.4 years
Table 4. Emission analysis comparison.
ElementsValue (Grid Only)Value (Grid + 6 kW DHAWT)Units
Carbon Dioxide23,0689543kg/yr
Sulfur Dioxide10041.4kg/yr
Nitrogen Oxides48.920.2kg/yr
Disclaimer/Publisher’s Note: The statements, opinions and data contained in all publications are solely those of the individual author(s) and contributor(s) and not of MDPI and/or the editor(s). MDPI and/or the editor(s) disclaim responsibility for any injury to people or property resulting from any ideas, methods, instructions or products referred to in the content.

