Article

Analysis of Natural Pollution Accumulation Characteristics of Insulators for Railroads in High-Altitude Environment

Xuefeng Mountain Energy Equipment Safety National Observation and Research Station, Chongqing University, Chongqing 400044, China
*
Author to whom correspondence should be addressed.
Energies 2023, 16(15), 5738; https://doi.org/10.3390/en16155738
Submission received: 4 July 2023 / Revised: 26 July 2023 / Accepted: 30 July 2023 / Published: 1 August 2023

Abstract

:
Railway system insulators are affected by pollution, altitude, and other environmental situations during operation, which causes reduced electrical performance or even flashover accidents. These factors threaten the safety of railway operations in high-altitude areas. However, the natural contamination characteristics of a railroad in a plateau area is still unclear. In this study, a natural pollution accumulation test for railway insulators in a high-altitude area was carried out, and the distribution rules of nonsoluble deposit density (NSDD), equivalent salt deposit density (ESDD), NSDD/ESDD ratio, and nonuniformity (T/B) of the pollution distribution of the tested insulators were calculated. Meanwhile, the chemical compositions of the pollution from different test sites were analyzed. The differences of pollution accumulation between railway insulators and suspended insulators of a power system and the influencing factors were compared and analyzed by combining with a numerical simulation. The results show that the pollution level of railroad insulators is mainly distributed in level b and above. A pollution sample is mainly composed of sodium chloride, while the NSDD/ESDD ratio of pollution is mostly distributed from 0 to 5, with T/B value ranges from 1/0.62 to 1/1.76. The amount of insulator contamination is influenced by the location inside and outside the tunnel. Additionally, the pollution amount is influenced by the structure and type of insulators. Finally, this paper studies the creepage distance and structural height required by railway insulators in a plateau area according to the natural pollution accumulation characteristics of railway insulators, which can provide a reference for a railway electrical external insulation configuration in a high-altitude area.

1. Introduction

The environmental characteristics of the plateau area is windy, sandy, little rainfall and thin air. Therefore, rainwater is less likely to wash off pollution on an insulator surface. During operation, the dirty layer on the surface of an insulator is wet, forming a conductive layer. With the formation of a dry zone, a local arc will be generated. The local arc develops along the surface of the insulator until it spans the entire surface of the insulator to form a flashover. In a high-altitude area, the combined effect of low air pressure and pollution on insulator strings significantly reduces the pollution flashover voltage. With the development of western China, the railroad in plateau environments is facing a long-term safe operation test, which means that railway insulators are facing a continuous pollution accumulation situation. Thus, it is important to research the natural pollution characteristics of railway insulators in high-altitude areas to achieve a reasonable external insulation configuration.
In order to discover the insulator pollution accumulation characteristics and their influencing factors, researchers and institutions around the world have carried out a large number of studies through fluid numerical simulation and wind tunnel tests. Zhang et al. [1,2] established a fluid field simulation model of insulators and conducted a wind tunnel experiment; furthermore, the equivalent relationship between pollution volume fraction results and wind tunnel test results was verified. Three results show that wind speed and wind direction have a significant effect on the pollution distribution on the top and bottom surfaces of an insulator. Ravelomanantsoa et al. [3] built a test setup to simulate winter conditions and discussed the effects of wind and AC voltages on the variation in the accumulation rate of the salt deposit density (SDD) of insulators. Qiao et al. [4] simulated the pollution accumulation process of insulators by CFD software Ansys 15.0 and studied the pollution distribution of insulators with different shapes. Huang et al. [5] explored the law of pollution accumulation on the surface of insulators by combining fluid dynamics calculation and experimentation. The results showed that when the wind speed was 3–7 m/s, the boundary layer separation existed for pollution particles within a 1–60 μm particle size, while the increase in wind speed and particle size of pollution would aggravate the nonuniformity of pollution accumulation. Wu et al. [6] simulated the contamination depositing mechanism of an insulator under a high-speed airflow condition, and the results showed that the higher the air velocity, the greater the particle diameter, and the more serious the contamination depositing.
Insulator configuration can be determined according to the pollution accumulation characteristics or pollution flashover voltage of insulators. Therefore, the natural pollution accumulation characteristics of insulators can accurately reflect the law of pollution distribution variation when insulators are set in a natural environment. Zhang et al. [7] compared the accumulation characteristics of typical insulators with numerical simulations and 8 months of natural accumulation tests to verify the comparability of the simulation results and test results. Jiang et al. [8] conducted a 5-year natural contamination test on transmission lines. The results showed that rainfall intensity has influence on the equivalent salt deposit density (ESDD) and nonsoluble deposit density (NSDD) on the surface of insulators. Zhang et al. [9,10] conducted field contamination experiments of transmission lines and calculated the ratio of the ESDD and NSDD of the top surface and bottom surface of composite insulators. The results showed that the component of contamination, nonuniformity degree of pollution, and electric field distribution caused a difference in pollution flashover voltage. Qiao et al. [11] applied grey theory to propose a pollution-level prediction model based on natural pollution tests. Sima et al. [12] performed natural pollution tests and studied the effect of the nonuniform pollution distribution on the withstand voltage of insulators. The result showed that ESDD and pollution nonuniformity (T/B) independently affect withstand voltage, and further analyzed the mechanism. Zhang et al. [13] simulated a DC porcelain insulator string model and discovered that the pollution on the lower surface of insulators influenced temperature rise obviously when the pollution was distributed unevenly on insulator surfaces. Dong et al. [14] established a mathematical model of pollution flashover voltage, and predicted the flashover voltage of insulators with a different shape and leakage distance. Qiu et al. [15] performed an AC artificial pollution flashover test and discovered that increasing shed spacing can improve the insulator pollution flashover characteristics.
The current research on insulator pollution characteristics is mainly focused on insulators used for transmission lines. Since the structure, suspension height, and operating environment of railroad insulators are very different from those of grid line insulators, there are a few studies focused on the natural pollution accumulation characteristics of rail insulators in a plateau environment. Sun et al. [16] experimented with rail insulators in a high-speed wind tunnel and verified the results by numerical simulation. The results showed that the pollution amount on the windward and leeward sides of an insulator was different. Zhao et al. [17] studied the influence of a partial arc on the electric field distribution along a railroad insulator string, and the results showed that the electric field was of highest intensity at the high-voltage end. Wang et al. [18] used a multiphysical field software that simulated the natural pollution accumulation characteristics of a rail insulator, and the research showed that the deposition quantity was positively related to wind speed. Zhang et al. [19] simulated rail insulators and discussed the deposition of high-speed and low-speed airflow conditions. The results showed that the incoming airflow angle affected the velocity of contamination on rail top insulators.
In summary, domestic and foreign research on the accumulation characteristics of insulators is mainly conducted through fluid simulation, artificial pollution test, and pollution flashover experiments for transmission line insulators, which were set in atmospheric pressure areas. In order to study the accumulation characteristics of railroad insulators in the plateau area, this paper first sampled the pollution of insulators along the railway traction power supply facilities in the Qinghai–Tibet Plateau, and then conducted a natural pollution test. The NSDD, ESDD, NSDD/ESDD ratio, and pollution nonuniformity were calculated. At the same time, composition tests were carried out for the pollution samples. Then, this paper further analyzes and compares the railway insulator pollution characteristics. Finally, this paper provides suggestions for an electrical external insulation design.

2. Test Methods for Insulator’s Natural Contamination

2.1. Natural Pollution Collection Method of Insulators

In order to ensure the accuracy of natural contamination collection, it is very important to unify and standardize the workflow of on-site contamination collection. Dirt may fall off or may be missing due to contact while removing insulators from the railroad network when the traditional brushing method is used. Through several verification tests, the following sampling methods for the insulator natural pollution are determined.
  • Take photos of the sampling insulator, and record the location, time, and person taking the sample.
  • Make sure to wear disposable gloves while using the special sampling cloth to take a sample of the upper and lower surface of the insulator, respectively. Take the sampling cloth and wipe all the deposition on the upper surface (or lower surface), and wipe it twice in the same way with a new sampling cloth. During the procedure, avoid wiping the insulator steel cap and touching the insulator surface without a cloth.
  • Put the disposable gloves and dirty sampling cloth in a special sealed bag and transport them back to the laboratory for further testing.

2.2. Natural Pollution Test Method for Insulators

According to IEC 60815 and IEC 60507 regulations [20,21], the sample test cloth was immersed in a beaker containing 300 mL of deionized water first, and fully stirred at regular time intervals. After a 24 h full immersion, the solution was filtered using a filter paper. The ESDD of the insulator can be calculated by the following equation after measuring the conductivity of the solution:
E S D D = S a × V A
where ESDD is the equivalent salt deposit density, in mg/cm2; V is the volume of the solution, in cm3; A is the insulator surface area, in cm2; and Sa is the salinity of the solution, in kg/m3.
The insoluble matter in the solution was obtained through filtration with a paper, followed by drying and weighing. The NSDD can be calculated by
N S D D = W A
where NSDD is the nonsoluble deposit density, in mg/cm2, and W is the mass of insoluble matter after dried, in mg.

2.3. Test Method for Natural Pollution Components of Insulators

An ionic composition test for soluble contaminates was conducted on an ion chromatograph. Different eluent solutions were used for testing anions and cations to achieve the best separation results. First, a standard solution of known concentration was prepared and injected into the ion chromatograph to obtain the standard chromatogram and calibration curve for each ion. The solution of the contamination to be measured was then injected into the chromatograph for measurement. After the analysis, the ion composition and solution concentration of the contaminated solution were obtained from the ion chromatograph. Finally, compound pairing was performed based on the molar mass relationship, as well as the mass fraction and solution pH value of the solution for the anions and cations.

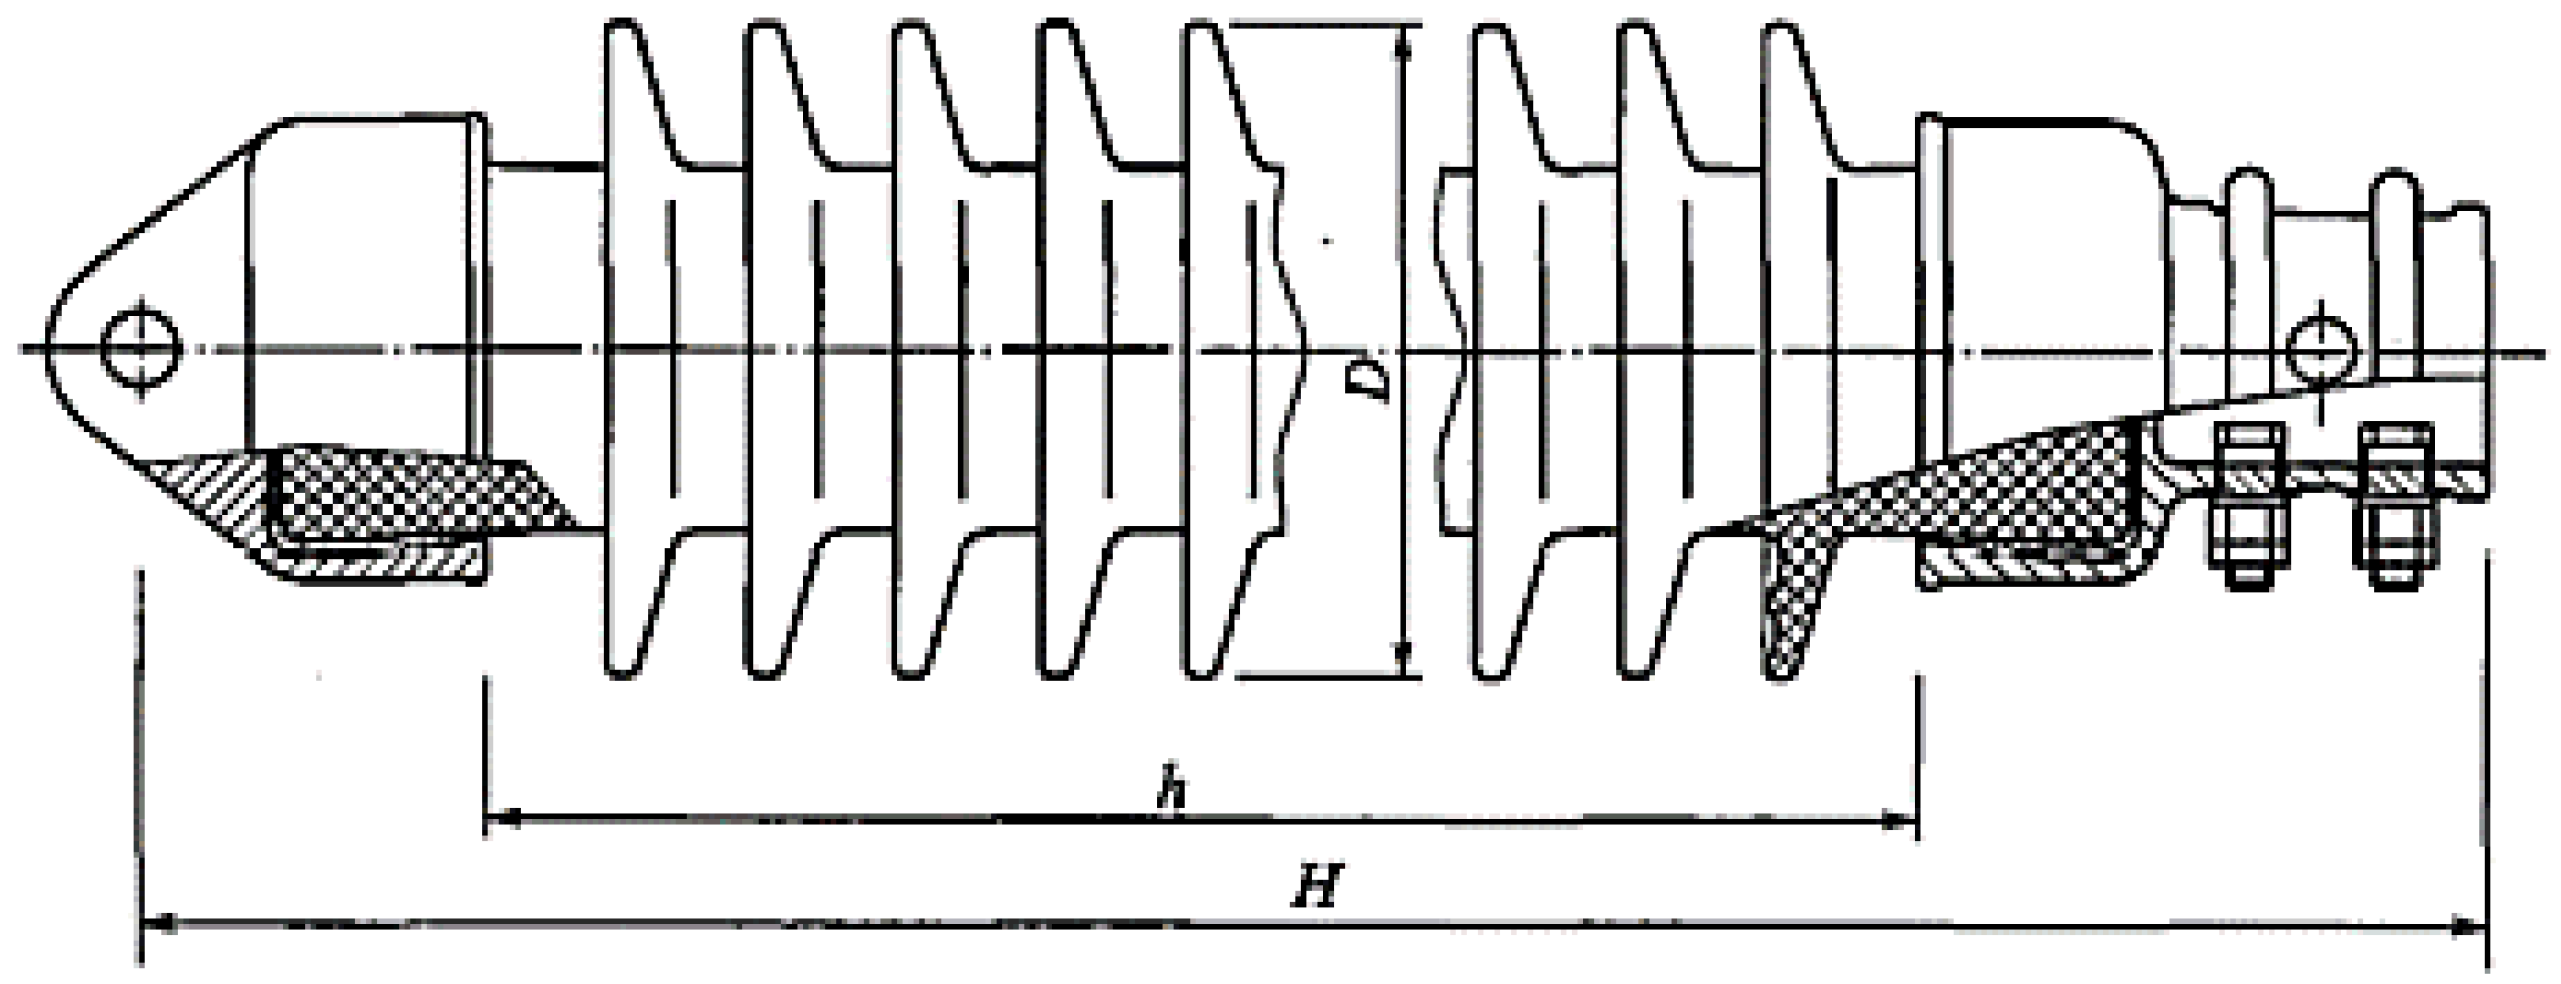
2.4. Structural Parameters of Test Insulators

A structural diagram and parameters of the railroad insulators in the plateau area involved in the natural accumulation test are shown in Figure 1 and Table 1 accordingly. The QBG-25/16-type insulator is a railroad wrist arm porcelain insulator. The altitude range of towers where the insulators are suspended is 3000~4500 m above sea level.

3. Pollution Testing Results

3.1. Natural Pollution Test Results

Using the above test procedure, 152 railroad insulator pollution accumulation sampling data were collected from 17 railroad line sections and 50 towers. The ESDD and NSDD results of each insulator sample are shown in Figure 2. The contamination levels are calibrated in Figure 2 following the IEC 60815 standard [20]. From level a to level e, the pollution severity increases gradually. Figure 3 shows the percentage of ESDD and NSDD values within each value interval at every sampling location.
It can be seen in Figure 2 and Figure 3 that
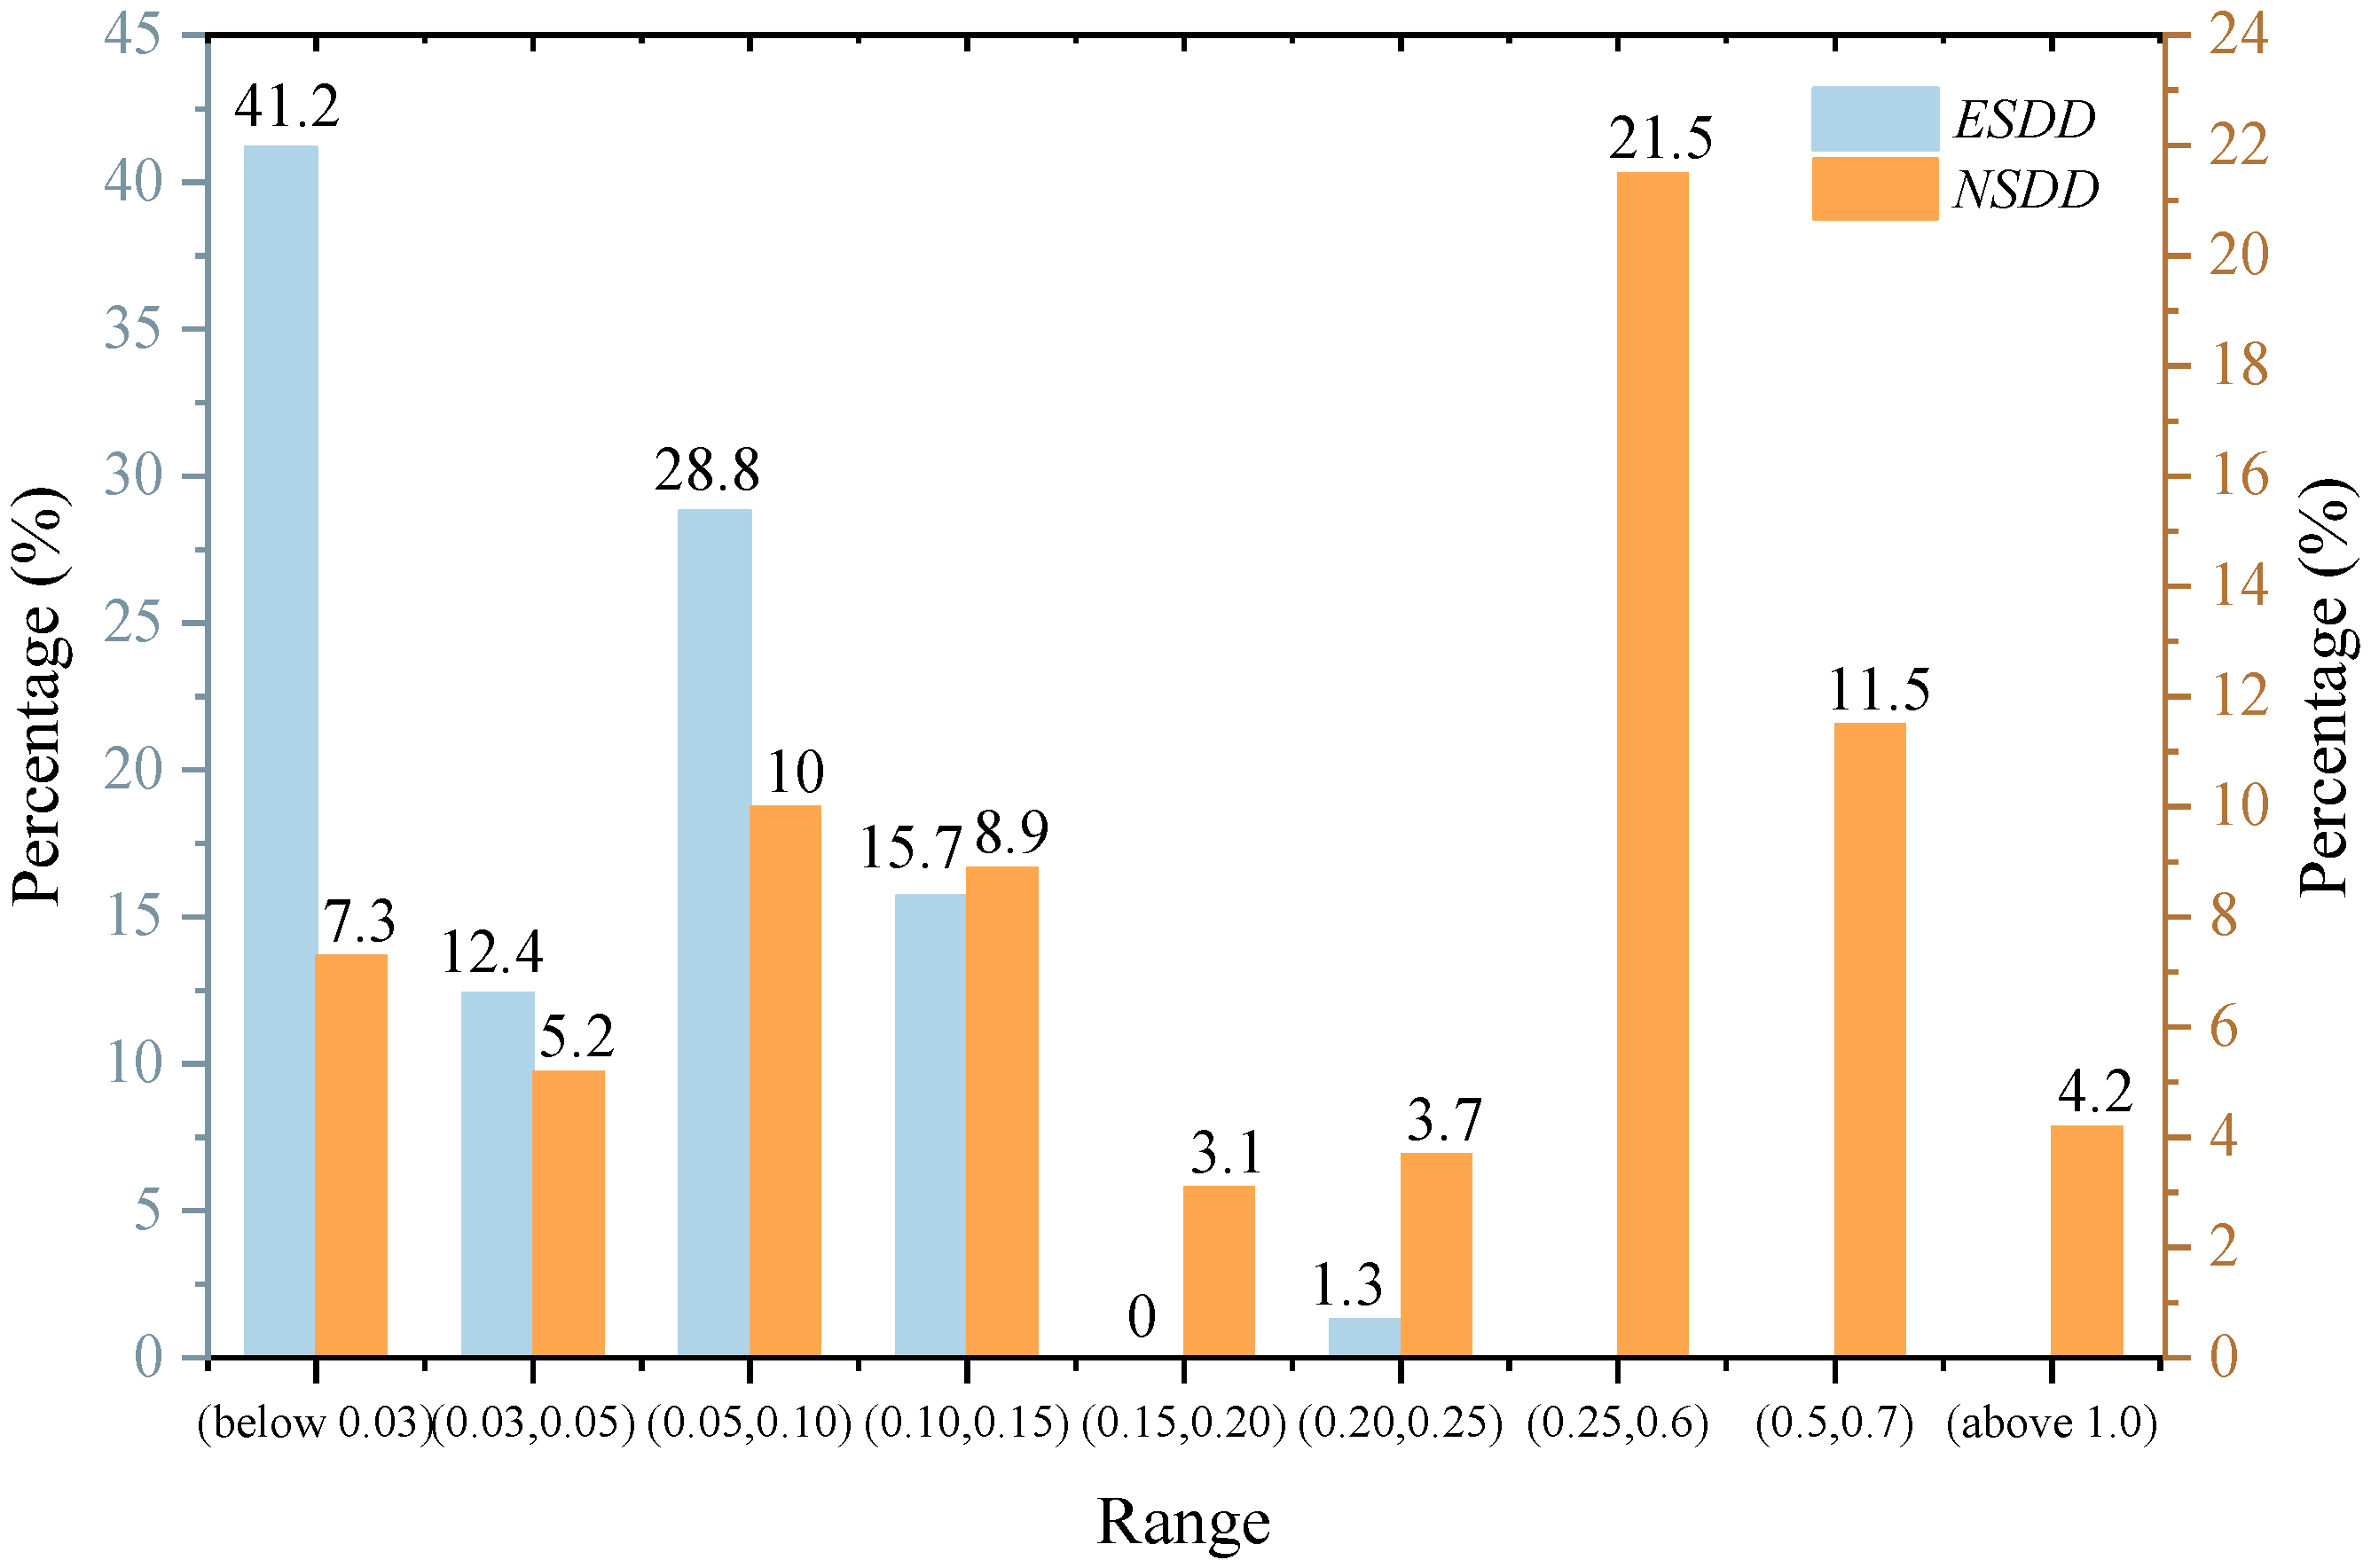
  • The ESDD value range of tested insulators is 0.003–0.220 mg/cm2, the average value is 0.053 mg/cm2, and the 50% median value is 0.044 mg/cm2.
  • The NSDD value range of tested insulators is 0.006–4.635 mg/cm2, the average value is 0.427 mg/cm2, and the 50% median value is 0.248 mg/cm2.
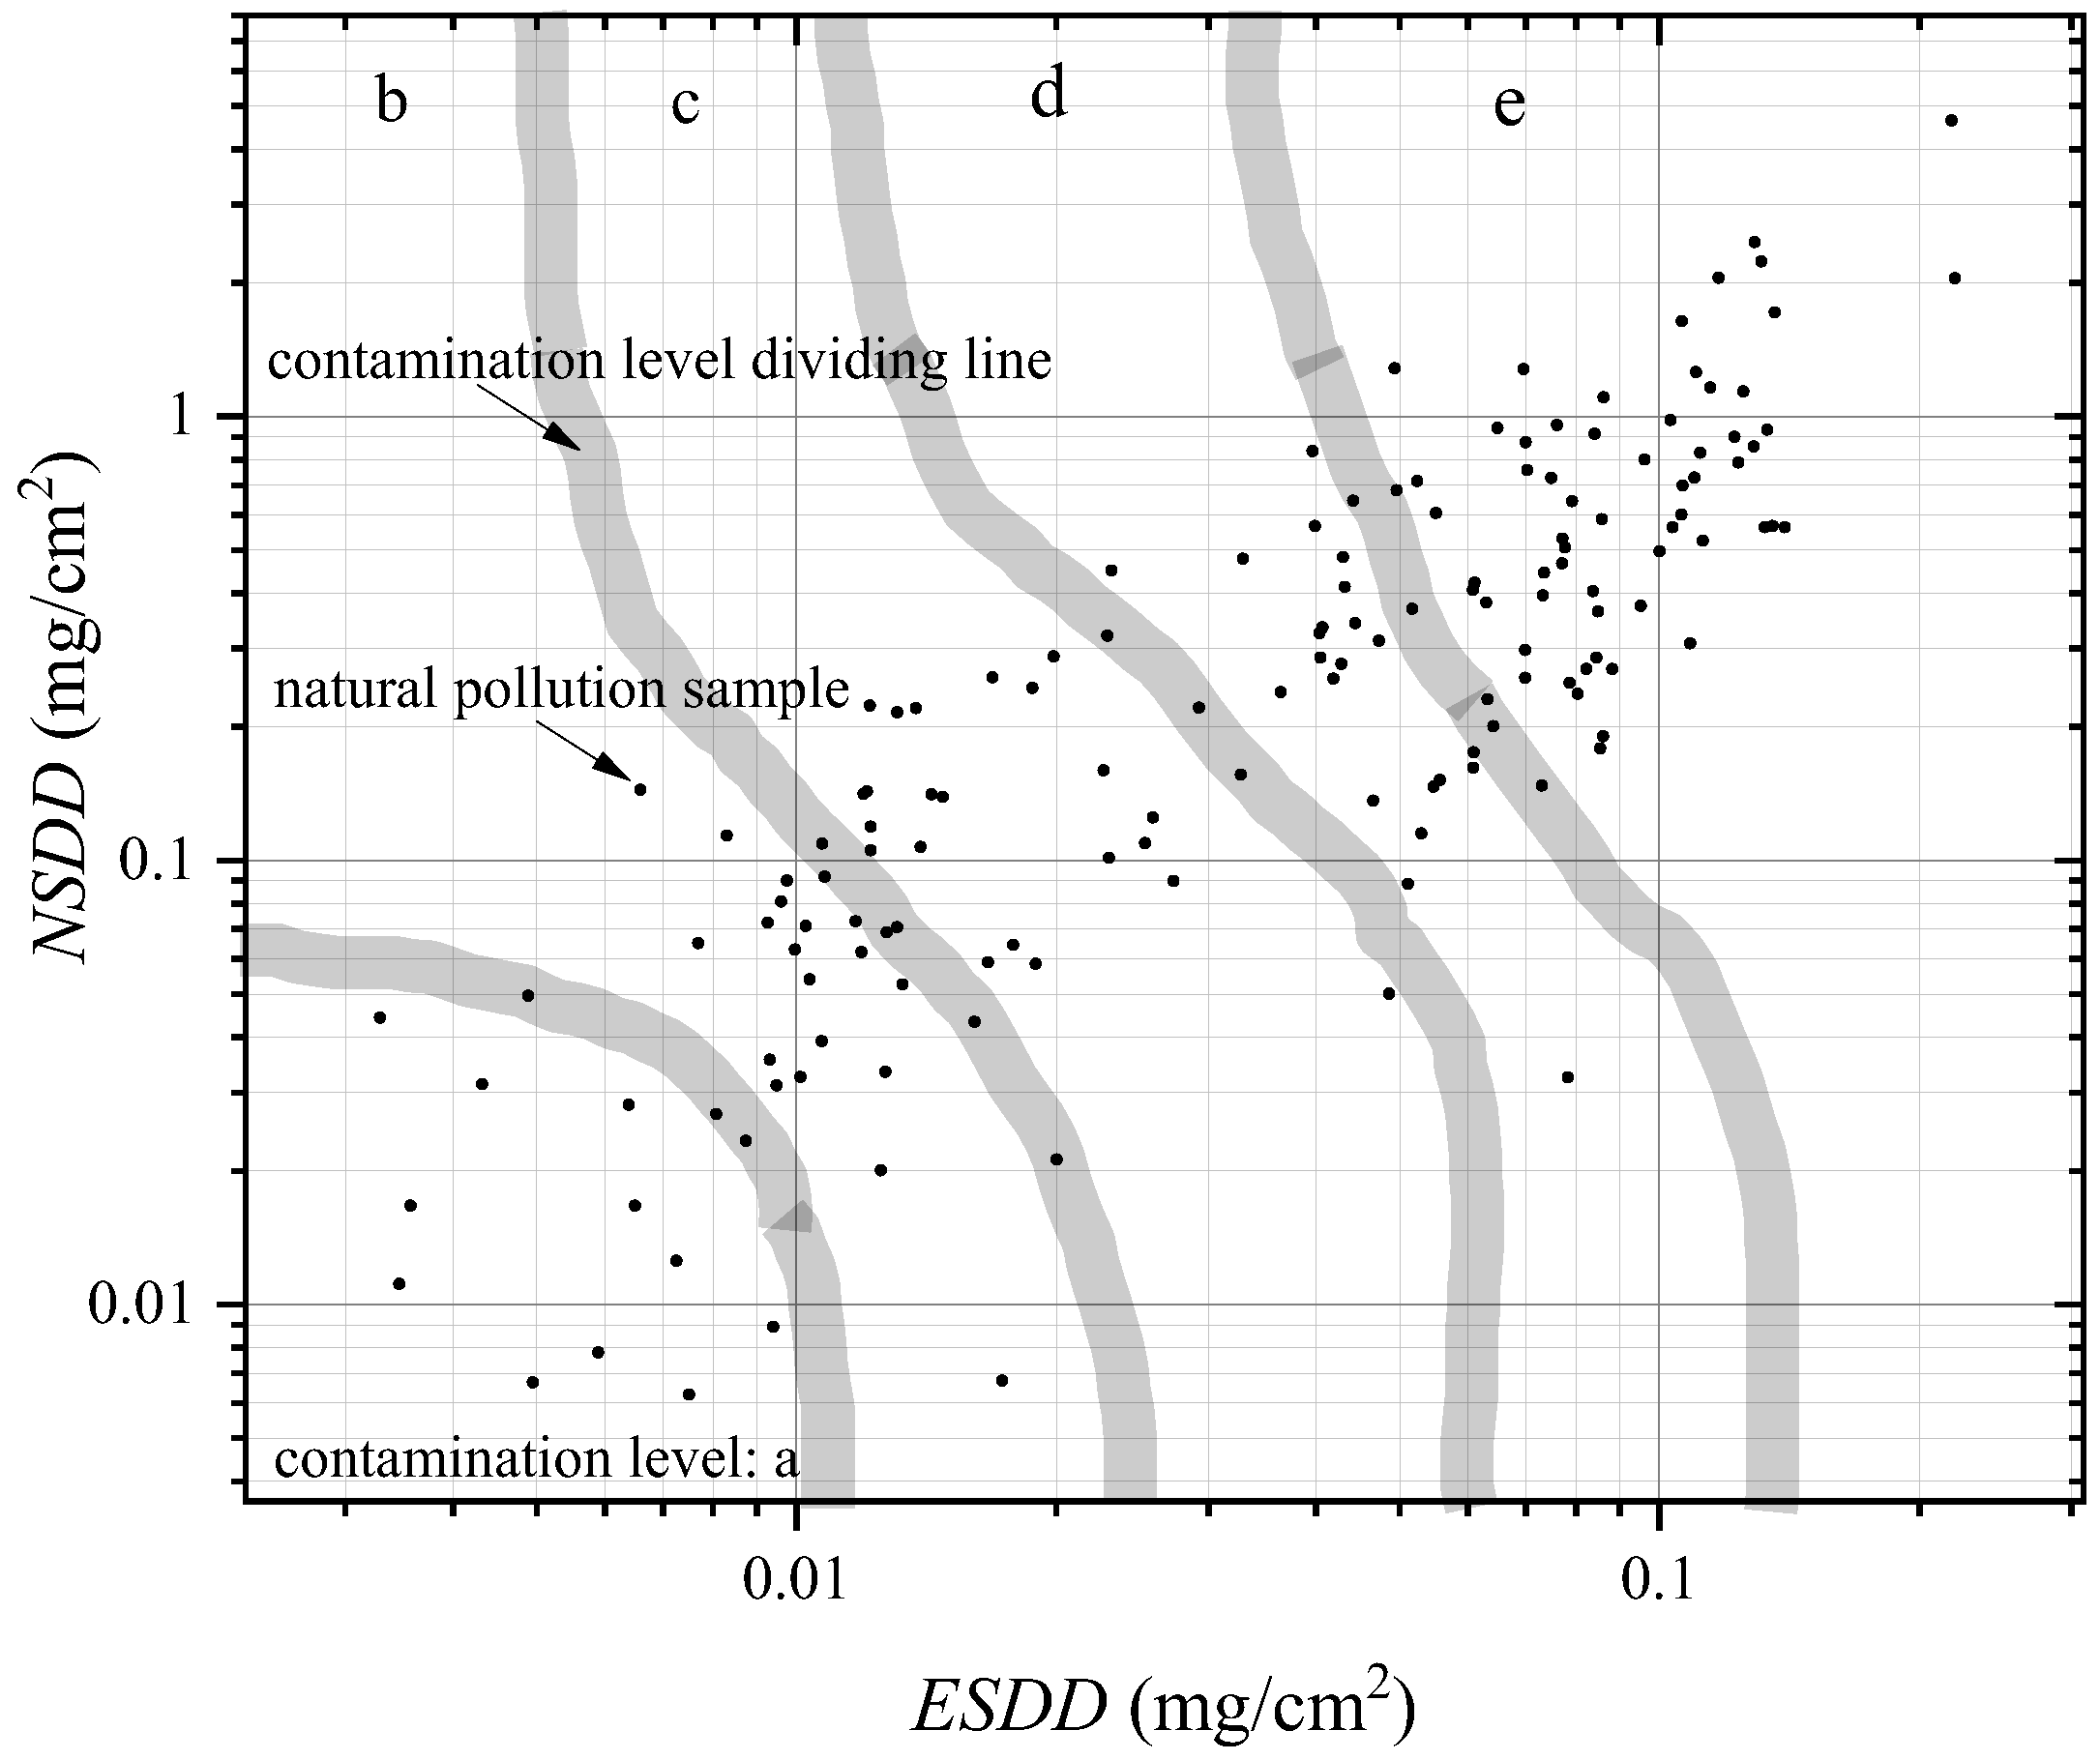
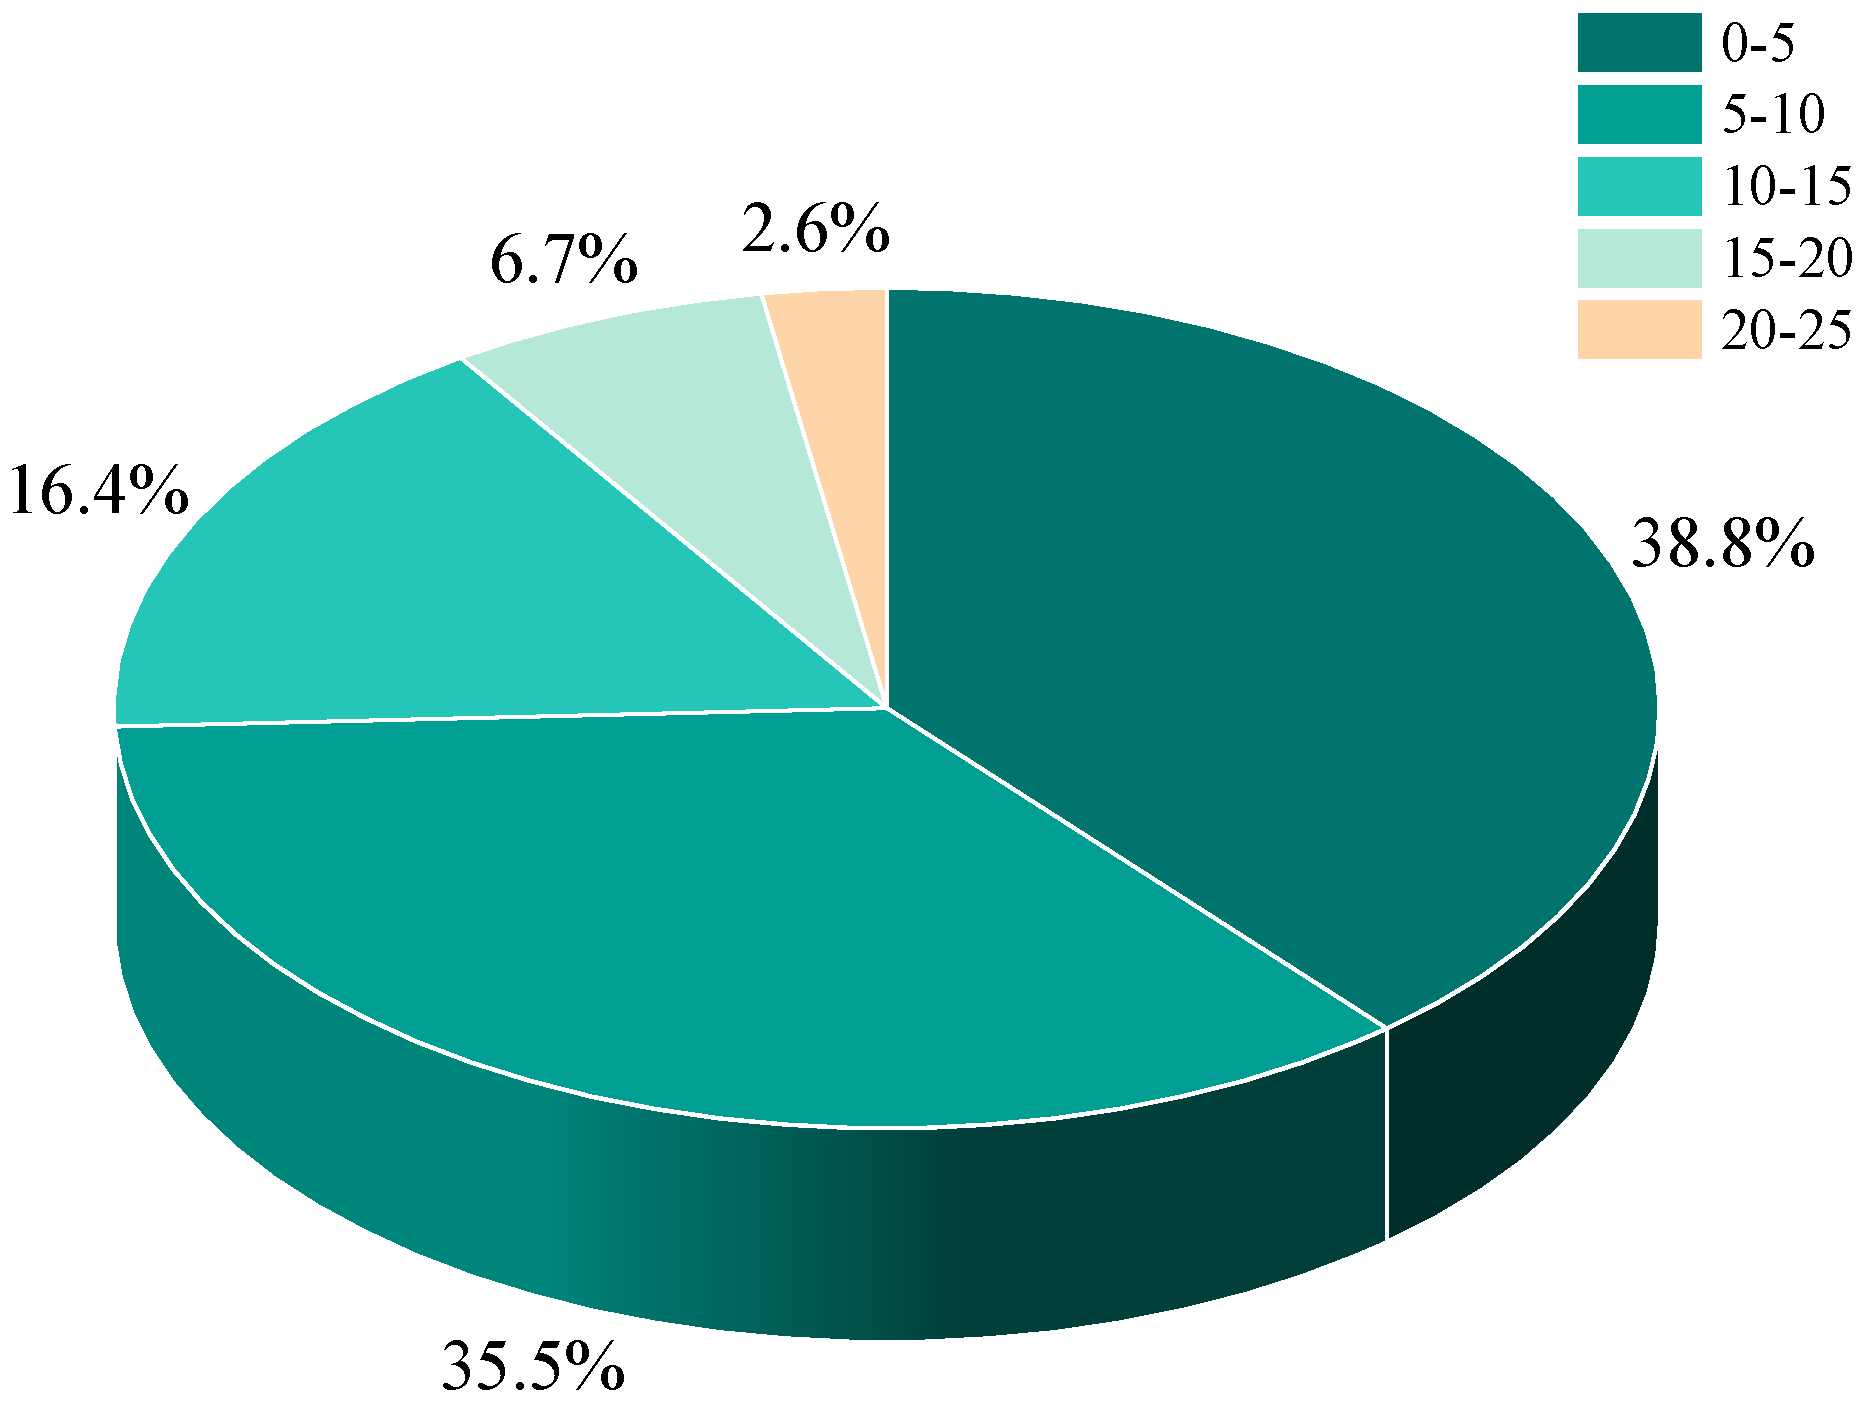
  • The insulator pollution contamination levels are distributed as follows: level a—5.3%, level b—41.7%, level c—26.8%, level d—8.9%, and level e—17.9%.
  • Among the statistical results of ESDD and NSDD at the sampling site, the largest proportion of ESDD is below 0.03 mg/cm2 (41.2%), and the largest proportion of NSDD is from 0.25 to 0.6 mg/cm2 (21.5%).

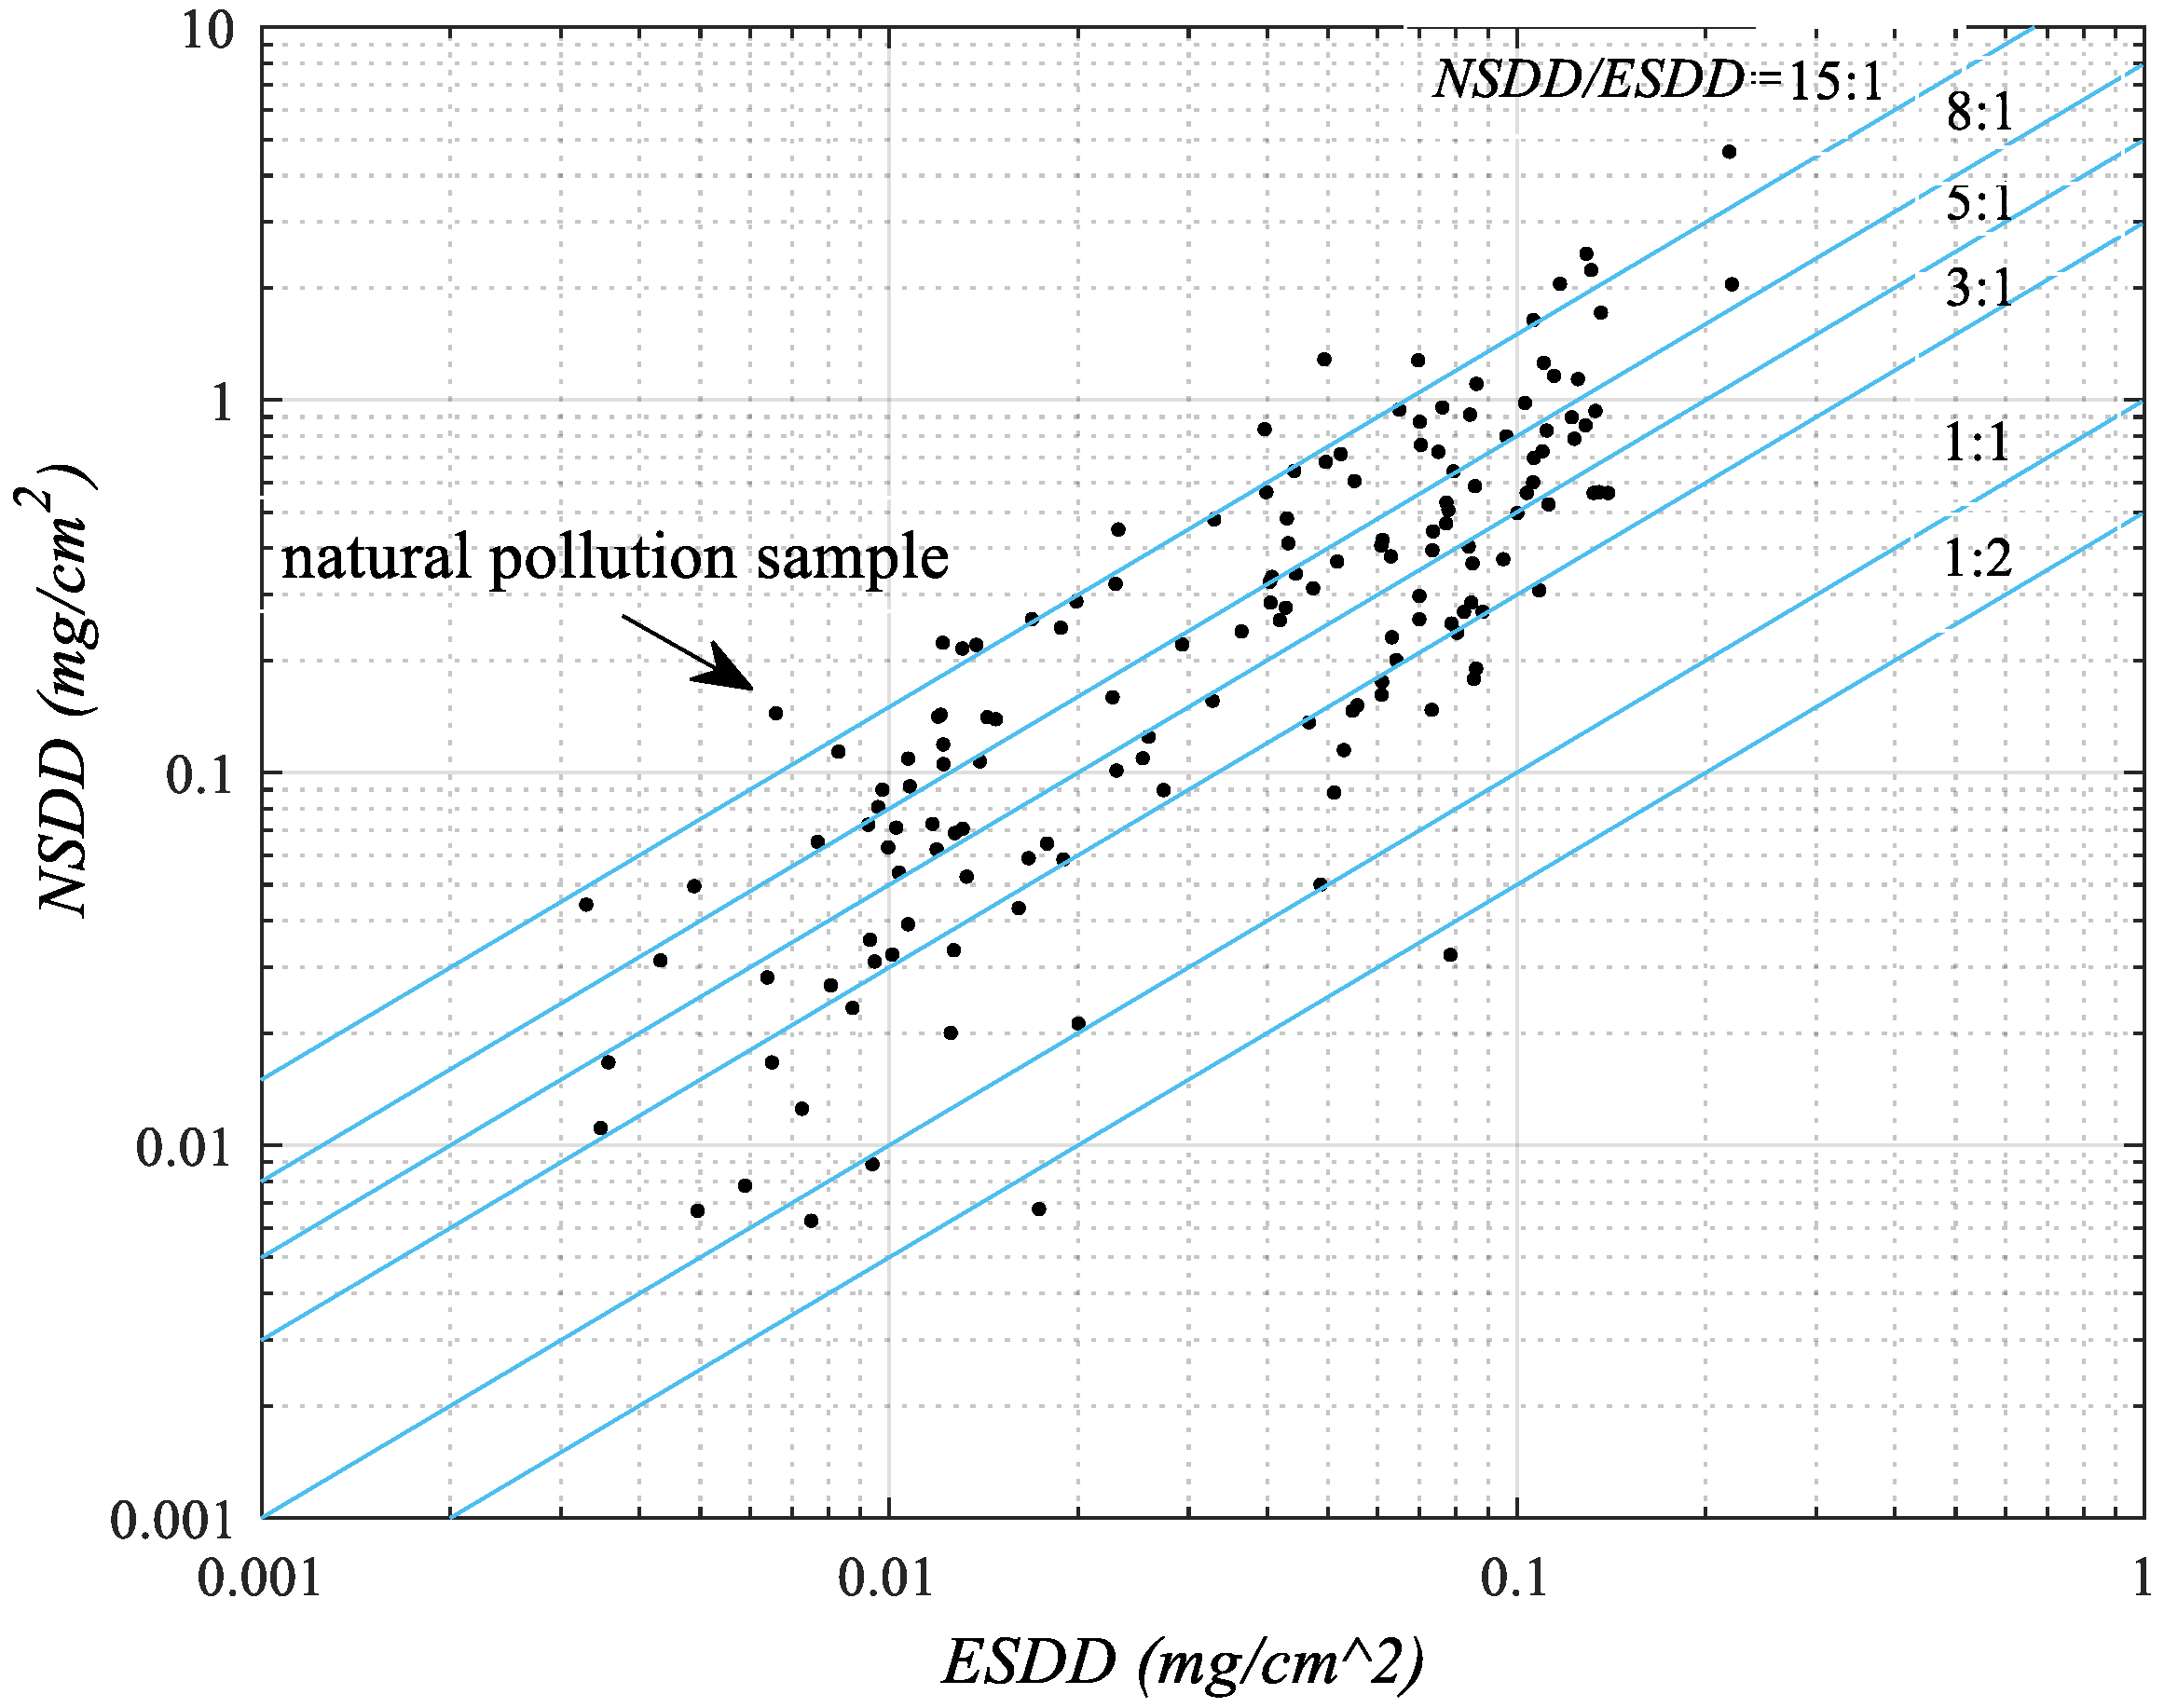
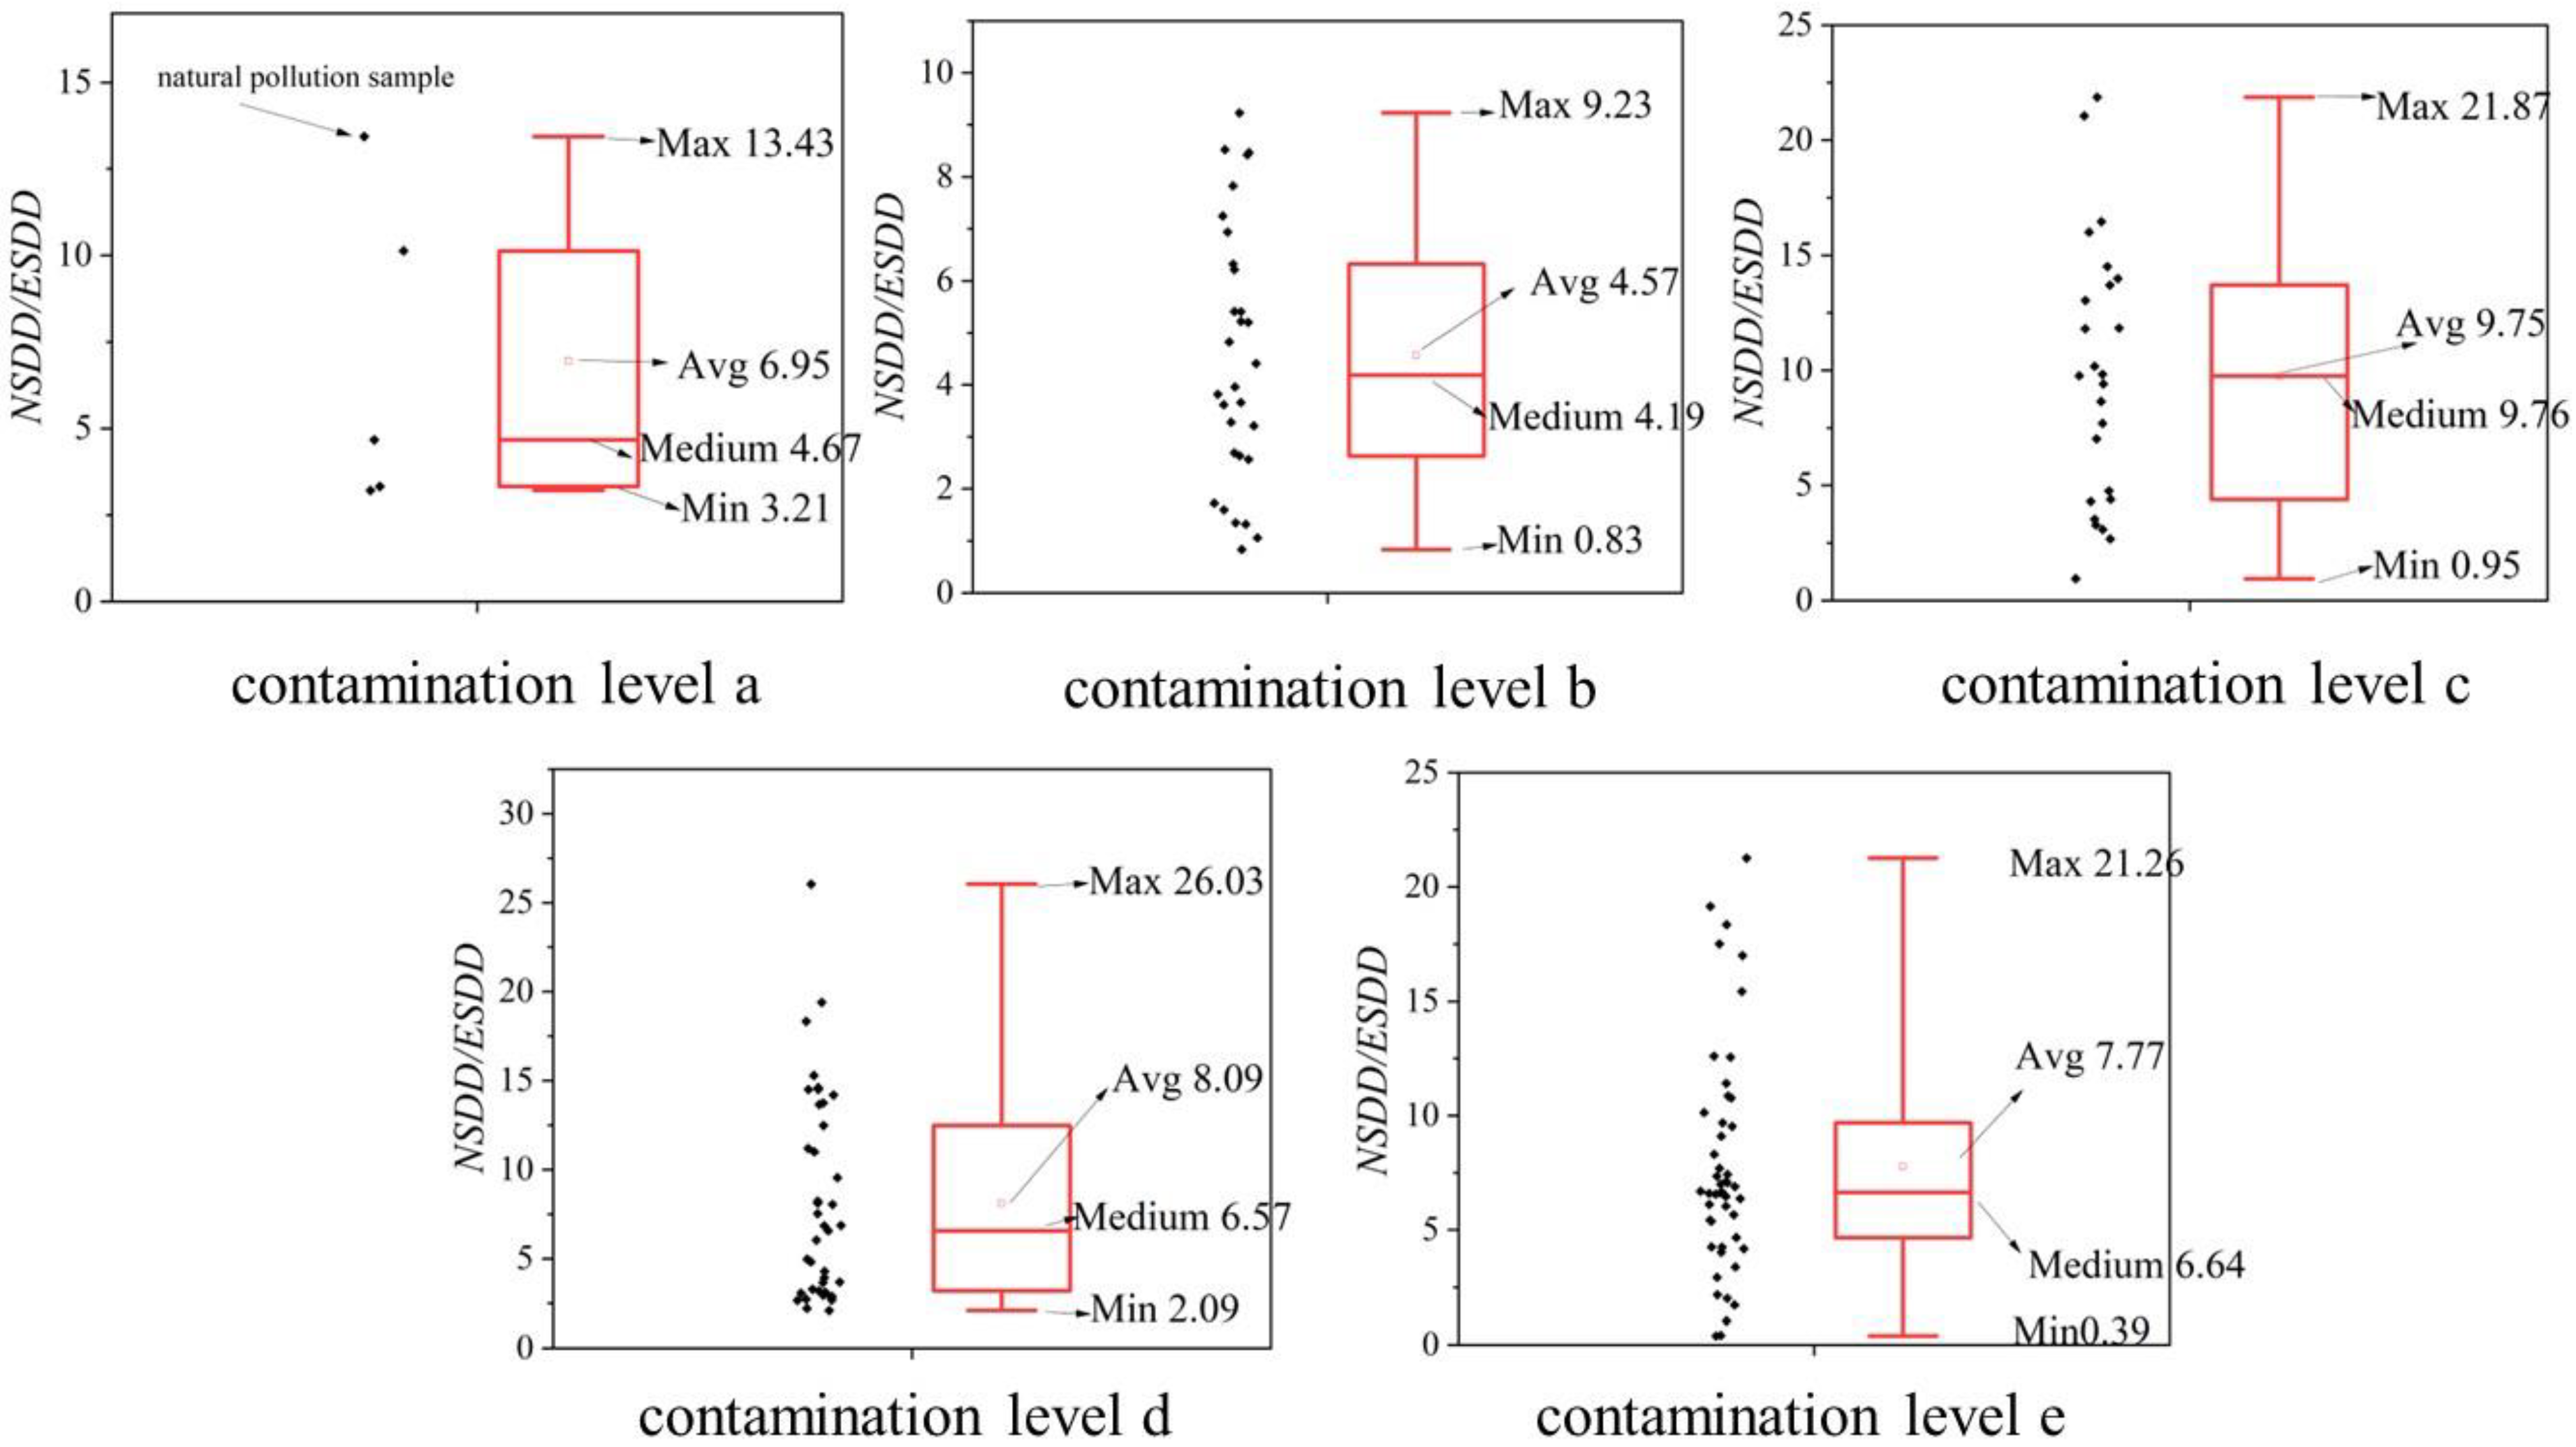
3.2. NSDD/ESDD Ratio

The NSDD/ESDD ratio intervals in Figure 4 are divided by six line segments: 15:1, 8:1, 5:1, 3:1, 1:1, and 1:2 from top to bottom. Results mainly fall within the range of ratios between 1:1 and 15:1.
The NSDD/ESDD ratio has a significant reference for the classification of pollution contamination level, the design of external insulation, and the adjustment of creepage. Besides, the analysis of the ratio is helpful in determining the actual on-site pollution intensity. The probability statistical results of the ratio interval are shown in Figure 5. The distribution probability of the ratio is shown in Figure 6.
According to the results, it can be known that
  • The ratio of level a ranges from 3.2 to 13.4, with an average value of 6.95 and a median of 4.67. The ratio of level b ranges from 0.8 to 9.23, with an average value of 4.57 and a median value of 4.19. The ratio of level c ranges from 0.95 to 21.87, with an average value of 9.75 and a median value of 9.76. The ratio of level d ranges from 2.09 to 26.03, with an average of 8.09 and a median of 6.57. The ratio of level e ranges from 0.39 and 21.26, with an average value of 7.77 and a median value of 50% of 6.64.
  • The NSDD/ESDD ratio of the DC transmission line in central China is 2.4–3.0. Therefore, the ratio of railway insulators in a high-altitude area is generally larger than that of line insulators.

3.3. Analysis of Pollution Composition on Insulator Surface

A test analysis of the pollution components on the insulator surface was carried out, and the test results are shown in Table 2. The pollution components at the test site are mainly influenced by nearby pollution sources, including highway, farmland, and mountainous areas. Variations in component can be attributed to vehicle emissions from the highway, chemical components from farmlands, and differences in soil composition in mountainous regions.
Chloride is the component that accounts for the largest proportion of 14 sampling sites. Additionally, all samples contain varying degrees of acidity. Dong et al. [22] studied the influence of deposition components on insulator string flashover voltages. Thus, the external insulation configuration process should pay attention to the performance of insulators under different types of pollution. Especially when the composite insulators are arranged along the railway at a high-altitude area, acidic substances affect the aging performance of the composite insulating materials.

4. Discussion

4.1. Contamiation Nonuniformity of Natural Pollution Insulators

Contamination nonuniformity is defined as the ratio of the top surface deposition (ESDD or NSDD) to the bottom surface deposition (ESDD or NSDD) of insulators. Generally, T/B is not 1 due to the difference of particle properties. In this section, the T/B values of railway insulators from a high-altitude area are summarized and also compared with the reference nonuniformity of different contamination levels given by the U.S. Electric Power Research Institute (EPRI) [23]. The results are shown in Table 3.
The T/B values of railway insulators are different from the reference value of EPRI, which indicates that the unevenness of deposition in this study is much smaller than the recommended values. It can be known from the results that
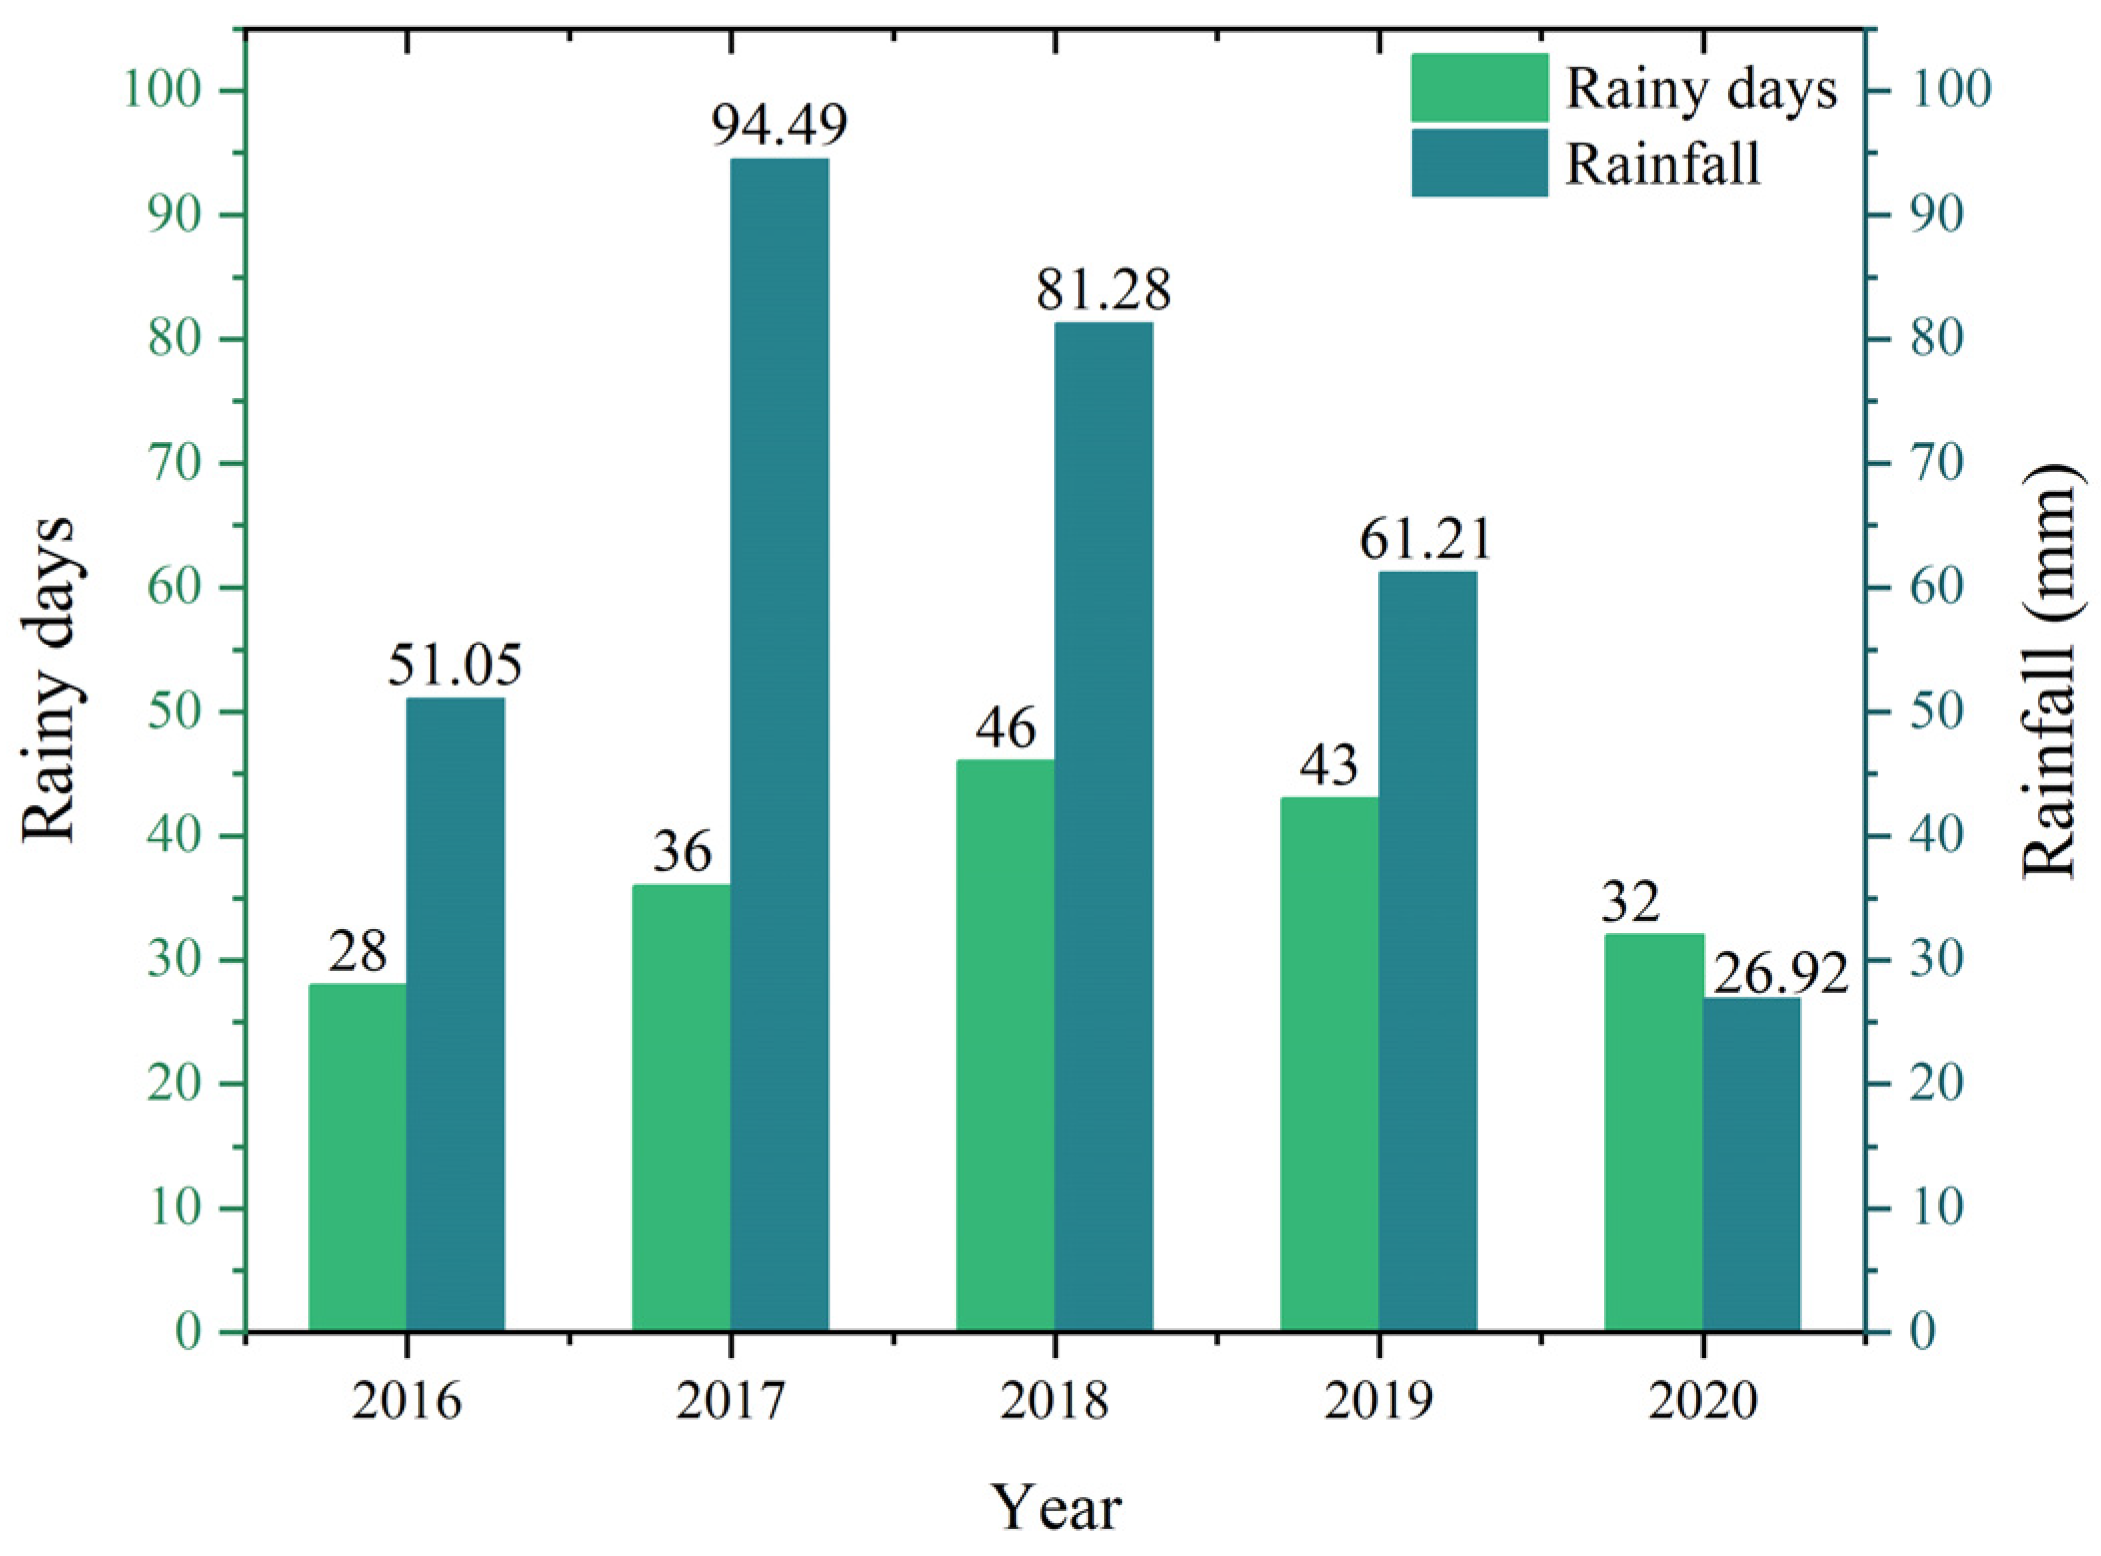
  • The insulators in this study are arranged in the plateau area, and the typical climate of the plateau region is sandy, higher wind speed, drier air, less rainfall, and strong ultraviolet. The number of rainfall days of sampling sites is shown in Figure 7. Since the deposition samples were taken in 2021, the statistical results cover the previous 5 years. There is rare rainfall in the plateau region, which causes less washing of the pollution on the top surface, accordingly. This further results in lower nonuniformity.
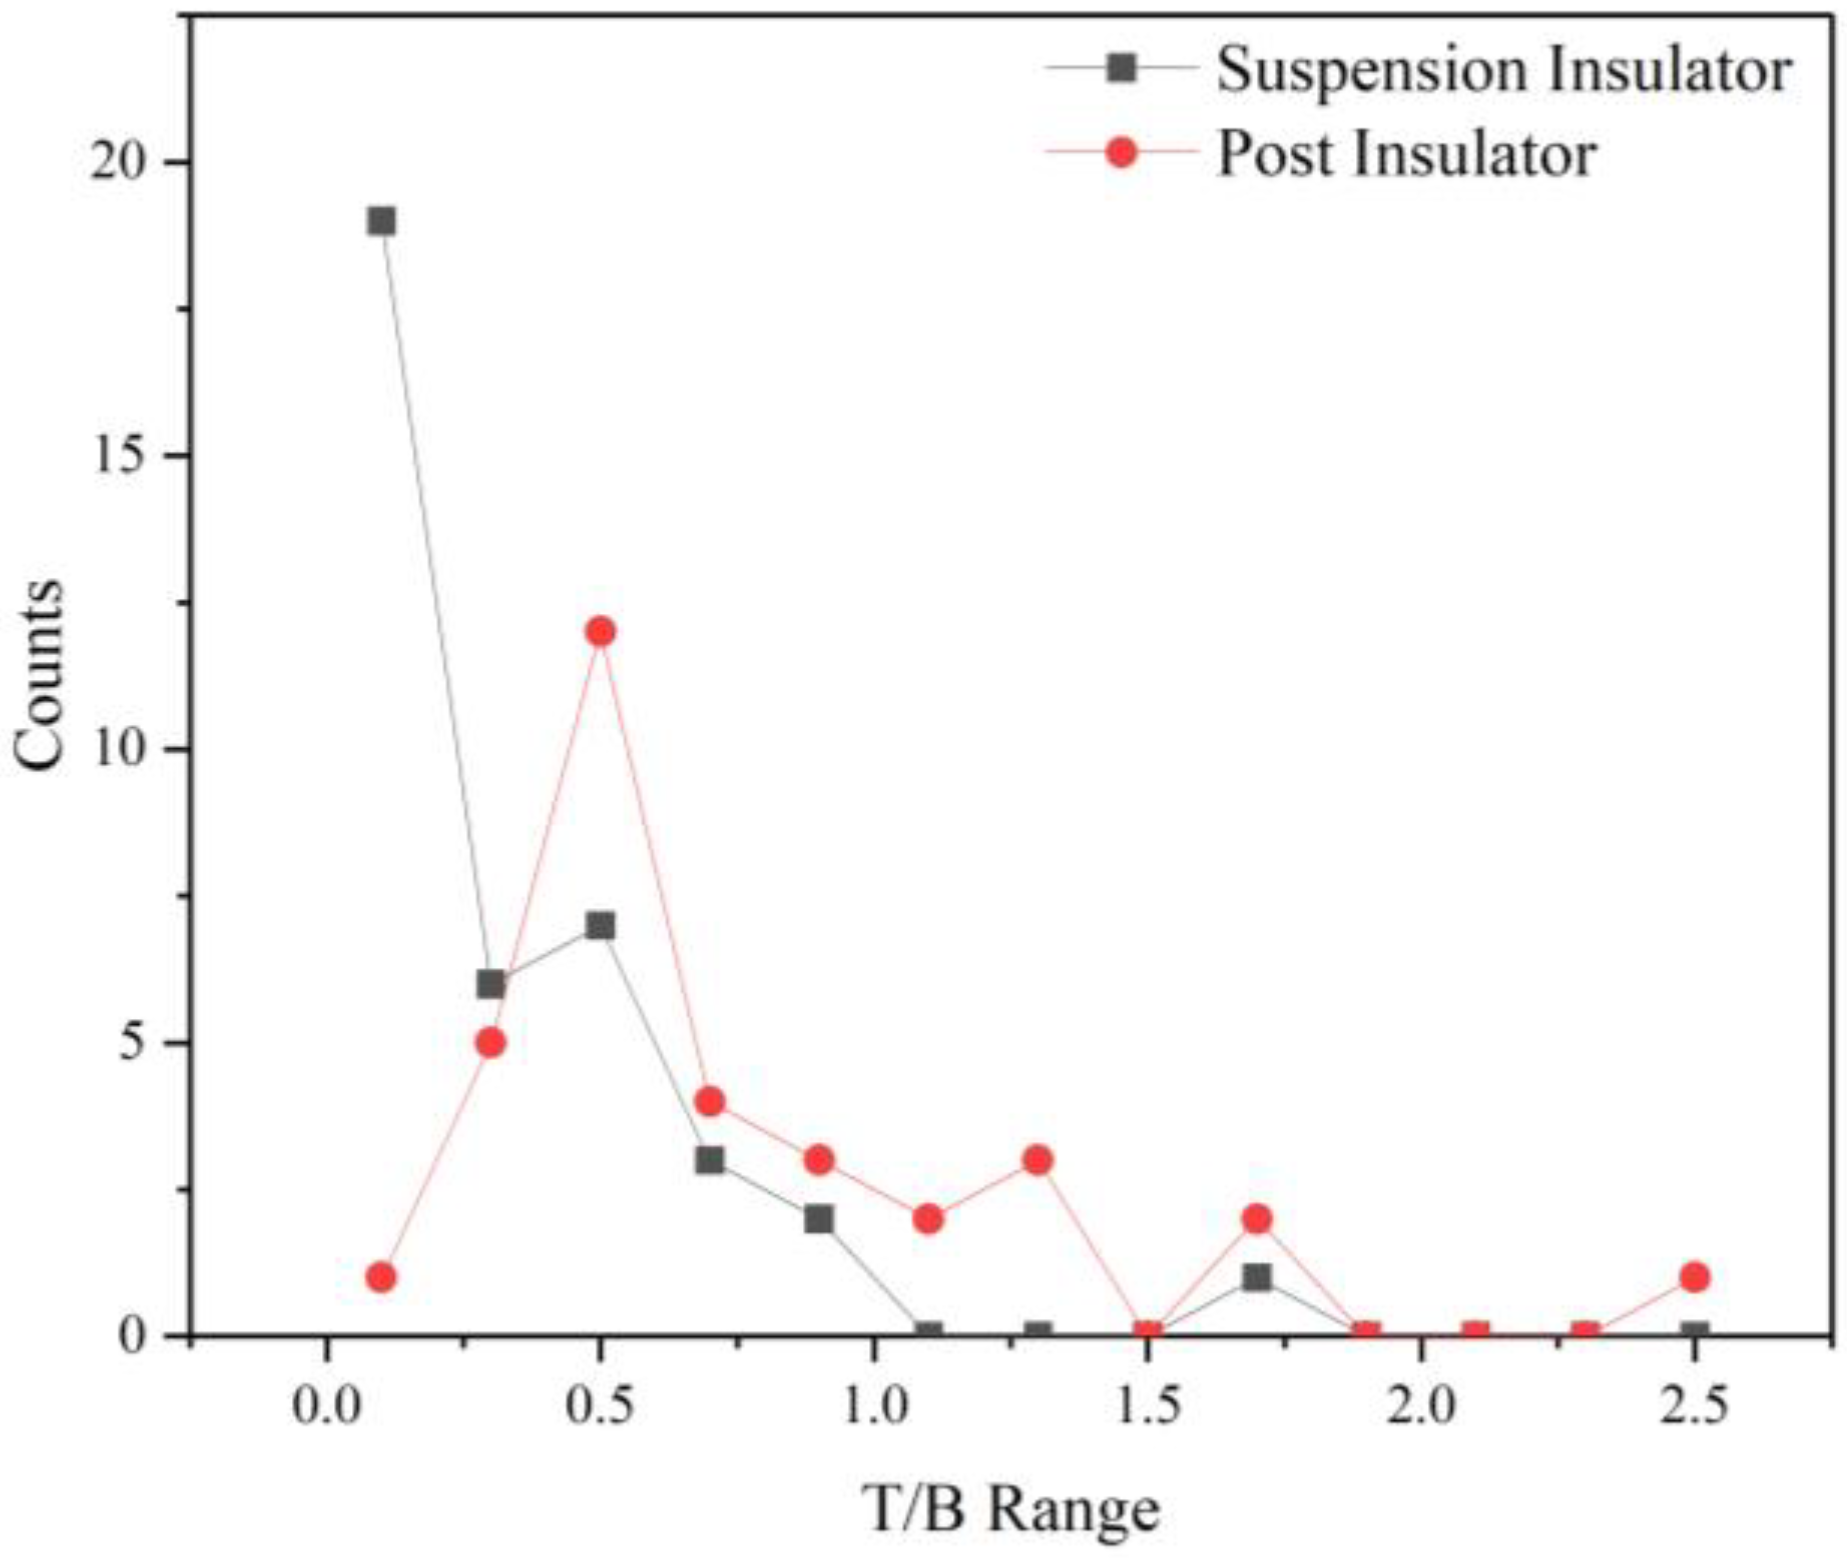
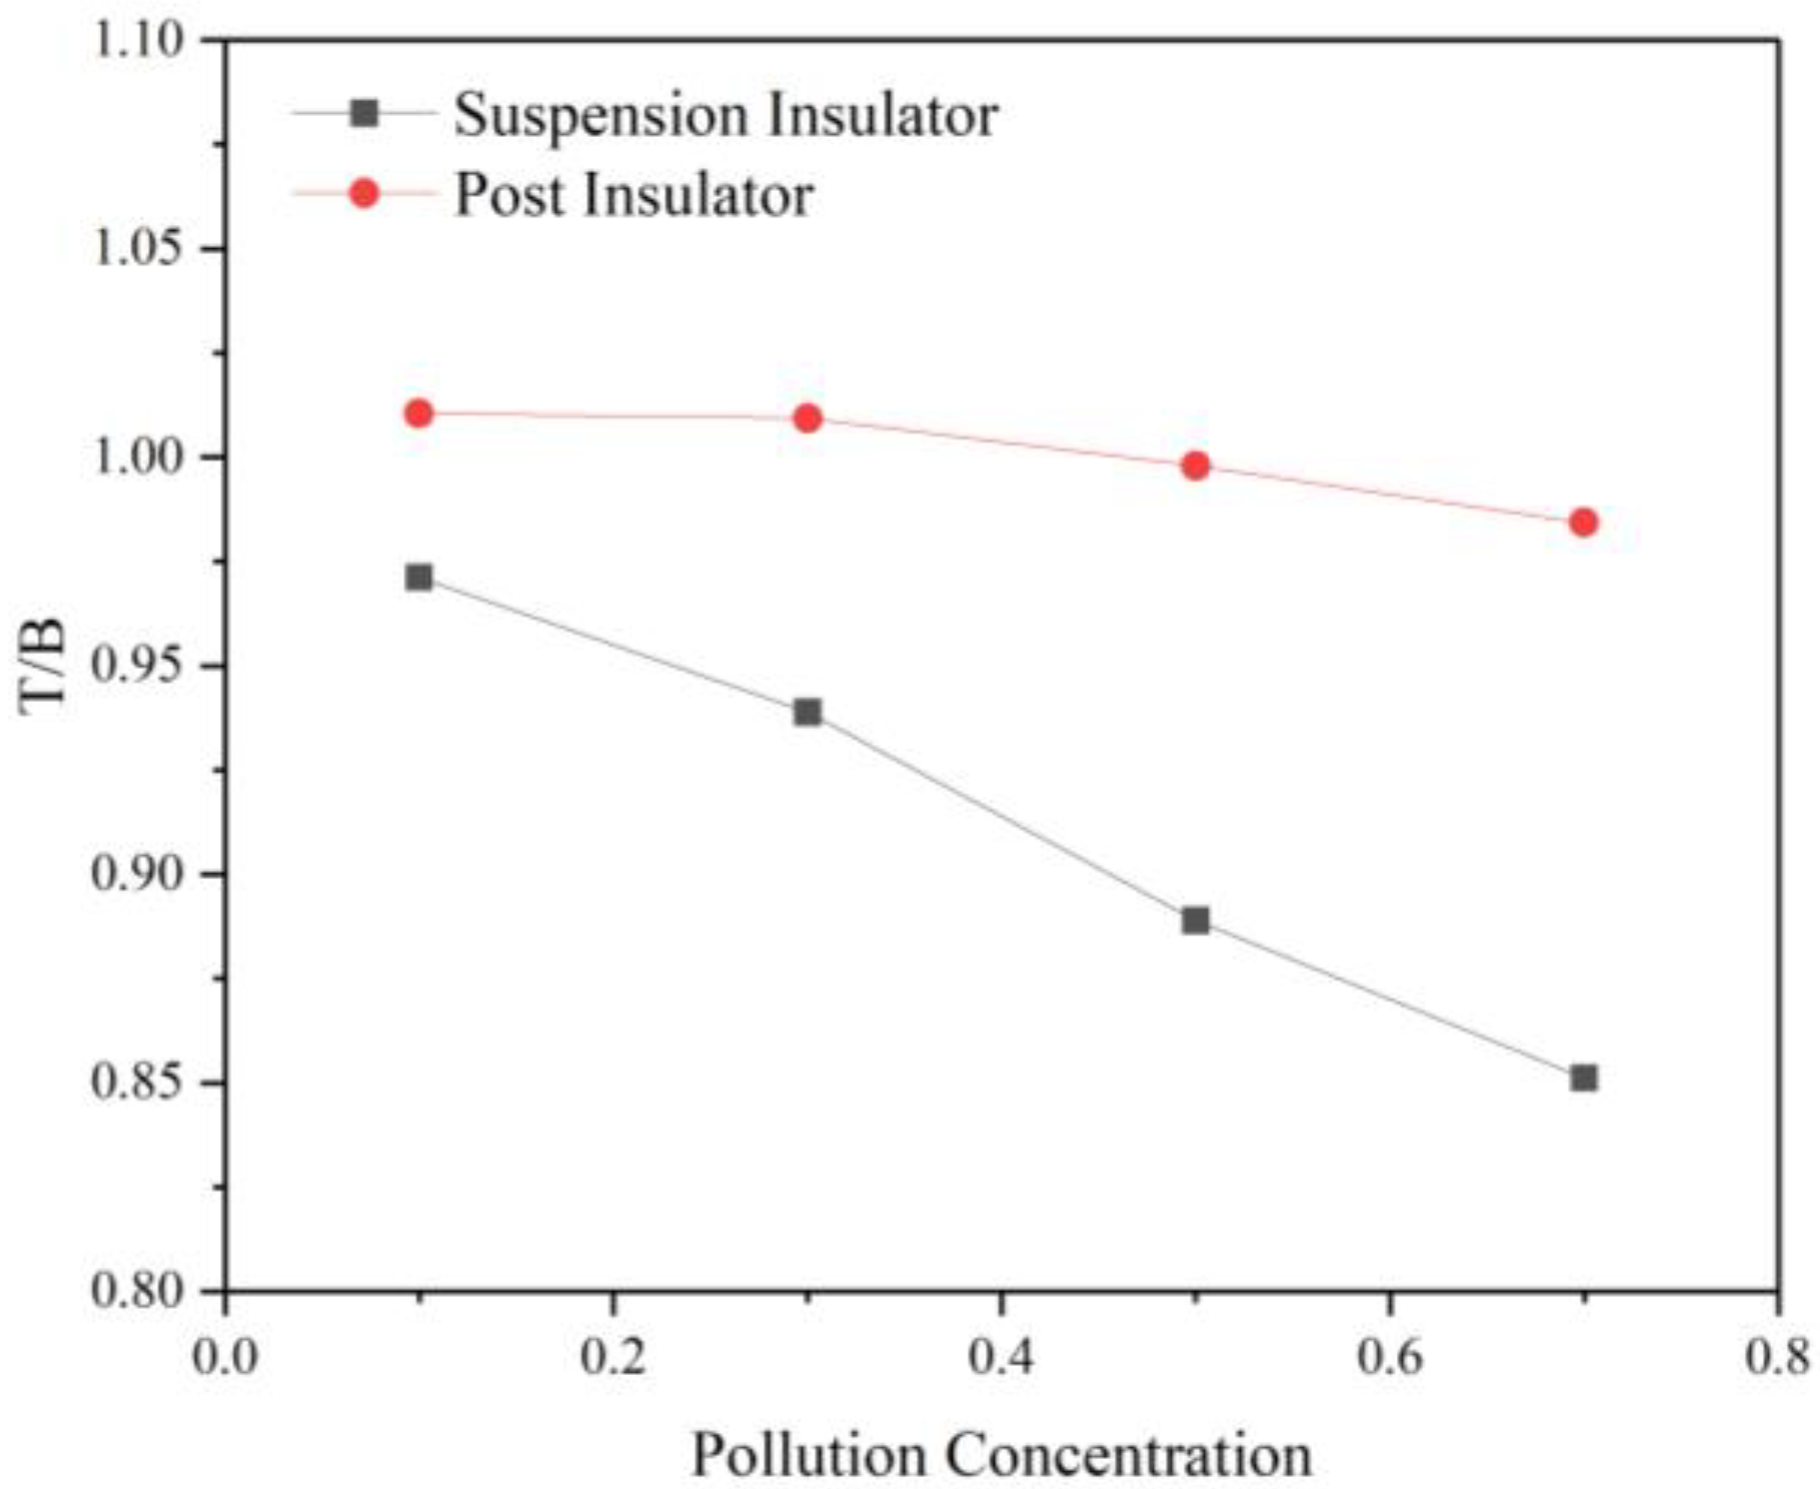
  • The structure of insulators also has an impact on the nonuniformity of pollution accumulation. Suspension insulators of a transmission line were taken into consideration according to the EPRI standard [23], while post insulators are frequently used in railroad power systems. The comparison of the T/B value distribution of this study and a previous study of this research group is shown in Figure 8. Yang et al. [24] studied the nonuniformity of suspension insulators. The average T/B value of transmission line suspension insulators is 0.2, and most T/B values are less than 1. It can be seen from Figure 8 that the difference of T/B is significant between suspension insulators and post insulators.

4.2. Comparsion of Insulator Type

As can be known in Section 4.1, insulator structure and type have influences on pollution accumulation. As the shape of insulator skirts varies, it affects the distribution and motion paths of pollution particles. In this section, hydrodynamic simulations were carried out using the finite element software Ansys Fluent 2021 R1 in order to further investigate the natural pollution characteristics of railway insulators.
The pollution particles are affected by the airflow and the surrounding air environment. Therefore, the Eulerian two-phase flow model was used to simulate the movement of pollution particles in the air. The deposition distribution on the insulator surface was characterized by the volume fraction of the pollution phase. As shown in Figure 9, different types of insulators were simulated under the same conditions (the wind speed is 7 m/s, and the pollution particle diameter is 10 μm).
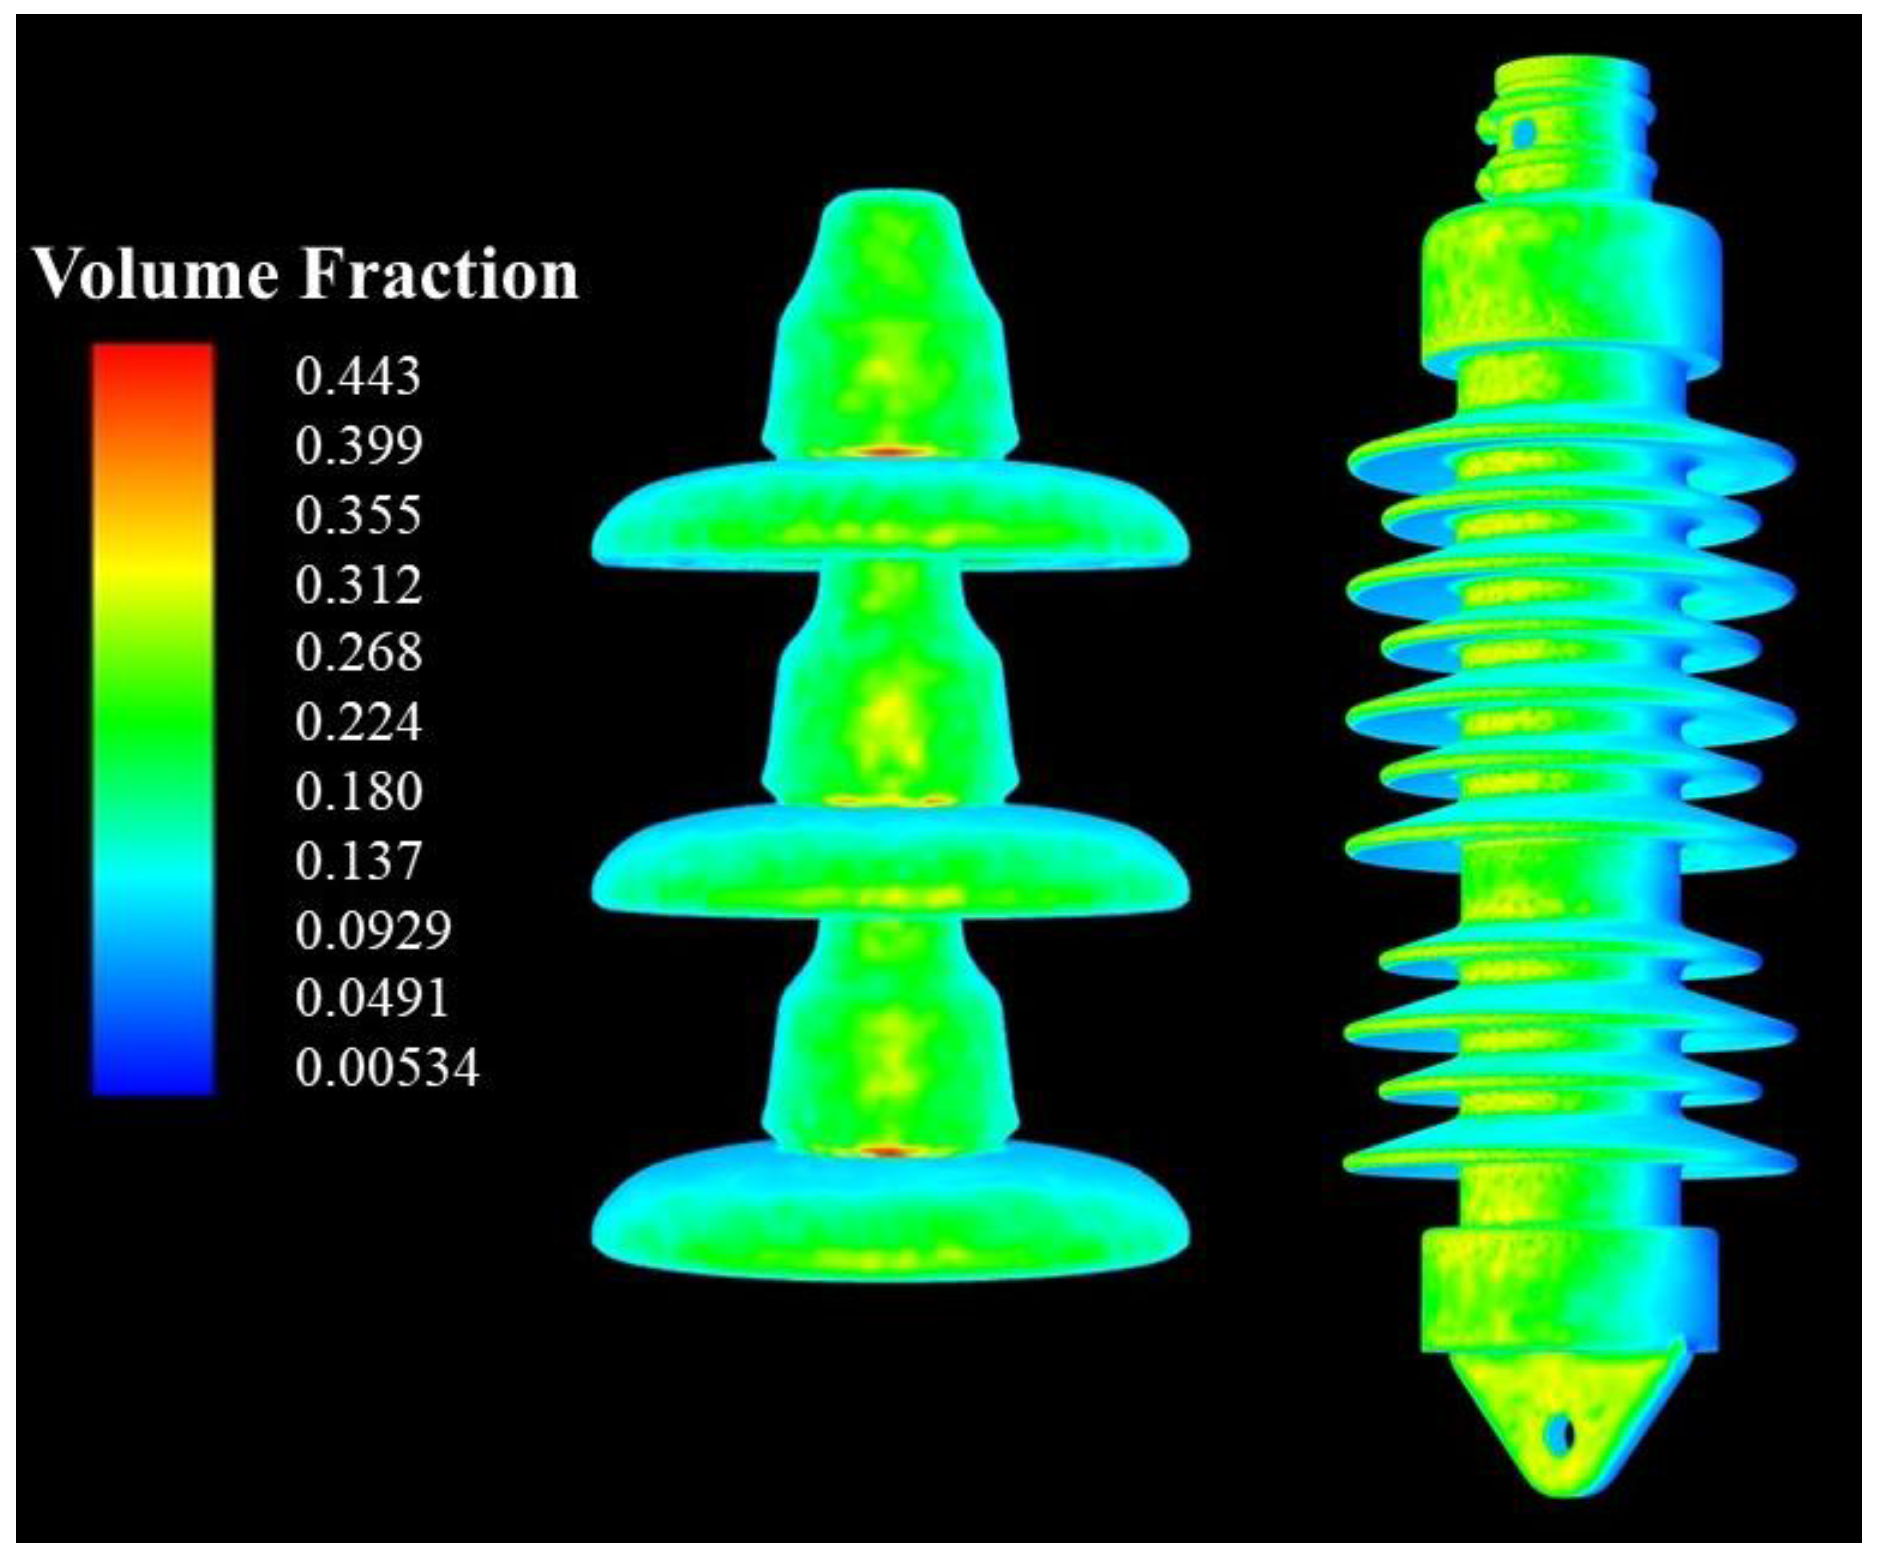
  • Figure 10 shows the comparison results of the nonuniformity of the two insulators under different concentrations of pollution particles. From the results, it can be seen that the T/B values of both insulators show a decreasing trend as the concentration of pollution particles increases. The T/B value of a suspension insulator changes more rapidly with an increasing concentration, while the T/B value of a post insulator changes relatively smoothly. The T/B value of a suspension insulator is below 1; that is, the bottom surface of the suspension insulator is more heavily contaminated than the top surface under all kinds of pollution particle concentration. The T/B values of post insulators are concentrated in the range of 0.5–1.25, which indicates that the distribution is more uniform than the suspension insulator.
  • Combining the field results in Table 3 with the simulation results in Figure 10, it can be seen that the suspension insulators used in the EPRI standard have more contamination on the top surface during the natural accumulation of contamination. As the contamination level increases, the number of contamination particles in the air increases, and the contamination on the bottom surface increases relatively, resulting in a decrease in the corresponding T/B value. For the rod insulator, the increase in pollution level has little effect on the value of T/B. However, the bottom surface pollution increases relatively, and the T/B value changes from lower than 1 to higher than 1.
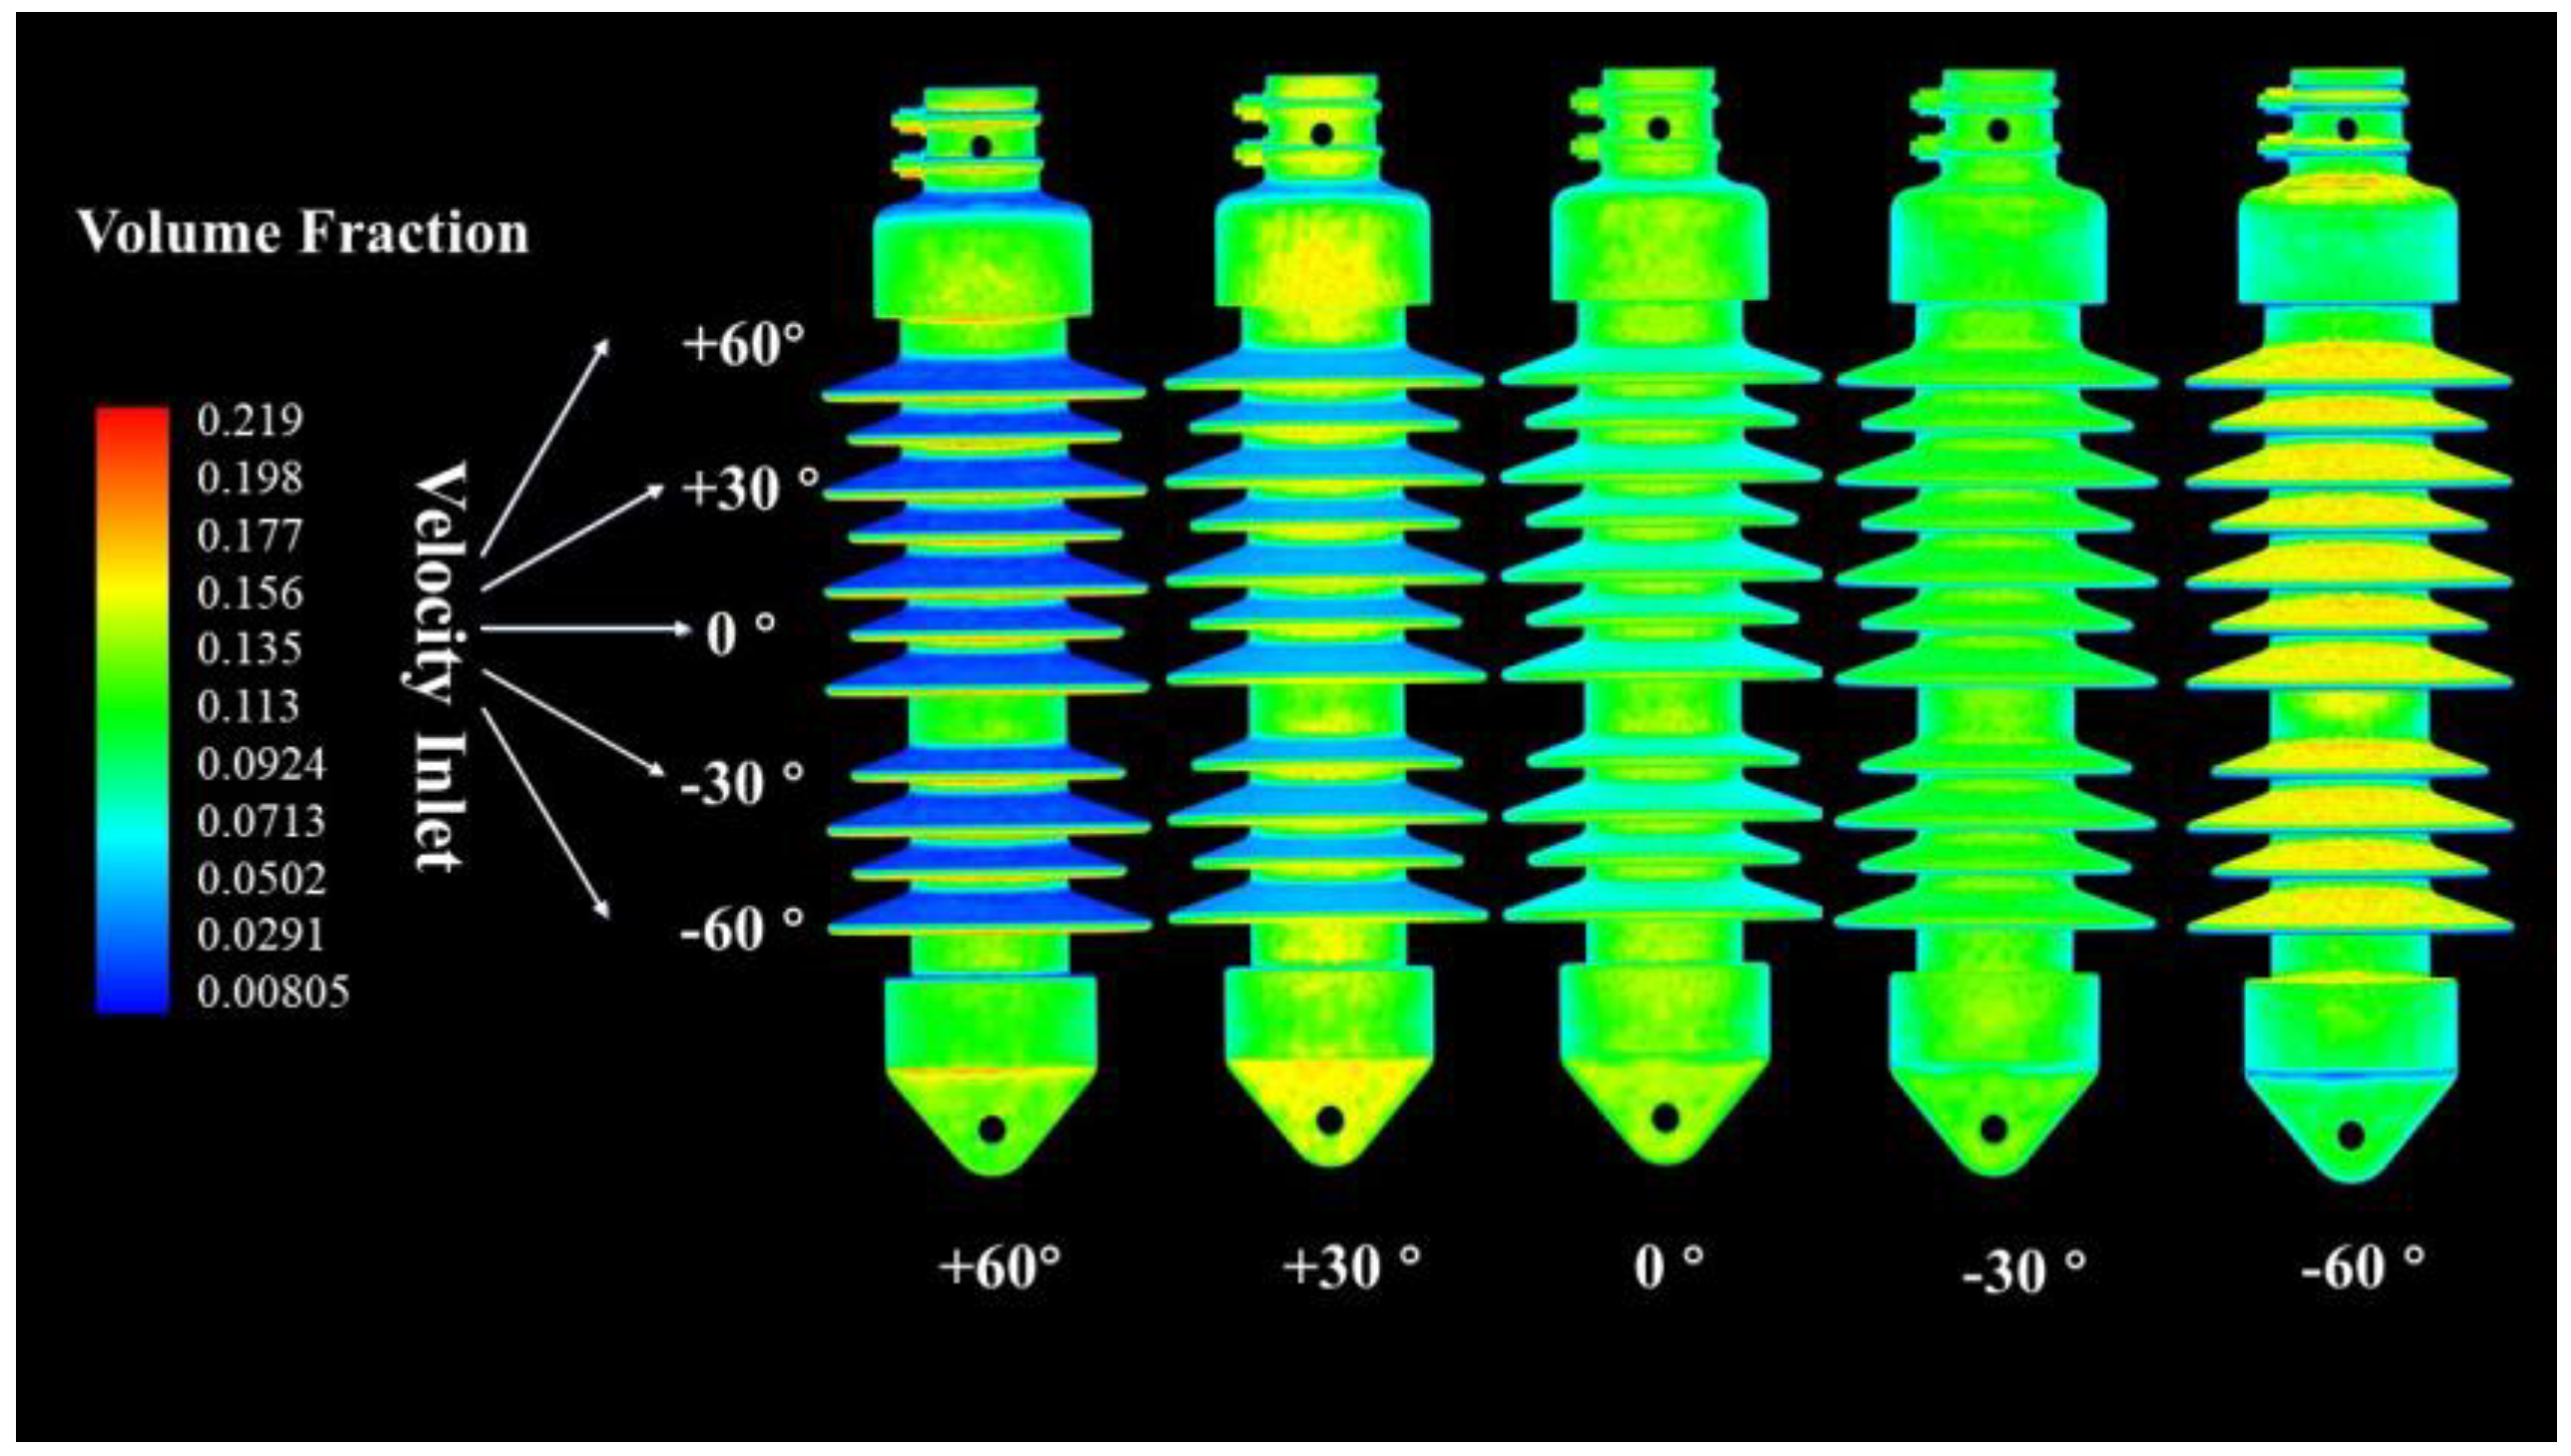
  • Differences in arrangement can also affect nonuniformity. Railway insulators are often at a certain angle to the ground when used in railroad traction power supply facilities. The effect of changing a particle entry angle was calculated using Ansys Fluent. The wind speed was set to 7 m/s, the particle diameter was 10 μm, and the particle concertation was 0.06. As shown in Figure 11, the volume fraction contour displays the simulation result. Additionally, the T/B values were calculated to be 1/4.34, 1/3.03, 1/1.02, 1/0.5, and 1/0.15 for the variation of the angle from +60° to −60°. Thus, the arrangement angle also leads to a difference in T/B values for natural contaminated insulators in a high-altitude area.

4.3. Contamination Condition Comparsion

Natural contamination can be influenced by the complex operating environment, and rainfall has a significant impact on the degree of self-cleaning for on-site insulators. In order to analyze the difference in the insulator accumulation process, the natural pollution on insulator surfaces inside and outside the tunnel were compared, as shown in Table 4:
  • Both soluble and insoluble deposition on the surface of insulators placed inside the tunnel are heavier than those placed outside the tunnel; the pollution level of insulators outside the tunnel is level d, while that inside the tunnel is level e.
  • The insulators outside the tunnel were cleaned by rainwater, which dissolved and removed dirt from the insulator surface, which resulted in lower ESDD and NSDD compared with the insulators inside the tunnel that were not washed by rainwater. This effect leads to different levels between the two areas.
  • The insulators inside the tunnel have higher NSDD/ESDD ratios than the insulators outside the tunnel, and the ratios of insulators inside the tunnel are 6.57, 5.88, and 9.30.

4.4. External Insulation Configuration

Table 5 shows the results of the power frequency AC voltage flashover experiments completed on the sample insulator at Chongqing University’s multifunctional artificial climate laboratory [25].
The flashover voltage of insulators is influenced by the altitude, air pressure, and pollution level of the arrangement location. Therefore, the pollution withstand voltage method is usually used when calculating the external insulation configuration. This method can be linked with the insulator pollution withstand voltage. The insulator configuration can be calculated using
N = k 1 U w k 2 k 3 U 50 ( 1 3 σ % )
where N is the number of pieces that the insulator string should reach; Uw is the maximum pollution withstand voltage, in kV; k1 is the safety margin coefficient, usually taken as 1.1; k2 is the correction coefficient of the uneven distribution of pollution; k3 is the difference between the probability of a single and parallel flashover and is generally 0.92 by mathematical statistics analysis; and  σ % is the standard deviation of test results, generally the value of which is 7%.
The contamination of insulators is uniform when conducting pollution flashover experiments, while the actual natural accumulation of the contamination of insulators is uneven. It is necessary to correct the unevenness. Therefore, combined with the research in this paper, the nonuniformity coefficient can be k2, which can be calculated by the following formula:
k 2 = 1 A lg ( T B )
where El,50 is the potential gradient along the creepage distance of the insulator at the altitude h obtained by a power frequency AC experiment, in kV/cm; U50 is the power frequency AC pollution 50% flashover voltage, in kV; and L is the creepage distance of the insulator, in cm.
The electrical system of the railroad has a rated voltage of 27.5 kV, and its external insulation is designed for a 35 kV system, resulting in a maximum working voltage of 40.5 kV. Therefore, the insulator creepage ratio distance at a high altitude can be calculated using the following formula:
λ h = 40.5 k 2 ( 1 3 σ % ) E l , 50
where λ h is the creepage distance of the insulator required at the altitude h, in cm.
The required height of the insulator can be calculated as
H = 40.5 k 2 k 3 U 50 ( 1 3 σ % )
where H’ is the required insulation height of the insulator, in m.
According to Equations (5) and (6), Table 6 shows the selected creepage distance and insulator height for different altitudes and contamination levels. The results in Table 6 compare the configuration referring to the T/B value of the EPRI standard and this paper. From the results, it can be seen that the configuration calculated according to the results of this paper is greater than that of the EPRI standard. This is due to the fact that the surface pollution distribution of rail insulators from a plateau area is more uniform than that of the EPRI standard. Therefore, it is risky to design the external insulation parameters of rail insulators according to the EPRI standard.

5. Conclusions

This paper studies the natural contamination characteristics of railroad insulators at a high-altitude area. The external insulation configuration of a railroad insulator is calculated. The conclusions can be drawn as follows:
(a)
The natural pollution accumulation characteristics of railway insulators in a high-altitude area are significantly different from insulators commonly used in power systems. The ESDD range of railway insulators is 0.003–0.220 mg/cm2, mainly at 0.003–0.03 mg/cm2. The NSDD/ESDD ratio range of railway insulators concentrates at 0–10.
(b)
The deposition on railway insulator surfaces is mainly composed of NaCl. Meanwhile, NaCl is used in the artificial contamination experiment, so the external insulation configuration calculated according to the pollution flashover experiment of artificial contamination needs to consider a certain margin. Additionally, the influence of pollution components on flashover voltage is to be further considered.
(c)
Based on this study, the pollution nonuniformity of line suspension insulators is different from that of railway post insulators. According to the EPRI standard, the external insulation configuration would be risky, since the range of given creepage distance and structural height is insufficient to use in high-altitude railway. Therefore, it is recommended to pay attention to the configuration and clean the insulator regularly.
(d)
According to this study, the natural deposition on insulators contains many components and is nonuniformly distributed. Thus, it is suggested that while designing the external insulation configuration of railway insulators, the flashover voltage is corrected, considering the nonuniformity and contamination components.

Author Contributions

Conceptualization, Z.Z. and J.H.; methodology, Z.Z.; software, S.C.; validation, Z.Z., S.C., and X.J.; formal analysis, Z.Z.; investigation, S.C.; resources, S.C.; data curation, S.C.; writing—original draft preparation, Z.Z.; writing—review and editing, S.C.; visualization, S.C.; supervision, X.J.; project administration, Q.H.; funding acquisition, J.H. All authors have read and agreed to the published version of the manuscript.

Funding

This research was supported by the Science and Technology Project of the State Grid Corporation of China (5200-202155586A-0-5-GC).

Data Availability Statement

Not applicable.

Conflicts of Interest

The authors declare no conflict of interest.

References

  1. Zhang, Z.; Zhang, W.; You, J.; Jiang, X.; Zhang, D.; Bi, M.; Wu, B.; Wu, J. Influence Factors in Contamination Process of XP-160 Insulators Based on Computational Fluid Mechanics. IET Gener. Transm. Distrib. 2016, 10, 4140–4148. [Google Scholar] [CrossRef]
  2. Zhang, Z.; You, J.; Zhao, J.; Cheng, Y.; Jiang, X.; Li, Y. Contamination Characteristics of Disc-Suspension Insulator of Transmission Line in Wind Tunnel. IET Gener. Transm. Distrib. 2017, 11, 1453–1460. [Google Scholar] [CrossRef]
  3. Ravelomanantsoa, N.; Farzaneh, M.; Chisholm, W.A. Effects of Wind Velocity on Contamination of HV Insulators in Winter Conditions. In Proceedings of the 2008 Annual Report Conference on Electrical Insulation and Dielectric Phenomena, Quebec, QC, Canada, 26–29 October 2008; pp. 240–244. [Google Scholar]
  4. Qiao, X.; Zhang, Z.; Jiang, X.; Zhang, D. Contamination Characteristics of Typical Transmission Line Insulators by Wind Tunnel Simulation. Electr. Power Syst. Res. 2020, 184, 106288. [Google Scholar] [CrossRef]
  5. Huang, Y.; Huang, X. Flow Field Distribution around Insulator and Contamination Uneven Characteristic of Insulator. IET Sci. Meas. Technol. 2020, 14, 1088–1097. [Google Scholar] [CrossRef]
  6. Wu, X.; Zhang, X.; Wu, G. Simulation and Analysis of Contamination Depositing Characteristic of Roof Insulator. In Proceedings of the 2016 IEEE International Conference on High Voltage Engineering and Application (ICHVE), Chengdu, China, 19–22 September 2016; pp. 1–4. [Google Scholar]
  7. Zhang, D.; Jiang, X.; Liu, X. Study on Natural Contamination Performance of Typical Types of Insulators. IEEE Trans. Dielectr. Electr. Insul. 2014, 21, 1901–1909. [Google Scholar] [CrossRef]
  8. Jiang, Z.; Jiang, X.; Guo, Y.; Hu, Y.; Meng, Z. Pollution Accumulation Characteristics of Insulators under Natural Rainfall. IET Gener. Transm. Distrib. 2017, 11, 1479–1485. [Google Scholar] [CrossRef]
  9. Zhang, Z.; Qiao, X.; Yang, S.; Jiang, X. Non-Uniform Distribution of Contamination on Composite Insulators in HVDC Transmission Lines. Appl. Sci. 2018, 8, 1962. [Google Scholar] [CrossRef] [Green Version]
  10. Zhang, Z.; Huang, H.; Jiang, X.; Chen, M.; Hu, J. Analysis of the Pollution Accumulation and Flashover Characteristics of Field Aged 110kV Composite Insulators. In Proceedings of the 2011 Electrical Insulation Conference (EIC), Annapolis, MD, USA, 5–8 June 2011; pp. 120–124. [Google Scholar]
  11. Qiao, X.; Zhang, Z.; Jiang, X.; He, Y.; Li, X. Application of Grey Theory in Pollution Prediction on Insulator Surface in Power Systems. Eng. Fail. Anal. 2019, 106, 104153. [Google Scholar] [CrossRef]
  12. Sima, W.; Yuan, T.; Yang, Q.; Xu, K.; Sun, C. Effect of Non-Uniform Pollution on the Withstand Characteristics of Extra High Voltage (EHV) Suspension Ceramic Insulator String. IET Gener. Transm. Distrib. 2010, 4, 445–455. [Google Scholar] [CrossRef]
  13. Zheng, K.; Huang, H.; Yang, F.; Chen, M.; Zhang, H.; Zhang, Z.; Long, Z. The Influence of Uneven Pollution Distribution on the Electrical and Thermal Characteristics of Insulators. In Proceedings of the 2023 IEEE 4th International Conference on Electrical Materials and Power Equipment (ICEMPE), Shanghai, China, 7–10 May 2023; pp. 1–4. [Google Scholar]
  14. Dong, B.; Ge, Y.; Wu, B.; Jiang, X. Modified Model of AC Flashover Voltages of Contaminated Insulators with Various Shapes. Electr. Power Syst. Res. 2023, 218, 109188. [Google Scholar] [CrossRef]
  15. Qiu, Z.; Sun, Y.; Cui, Y.; Zhang, Z.; Liu, Y.; Chen, X.; Wu, Y.; Li, C.; Wang, L.; Lei, Z. Optimized Design of Shed Parameters for Polluted Hollow Porcelain Insulators at High Altitude. IEEE Access 2023, 11, 63451–63462. [Google Scholar] [CrossRef]
  16. Sun, J.; Gao, G.; Zhou, L.; Wu, G. Pollution Accumulation on Rail Insulator in High-Speed Aerosol. IEEE Trans. Dielectr. Electr. Insul. 2013, 20, 731–738. [Google Scholar] [CrossRef]
  17. Zhao, S.; Zhang, C.; Zhang, Y.; Wang, S. Influence of Partial Arc on Electric Field Distribution of Insulator Strings for Electrified Railway Catenary. Energies 2019, 12, 3295. [Google Scholar] [CrossRef] [Green Version]
  18. Wang, G.; Chen, Q.; School, E.M.; Southwest, U.J. Simulation on Contamination Depositing Characteristics of Electrified Railway Catenary Insulator. Insul. Surge Arresters 2020, 6, 228–234+240. [Google Scholar]
  19. Zhang, R.; Chen, T.; Bai, G.; Wang, T.; Wang, L.; Zhang, J. Discussion on Pollution Accumulation Characteristics of Insulator on Top of EMU Based on Multi Field Coupling. In Proceedings of the 22nd International Symposium on High Voltage Engineering (ISH 2021), Xi’an, China, 22 November 2021; Volume 2021, pp. 1676–1681. [Google Scholar]
  20. IEC 60815-4-2016; Selection and Dimensioning of High-Voltage Insulators Intended for Use in Polluted Conditions—Part 4: Insulators for d.c. Systems. British Standards: London, UK, 2016.
  21. IEC 60507:2013; Artificial Pollution Tests on High-Voltage Ceramic and Glass Insulators to be Used on a.c. Systems. International Electrotechnical Commission: Worcester, MA, USA, 2013.
  22. Dong, B.; Jiang, X.; Zhang, Z.; Hu, J.; Hu, Q.; Shu, L. Effect of Environment Factors on Ac Flashover Performance of 3 Units of Polluted Insulator Strings under Natural Fog Condition. IEEE Trans. Dielectr. Electr. Insul. 2014, 21, 1926–1932. [Google Scholar] [CrossRef]
  23. Schneider, H.M.; Zaffanella, L.E. HVDC Transmission Line Insulation Performance; General Electric Co.: Lenox, MA, USA, 1986. [Google Scholar]
  24. Yang, F. Study on Non-Uniformity Pollution Characteristics and Its Influence on AC Flashover Voltage of Insulators in Chongqing Area. Master’s Thesis, Chongqing University, Chongqing, China, December 2020. [Google Scholar]
  25. Wan, X.; Shi, H.; Zhang, Z.; Hu, W.; Zhang, Y. AC Pollution Flashover Characteristics of Post Insulators Under Low Air Pressure. In Proceedings of the 4th IEEE International Conference on Electrical Materials and Power Equipment (ICEMPE 2023), Shanghai, China, 7–10 May 2023; pp. 1–4. [Google Scholar]
Figure 1. Schematic diagram of the insulator structure.
Energies 16 05738 g001
Figure 2. Natural contamination test results.
Energies 16 05738 g002
Figure 3. Distribution results of ESDD and NSDD.
Energies 16 05738 g003
Figure 4. NSDD/ESDD calculation results of natural contamination.
Energies 16 05738 g004
Figure 5. Statical results of NSDD/ESDD.
Energies 16 05738 g005
Figure 6. NSDD/ESDD ratio distribution.
Energies 16 05738 g006
Figure 7. Annual rainfall intensity and rainy days.
Energies 16 05738 g007
Figure 8. Comparison of T/B between suspension insulators of transmission lines and post insulators of a railway power supply system.
Energies 16 05738 g008
Figure 9. Fluid numerical simulation on a suspension insulator and post insulator.
Energies 16 05738 g009
Figure 10. Comparison of T/B between a suspension insulator and post insulator under the same simulation conditions.
Energies 16 05738 g010
Figure 11. Comparison of contamination situation between different wind angles.
Energies 16 05738 g011
Table 1. Structural parameters of the tested insulators.
TypeHeight (mm)Diameter (mm)Creepage Distance (mm)
QBG-25/167902201600
Table 2. Insulator surface contamination’s main components.
Test SiteComponentsMole FractionTest SiteComponentsMole Fraction
Site 1MgSO456.24%Site 2NaCl36.34%
KNO317.93% Na2SO434.29%
CaSO412.44% NaH2PO425.45%
Other13.39% Other3.92%
Site 3KNO322.50%Site 4NaCl53.43%
CaSO421.80% CaSO417.63%
KCl19.79% Na2SO413.33%
Other35.91% Other14.61%
Site 5KCl44.71%Site 6NaCl61.88%
CaSO420.63% CaSO425.36%
KNO319.83% Na2SO46.82%
MgSO414.83% Other5.94%
Site 7KCl33.86%Site 8Na2SO435.70%
KNO332.15% NaCl26.00%
K2SO416.45% NH4NO325.70%
Other17.54% Other12.6%
Site 9KCl38.34%Site 10NaCl50.08%
K2SO429.21% Na2SO427.69%
KNO318.59% KF8.45%
Other13.86% Other13.78%
Site 11NaCl48.91%Site 12NaCl40.41%
NaNO321.43% Na2SO423.81%
Na2SO415.69% NaNO318.63%
Other13.97% Other17.15%
Site 13KCl65.78%Site 14KCl55.06%
CaSO422.13% CaSO429.42%
MgSO412.09% MgSO415.52%
Site 15KCl76.26%Site 16NaCl43.02%
CaSO413.96% Na2SO440.06%
KNO39.78% Other16.92%
Site 17NaCl40.52%
Na2SO431.75%
CaSO418.01%
Other9.72%
Table 3. Results of T/B values of insulator contamination of different contamination levels.
LiteratureContamination Level
abcde
This study1/0.621/0.741/1.551/1.681/1.76
EPRI [18]1/11/31/51/81/15
Table 4. Comparison of insulator natural contamination (inside or outside tunnels).
Tunnel NumberSample LocationESDD (mg/cm2)NSDD (mg/cm2)
Tunnel 1Outside0.0760.267
Inside0.0820.539
Tunnel 2Outside0.0560.521
Inside0.0930.547
Tunnel 3Outside0.0861.105
Inside0.2202.045
Table 5. Pollution flashover voltage of test insulator under power frequency AC voltage.
Altitude/Air Pressure
(m/kPa)
U50 (kV)
SDD (mg/cm2)
Light
0.03
Medium
0.05
Heavy
0.10
Very Heavy
0.15
3000/70.047.839.830.924.8
4500/57.742.935.125.820.9
Table 6. External insulation configuration parameters of test insulators in a high-altitude and pollution area under power frequency AC voltage.
Altitude/Air Pressure
(m/kPa)
Referenced T/B StandardInsulator
Configuration
(cm)
Contaminated Area Level
SDD (mg/cm2)
Light
0.03
Medium
0.05
Heavy
0.10
Very Heavy
0.15
3000/70.0This paper λ h 180.87192.19244.52302.52
H’122.67130.57166.11205.52
EPRI λ h 145.26162.84197.63228.59
H’98.68110.62134.26155.29
4500/57.7This paper λ h 201.20217.93292.85358.98
H’136.68148.05198.95243.87
EPRI λ h 161.86184.65236.70271.24
H’109.96125.43160.80184.27
Disclaimer/Publisher’s Note: The statements, opinions and data contained in all publications are solely those of the individual author(s) and contributor(s) and not of MDPI and/or the editor(s). MDPI and/or the editor(s) disclaim responsibility for any injury to people or property resulting from any ideas, methods, instructions or products referred to in the content.

