


Assessment of the Effect of Road Load on Energy Consumption and Exhaust Emissions of a Hybrid Vehicle in an Urban Road Driving Cycle—Comparison of Road and Chassis Dynamometer Tests

 ,
,  ,
, 
 , ,
, ,  , and
, and
Abstract
1. Introduction
2. Research Methodology

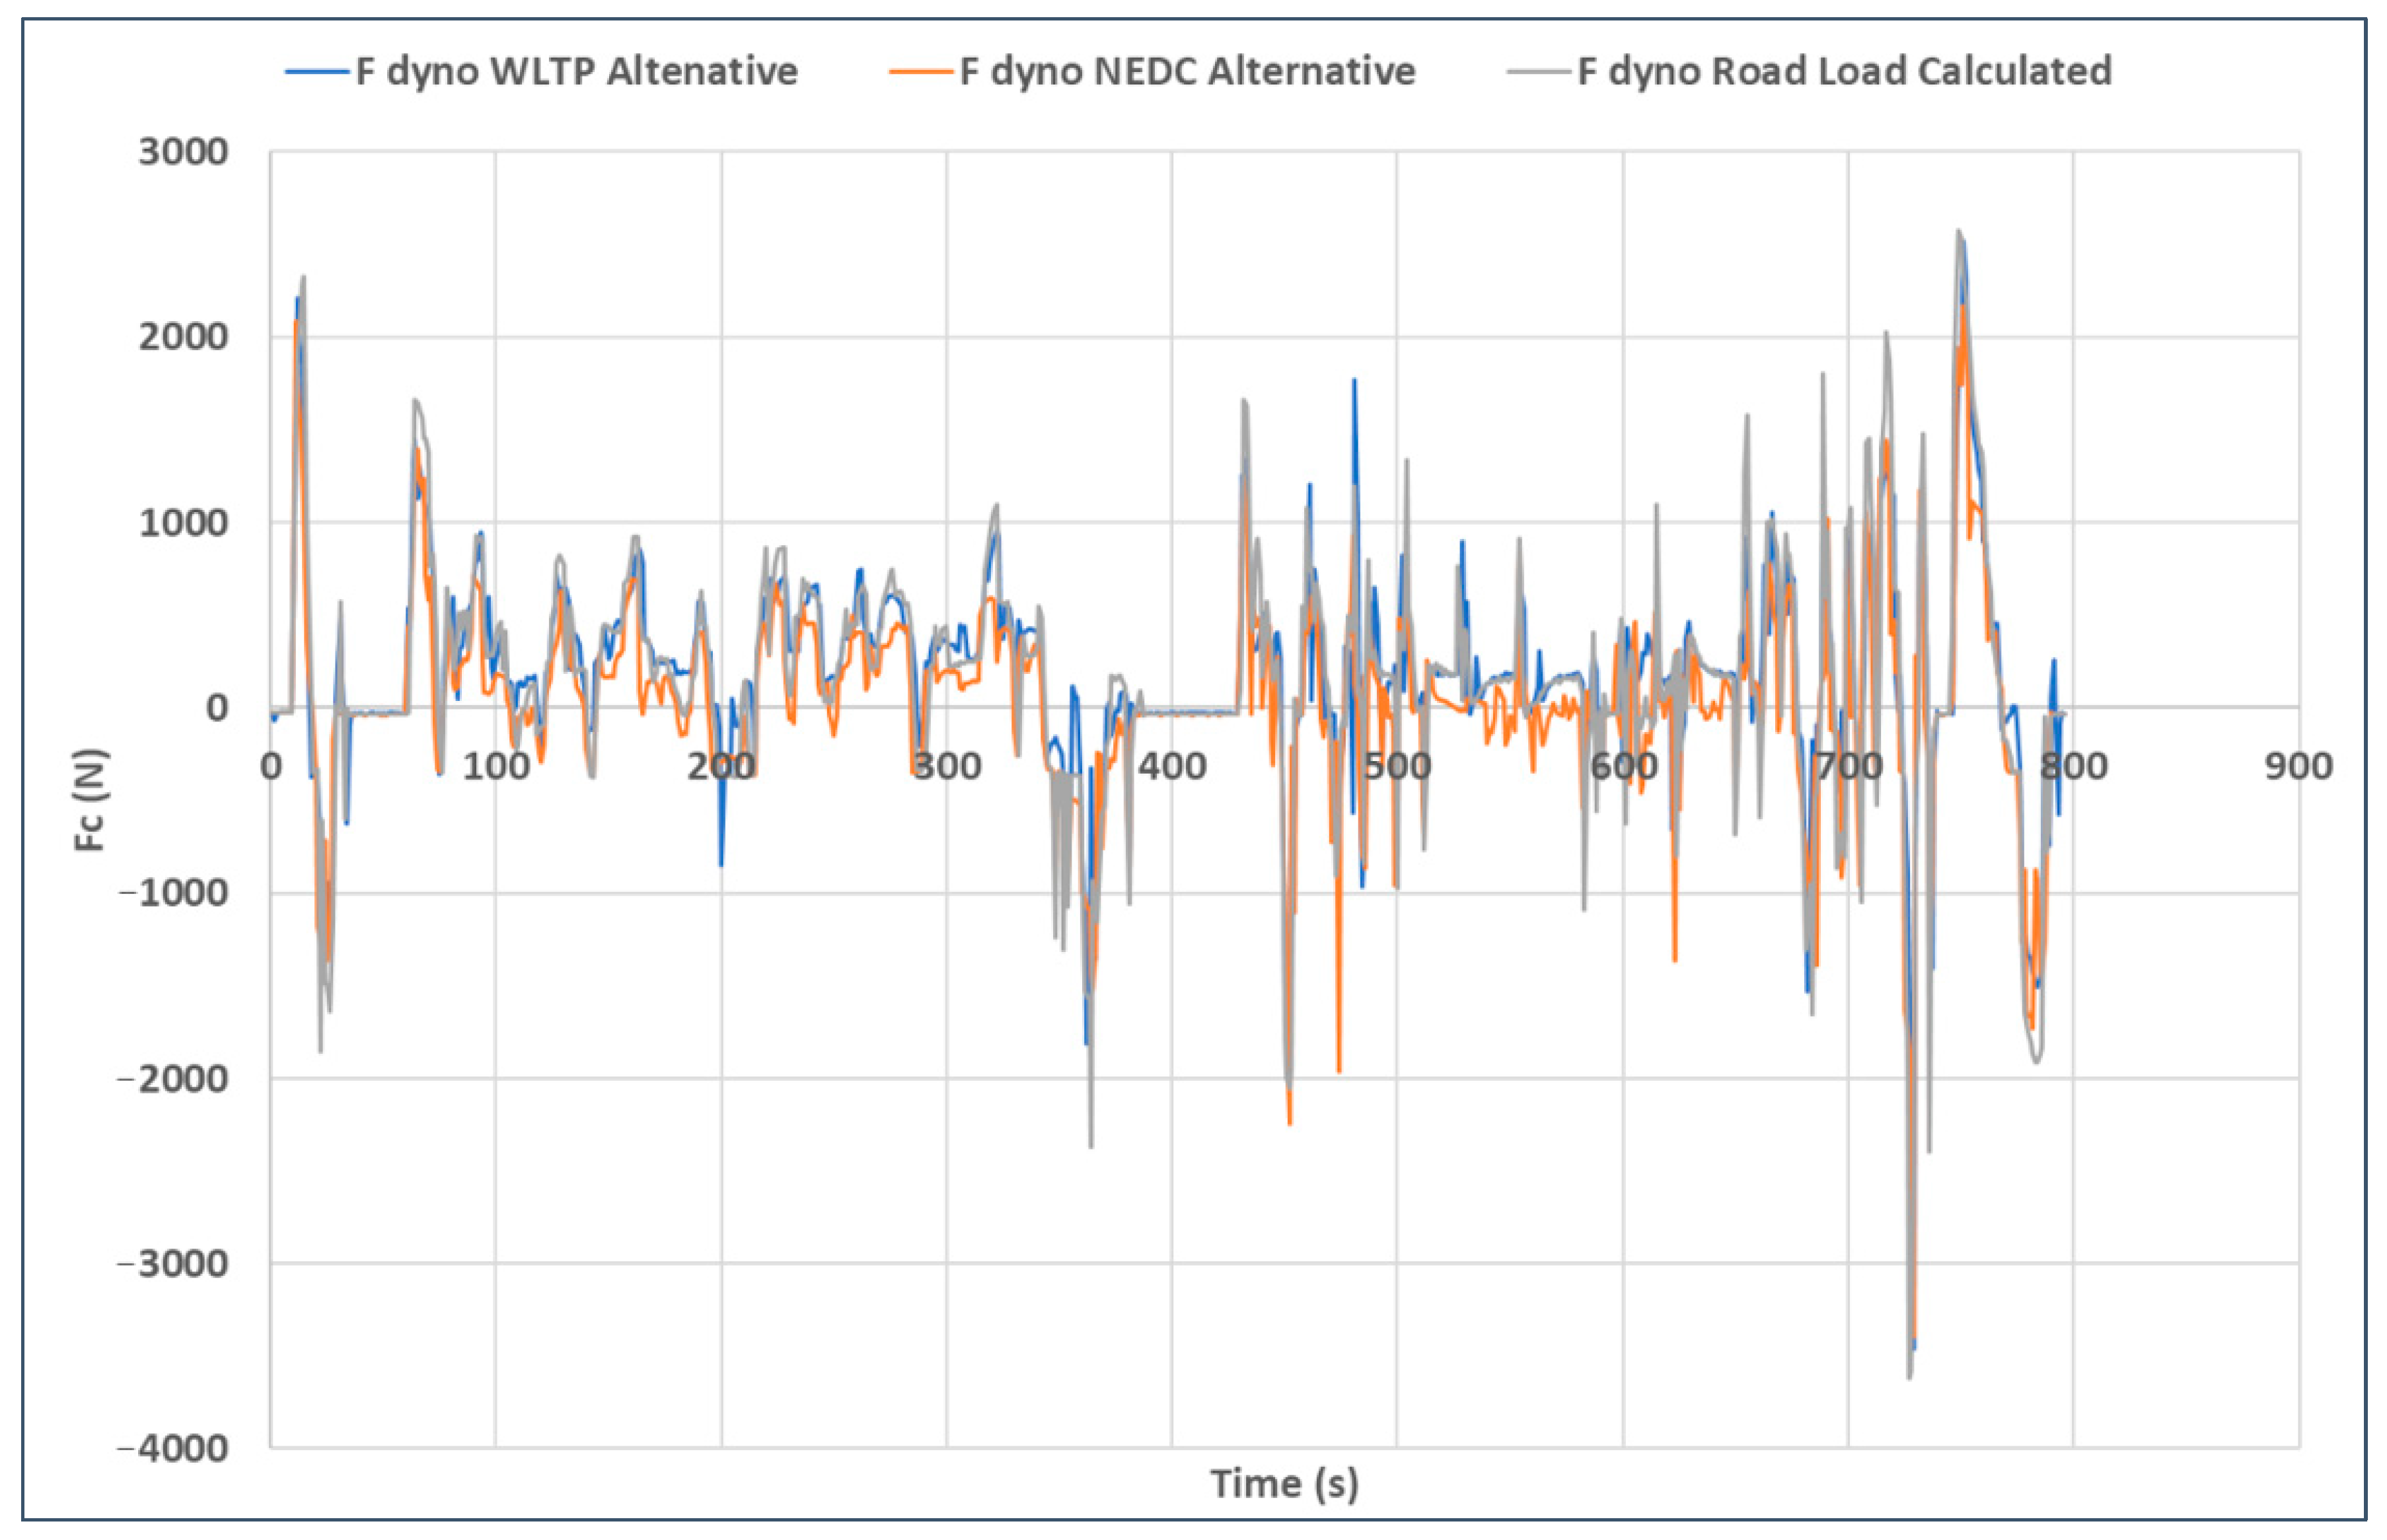
| Parameter | NEDC Alternative | Road Load Calculated | WLTP Alternative |
|---|---|---|---|
| X0 or A0 (N) | 6.8 | 161.2 | 178.4 |
| X1 (N/(km/h)) | 0 | 0 | 0 |
| X2 or B0 (N/(km/h)2) | 0.046 | 0.0346 | 0.0471 |
| Equivalent inertia (kg) | 1250 | 1565 | 1274 |
3. Results and Discussion
4. Conclusions
- comparison of road and chassis dynamometer test results for the road driving cycle,
- identification of the differences between test results for the adopted motion resistance functions,
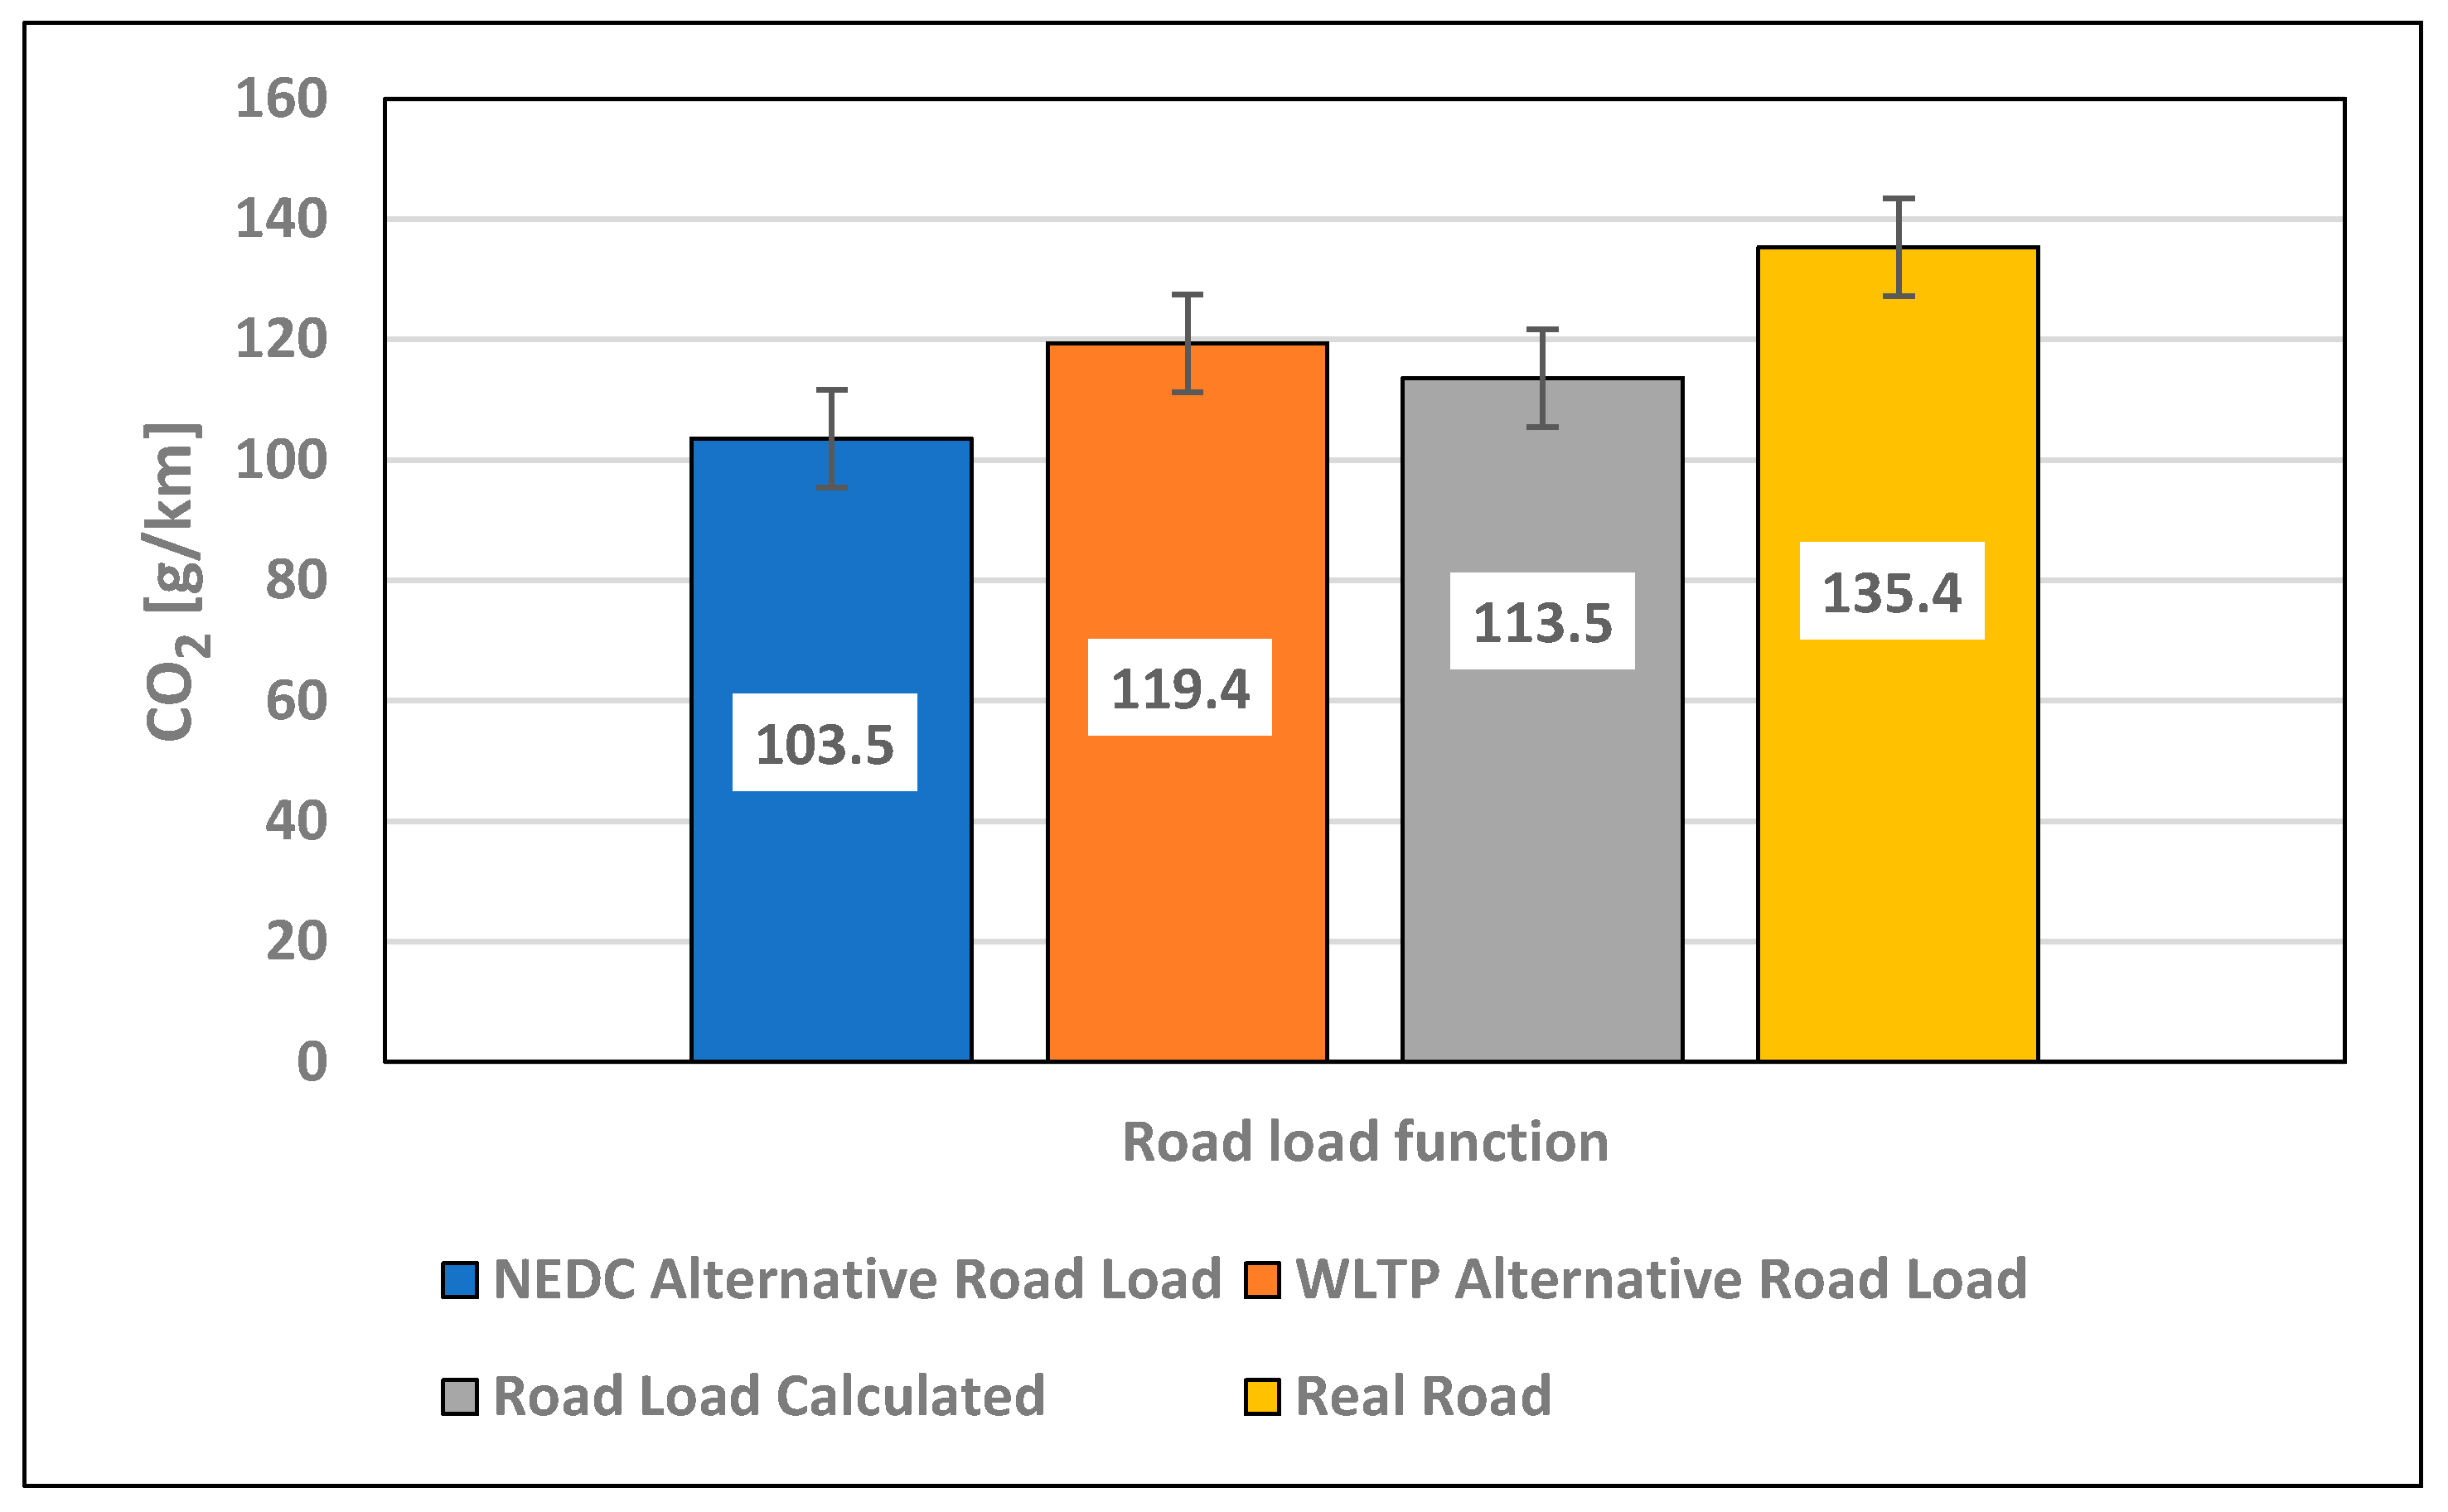
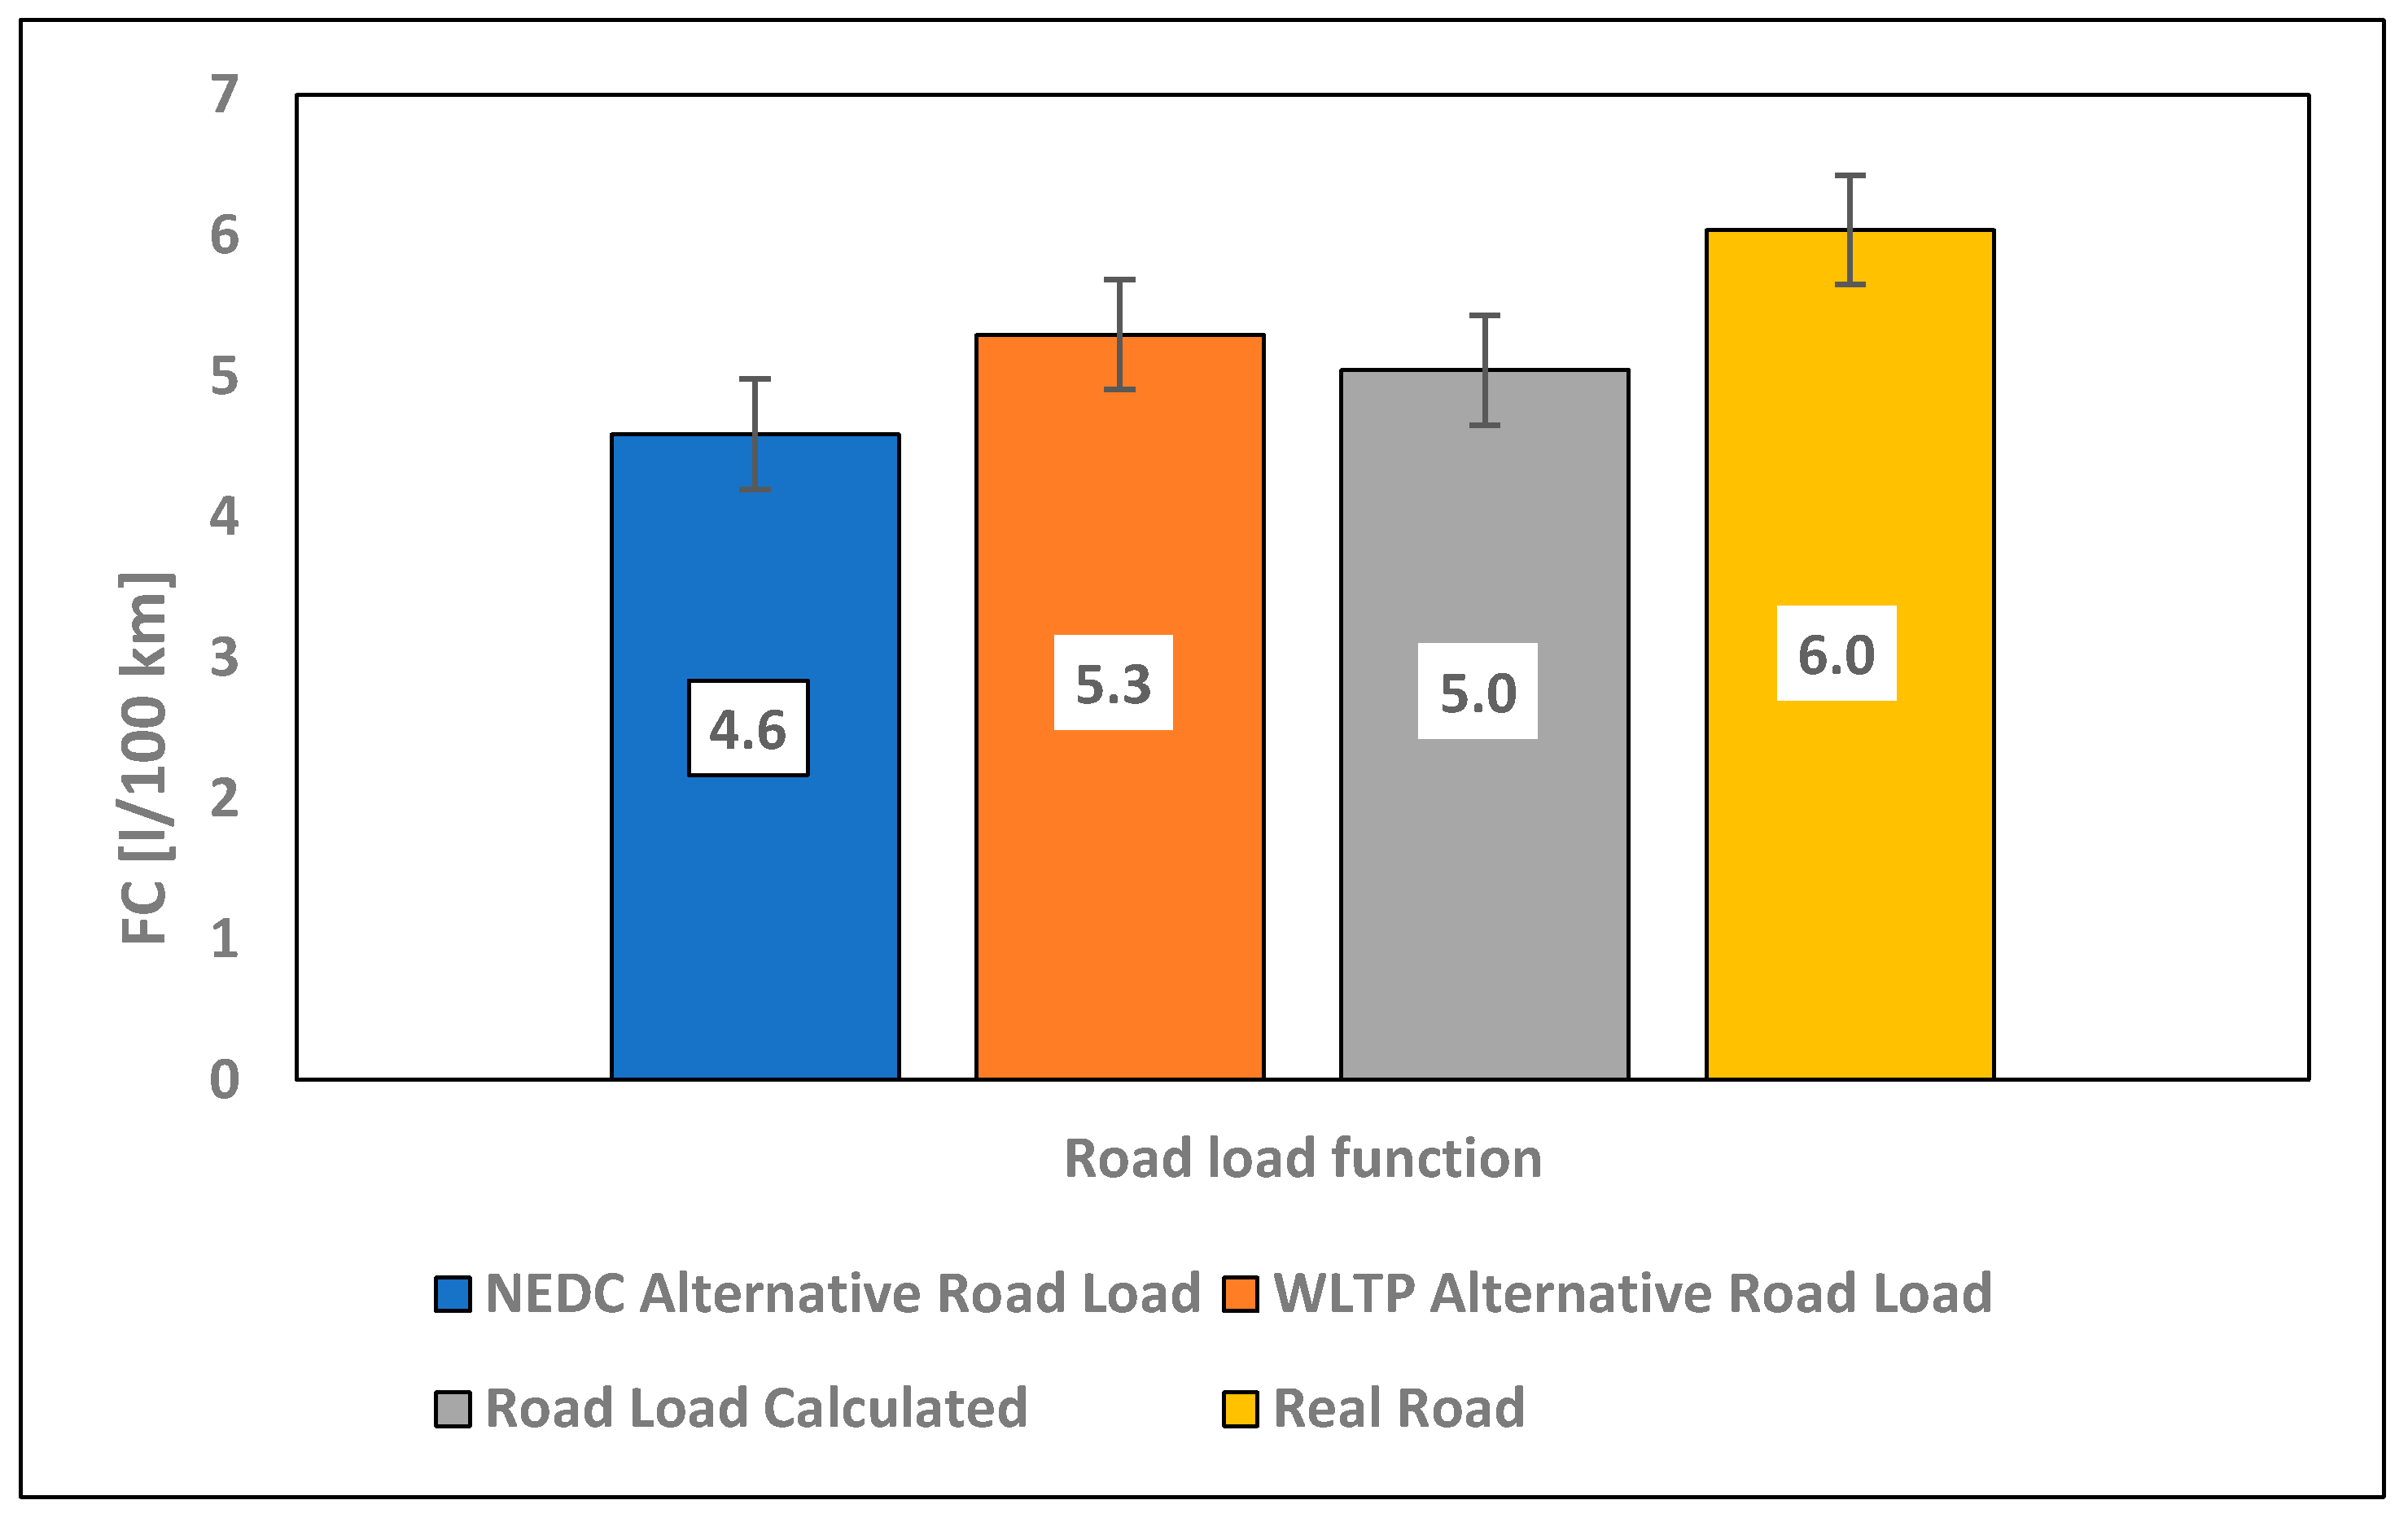
- confirmation that in chassis dynamometer tests, for the same driving cycle, the WLTP alternative method’s drag function gives the most similar CO2 emissions and fuel consumption results relative to values obtained in road tests, and can be used in the absence of manufacturer information of the resistance function,
- identification of the factors influencing the differences between road and laboratory test results.
Author Contributions
Funding
Conflicts of Interest
Abbreviations
| AVL | Anstalt für Verbrennungskraftmaschinen List |
| CLD | Chemiluminescence Detector |
| CO | Carbon monoxide |
| CO2 | Carbon dioxide |
| EC | Energy consumption |
| FC | Fuel consumption |
| FID | Flame Ionization Detector |
| FTP | Federal Test Procedure |
| FTIR | Fourier transform infrared |
| LHV | Lower heating value |
| NEDC | New European Driving Cycle |
| NOx | Nitrogen oxides |
| PEMS | Portable Emissions Measurement Systems |
| PHEV | Plug-in hybrid electric vehicle |
| RDE | Real driving emissions |
| SOC | State of charge |
| THC | Total hydrocarbons |
| TWC | Three-way catalytic converter |
| UDC | Urban Driving Cycle |
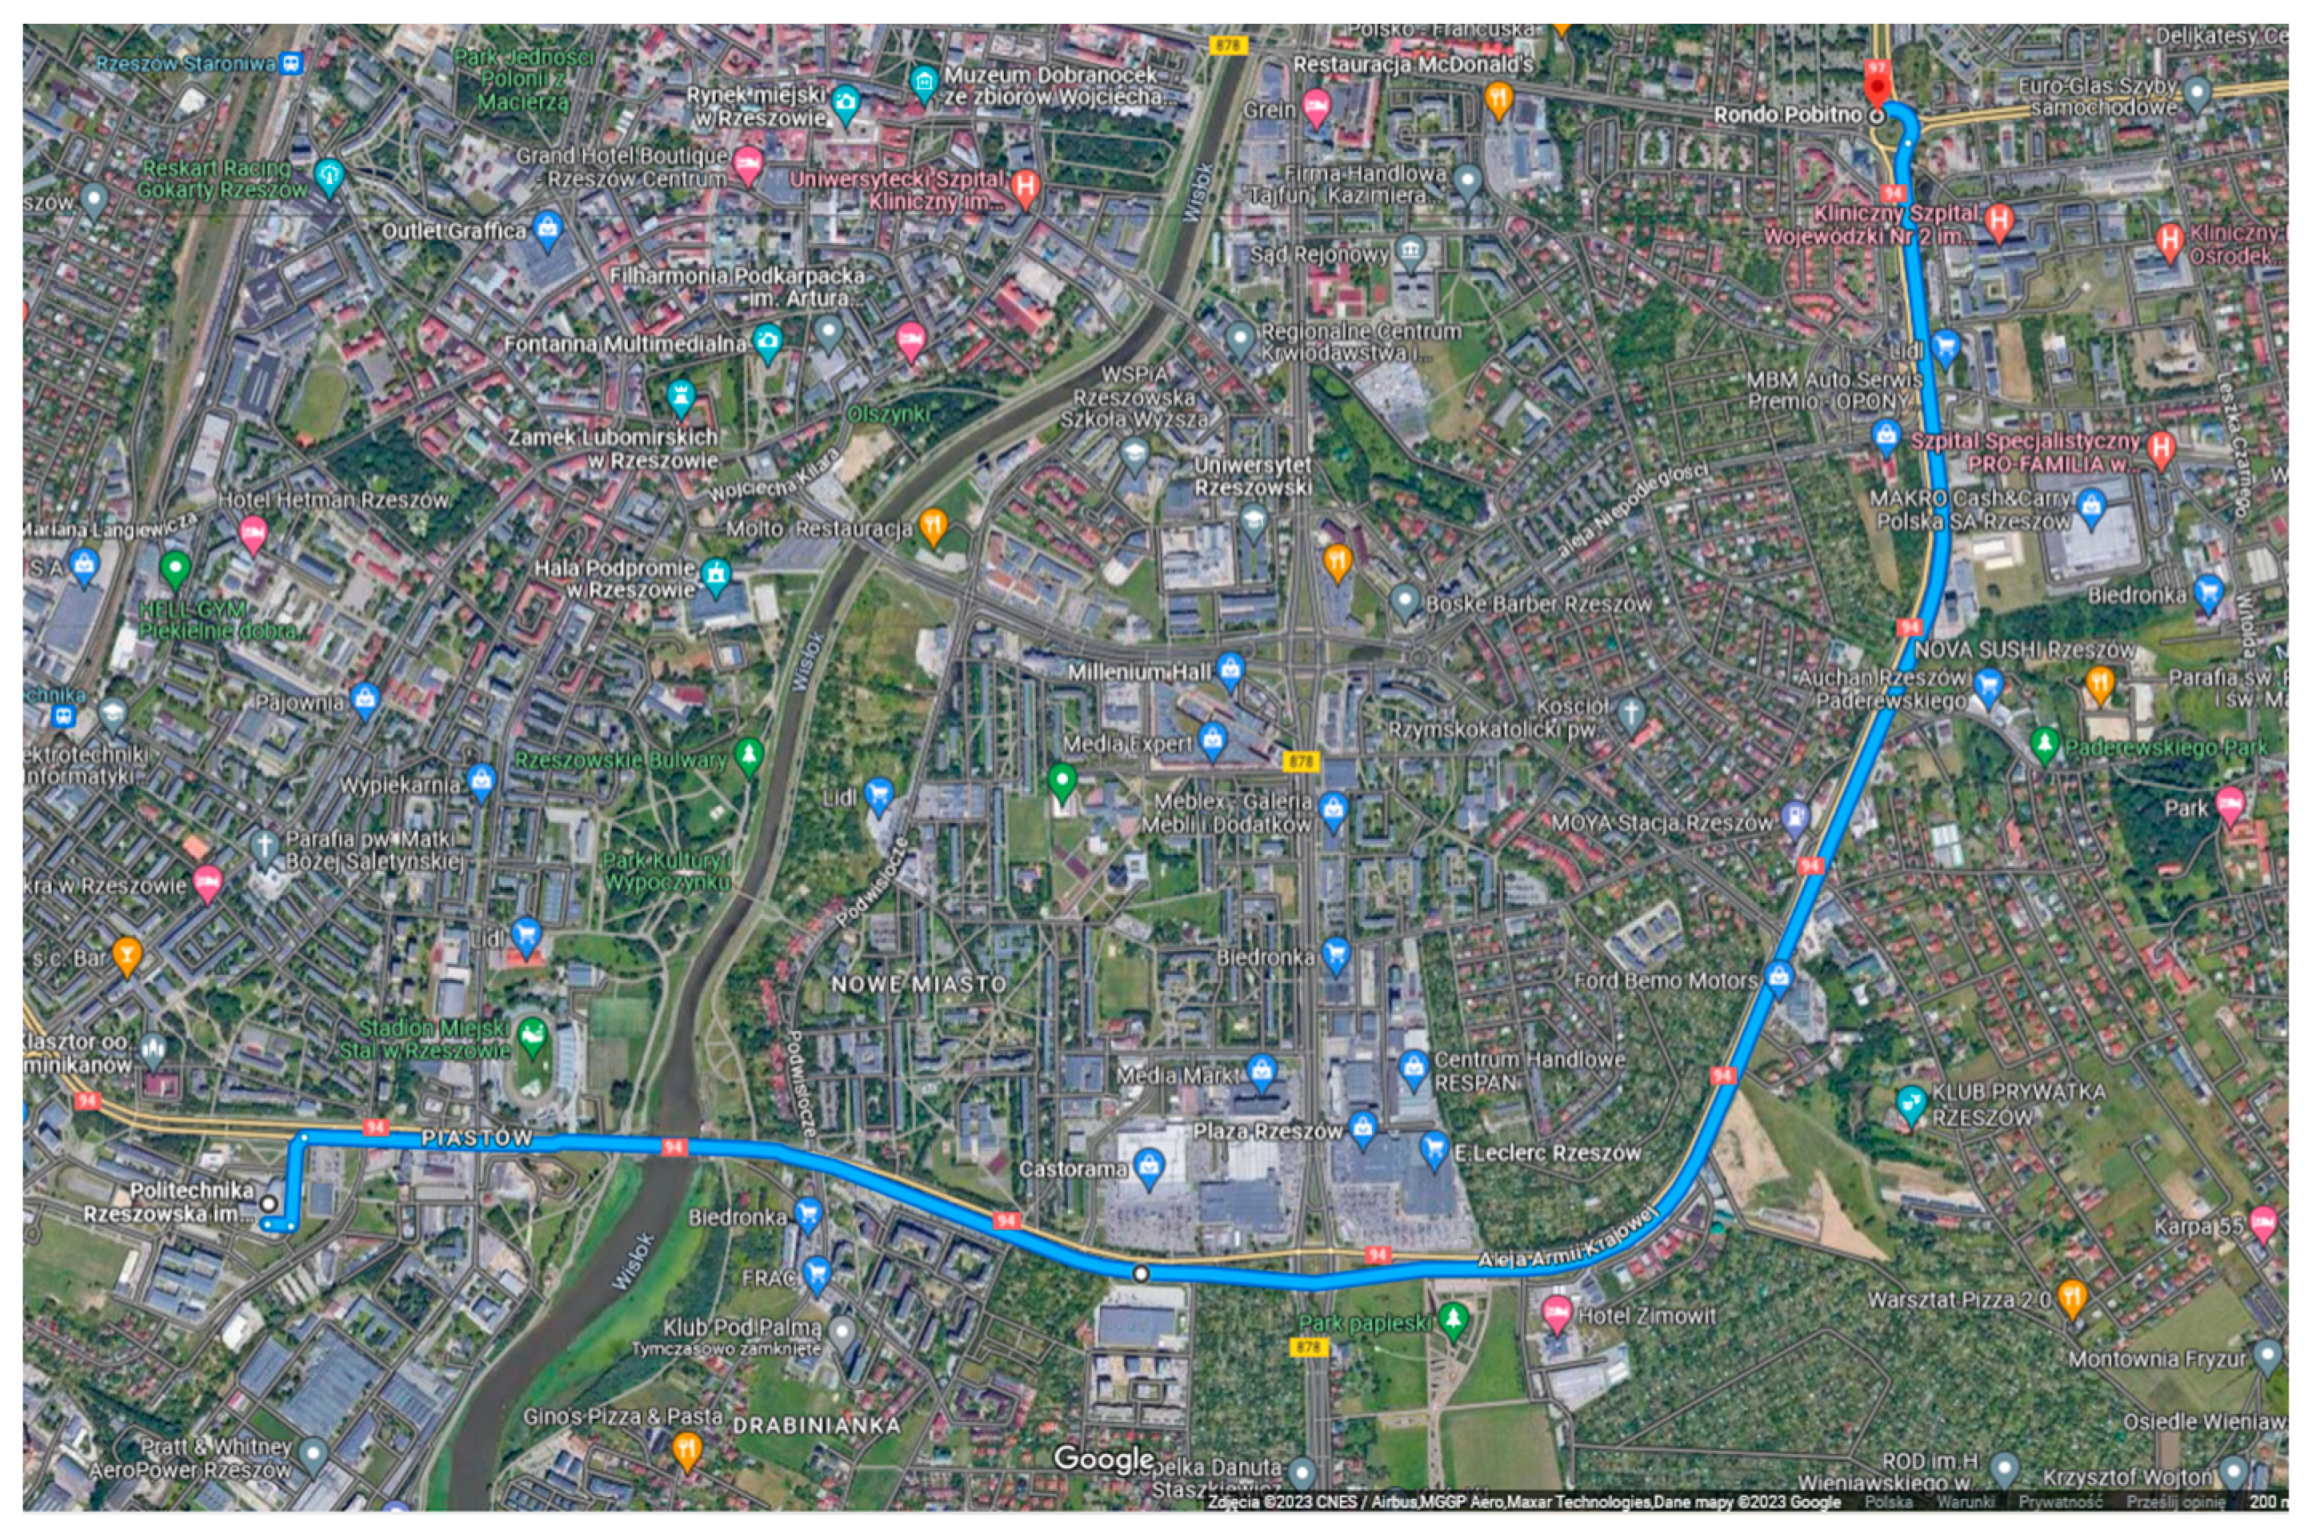
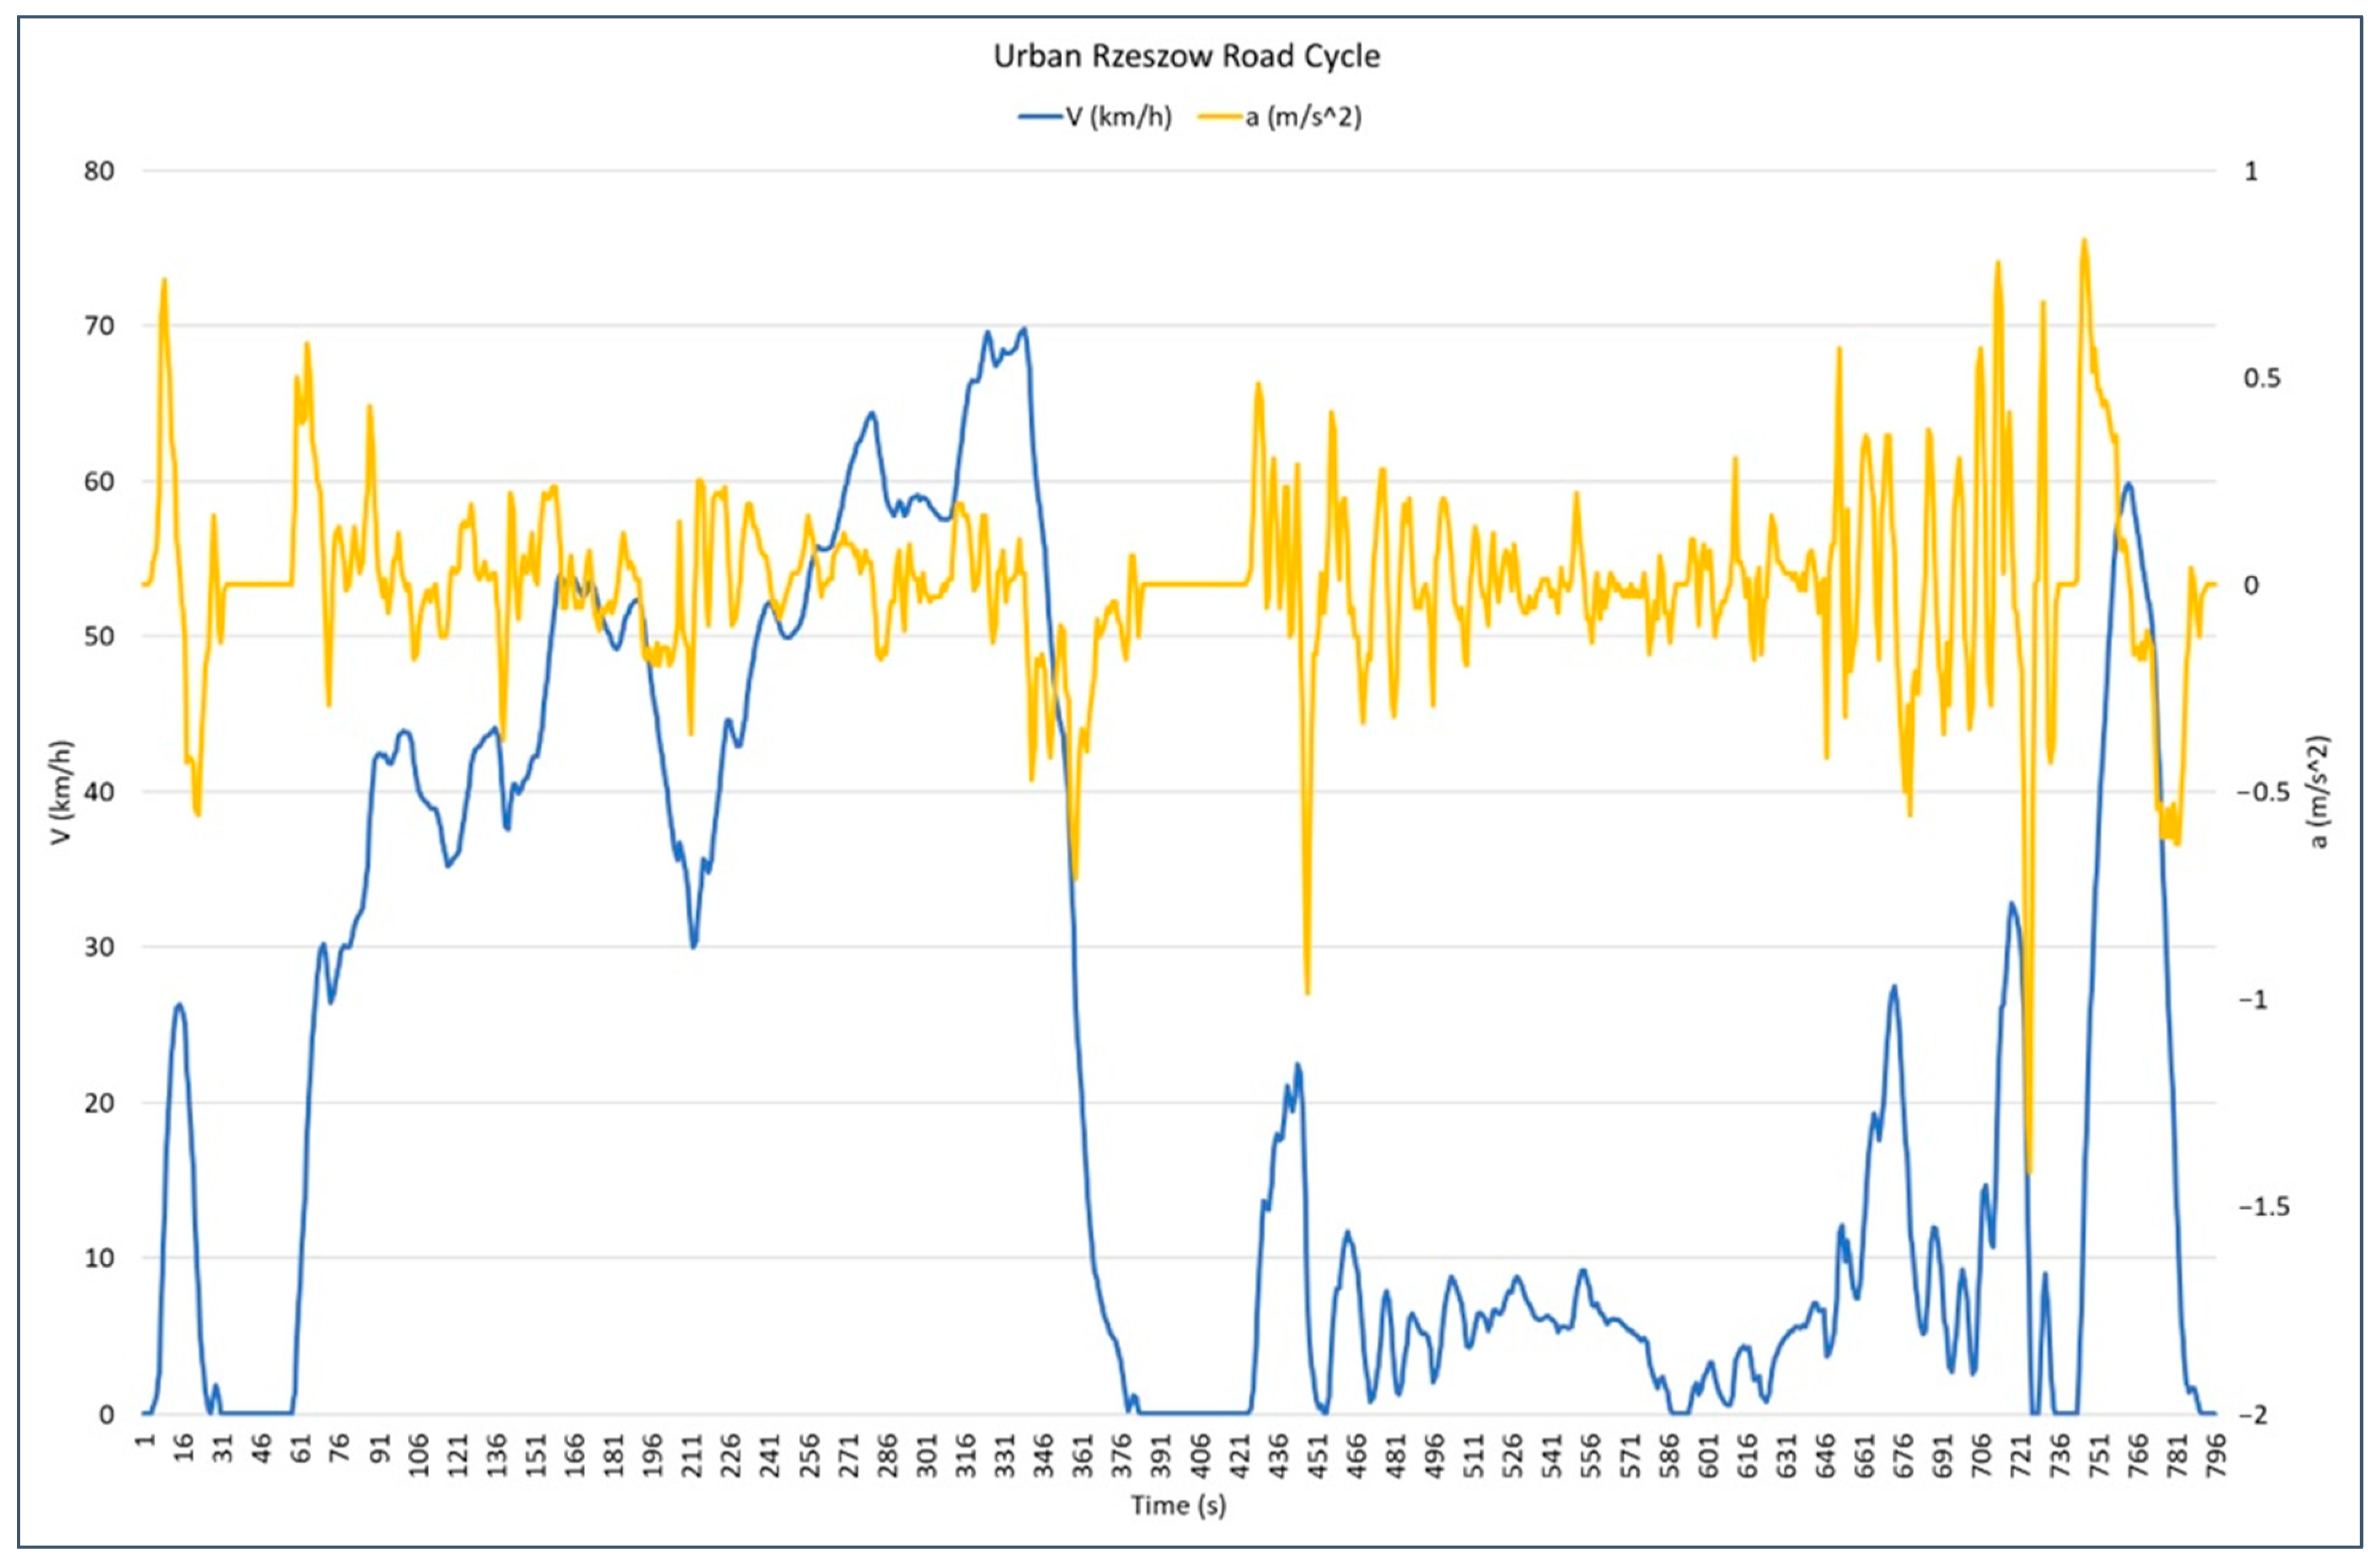
| URRC | Urban Rzeszow Road Cycle |
| WLTP | Worldwide Harmonized Light Vehicle Test Procedure |
| WLTC | World-wide harmonized Light duty Test Cycle |
References
- Skobiej, K.; Pielecha, J. Analysis of the Exhaust Emissions of Hybrid Vehicles for the Current and Future RDE Driving Cycle. Energies 2022, 15, 8691. [Google Scholar] [CrossRef]
- Skobiej, K.; Pielecha, J. Plug-in Hybrid Ecological Category in Real Driving Emissions. Energies 2021, 14, 2340. [Google Scholar] [CrossRef]
- Mądziel, M.; Campisi, T.; Jaworski, A.; Tesoriere, G. The Development of Strategies to Reduce Exhaust Emissions from Passenger Cars in Rzeszow City-Poland A Preliminary Assessment of the Results Produced by the Increase of E-Fleet. Energies 2021, 14, 1046. [Google Scholar] [CrossRef]
- Ma, C.; Madaniyazi, L.; Xie, Y. Impact of the Electric Vehicle Policies on Environment and Health in the Beijing-Tianjin-Hebei Region. Int. J. Environ. Res. Public Health 2021, 18, 623. [Google Scholar] [CrossRef] [PubMed]
- Gai, Y.; Minet, L.; Posen, I.D.; Smargiassi, A.; Tétreault, L.F.; Hatzopoulou, M. Health and climate benefits of electric vehicle deployment in the greater Toronto and Hamilton area. Environ. Pollut. 2020, 265, 114983. [Google Scholar] [CrossRef] [PubMed]
- Zare, A.; Stevanovic, S.; Jafari, M.; Verma, P.; Babaie, M.; Yang, L.; Rahman, M.M.; Ristovski, Z.D.; Brown, R.J.; Bodisco, T.A. Analysis of cold-start NO2 and NOx emissions, and the NO2/NOx ratio in a diesel engine powered with different diesel-biodiesel blends. Environ. Pollut. 2021, 290, 118052. [Google Scholar] [CrossRef]
- Liang, Z.; Yu, Z.; Liu, H.; Chen, L.; Huang, X. Combustion and emission characteristics of a compression ignition engine burning a wide range of conventional hydrocarbon and alternative fuels. Energy 2022, 250, 123717. [Google Scholar] [CrossRef]
- Liang, Z.; Salehi, F.; Yu, Z.; Wang, C.; Chen, L. Characterizing the gaseous and particulate SVOC emissions of a commercial light-duty compression ignition engine via GCxGC-ToF-MS. Fuel 2021, 284, 118918. [Google Scholar] [CrossRef]
- Chen, L.; Liang, Z.; Liu, H.; Ding, S.; Li, Y. Sensitivity analysis of fuel types and operational parameters on the particulate matter emissions from an aviation piston engine burning heavy fuels. Fuel 2017, 202, 520–528. [Google Scholar] [CrossRef]
- Pielecha, J.; Skobiej, K.; Kubiak, P.; Wozniak, M.; Siczek, K. Exhaust Emissions from Plug-in and HEV Vehicles in Type-Approval Tests and Real Driving Cycles. Energies 2022, 15, 2423. [Google Scholar] [CrossRef]
- Mądziel, M.; Jaworski, A.; Kuszewski, H.; Woś, P.; Campisi, T.; Lew, K. The Development of CO2 Instantaneous Emission Model of Full Hybrid Vehicle with the Use of Machine Learning Techniques. Energies 2022, 15, 142. [Google Scholar] [CrossRef]
- Lijewski, P.; Ziolkowski, A.; Daszkiewicz, P.; Andrzejewski, M.; Gallas, D. Comparison of CO2 emissions and fuel consumption of a hybrid vehicle and a vehicle with a direct gasoline injection engine. IOP Conf. Ser. Mater. Sci. Eng. 2018, 421, 042046. [Google Scholar] [CrossRef]
- Lorf, C.; Martinez-Botas, R.; Howey, D.; Lytton, L.; Cussons, B. Comparative analysis of the energy consumption and CO2 emissions of 40 electric, plug-in hybrid electric, hybrid electric and internal combustion engine vehicles. Transp. Res. 2013, 23, 12–19. [Google Scholar] [CrossRef]
- Ahn, K.; Park, S.; Rakha, H.A. Impact of Intersection Control on Battery Electric Vehicle Energy Consumption. Energies 2020, 13, 3190. [Google Scholar] [CrossRef]
- Merl, R.; Jung, C.; Huss, A.; Klumaier, K. Innovative Solutions for the Calibration of Hybrid Drives. ATZ Worldw. 2020, 122, 38–43. [Google Scholar] [CrossRef]
- Lü, X.; Wu, Y.; Lian, J.; Zhang, Y.; Chen, C.; Wang, P.; Meng, L. Energy management of hybrid electric vehicles: A review of energy optimization of fuel cell hybrid power system based on genetic algorithm. Energy Conv. Manag. 2020, 205, 112474. [Google Scholar] [CrossRef]
- Orecchini, F.; Santiangeli, A.; Zuccari, F.; Alessandrini, A.; Cignini, F.; Ortenzi, F. Real Drive Truth Test of the Toyota Yaris Hybrid 2020 and Energy Analysis Comparison with the 2017 Model. Energies 2021, 14, 8032. [Google Scholar] [CrossRef]
- Szałek, A.; Pielecha, I. The Influence of Engine Downsizing in Hybrid Powertrains on the Energy Flow Indicators under Actual Traffic Conditions. Energies 2021, 14, 2872. [Google Scholar] [CrossRef]
- Orecchini, F.; Santiangeli, A.; Zuccari, F.; Ortenzi, F.; Genovese, A.; Spazzafumo, G.; Nardone, L. Energy consumption of a last generation full hybrid vehicle compared with a conventional vehicle in real drive conditions. Energy Procedia 2018, 148, 289–296. [Google Scholar] [CrossRef]
- Pielecha, I.; Cieslik, W.; Szwajca, F. Energy Flow and Electric Drive Mode Efficiency Evaluation of Different Generations of Hybrid Vehicles under Diversified Urban Traffic Conditions. Energies 2023, 16, 794. [Google Scholar] [CrossRef]
- Fontaras, G.; Zacharof, N.-G.; Ciuffo, B. Fuel consumption and CO2 emissions from passenger cars in Europe—Laboratory versus real-world emissions. Prog. Energy Combust. Sci. 2017, 60, 97–131. [Google Scholar] [CrossRef]
- Merkisz, J.; Pielecha, J.; Bielaczyc, P.; Woodburn, J.; Szalek, A. A Comparison of Tailpipe Gaseous Emissions from the RDE and WLTP Test Procedures on a Hybrid Passenger Car; SAE Technical Paper No. 2020-01-2217; SAE: Warrendale, PA, USA, 2020. [Google Scholar] [CrossRef]
- Riemersma, I.; Mock, P. Too Low to be True? How to Measure Fuel Consumption and CO2 Emissions of Plug-In Hybrid Vehicles, Today and in the Future. The International Council on Clean Transportation. 2017. Available online: https://theicct.org/sites/default/files/publications/EU-PHEV_ICCT-Briefing-Paper_280717_vF.pdf (accessed on 21 November 2021).
- García-Contreras, R.; Soriano, J.A.; Fernández-Yáñez, P.; Sánchez-Rodríguez, L.; Mata, C.; Gómez, A.; Armas, O.; Cárdenas, M.D. Impact of regulated pollutant emissions of Euro 6d-Temp light-duty diesel vehicles under real driving conditions. J. Clean. Prod. 2021, 286, 124927. [Google Scholar] [CrossRef]
- Triantafyllopoulos, G.; Katsaounis, D.; Karamitros, D.; Ntziachristos, L.; Samaras, Z. Experimental assessment of the potential to decrease diesel NOx emissions beyond minimum requirements for Euro 6 Real Drive Emissions (RDE) compliance. Sci. Total Environ. 2018, 618, 1400–1407. [Google Scholar] [CrossRef] [PubMed]
- Tansini, A.; Pavlovic, J.; Fontaras, G. Quantifying the real-world CO2 emissions and energy consumption of modern plug-in hybrid vehicles. J. Clean. Prod. 2022, 362, 132191. [Google Scholar] [CrossRef]
- Pavlovic, J.; Fontaras, G.; Ktistakis, M.; Anagnostopoulos, K.; Komnos, D.; Ciuffo, B.; Clairotte, M.; Valverde, V. Understanding the origins and variability of the fuel consumption gap: Lessons learned from laboratory tests and a real-driving campaign. Environ. Sci. Eur. 2020, 32, 53. [Google Scholar] [CrossRef]
- Lejda, K.; Jaworski, A.; Mądziel, M.; Balawender, K.; Ustrzycki, A.; Savostin-Kosiak, D. Assessment of Petrol and Natural Gas Vehicle Carbon Oxides Emissions in the Laboratory and On-Road Tests. Energies 2021, 14, 1631. [Google Scholar] [CrossRef]
- Tietge, U.; Zacharof, N.; Mock, P.; Franco, V.; German, J.; Bandivadekar, A.; Ligterink, N.; Lambrecht, U. From laboratory to road—A 2015 update of official and “real-world” fuel consumption and CO2 values for passenger cars in Europe. Int. Counc. Clean Transp. 2015, 49, 847129-102. [Google Scholar]
- Kadijk, G.; Verbeek, R.; Smokers, R.; Spreen, J.; Patuleia, A.; Van Ras, M. Supporting Analysis Regarding Test Procedure Flexibilities and Technology Deployment for Review of the Light Duty Vehicle CO2 Regulations; European Commission: Brussel, Belgium, 2012. [Google Scholar] [CrossRef]
- Fontaras, G.; Ciuffo, B.; Zacharof, N.; Tsiakmakis, S.; Marotta, A.; Pavlovic, J.; Anagnostopoulos, K. The difference between reported and real-world CO2 emissions: How much improvement can be expected by WLTP introduction? Transp. Res. Procedia 2017, 25, 3933–3943. [Google Scholar] [CrossRef]
- Pavlovic, J.; Marotta, A.; Ciuffo, B. CO2 emissions and energy demands of vehicles tested under the NEDC and the new WLTP type approval test procedures. Appl. Energy 2016, 177, 661–670. [Google Scholar] [CrossRef]
- Tsiakmakis, S.; Fontaras, G.; Cubito, C.; Pavlovic, J.; Anagnostopoulos, K.; Ciuffo, B. From NEDC to WLTP: Effect on the Type-Approval CO2 Emissions of Light-Duty Vehicles; Publications Office of the European Union: Brussels, Belgium, 2017; p. 50. [Google Scholar]
- Liu, X.; Zhao, F.; Hao, H.; Chen, K.; Liu, Z.; Babiker, H.; Amer, A.A. From NEDC to WLTP: Effect on the Energy Consumption, NEV Credits, and Subsidies Policies of PHEV in the Chinese Market. Sustainability 2020, 12, 5747. [Google Scholar] [CrossRef]
- Jaworski, A.; Mądziel, M.; Lew, K.; Campisi, T.; Woś, P.; Kuszewski, H.; Wojewoda, P.; Ustrzycki, A.; Balawender, K.; Jakubowski, M. Evaluation of the Effect of Chassis Dynamometer Load Setting on CO2 Emissions and Energy Demand of a Full Hybrid Vehicle. Energies 2022, 15, 122. [Google Scholar] [CrossRef]
- Jaworski, A.; Mądziel, M.; Kuszewski, H.; Lejda, K.; Balawender, K.; Jaremcio, M.; Jakubowski, M.; Woś, P.; Lew, K. The Impact of Driving Resistances on the Emission of Exhaust Pollutants from Vehicles with the Spark Ignition Engine Fuelled by Petrol and LPG; SAE Technical Paper No. 2020-01-2206; SAE: Warrendale, PA, USA, 2020. [Google Scholar] [CrossRef]
- Kadijk, G.; Ligterink, N. Road Load Determination of Passenger Cars. Available online: https://www.tno.nl/media/1971/road_load_determination_passenger_cars_tno_r10237.pdf (accessed on 3 April 2019).
- Kühlwein, J. The Impact of Official Versus Real-World Road Loads on CO2 Emissions and Fuel Consumption of European Passenger Cars. The International Council on a Clean Transportation. White Paper. 2016. Available online: https://www.theicct.org/sites/default/files/publications/ICCT_Coastdowns-EU_201605.pdf (accessed on 12 April 2019).
- Jaworski, A.; Mądziel, M.; Lejda, K. Creating an emission model based on portable emission measurement system for the purpose of a roundabout. Environ. Sci. Pollut. Res. 2019, 26, 21641. [Google Scholar] [CrossRef] [PubMed]
- Mądziel, M.; Campisi, T.; Jaworski, A.; Kuszewski, H.; Woś, P. Assessing Vehicle Emissions from a Multi-Lane to Turbo Roundabout Conversion Using a Microsimulation Tool. Energies 2021, 14, 4399. [Google Scholar] [CrossRef]
- Szumska, E.M.; Jurecki, R. The Analysis of Energy Recovered during the Braking of an Electric Vehicle in Different Driving Conditions. Energies 2022, 15, 9369. [Google Scholar] [CrossRef]
- Szumska, E.M.; Jurecki, R. The Effect of Aggressive Driving on Vehicle Parameters. Energies 2020, 13, 6675. [Google Scholar] [CrossRef]
- Kurtyka, K.; Pielecha, J. The evaluation of exhaust emission in RDE tests including dynamic driving conditions. Transport. Res. Proc. 2019, 40, 338e345. [Google Scholar] [CrossRef]
- Pielecha, J.; Skobiej, K.; Kurtyka, K. Exhaust Emissions and Energy Consumption Analysis of Conventional, Hybrid, and Electric Vehicles in Real Driving Cycles. Energies 2020, 13, 6423. [Google Scholar] [CrossRef]
- Mock, P.; German, J.; Bandivadekar, A.; Riemersma, I. Discrepancies between Type-Approval and “Real-World” Fuel-Consumption and CO2 Values in 2001–2011 European Passenger Cars. ICCT, International Council on Clean Transportation. 2012. Available online: https://theicct.org/wp-content/uploads/2021/06/ICCT_EU_fuelconsumption2_workingpaper_2012.pdf (accessed on 10 December 2022).
- Ivanov, Y.; Ivanov, R.; Kadikyanov, G.; Staneva, G.; Danilov, I. A study of the fuel consumption of hybrid car Toyota Yaris. Transport Problems. Transp. Probl. 2019, 14, 155–167. [Google Scholar] [CrossRef]
- Jaworski, A.; Kuszewski, H.; Ustrzycki, A.; Balawender, K. Analysis of the repeatability of exhaust pollutans emission research for cold and hot starts under controlled driving cycle conditions. Environ. Sci. Pollut. Res. 2018, 25, 17862–17877. [Google Scholar] [CrossRef]
- Jaworski, A.; Mądziel, M.; Kuszewski, H.; Lejda, K.; Balawender, K.; Jaremcio, M.; Jakubowski, M.; Wojewoda, P.; Lew, K.; Ustrzycki, A. Analysis of Cold Start Emission from Light Duty Vehicles Fueled with Gasoline and LPG for Selected Ambient Temperatures; SAE Technical Paper No. 2020-01-2207; SAE: Warrendale, PA, USA, 2020. [Google Scholar] [CrossRef]
- Melas, A.; Selleri, T.; Franzetti, J.; Ferrarese, C.; Suarez-Bertoa, R.; Giechaskiel, B. On-Road and Laboratory Emissions from Three Gasoline Plug-In Hybrid Vehicles-Part 2: Solid Particle Number Emissions. Energies 2022, 15, 5266. [Google Scholar] [CrossRef]
- Wang, Y.; Wen, Y.; Zhu, Q.; Luo, J.; Yang, Z.; Su, S.; Wang, X.; Hao, L.; Tan, J.; Yin, H.; et al. Real driving energy consumption and CO2 & pollutant emission characteristics of a parallel plug-in hybrid electric vehicle under different propulsion modes. Energy 2022, 244, 123076. [Google Scholar] [CrossRef]
- Šmigins, R.; Pīrs, V.; Berjoza, D. Investigation in fuel consumption of a hybrid and conventional vehicle. Agron. Res. 2020, 18, 1027–1035. [Google Scholar] [CrossRef]
- Mamala, J.; Graba, M.; Bieniek, A.; Prażnowski, K.; Augustynowicz, A.; Śmieja, M. Study of energy consumption of a hybrid vehicle in real-world conditions. Eksploat. I Niezawodn. Maint. Reliab. 2021, 23, 636–645. [Google Scholar] [CrossRef]
- Orecchini, F.; Santiangeli, A.; Zuccari, F. Real Drive Well-to-Wheel Energy Analysis of Conventional and Electrified Car Powertrains. Energies 2020, 13, 4788. [Google Scholar] [CrossRef]
- Plötz, P.; Link, S.; Ringelschwendner, H.; Keller, M.; Moll, C.; Bieker, G.; Dornoff, J.; Mock, P. Real-World Usage of Plug-In Hybrid Vehicles in Europe: A 2022 Update on Fuel Consumption, Electric Driving, and CO2 Emissions. Available online: https://theicct.org/wp-content/uploads/2022/06/real-world-phev-use-jun22.pdf (accessed on 8 June 2022).
- Bieniek, A.; Graba, M.; Mamala, J.; Prażnowski, K.; Hennek, K. Energy consumption of a passenger car with a hybrid powertrain in real traffic conditions. Combust. Engines 2022, 191, 15–22. [Google Scholar] [CrossRef]
- Ferreira, H.; Rodrigues, C.M.; Pinho, C. Impact of Road Geometry on Vehicle Energy Consumption and CO2 Emissions: An Energy-Efficiency Rating Methodology. Energies 2020, 13, 119. [Google Scholar] [CrossRef]
- Degeilh, P.; Prevost, V.; Kermani, J.; Dauphin, R. Evaluation of Plug-In Hybrid Vehicles in Real-World Conditions. Concawe Report No. 10/22. Available online: https://www.concawe.eu/wp-content/uploads/Rpt-10-22.pdf (accessed on 12 March 2023).
- Colin, G.; Chamaillard, Y.; Charlet, A.; Nelson-Gruel, D. Towards a Friendly Energy Management Strategy for Hybrid Electric Vehicles with Respect to Pollution, Battery and Drivability. Energies 2014, 7, 6013–6030. [Google Scholar] [CrossRef]
- Regulation No 83 of the Economic Commission for Europe of the United Nations (UN/ECE)—Uniform Provisions Concerning the Approval of Vehicles with Regard to the Emission of Pollutants According to Engine Fuel Requirements. Available online: https://eur-lex.europa.eu/legal-content/EN/TXT/PDF/?uri=CELEX:42012X0215(01)&from=EN (accessed on 21 May 2016).
- Commission Regulation (EU) 2017/1151. Available online: https://eur-lex.europa.eu/legal-content/EN/TXT/PDF/?uri=CELEX:32017R1151&from=PL (accessed on 2 October 2021).
- Siłka, W. Teoria Ruchu Samochodu; WNT: Warsaw, Poland, 2002. [Google Scholar]
- Giechaskiel, B.; Clairotte, M.; Valverde-Morales, V.; Bonnel, P.; Kregar, Z.; Franco, V.; Dilara, P. Framework for the assessment of PEMS (Portable Emissions Measurement Systems) uncertainty. Environ. Res. 2018, 166, 251–260. [Google Scholar] [CrossRef]
- Ziółkowski, A.; Fuć, P.; Jagielski, A.; Bednarek, M.; Konieczka, S. Comparison of the Energy Consumption and Exhaust Emissions between Hybrid and Conventional Vehicles, as Well as Electric Vehicles Fitted with a Range Extender. Energies 2023, 16, 4669. [Google Scholar] [CrossRef]
- Huang, Y.; Surawski, N.C.; Organ, B.; Zhou, J.L.; Tang, O.H.H.; Chan, E.F.C. Chan, Fuel consumption and emissions performance under real driving: Comparison between hybrid and conventional vehicles. Sci. Total Environ. 2019, 659, 275–282. [Google Scholar] [CrossRef]


| Parameter | Data |
|---|---|
| Year of production | 2020 |
| Kerb weight (kg) | 1123 |
| Electric motor (traction) | Synchronous with permanent magnet |
| Traction battery | Nickel–metal hydride |
| Traction battery voltage (V) | 144 |
| Traction battery capacity (Ah) | 6.5 |
| Maximum torque of the electric motor (Nm) | 169 |
| Maximum power of the electric motor | 45 |
| Odometer (km) | 50,200 |
| Transmission type/number of gears | Automatic, e-CVT |
| Aftertreatment system | TWC |
| Fuel system—gasoline | Multi-point indirect injection |
| Engine capacity (cm3) | 1497 |
| Engine working principle | Spark ignition/4 stroke |
| Maximum engine torque (Nm)/at (rpm) | 111/3600–4400 |
| Maximum net power (kW)/at (rpm) | 54/4800 |
| Fuel type | Gasoline (petrol) |
| Emission standard | Euro 6 d |
| Data | Method/Principle | Accuracy |
|---|---|---|
| CO2 | NDIR—non-dispersive infrared method; range 0–5 vol% to 0–20 vol% | ±2.5% |
| CO | NDIR—non-dispersive infrared method; range 0–10% | ±2.5% |
| NOx | CLD—chemi-luminescence detection method, range 0–100 to 0–3000 ppm | ±2.5% |
| THC | FID—flame ionization detection method; range 0–10,000 ppm | ±2.5% |
| Frequency counter | 1 Hz | |
| Exhaust flow | Pitot tube mass exhaust flow | Within ±1.5% of full scale or within ±2.5% of readings (whichever is larger) |
| Warm-up time | Within 1 h | – |
| Parameter | URRC | UDC | WLTC 3b LOW | WLTC 3b MEDIUM |
|---|---|---|---|---|
| Total distance covered (km) | 5.24 | 4.05 | 3.09 | 4.76 |
| Average speed (km/h) | 23.7 | 18.35 | 18.9 | 39.5 |
| Maximum speed (km/h) | 69.8 | 50 | 56.5 | 76.6 |
| Maximum acceleration (m/s2) | 0.83 | 1.042 | 1.47 | 1.57 |
| Minimum acceleration (m/s2) | −1.42 | −0.99 | −1.47 | −1.49 |
| Lowest route altitude (m) | 199 | – | – | – |
| Highest route altitude (m) | 224 | – | – | – |
| Stop duration (s) | 60 | 228 | 156 | 48 |
| Cycle duration (s) | 795 | 780 | 589 | 433 |
| Parameter | Unit | Value |
|---|---|---|
| Research Octane Number (RON) | – | 95.70 |
| Motor Octane Number (MON) | – | 85.40 |
| Anti-Knock Index (AKI) | – | 90.55 |
| Benzene | % (v/v) | 0.46 |
| Methyl tert-Butyl Ether (MTBE) | % (v/v) | 0.71 |
| Ethyl tert-Butyl Ether (ETBE) | % (v/v) | 2.74 |
| Methyl tert-Amyl Ether (TAME) | % (v/v) | 0.00 |
| Diisopropyl Ether (DIPE) | % (v/v) | 0.14 |
| Ethanol | % (v/v) | 5.10 |
| Methanol | % (v/v) | 0.00 |
| tert-Butyl Alcohol (TBA) | % (v/v) | 0.09 |
| Olefins | % (v/v) | 9.05 |
| Total Aromatics | % (v/v) | 27.90 |
| C7 Aromatics | % (v/v) | 8.60 |
| C8 Aromatics | % (v/v) | 11.20 |
| Saturates | % (v/v) | 54.65 |
| Methylcyclopentadienyl Manganese Tricarbonyl (MMT) | ppm (m/m) | 92.50 |
| Manganese | ppm (m/m) | 23.00 |
| Oxygen | % (m/m) | 2.37 |
| Density at 15 °C | kg/m3 | 740.45 |
| Volatility parameters | ||
| Driveability Index | – | 459.50 |
| Vapor Lock Index | – | 1064.50 |
| Dry Vapor Pressure Equivalent (DVPE) | kPa | 75.85 |
Disclaimer/Publisher’s Note: The statements, opinions and data contained in all publications are solely those of the individual author(s) and contributor(s) and not of MDPI and/or the editor(s). MDPI and/or the editor(s) disclaim responsibility for any injury to people or property resulting from any ideas, methods, instructions or products referred to in the content. |
© 2023 by the authors. Licensee MDPI, Basel, Switzerland. This article is an open access article distributed under the terms and conditions of the Creative Commons Attribution (CC BY) license (https://creativecommons.org/licenses/by/4.0/).
Share and Cite
Jaworski, A.; Kuszewski, H.; Lew, K.; Wojewoda, P.; Balawender, K.; Woś, P.; Longwic, R.; Boichenko, S. Assessment of the Effect of Road Load on Energy Consumption and Exhaust Emissions of a Hybrid Vehicle in an Urban Road Driving Cycle—Comparison of Road and Chassis Dynamometer Tests. Energies 2023, 16, 5723. https://doi.org/10.3390/en16155723
Jaworski A, Kuszewski H, Lew K, Wojewoda P, Balawender K, Woś P, Longwic R, Boichenko S. Assessment of the Effect of Road Load on Energy Consumption and Exhaust Emissions of a Hybrid Vehicle in an Urban Road Driving Cycle—Comparison of Road and Chassis Dynamometer Tests. Energies. 2023; 16(15):5723. https://doi.org/10.3390/en16155723
Chicago/Turabian StyleJaworski, Artur, Hubert Kuszewski, Krzysztof Lew, Paweł Wojewoda, Krzysztof Balawender, Paweł Woś, Rafał Longwic, and Sergii Boichenko. 2023. "Assessment of the Effect of Road Load on Energy Consumption and Exhaust Emissions of a Hybrid Vehicle in an Urban Road Driving Cycle—Comparison of Road and Chassis Dynamometer Tests" Energies 16, no. 15: 5723. https://doi.org/10.3390/en16155723
APA StyleJaworski, A., Kuszewski, H., Lew, K., Wojewoda, P., Balawender, K., Woś, P., Longwic, R., & Boichenko, S. (2023). Assessment of the Effect of Road Load on Energy Consumption and Exhaust Emissions of a Hybrid Vehicle in an Urban Road Driving Cycle—Comparison of Road and Chassis Dynamometer Tests. Energies, 16(15), 5723. https://doi.org/10.3390/en16155723