Article

Is Banning Fossil-Fueled Internal Combustion Engines the First Step in a Realistic Transition to a 100% RES Share?

1
Department of Management and Engineering, University of Padova, 36100 Vicenza, Italy
2
Department of Industrial Engineering, University of Padova, 35131 Padua, Italy
*
Author to whom correspondence should be addressed.
Energies 2023, 16(15), 5690; https://doi.org/10.3390/en16155690
Submission received: 23 June 2023 / Revised: 22 July 2023 / Accepted: 25 July 2023 / Published: 29 July 2023
(This article belongs to the Section B: Energy and Environment)

Abstract

:
Planning the best path for the energy system decarbonization is currently one of the issues of high global interest. At the European level, the recent policies dealing with the transportation sector have decided to ban the registration of light-duty vehicles powered by internal combustion engines fed by fossil fuels, from 2035. Regardless of the official positions, the major players (industries, politicians, economic and statistical institutions, etc.) manifest several opinions on this decision. In this paper, a mathematical model of a nation’s energy system is used to evaluate the economic impact of this decision. The model considers a superstructure that incorporates all energy conversion and storage units, including the entire transportation sector. A series of succeeding simulations was run and each of them was constrained to the achievement of the decarbonization level fixed, year by year, by the European community road-map. For each simulation, an optimization algorithm searches for a less costly global energy system, by including/excluding from the energy system the energy conversion units, storage devices, using a Mixed Integer Linear approach. Three optimization scenarios were considered: (1) a “free” scenario in which the only constraint applied to the model is the achievement of the scheduled decarbonization targets; (2) an “e-fuels” scenario, in which all new non-battery-electric light-duty vehicles allowed after 2035 must be fed with e-fuels; (3) a “pure electric” scenario, in which all new light-duty vehicles allowed after 2035 are battery-electric vehicles. The comparison of the optimum solutions for the three scenarios demonstrates that the less costly transition to a fully renewable energy system decarbonizes the transportation sector only when the share of renewable energy sources exceeds 90%. E-fueled light-duty vehicles always turn out to be a less expensive alternative than the electric vehicles, mainly because of the very high cost of the energy supply infrastructure needed to charge the batteries. Most of all, the costs imposed to society by the “e-fuels” and “pure electric” light-duty-vehicle decarbonizing scenarios exceed by 20% and 60%, respectively, the “free” transition scenario.

1. Introduction

Climate change is acknowledged as largely due to man-made greenhouse gas emissions [1] and most medium-to-long time energy economic policies are driven by the need to mitigate it [2]. In this context, the keyword for making sustainable humans’ impact on the planet is “decarbonization”. Among the various energy sectors, transportation accounts for approximately 30% of total energy consumption in Western countries and one third of this consumption is related to light duty vehicles (LDVs) [3].
Several solutions for decarbonizing LDVs have been proposed in the scientific literature, among which, for example, Craknell et al. [4] indicated electrification, biofuels, and synthetic fuels as most promising for the large-scale problem. Other actions such as promoting public transportation and active transportation (bicycle, walking) could be useful but not decisive [5].
Electrification is an increasingly popular solution. However, there are several challenges that need to be addressed. The need for adequate charging infrastructures is one of the main economic (and technical) issues [6]. The cost of electric vehicles, which is still higher than that of conventional ones, is another economic issue, even though the gap between the two is narrowing and it is predicted to vanish by 2035 [7]. Another barrier, in some cases only psychological, is the “charging anxiety” deriving from the limited kilometric range allowed by the battery’s capacity, which currently represents one of the major concerns for potential buyers [8]. Other final-user concerns regard the availability of charging options, which is particularly scarce in rural areas [9], or the residual value of electric vehicles, which remains quite uncertain because of its dependency on the battery’s degradation rate [10]. According to Jaguemont et al. [11], electric vehicles’ batteries performance in cold weather is a not yet addressed technical issue, being that cold weather can reduce the kilometric range of electric vehicles by approximately 20%. Production of batteries also raises environmental concerns related to the extraction of raw materials and the disposal and recycling of used batteries [12]. It is clear that not all these issues are equally challenging. Another barrier against LDVs electrification is the lack of public awareness and education on electric vehicles due to the extremely entrenched use of internal combustion engines, which are supported by a long history of multisectoral successful applications [13].
Bio-fuels, such as ethanol and bio-diesel, are other popular means for decarbonizing transportation. In fact, bio-fuels can be directly utilized in traditional LDVs’ internal combustion engines as an alternative to conventional fossil fuels [14]. Bio-fuels are renewable and can be produced from a wide range of sustainable feedstocks such as waste-cooking oil, algae, and agricultural waste [15]. Accordingly, the bio-fuels alternative show three main advantages compared to the electric LDV solution: first, bio-fuels production does not burden the electricity grid; second, the current fossil-fuels-supply infrastructure can be easily re-adapted for biofuels; third, bio-fuels can be either blended with conventional fuels or used as a standalone, making them a flexible and versatile option. Other advantages are for example the additional revenue streams for farmers, supporting the rural communities and cost-competitiveness with fossil fuels, depending on the feedstock and production process. However, there are also several relevant drawbacks associated with the production and use of bio-fuels. First of all, the land-use-change. This can result in deforestation and land-use-change related emissions, which can exceed the recently reported possible greenhouse gas emission benefits of bio-fuels [16] (the carbon intensity of bio-fuels is strongly dependent on the feedstock and production process used—according to [17] some bio-fuels may not provide significant greenhouse gas emissions reductions compared to conventional fuels). Second, the production of bio-fuels competes with food production for land and other resources, leading to concerns about food security and potential impacts on the price of food [18]. Third, the scale up of the bio-fuels’ production is still a major challenge, given the relatively limited availability of feedstocks and the need to ensure sustainability, which could lead to supply chain disruptions and increased costs [19]. Even if less challenging than those related to electric vehicles, there are also technical issues for bio-fuels, such as their degree of compatibility with traditional engines [20]. Eventually, the uncertainty around policy support for biofuels can create uncertainty for investors and limit the uptake of biofuels in the market [21].
Synthetic fuels, also known as power-to-liquids (PtL) and named as e-fuels hereafter, have been proposed as a promising alternative to fossil fuels for LDVs. E-fuels are produced from renewable electricity, carbon dioxide, and water. Compared to electrification and bio-fuels, the main advantages of e-fuels are: (i) they can be used in existing engines and infrastructures without any technological adaptation, making their adoption less disruptive than any other alternative fuels (bio-fuels and hydrogen included) or electric vehicles; (ii) they can be stored for long periods of time and transported in existing pipelines and tankers, making them a more convenient and versatile “green” fuel compared to renewable electricity and bio-fuels [22]; (iii) they can be produced using carbon dioxide captured from industrial processes, such as power plants, thereby reducing emissions and potentially creating a circular economy [23]; (iv) the required carbon can be collected from a variety of feedstocks or from carbon dioxide, giving them flexibility in terms of resource availability and reducing dependency on a single source; (v) they have the potential to be produced at large scales [24]. On the other hand, there are still several challenges associated with the widespread adoption of e-fuels for LDVs. First of all, e-fuels are currently more expensive to produce than fossil fuels, making them economically unviable without subsidies or other forms of government support. Additionally, the process of converting renewable energy into e-fuels is energy-intensive, resulting in lower energy efficiency than conventional fuels. The production of e-fuels requires significant amounts of resources, such as water and minerals, which may conflict with other sectors.
In summary, recent scientific literature has highlighted that the selection of the most convenient solution to decarbonize the LDV transportation is not straightforward. While electrification has been widely promoted, it faces challenges such as high costs, limited infrastructure, and insufficient battery technologies. Biofuels and e-fuels are considered as possible alternatives, but their sustainability and scalability are still in question. However, despite the different nature of the many issues related to the different decarbonization solutions, the most part of such issues, at the very end, are cost parameters which, in turn, can be easily included in mathematical models. Accordingly, the use of mathematical models of complex energy systems makes it possible to assess the economical convenience of various methods of decarbonizing LDVs by accounting for the boundaries imposed by energy transport infrastructures, energy resources’ availability and energy demands/availability matching. A large number of recent papers deal with the problem of the transition to a fully renewable energy system by using mathematical models, generally coupled with optimization algorithms, to search for the most convenient evolution of the energy system they are considering. A non-exhaustive, but well-assorted and relevant sample of such papers includes the works from Zhong et al. [25], Hrncic et al. [26], Song et al. [27] or Bogdanov et al. [28]. Although all these works are on the whole, very comprehensive, mostly to keep the problem complexity to an acceptable level some of them do not include all possible energy systems and carriers [25], others include in the optimization of only either the size [26] or the type of the considered technologies [27], whereas some others neglect differences existing between regions included in the domain under analysis [28], even when such differences can affect the solution (see, e.g., large differences in local demands of energy or local availability of renewable energy sources). Furthermore, all these studies do not distinguish between the different branches of the transportation sector and, therefore, none of them provide strong elements to support the appropriateness of the recent EU energy policy regarding LDVs. In particular, according to the EU Fit for 55 package approved in 2023, the EU bans the sale of new LDVs powered by internal combustion engines fueled by fossil fuel starting from 2035. As a result, in approximately 10 years, all the new LDVs must be powered by either electric motors fed by batteries or internal combustion engines fed by e-fuels produced from renewables. This decision has changed the terms of the debate on LDVs’ decarbonization, both in the political and industrial fields. Some stakeholders argue that battery electric vehicles (BEVs) are the only way to achieve the EU’s climate targets in the new legislative scenario, while others argue that internal combustion engines (ICEs) will remain an important part of the mobility mix in the medium term. This last opinion is also supported by relevant works such as [29], which brings strong arguments against the impossibility of rapid ICE abatement. However, these and other opinions are generally affected, at least in part, by specific economic interests. Accordingly, given that that decarbonization is mandatory for our society, and decarbonization targets forecasted by the EU road-map are not delayable without strong consequences for the future generations, it is now, more than ever, of utmost importance to assess whether the imposition of this new LDV scenario is really the most convenient for the entire society.
This paper aims to answer three questions:
  • In the unavoidable energy transition towards a 100% renewable scenario, when is it most convenient to decarbonize the LDVs?
  • What kind of LDV decarbonizing solution is most appropriate to minimize the overall decarbonization cost for society?
  • How cost-effective is it to ban fossil-fueled light commercial vehicles by 2035?
To this end, the Italian energy system is taken as case study. Since the Italian territory is characterized by relevant differences between regions, a complete mathematical model of the entire national energy system, sub-divided into three representative macro-regions, is developed. The model is coupled with an optimizer in a simulation tool that allows calculating the minimum cost of any energy transition scenario in which the share of renewable energy penetration is imposed for each of the succeeding temporal steps in which the transition process is discretized. The tool is utilized to compare the costs of the energy transition as imposed by the fossil-fueled-ICE LDVs’ ban from 2035 with those required by other transition scenarios, all evolving at the decarbonization rate imposed by the EU roadmap. This allows assessing the cost-effectiveness of current choices and possibly provides some alternative insights.
The principal novelties of this work are: (i) to suggest the most cost-effective time for decarbonization of LDVs in the transition towards a 100% share of renewables using a comprehensive multi-regional model of a national energy system; (ii) to critically evaluate the economic cost deriving from current EU energy policies on LDVs and provide useful information for future choices.

2. Materials and Methods

2.1. The National Energy System Model

This section describes in the first sub-section, the model of the national energy system considered here, including all the power conversion units, the energy transport infrastructures, and the energy inputs and demands. The second sub-section deals with the modelling approaches employed for the BEV and e-fueled-ICE LDVs, and finally, the third sub-section, summarizes the utilized equations.

2.1.1. General Framework, Units, Infrastructures, Inputs and Outputs

Figure 1 shows a simplified scheme of the national energy system model. In particular, all the energy streams are grouped in three macro-streams which identify the stream, from renewables (green), the stream from fossils (black), and the stream of mixed renewables and fossils (orange), respectively. The energy storage systems and energy transport infrastructures are not shown in Figure 1, but they are properly taken into account in the model. The gas grid is considered as able to transport bio-gas, methane and hydrogen considering the necessity of retrofitting costs.
All the considered energy conversion units, storage systems, energy infrastructures, energy inputs and demands are listed in Table 1.
The model considers the Italian country as sub-divided into three different geographical macro-regions, highlighted by different colors in Figure 2. Each macro-region groups real Italian regions with comparable demands and energy resources (see the specific characteristics in the right-side boxes in the figure) and equal type of energy conversion/transportation systems.
The three macro-regions are connected to each other by the electric grid and can share energy with each other (yellow arrows) according to the local energy systems connection rules represented on the right-side of the figure.
The annual inputs of renewable energy required to simulate the transition to a fully renewable energy system are imposed as averaged hourly trends of four days appropriately selected from historical data records. Each one is representative of the season from which it was extracted.
The details of the procedure used to obtain these model input data are reported in a previous publication of the present authors [30]. In accordance with the logic under the multi-macro-region approach, each macro-region is characterized by its own availability of the renewable energy inputs. The fossil fuel energy inputs are not bounded by predetermined trends since they are considered as “on-demand”. However, a maximum hourly flow rate is imposed to properly account for the actual capability of the present fossil fuel transport infrastructure. Nuclear energy inputs are disabled by default, because nuclear technology is not allowed by Italian law. The energy demands boundary conditions are modeled using the same approach as the renewable energy inputs, i.e., by means of macro-region based averaged hourly trends of four representative days. As an example, Figure 3 shows the daily trends of the electricity, heat and cooling demands in one of the four representative days for one of the three macro-regions.
The daily demand of aviation, marine, plastic, heavy duty and non-electric light-duty vehicles is simply estimated as 1/365 of the corresponding annual demand without need for any specific hourly constraint. This seemingly oversimplified assumption is well justified by the fact that these demands currently rely on non-renewable energy sources, which are easily storable products, whose demand time is for a long time decoupled from supply time. Additional insights on the modeling approach of the traditional transportation sector are provided in the next section since LDVs powered by e-fuels are treated in the same way.

2.1.2. Modeling Approaches for Electric and E-Fuel Vehicles

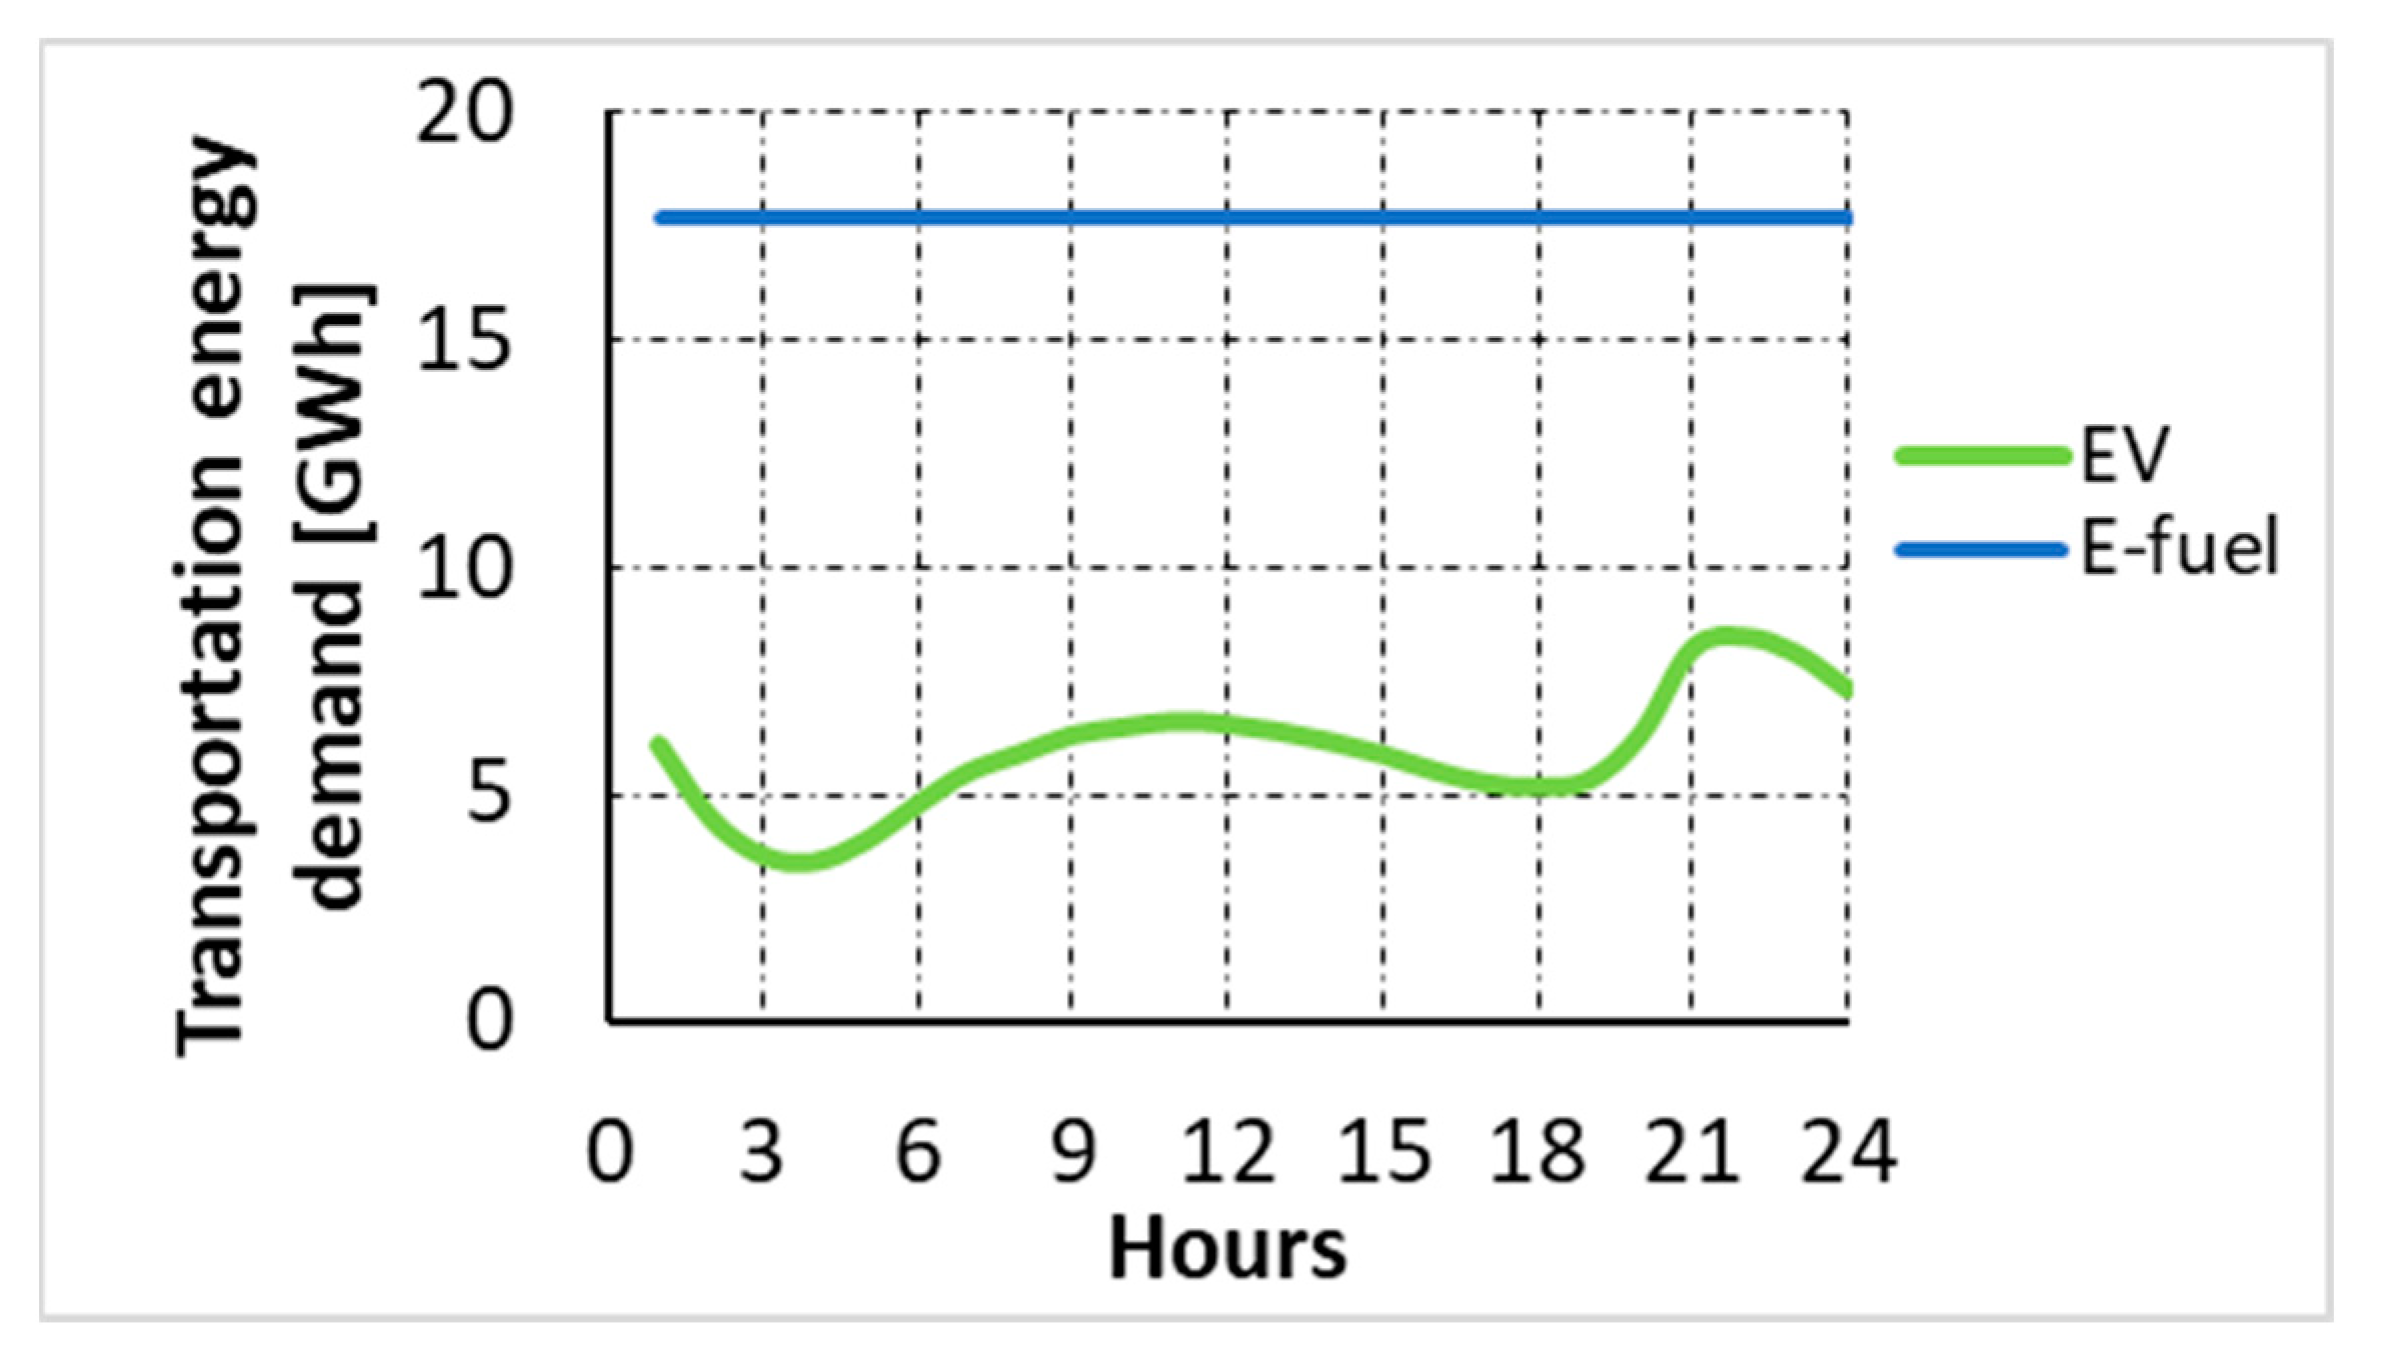
From the modeling point of view, the very fundamental difference between electric and e-fuel vehicles is in their own energy demand trend. In the case of the electric vehicles, an hourly averaged trend of the energy for battery re-charging must be considered (in the absence of specific changes of habits—hardly imaginable without introduction of some “ad hoc” policy). This demand must be therefore satisfied by the energy system at each temporal step. In contrast, it was decided to model the energy demand for e-fuel LDVs refueling, as a daily uniform demand, estimated by averaging the data of energy consumption as obtained from reports [3]. Accordingly, the model is not forced to satisfy an hourly demand, but it is only bounded to make available the total amount of e-fuel needed for each daily demand through the energy conversion system.
The difference in electric and e-fuel LDVs’ sub-models is consistent with the re-charging/re-fueling time of the two LDV options. In fact, e-fuel re-fueling is negligible both in absolute terms and in respect to the mileage corresponding to one refueling. That is not the BEVs’ case, whose re-charging needs time on the order of hours. On the other hand, the hypothesis of an infinite storage capacity—on which the e-fuel LDV model is based—is well supported by the capillary infrastructure for fossil-fuel re-fueling existing in Italy and usable “as is” for e-fuels. In contrast, the absence of a comparable sized electric storage imposes the adoption of the hourly averaged energy demand for the electric LDV model. It could be argued that the existing electric grid is a large storage, even more capillary-like than the fossil-fuel infrastructure. It is clear that this argument, valid in principle, vanishes when the share of electric LDV increases to a level not compatible with the grid capacity. However, the model allows the optimizer to decide to either enlarge the grid or install large electric storages to decouple the re-charging demand from the renewable energy availability.
Figure 4 shows the hourly re-charging demand of the electric LDVs (green trend) and re-fueling demand of the e-fuel LDVs (blue line) for one representative day of the northern Italian macro-region included in the model. The other two macro-regions are characterized by similar trends but different daily consumptions.
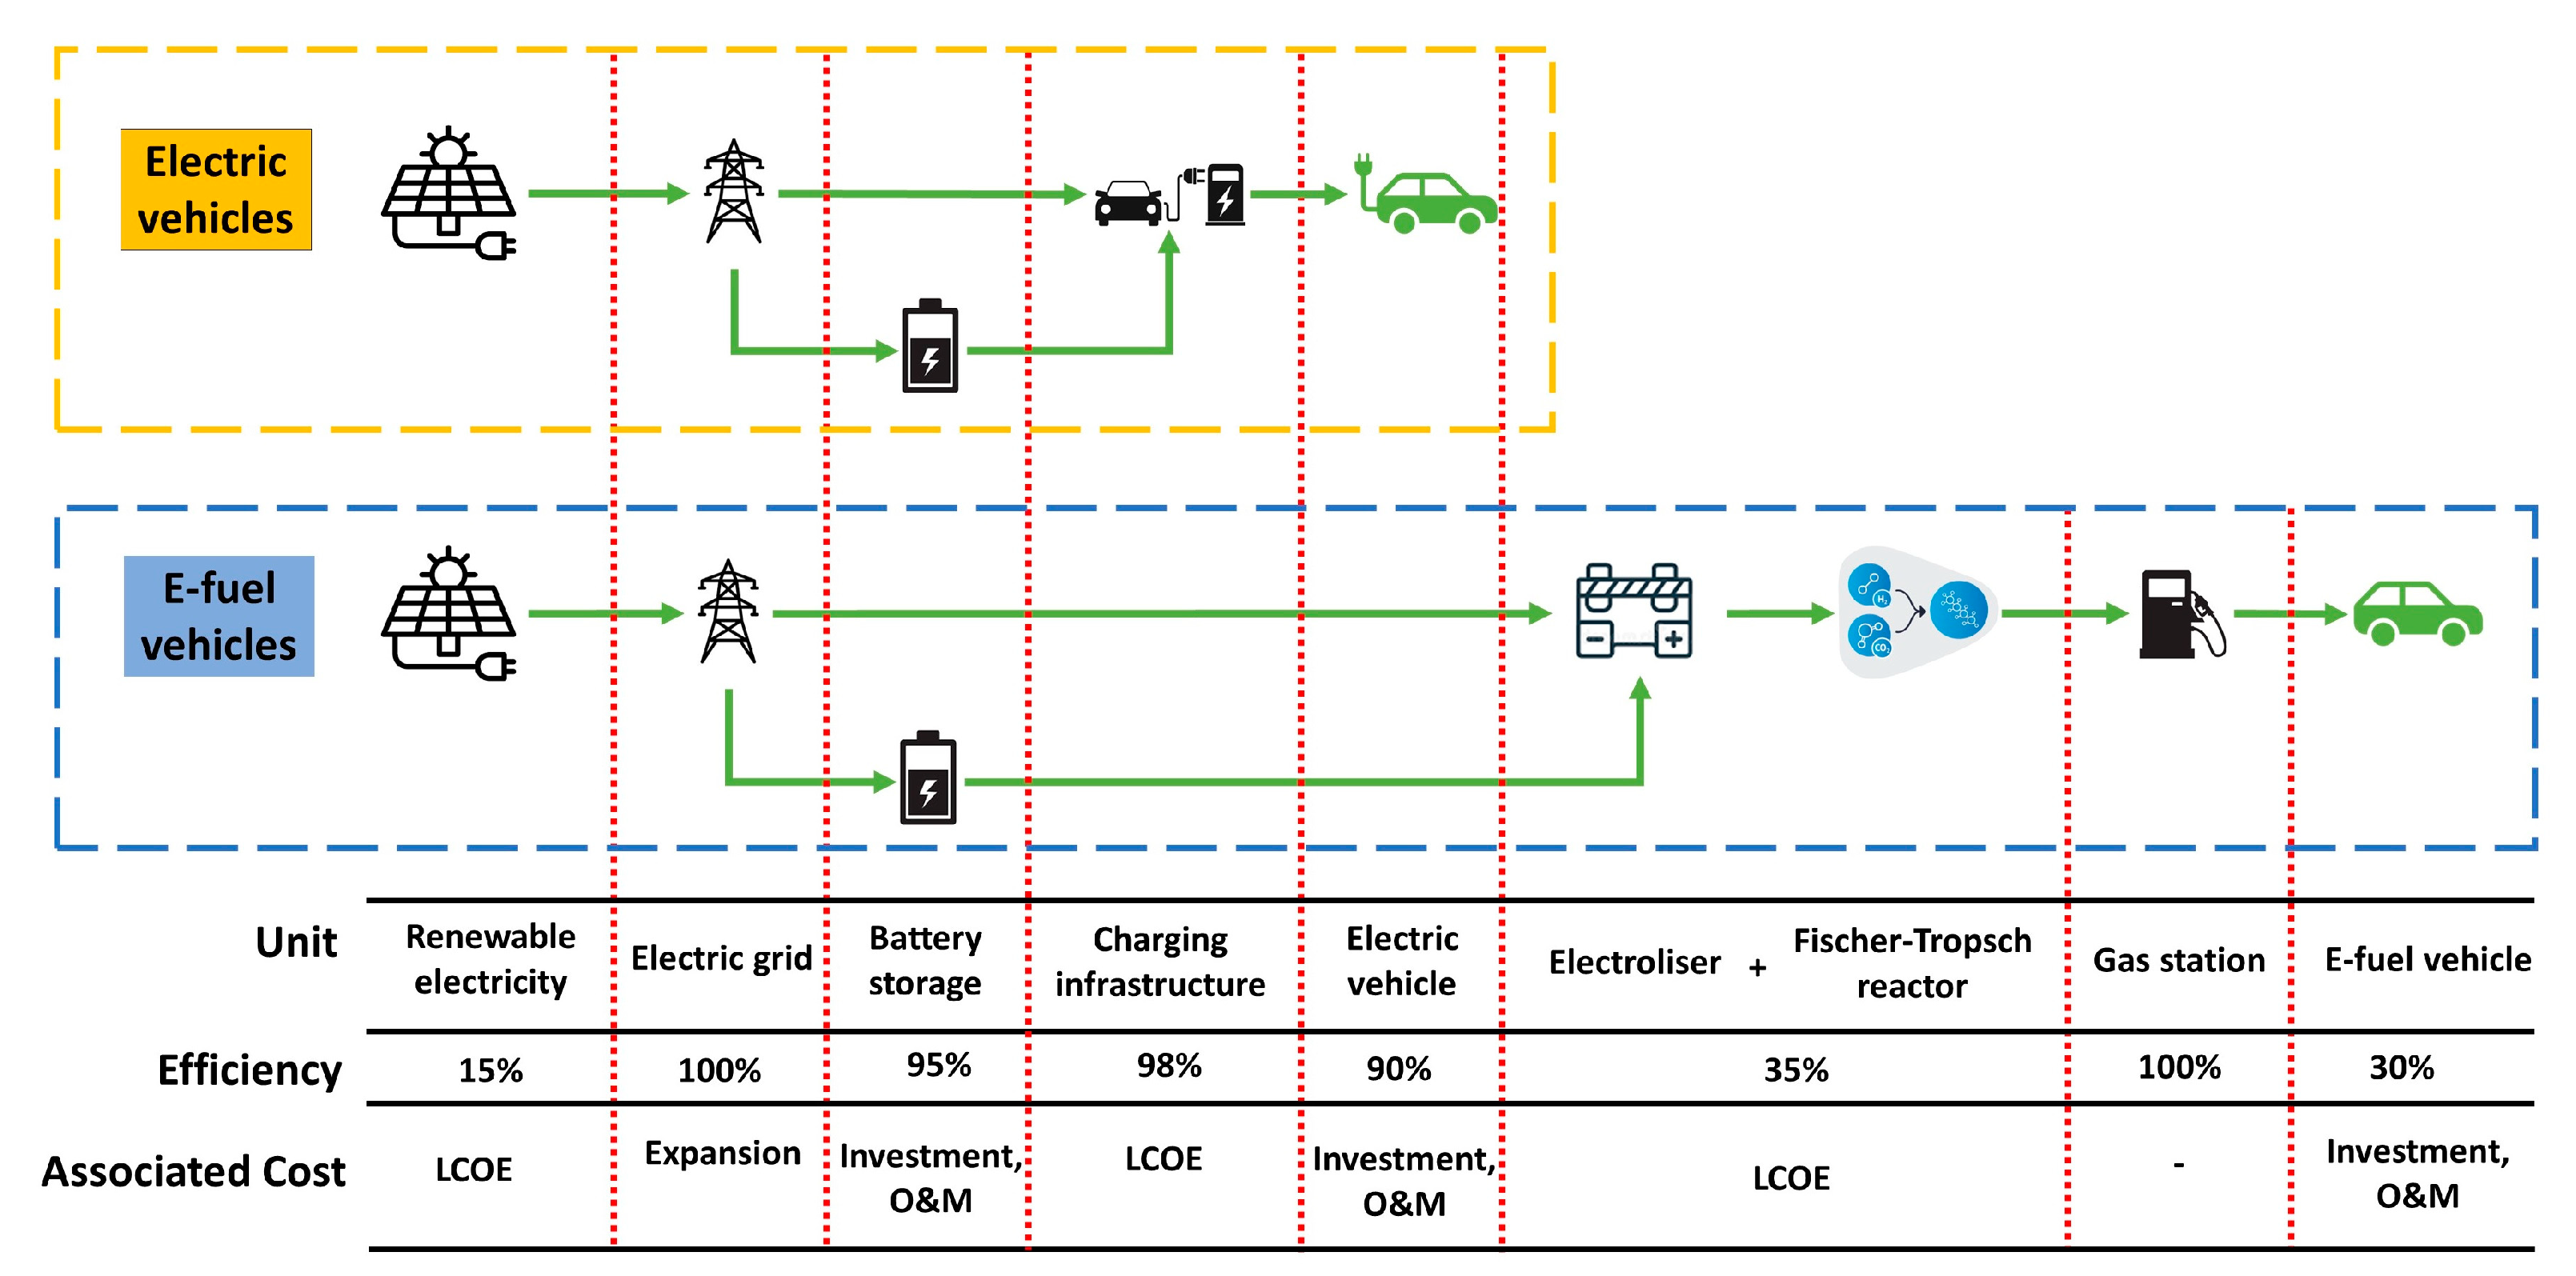
It is apparent that the overall daily energy demand (i.e., the integral of each curve in Figure 4) of the e-fuel LDVs is far higher than the electric LDVs’ demand. In fact, the motor of electric LDVs obviously succeeds in converting electrical to mechanical power with a higher efficiency than that of thermo–chemical to mechanical power in charge to the combustion engine of the e-fuel LDVs. Moreover, the energy supply chain of electric LDVs simply resolves by feeding the batteries with renewable electricity, whereas the renewable energy used by the e-fuel LDVs requires renewable electricity to feed electrolyzers that produce hydrogen, which feed the Fischer–Tropsch reactors needed to generate the e-fuel starting from carbon dioxide and hydrogen. Figure 5 summarizes the two energy supply chains, also including the current conversion efficiency of each unit involved in the chain.
It is apparent from the figure that the overall efficiency of the energy conversion process from the solar irradiation (as an example) to the wheel mechanical energy is approximately 1.5% for the e-fuel LDV, against 12% for the electric LDV. Although this confirms the strong advantage of electric LDVs in terms of energy efficiency, this does not automatically correspond to lower overall costs because, as previously mentioned, the re-charging/re-fueling methodology of the two solutions under analysis may involve strong differences in the associated investments.
Figure 5 represents the electrolyzer and Fischer–Tropsch reactor system as a single unit, fed only by electricity. Actually, this system also requires the feeding of water and carbon sequestrated from air or other sources. The mass flows associated with these two additional fluxes are here neglected, since they are not of interest for the scope of the present work, however, they are taken into account as costs. In fact, the levelized cost of energy (LCOE) [31] associated with the e-fuel generation unit also includes the costs of water supply and carbon capture technologies.
It is important to highlight that the most favorable scenario for EVs has been considered in this work. This is because currently the EVs option seems to be the most politically supported one and consequently, it will likely enjoy the related benefits. In particular, there are three aspects that have been intentionally neglected in this work to make the EVs scenario most advantageous:
  • Recycling cost of batteries.
  • Deployment cost of batteries.
  • Change in social habits (i.e., reduction in consumption for transportation). In fact, the reduction in energy consumption could be a disadvantage for the utilization of EVs since the benefits of the scale effect on all technology costs would be lost.

2.1.3. Equations

The model is implemented using a Mixed Integer Non-Linear Programming (MINLP) approach. Most of the equations describing the operation of the various systems are therefore expressed in the linear or bi-linear form (i.e., as a product of a binary variable and continuous variable) [32]. Thus, two types of equations are considered to define the operation of each unit included in the model:
1.
Equation for the energy conversion units:
Pout = η · Pin
where η is the conversion efficiency of the unit.
2.
Equation for the energy storage units:
Esto (t) = Esto (t − 1) − Ech (t − 1)
where Esto is the energy stored and Ech is the charging/discharging energy.
The only exception to this general rule relies on the quadratic constraint required to model the operation of the gas grid properly. This very specific third type of equation set is reported in the following item 3.
3.
Equations for the gas grid:
Egrid (t) = Egrid (t − 1) − Ech,grid (t − 1)
Egrid (t) = p(t)/pnom ·(a · ratioH2(t)2 + b · ratioH2(t) + c)
where Egrid is the energy stored and Ech,grid is the charging/discharging energy. The p/pnom ratio in Equation (4) is the ratio between the actual and the nominal values of the pressure in the grid piping, ratioH2 indicates the volume percentage of hydrogen contained in the grid, and a, b and c are the coefficients of the quadratic polynomial necessary to take into account the variability of the energy capacity of the gas grid as a function of both the operation pressure and the amount of transported hydrogen.
Energy balances and all constraints needed for the model closure are included in the code using linear equations. The model counts about 10,000 variables and 10,000 equations.

2.2. Simulation Criteria

2.2.1. Optimization Method

According to the Mixed Integer Non Linear Programming (MINLP) approach, the optimization problem can be formulated as [33]:
m i n x , y ( c T x + d T y )
s . t .       A x + B y + C x y = b
where x 0 R N x ,   y 0,1 N y .
Symbols c and d represent the cost vectors associated with the continuous and binary variables, x and y, respectively; A, B and C are the matrices of the equation constraints and b is the known term; Nx and Ny are the dimensions of x and y, respectively. In the present case, the optimization problem is a design and operation optimization. The objective function is the total annual cost Z, to be minimized:
Z = s t r C O & M + C i n p u t + m C i n v   s s e a s o n s t h o u r s r r e g i o n s m t e c h n o l o g i e s  
where C O & M are the costs related to the operation and maintenance of all units, C i n p u t are the overall costs of the energy sources and C i n v is the investment cost [€/kW] of the new units added to the current energy system.
The optimization of an entire transition scenario is the composition of individual optimizations performed for each temporal step in which the transition duration was discretized. Each temporal step shall fulfil specific values of renewable energy penetration (REP) share and year of achievement, “a priori” fixed in agreement with the decarbonization trend suggested by EU projections. REP is defined as:
R E P t o t = s t r E R E , t o t t E t o t t   s s e a s o n s , t h o u r s , r r e g i o n s
where ERE,tot is the total renewable energy provided and Etot is the total energy demand.
The base scenario of any temporal step of the optimization process is the energy system defined by the optimization of the previous step. In this way, the new installations of a specific technology chosen by the preceding optimization are included in the “base” energy system of the subsequent optimization. This makes it possible to take into account decisions taken at some intermediate stages of the transition affect the subsequent transition stages.

2.2.2. Trend of the Costs

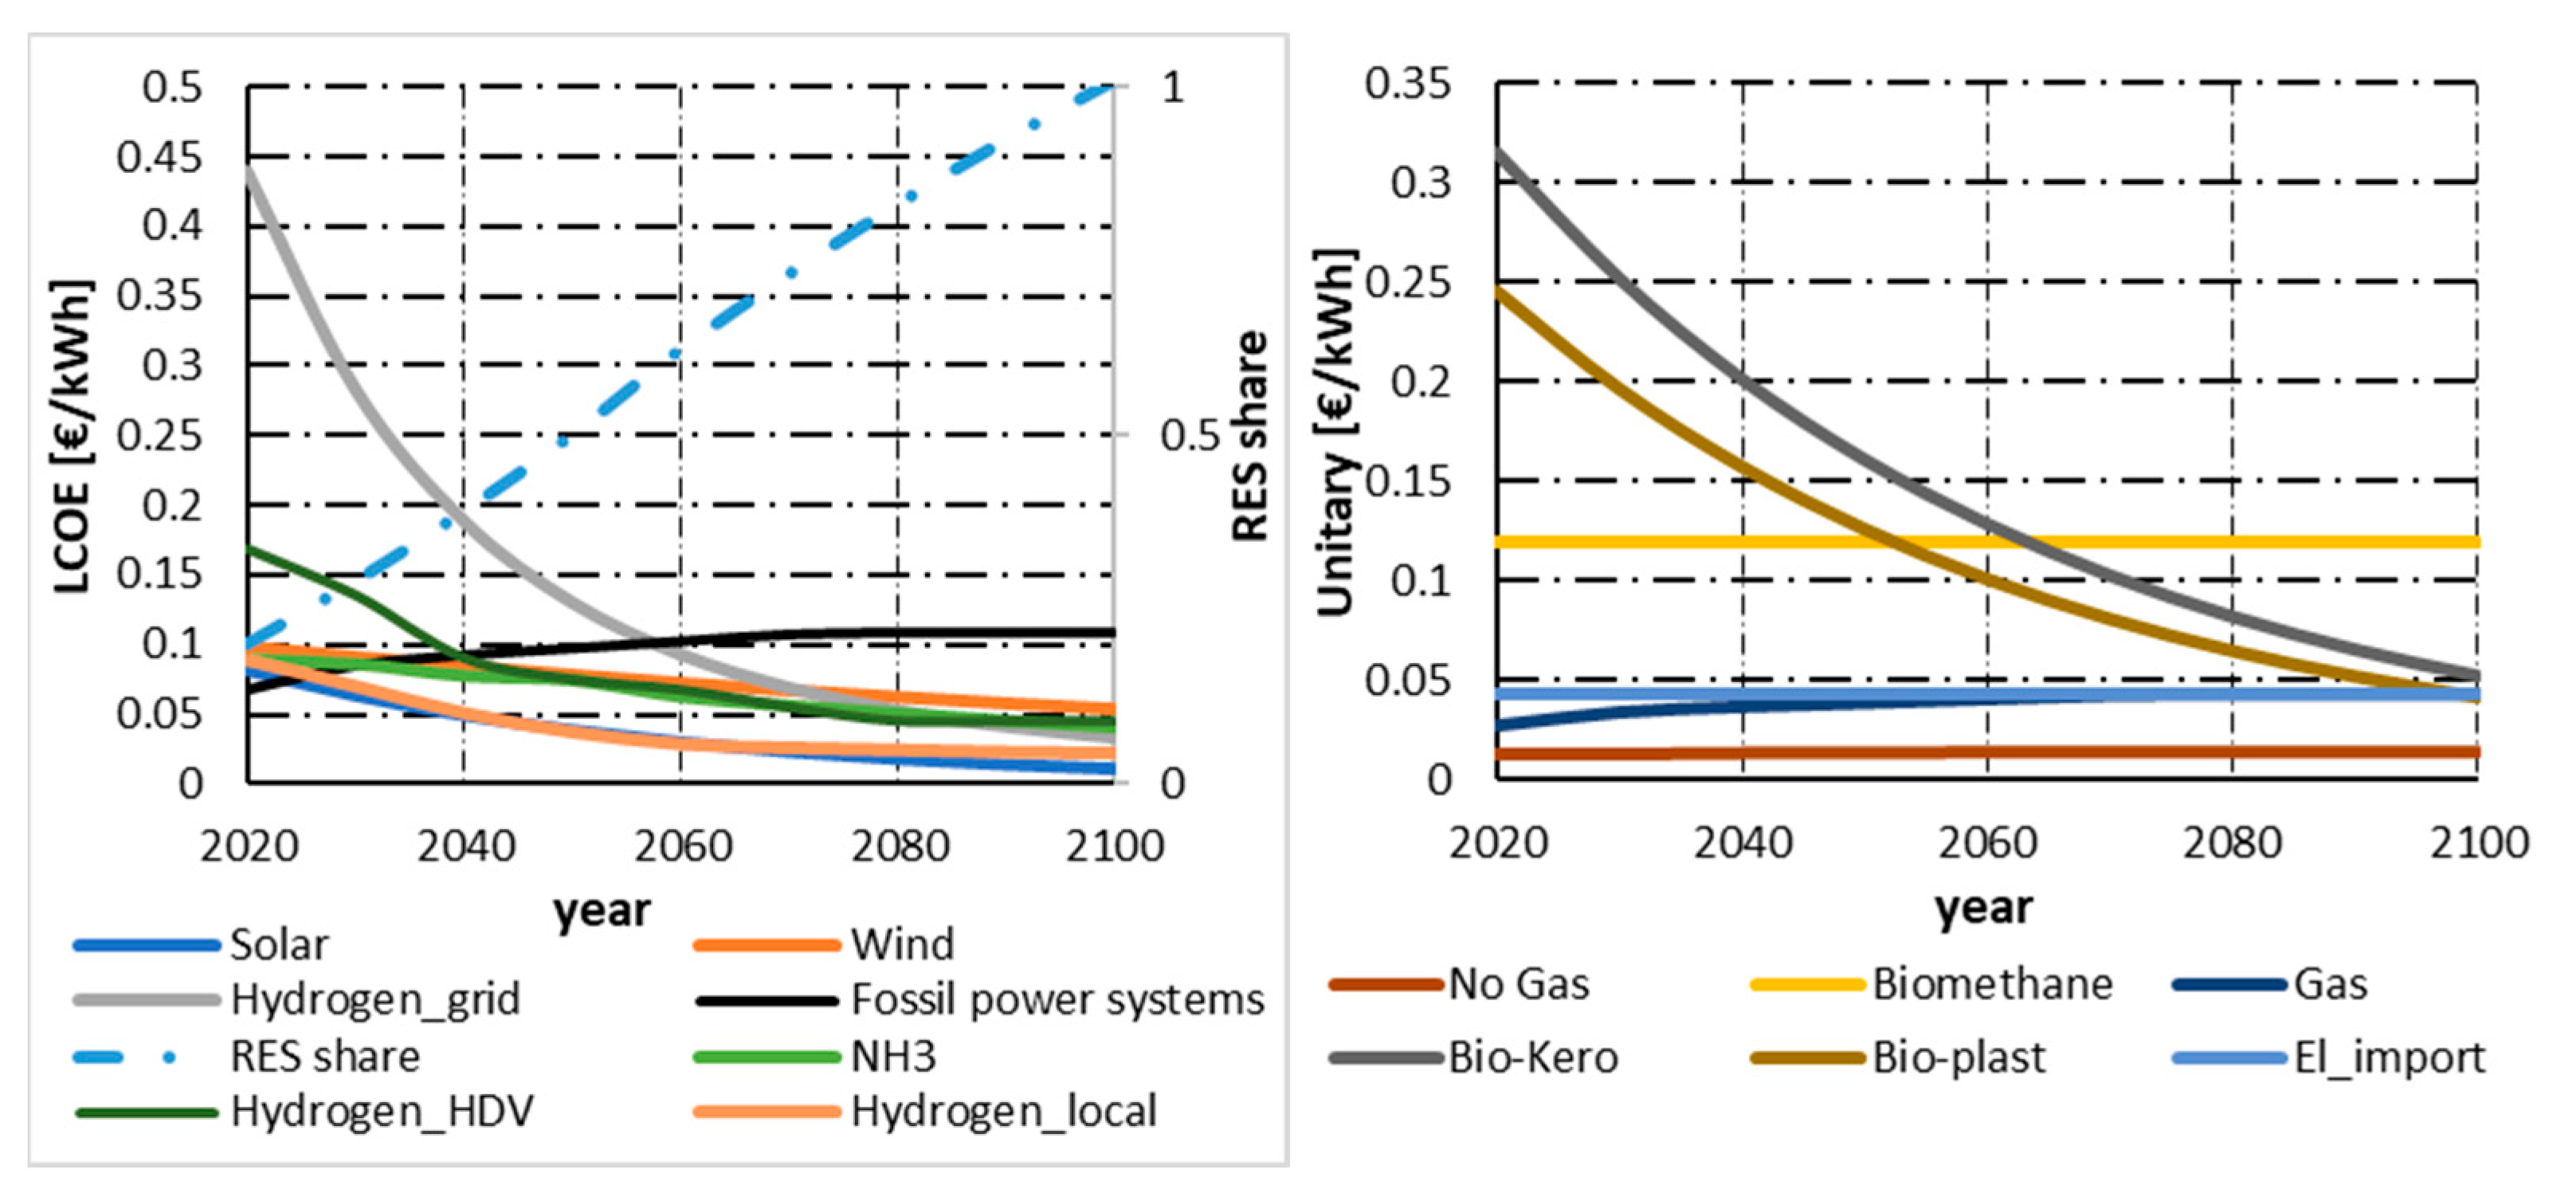
The costs included in the objective function Z vary depending on the year considered by each optimization. Reasonable trends are extrapolated from medium-term projections to the considered time frame. Three types of costs are utilized: investment cost for new unit installations [€/kW], cost of energy sources [€/kWh] and LCOE [€/kWh]. The utilization of either LCOEs or the other two, depends on the technology and data available in the literature. Table 2 lists the type of costs associated with each unit while Figure 6 shows the projection of the costs used for each optimization [34,35,36,37]. Fossil fuel transportation and plastic cost are accounted for in “gas” and “fossil fuel other than gas” consumptions.
Table 2 and Figure 6 do not include the projection costs for electric and e-fuel LDVs because these cost trends are an object of a (very partial) sensitivity analysis, as described in the next section.

2.2.3. Optimization Scenarios

Four simulations were carried out to find the most cost-effective solution for decarbonization of the light vehicle sector, and critically evaluate the EU’s proposed energy policies from 2035 onward. Each simulation consists of nine 10-year time steps, for a total time frame of 80 years at the end of which the 100 percent renewable share (by constraint) is reached, the initial share being set at 20 percent (as for the 2023 renewable share).
The four scenarios are listed as follows:
  • “Free” optimization scenario. In this case, the series of optimizations is carried out considering no additional constraints to those given in Section 2.2.1. Accordingly, the result of this optimization process is the most cost-effective energy transition scenario.
  • 2035 policy scenario—“e-fuel”. The ban of fossil-fueled LDVs is included as an additional constraint. From 2035 the model is forced to decarbonize the LDVs consumptions by choosing either full-electric or internal combustion engines LDVs fed by e-fuels produced from renewables.
  • 2035 policy scenario—“pure electric”. This scenario differs from the previous one for the additional constraint imposing after 2035 only electric technology to decarbonize the LDV sector.
  • 2035 policy scenario—“e-fuel pessimistic”. The scenario 2 is replicated considering a pessimistic trend of the future cost projection for the e-fuels.
Scenarios 2, 3 and 4 assume that the LDVs must be completely decarbonized between 2035 and 2060. This time frame is consistent with the maximum life-span of the majority of fossil-fueled LDVs, which is approximately equal to 25 years. The following equation quantifies the fraction of decarbonized LDVs:
R E P L D V = s t r E R E , L D V t E t o t , L D V t   s s e a s o n s , t h o u r s , r r e g i o n s
Figure 7 shows the values imposed on REPLDV as constraints up to year 2060. The assumed trend is imposed in accordance with a reasonable, initially small, substitution rate of fossil fuel LDVs.
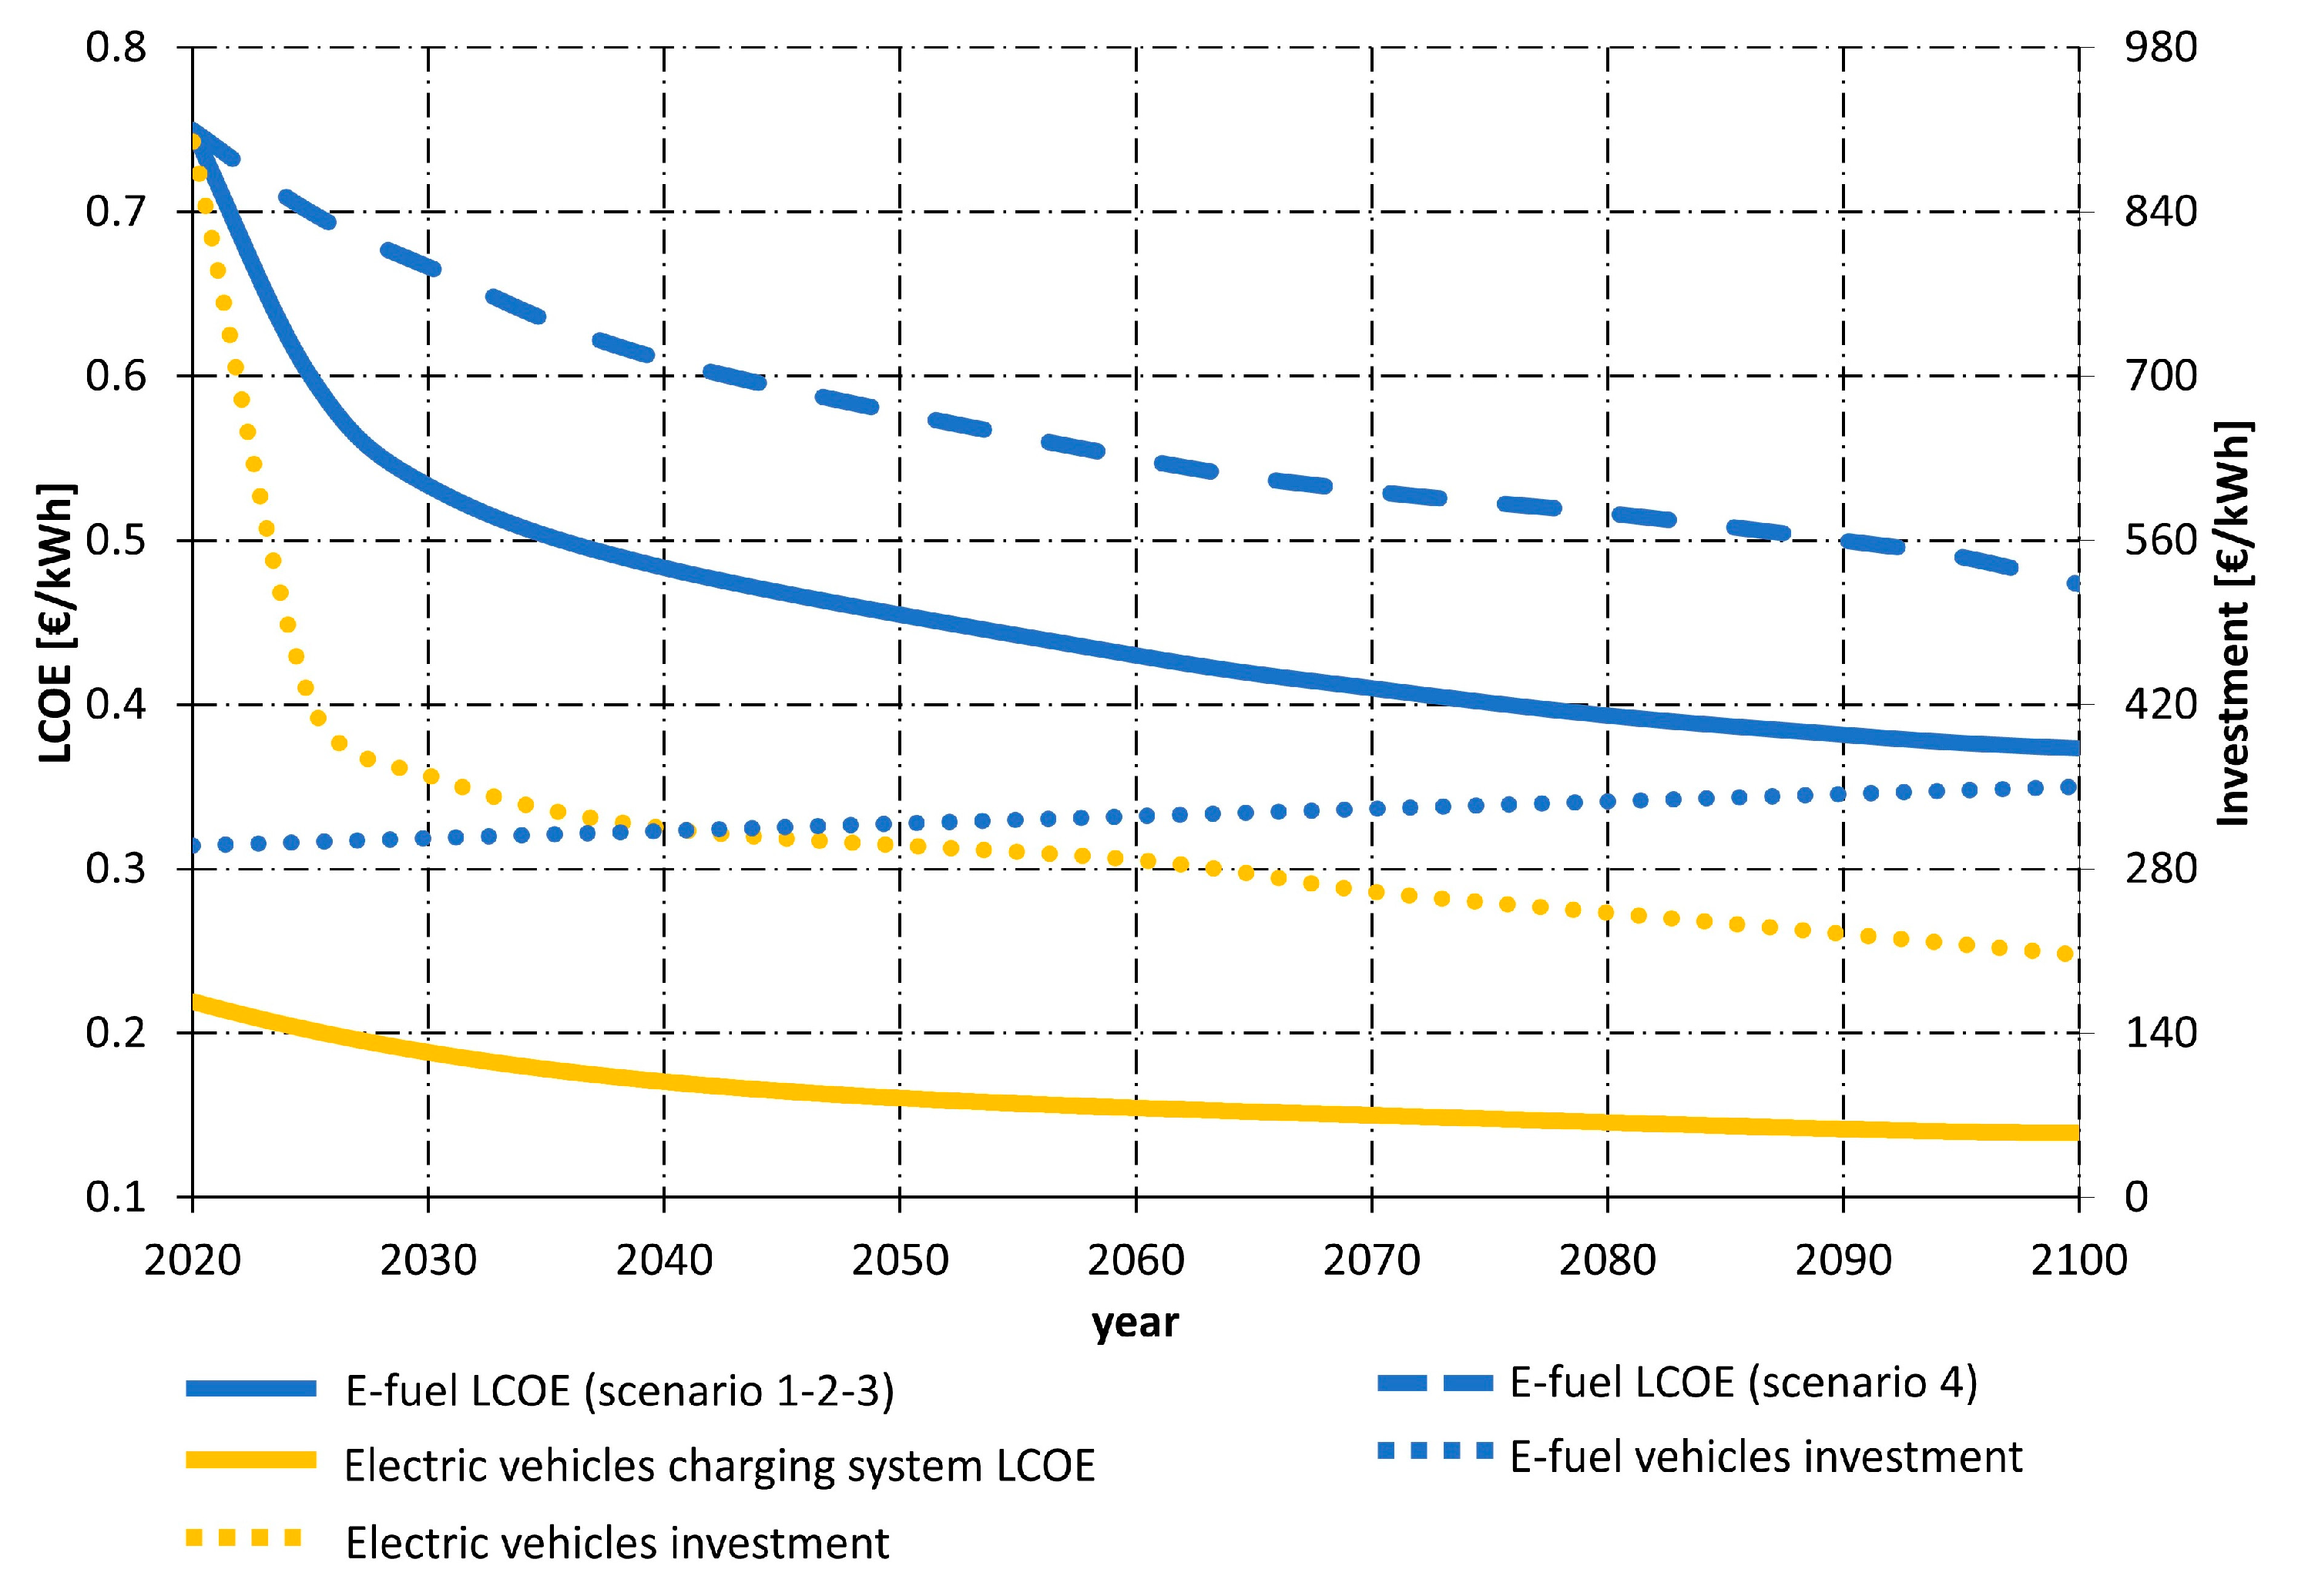
With regard to the costs of the two solutions, both direct and indirect costs can be identified. The former are the investment in new vehicles, the re-charging infrastructure, and the e-fuel generation units, while the latter are the costs associated with the renewable energy generation systems that provide the requested energy. Figure 8 shows the future projections of the direct cost of the systems, which were derived from literature data [3,36]. The continuous lines refer to the LCOEs associated with the e-fuel generation units and the electric vehicles charging infrastructure, colored in blue and yellow, respectively. The point lines represent the predicted investment costs for new e-fuel (blue) and electric (yellow) LDVs. As anticipated, a cost sensitivity analysis was considered for e-fuel generation units. Accordingly, the base scenario “e-fuel” considers the continuous (blue) line for the e-fuel generation units LCOE (as for the “free” scenario case), whereas the “e-fuel pessimistic” scenario considers the dotted (blue) line.
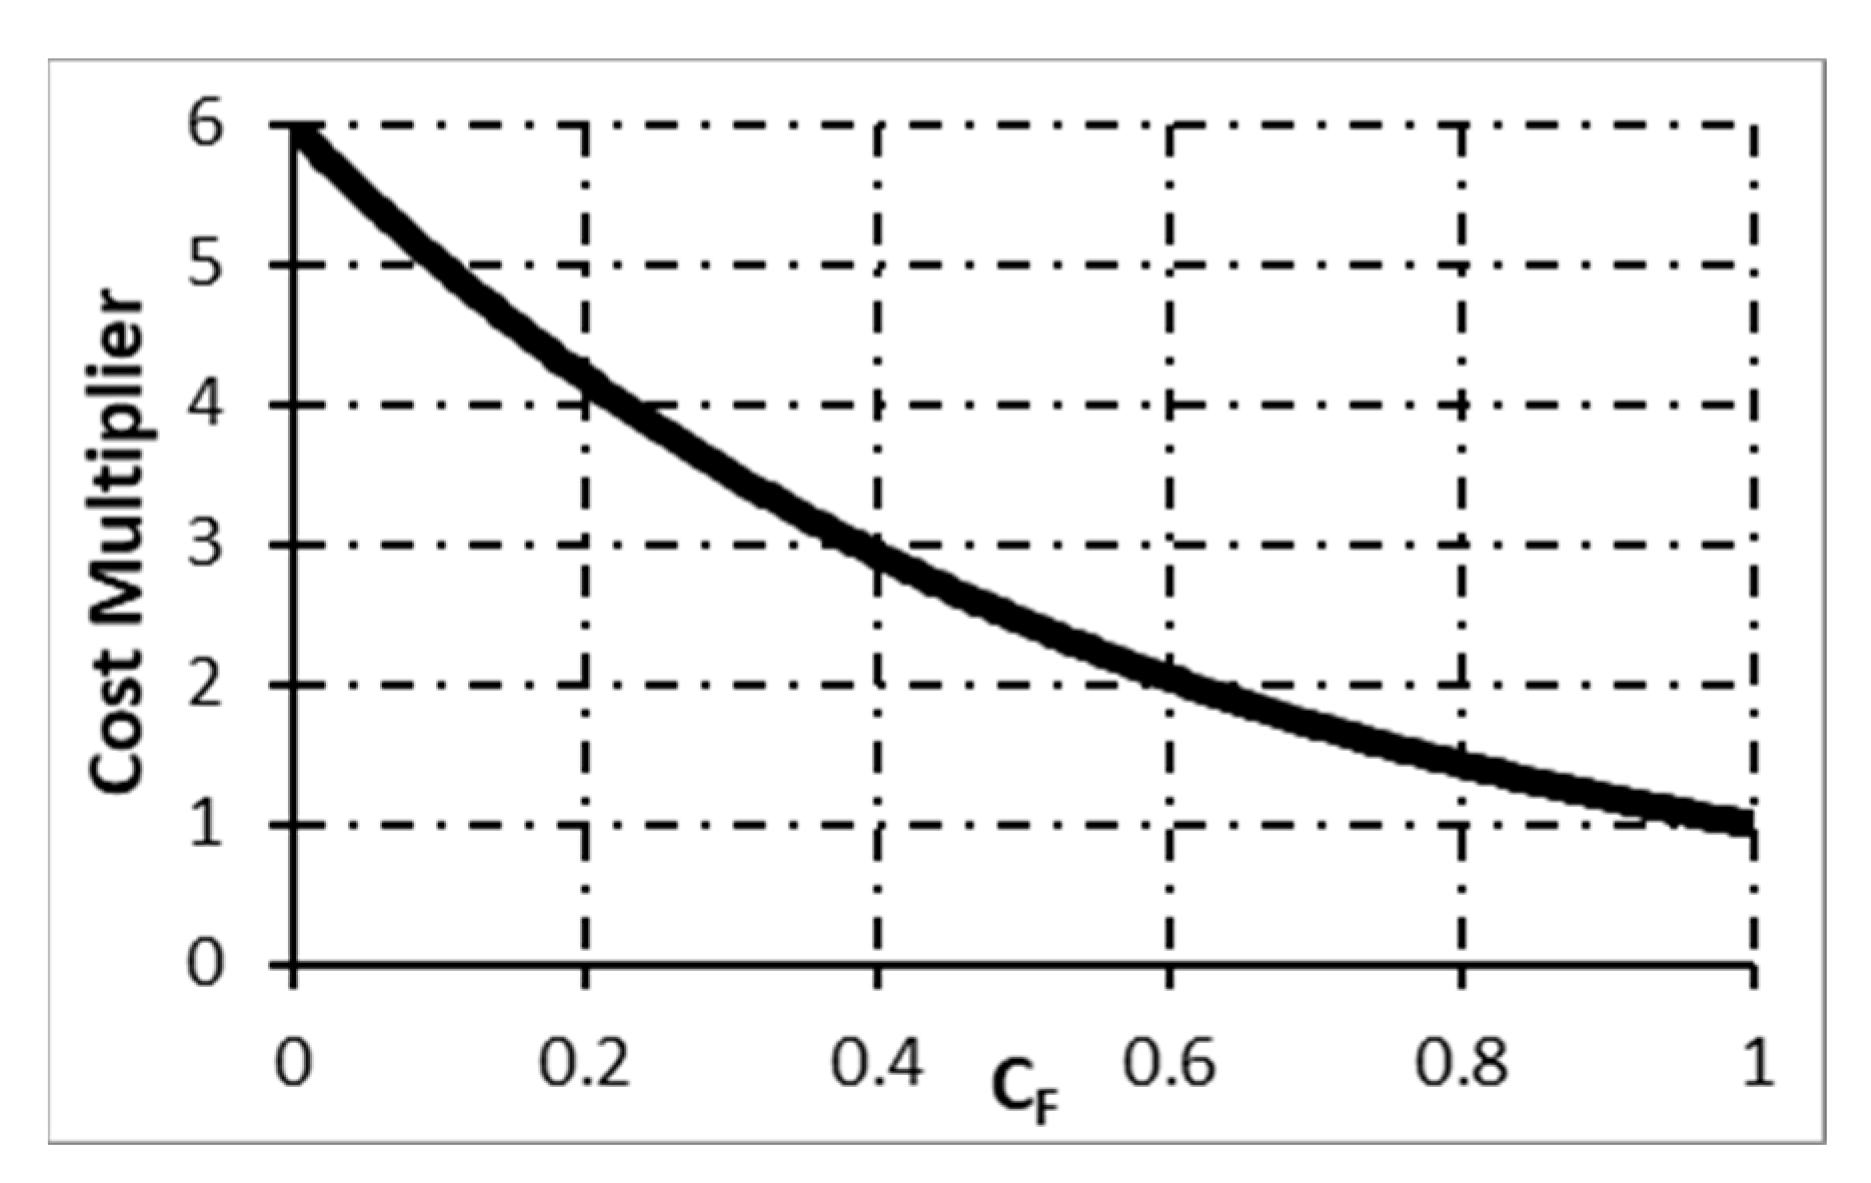
It is worth mentioning that the e-fuel production cost strongly depends on the capacity factor of the system. The e-fuel LCOE showed in Figure 8 refers to 100% capacity factor. To account for the costs associated with different capacity factors of the e-fuel production unit, the LCOE implemented in the model includes a cost multiplier, whose trend is shown in Figure 9 and derived from [31].
Without the cost multiplier, the optimizer decides to produce the complete daily demand in only one hourly interval, likely corresponding to peaks in renewable production and resulting in extremely low-capacity factors. This is highly unlikely in a real case scenario since the cost of e-fuel production units need large capacity factors to be amortized. The capacity factor is not needed in the case of the charging infrastructure of electric vehicles because they need to follow an imposed hourly trend (see Section 2.1.2) and therefore, they always work at the design capacity factor.

3. Results and Discussion

This section shows the results of the optimizations for the transition scenarios presented in Section 2.2.3. The top frame in Figure 10 shows the trend over time (continuous lines) of cumulated costs normalized by the cumulated cost of the “free” scenario (1 in the figure). The dotted lines refer to the share of decarbonized LDVs in the case of scenario 1 (blue), and 2 and 3 (green). It is worth remembering that the LDVs’ decarbonization completion in the year 2060, which occurs in scenarios 2 and 3, is not achieved for cost saving reasons but by imposition for constraint of the model. This is confirmed by the bottom frame in Figure 10, which shows the costs associated with each time step of the transitions, normalized by the cost of the most expensive step occurring in the “free” scenario (1).
Scenario 1 (“free” scenario) is clearly the most cost-effective scenario. In this scenario, the LDVs are decarbonized starting from 2090 when REP achieves the 90% share (see Figure 6). Accordingly, the light duty transportation seems to be the last to take action on, if the transition costs are to be minimized. In this case, e-fueled vehicles are chosen by the optimizer as the best option.
Scenario 2 confirms the convenience of e-fuels compared to the electric alternative as the LDVs’ “decarbonizing” system. Its penetration trend is imposed here in accordance with Figure 7. This imposition causes a higher cost of the transition compared to scenario 1, particularly evident between 2040 and 2060 where the larger vehicle replacement is imposed. Transition scenario 2 costs 20% more than scenario 1.
The “pure” electric scenario (Scenario 3) results in being the most expensive one, with an overall cost that exceeds by 60% and 30% scenarios 1 and 2, respectively. At first sight, these results did seem not consistent with the cost trends showed in Figure 7, where the direct costs associated with electric vehicles are remarkably lower than those of e-fueled LDVs. The justification of the e-fuel LDVs convenience emerges by considering the indirect costs of the systems, which are associated with either the additional infrastructures needed to generate and provide the energy, for re-charging electric LDVs, or to produce the e-fuel, for re-fueling the internal combustion engine LDVs. In fact, Figure 11 shows the costs associated with the expansion of the electric grid, and the investments in electric storage in scenarios 1, 2 and 3. It clearly appears that the indirect costs for electric vehicles are remarkably higher than those of e-fuels LDVs. E-fuel related costs tend to converge to those of scenario 1 while in the case of electric vehicles, they always maintain higher values. These gaps are due to the substantial difference between the energy supply methods for the two options. As described in Section 2.1.2, the full-electric option needs to be suppling energy that follows a predefined and continuous trend during the day due to the recharging time needed by the batteries. In the case of e-fuels, they can be produced discontinuously and sent to refueling stations where refueling times are negligible even though a plant capacity factor must be included to avoid unrealistic operating conditions.
In accordance with the aforementioned observations, it is concluded that expansion of the electric grid and the utilization of electric storages are the reasons that make the electric vehicles so expensive.
It is also worth observing that the indirect costs in scenario 2 are lower than in scenario 1, between 2090 and 2100. This is because the indirect costs for e-fuels are mainly due to the expansion of the electric grid instead of electric storage (higher production flexibility), and such costs are incurred in the early phases of scenario 2 due to the imposition of “green” vehicles. The indirect costs in the expansion of the electric grid are long-term investments that generate cost savings in all subsequent optimizations. Instead, the employment of electric storage in early phases of the transition does not translate into future savings because such systems have a limited lifetime (20 years) and investments in new units occur at every time step. As a result, indirect costs of electric vehicles (scenario 3) are always higher than in scenario 1 because in addition to grid expansion, high electrical storage capacity is also required.
Finally, considering the results for scenario 4, both Figure 10 and Figure 11 show that even in the case of a cost increase of about 30 percent for e-fuels, they still represent the most cost-effective option. The difference between the costs of scenario 3 and 4 is about 5 percent.
The final observation regards the lower portion of Figure 10 and Figure 11 where there is a cost reduction between 2065 and 2070 for all scenarios. This is due to the absence of the need for new investment in vehicle conversion, which was completed precisely at 2065. As a result of this scenario, the costs associated with the decarbonization of the transportation sector are reflected only in vehicle replacement. Accordingly, the replacement costs should be very limited, if not absent, for the first few years after 2065.
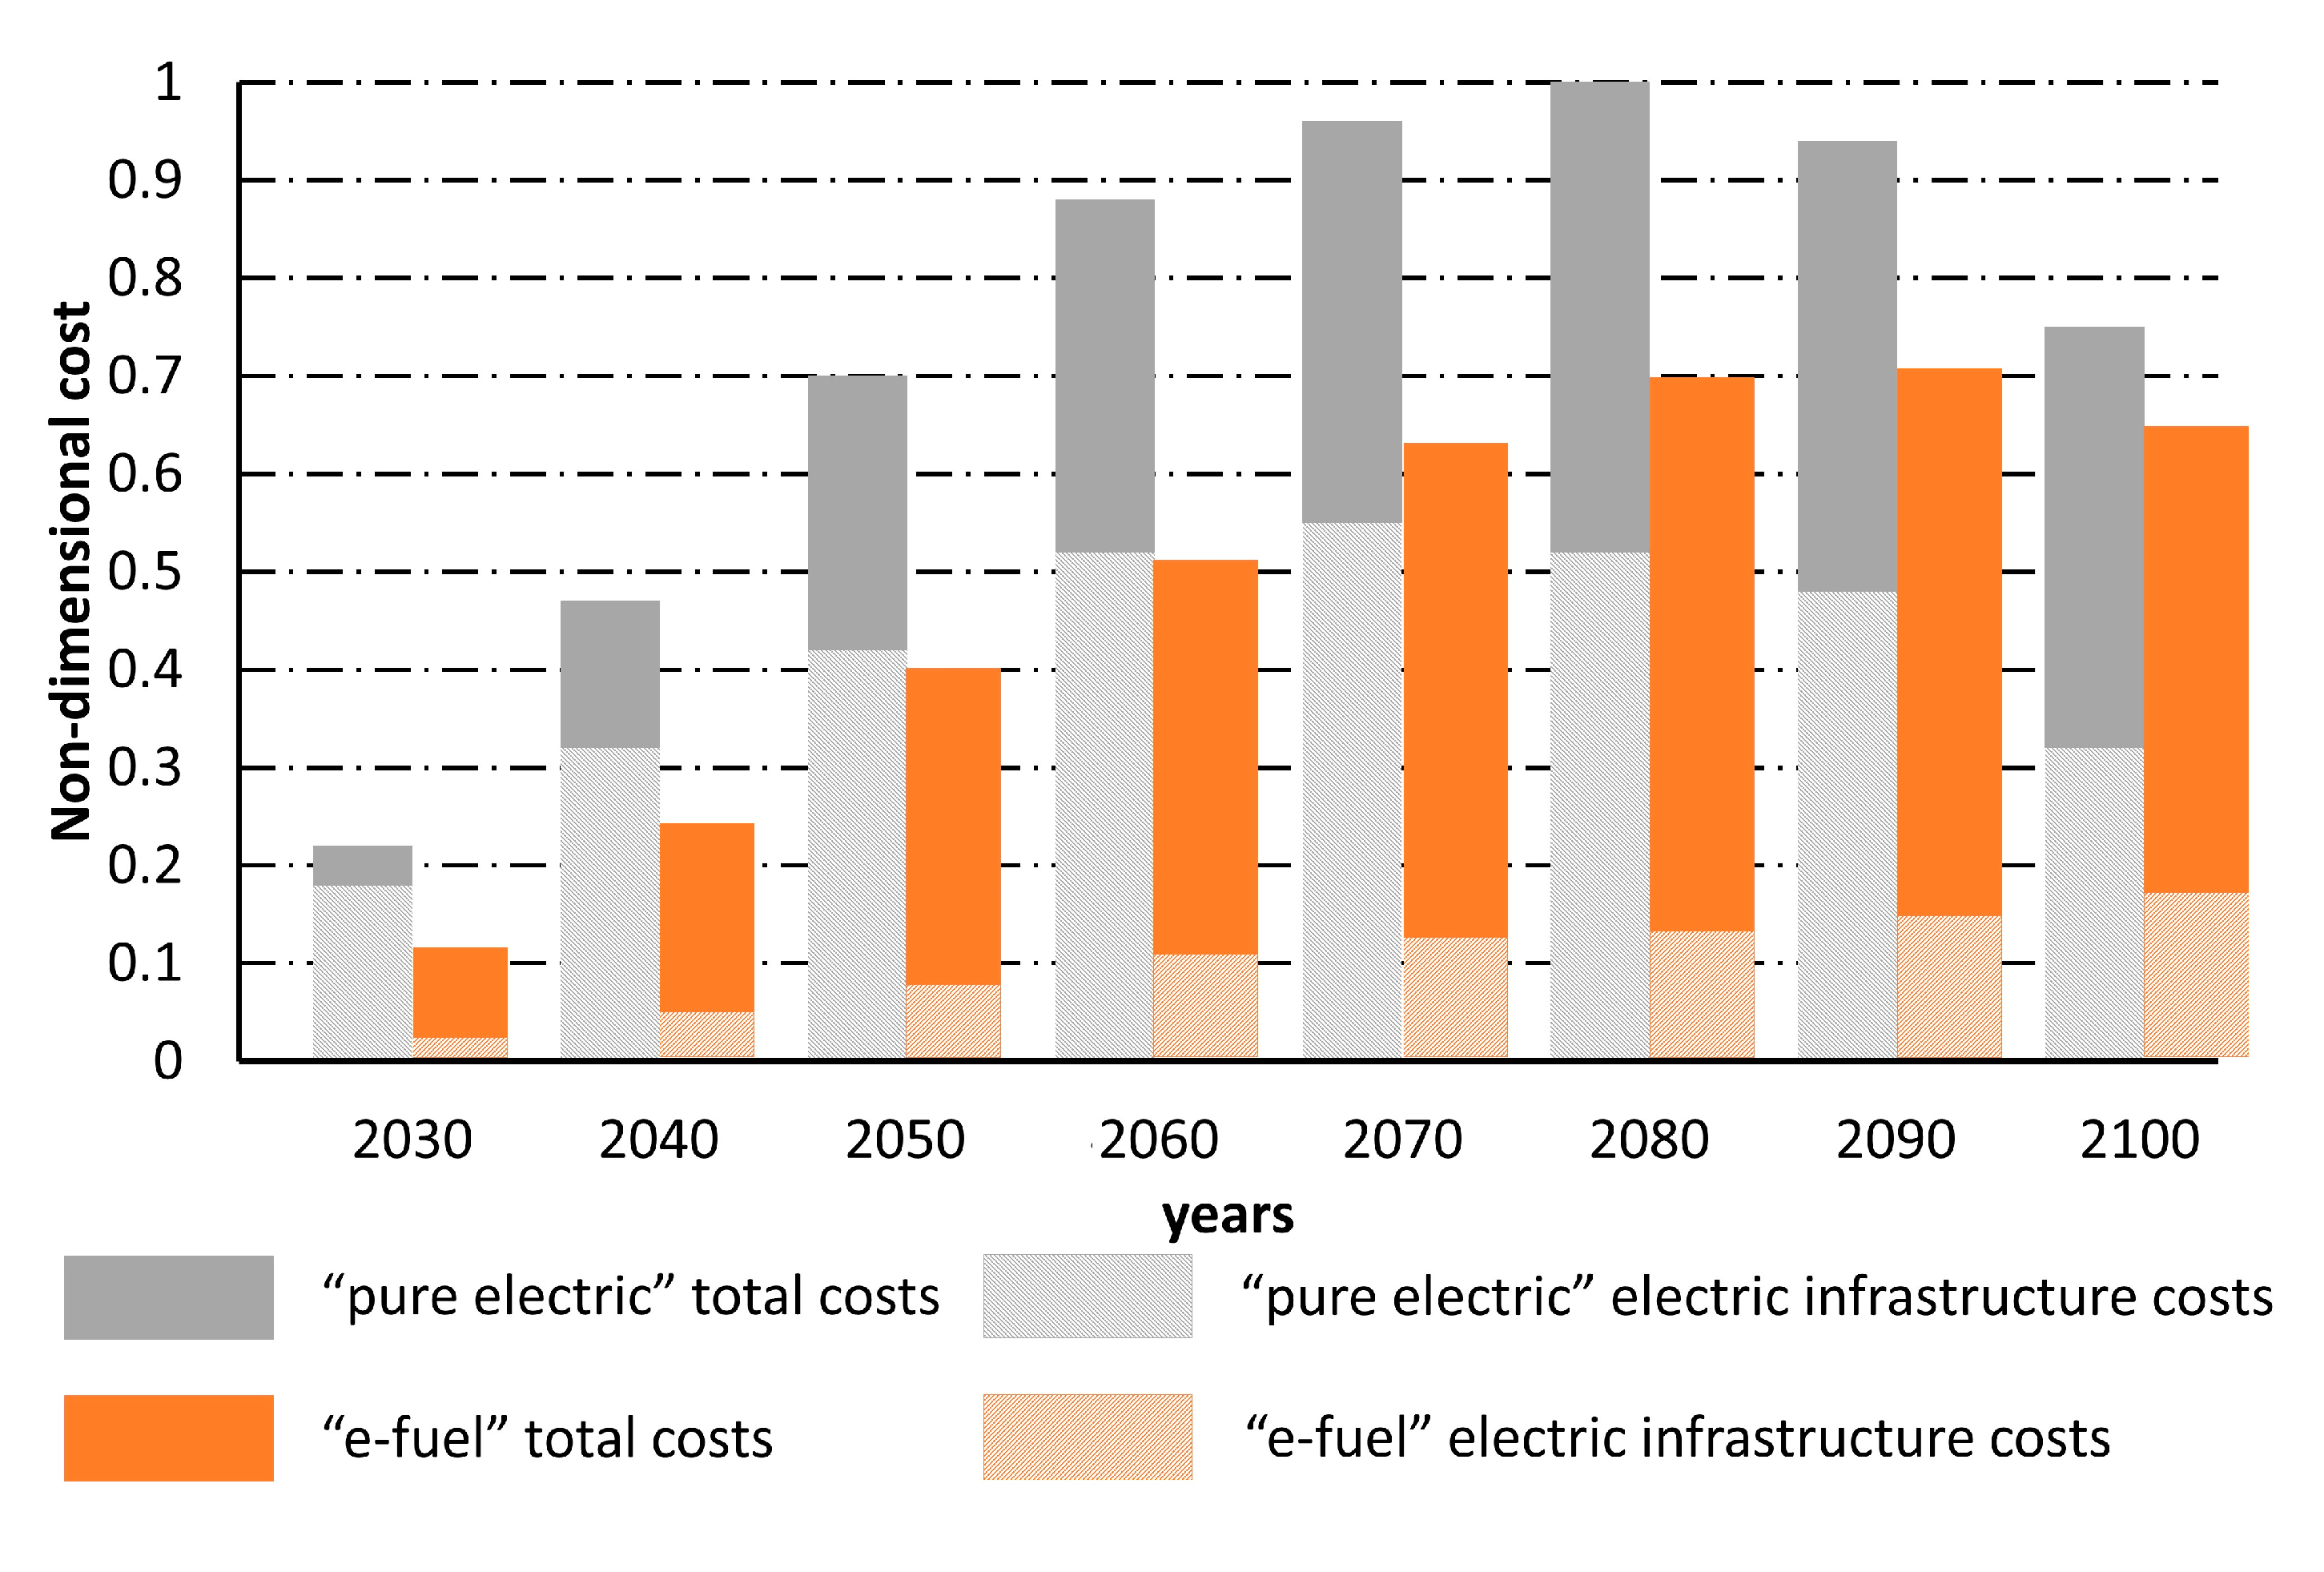
As further evidence of the aforementioned observations, Figure 12 shows the costs of each transition step associated with e-fuel and electric vehicles only, for the scenarios “e-fuel” and “pure electric”. The figure shows the total costs and the amount related to the electric infrastructure, both scaled on the maximum costs of the “pure electric” scenario. It can be observed that the electric infrastructure costs account up to 50% and up to 20% of the total costs for the “pure electric” and the “e-fuel” scenarios, respectively.

4. Conclusions

In this work, a complete model of a national energy system is utilized to evaluate the total cost of different paths for the energy transition from the present state to a 100% renewable scenario. A special focus is on light duty transportation to identify when and with which criterion it is most convenient to intervene to decarbonize the sector. The comparison between the costs of four different energy transition scenarios found the following outcomes:
  • The light duty transportation sector is cost-effective to decarbonize in the later stages of the transition, between 90% and 100% of renewable energy share. Combustion engine vehicles fueled by e-fuels are the less expensive choice considering current cost projections, both in the base case and in the pessimistic one.
  • The policy of banning fossil-fueled internal combustion vehicles starting from 2035 would increase the transition costs by 20% (considering e-fuel vehicles) to 60% (considering electric vehicles) between 2035 and 2090.
  • With the implementation of European policies related to 2035, the use of e-fuels is more cost-effective than the use of battery electric vehicles. In the case of a particularly pessimistic scenario for e-fuels (+40% of predicted costs), the cost of the energy transition in which the use of electric vehicles is imposed would still be 5% higher. This gap increases up to 30% in the case of the most likely cost scenario for e-fuels.
  • The main disadvantage of battery electric vehicles lies in the method of energy supply. The timing required for battery charging causes the need for larger extensions of the electric grid and for larger electric storage capacities than those required in the case of e-fuels. The indirect costs make electric vehicles inconvenient even though the direct costs are markedly lower than the other available options.
The results of the present analysis put into question the current European policies on decarbonization of the national energy systems. The comprehensiveness of the model and its high level of detail guarantee plausible results, obtained by considering cost projections suggested by authoritative institutions. Regarding the uncertainty about the obtained results, the large cost differences between the analyzed scenarios are indicators of overall robust results. The costs could actually vary depending on the cost projections taken into account, but not enough to change the overall conclusion of this work.

Author Contributions

Conceptualization, P.D. and M.M.; methodology, P.D.; software, P.D. and G.C.; writing—original draft preparation, P.D.; writing—review and editing, A.L. and M.M.; supervision, A.L. and M.M; investigation and data curation, G.V.; validation, E.D.C. All authors have read and agreed to the published version of the manuscript.

Funding

This research received no external funding.

Data Availability Statement

Data are available on request.

Conflicts of Interest

The authors declare no conflict of interest.

References

  1. Jain, P.C. Greenhouse effect and climate change: Scientific basis and overview. Renew. Energy 1993, 3, 403–420. [Google Scholar] [CrossRef]
  2. EEA. Climate Change Mitigation Policies and Measures. Available online: https://www.eea.europa.eu/data-and-maps/data/climate-change-mitigation-policies-and-measures-1 (accessed on 1 January 2020).
  3. International Energy Agency. World Energy Outlook 2022; IEA: Paris, France, 2022; Available online: https://www.iea.org/reports/world-energy-outlook-2022 (accessed on 23 April 2023).
  4. Cracknell, R.; Ciatti, S.; Dorofeev, S.; Eggels, R.; McManus, K.; Nakata, K. Decarbonization of mobility, including transportation and renewable fuels. Proc. Combust. Inst. 2023, 39, 1–9. [Google Scholar] [CrossRef]
  5. European Environment Agency. Transport and Environment Report 2021. Decarbonising Road Transport—The Role of Vehicles, Fuels and Transport Demand; Report No 02/2022; European Environment Agency: Copenhagen, Denmark, 2021. [Google Scholar]
  6. Egbue, O.; Long, S. Barriers to widespread adoption of electric vehicles: An analysis of consumer attitudes and perceptions. Energy Policy 2012, 48, 717–729. [Google Scholar] [CrossRef]
  7. Slowik, P.; Isenstadt, A.; Pierce, L.; Searle, S. Assessment of Light-Duty Electric Vehicle Costs and Consumer Benefits in the United States in the 2022–2035 Time Frame. International Council on Clean Transportation: Washington, DC, USA, 2022. [Google Scholar]
  8. Palacin, M.R. Recent advances in rechargeable battery materials: A chemist’s perspective. Chem. Soc. Rev. 2009, 38, 2565–2575. [Google Scholar] [CrossRef]
  9. Rivera, S.; Kouro, S.; Vazquez, S.; Goetz, S.M.; Lizana, R.; Romero-Cadaval, E. Electric vehicle charging infrastructure: From grid to battery. IEEE Ind. Electron. Mag. 2021, 15, 37–51. [Google Scholar] [CrossRef]
  10. Mueller, S.; Rohr, S.; Schmid, W.; Lienkamp, M. Analysing the Influence of Driver Behaviour and Tuning Measures on Battery Aging and Residual Value of Electric Vehicles. In Proceedings of the EVS30 International Battery, Hybrid and Fuel Cell Electric Vehicle Symposium, Stuttgart, Germany, 9–11 October 2017. [Google Scholar]
  11. Jaguemont, J.; Boulon, L.; Dubé, Y. A comprehensive review of lithium-ion batteries used in hybrid and electric vehicles at cold temperatures. Appl. Energy 2016, 164, 99–114. [Google Scholar] [CrossRef]
  12. Roy, J.J.; Cao, B.; Madhavi, S. A review on the recycling of spent lithium-ion batteries (LIBs) by the bioleaching approach. Chemosphere 2021, 282, 130944. [Google Scholar] [CrossRef]
  13. Secinaro, S.; Calandra, D.; Lanzalonga, F.; Ferraris, A. Electric vehicles’ consumer behaviors: Mapping the field and providing a research agenda. J. Bus. Res. 2022, 150, 399–416. [Google Scholar] [CrossRef]
  14. Santos, N.D.; Roso, V.R.; Malaquias, A.C.; Baêta, J.C. Internal combustion engines and biofuels: Examining why this robust combination should not be ignored for future sustainable transportation. Renew. Sustain. Energy Rev. 2021, 148, 111292. [Google Scholar]
  15. Mahapatra, S.; Kumar, D.; Singh, B.; Sachan, P.K. Biofuels and their sources of production: A review on cleaner sustainable alternative against conventional fuel, in the framework of the food and energy nexus. Energy Nexus 2021, 4, 100036. [Google Scholar] [CrossRef]
  16. Delucchi, M.A. Impacts of biofuels on climate change, water use, and land use. Ann. N.Y. Acad. Sci. 2010, 1195, 28–45. [Google Scholar] [CrossRef] [PubMed]
  17. Subramaniam, Y.; Masron, T.A.; Azman, N.H.N. The impact of biofuels on food security. Int. Econ. 2019, 160, 72–83. [Google Scholar] [CrossRef]
  18. Simmons, B.A.; Loque, D.; Blanch, H.W. Next-generation biomass feedstocks for biofuel production. Genome Biol. 2008, 9, 242. [Google Scholar] [CrossRef]
  19. Dharma, S.; Ong, H.C.; Masjuki, H.H.; Sebayang, A.H.; Silitonga, A.S. An overview of engine durability and compatibility using biodiesel–bioethanol–diesel blends in compression-ignition engines. Energy Convers. Manag. 2016, 128, 66–81. [Google Scholar] [CrossRef]
  20. Mena-Cervantes, V.Y.; Hernández-Altamirano, R.; García-Solares, S.M.; Arreola-Valerio, E. Biodiesel in circular economy. In Biofuels in Circular Economy; Springer Nature Singapore: Singapore, 2023; pp. 251–278. [Google Scholar]
  21. Das, S. The National Policy of biofuels of India–A perspective. Energy Policy 2020, 143, 111595. [Google Scholar] [CrossRef]
  22. Ausfelder, F.; Wagemann, K. Power-to-fuels: E-fuels as an important option for a climate-friendly mobility of the future. Chem. Ing. Tech. 2020, 92, 21–30. [Google Scholar] [CrossRef]
  23. Marcolongo, D.M.; Aresta, M.; Dibenedetto, A. Stepping toward the carbon circular economy (CCE): Integration of solar chemistry and biosystems for an effective CO2 conversion into added value chemicals and fuels. Adv. Inorg. Chem. 2021, 78, 289–351. [Google Scholar]
  24. Viscardi, R.; Bassano, C.; Nigliaccio, G.; Deiana, P. The potential of E-fuels as future fuels. ENEA Energ. Ambiente Innov. 2021, 1, 112–116. [Google Scholar]
  25. Zhong, J.; Bollen, M.; Ronnberg, S. Towards a 100% renewable energy electricity generation system in Sweden. Renew. Energy 2021, 171, 812–824. [Google Scholar] [CrossRef]
  26. Hrncic, B.; Pfeifer, A.; Juric, F.; Duic, N.; Ivanovic, V.; Vusanovic, I. Different investment dynamics in energy transition towards a 100% renewable energy system. Energy 2021, 237, 121526. [Google Scholar] [CrossRef]
  27. Song, S.; Li, T.; Liu, P.; Li, Z. The transition pathway of energy supply systems towards carbon neutrality based on a multi-regional energy infrastructure planning approach: A case study of China. Energy 2022, 238, 122037. [Google Scholar] [CrossRef]
  28. Bogdanov, D.; Gulagi, A.; Fasihi, M.; Breyer, C. Full energy sector transition towards 100% renewable energy supply: Integrating power, heat, transport and industry sectors including desalination. Appl. Energy 2021, 283, 116273. [Google Scholar] [CrossRef]
  29. Kalghatgi, G. Is it really the end of internal combustion engines and petroleum in transport? Appl. Energy 2018, 225, 965–974. [Google Scholar] [CrossRef]
  30. Danieli, P.; Lazzaretto, A.; Al-Zaili, J.; Sayma, A.; Masi, M.; Carraro, G. The potential of the natural gas grid to accommodate hydrogen as an energy vector in transition towards a fully renewable energy system. Appl. Energy 2022, 313, 118843. [Google Scholar] [CrossRef]
  31. Brynolf, S.; Taljegard, M.; Grahn, M.; Hansson, J. Electrofuels for the transport sector: A review of production costs. Renew. Sustain. Energy Rev. 2018, 81, 1887–1905. [Google Scholar] [CrossRef]
  32. Rech, S. Smart Energy Systems: Guidelines for Modelling and Optimizing a Fleet of Units of Different Configurations. Energies 2019, 12, 1320. [Google Scholar] [CrossRef]
  33. Gabrielli, P.; Gazzani, M.; Martelli, E.; Mazzotti, M. Optimal design of multi-energy systems with seasonal storage. Appl. Energy 2018, 219, 408–424. [Google Scholar] [CrossRef]
  34. Vellini, M.; Bellocchi, S.; Gambini, M.; Manno, M.; Stilo, T. Impact and costs of proposed scenarios for power sector decarbonisation: An Italian case study. J. Clean. Prod. 2020, 274, 123667. [Google Scholar] [CrossRef]
  35. Directorate-General for Energy (European Commission). Cost of Energy (LCOE)—Energy Costs, Taxes and the Impact of Government Interventions on Investments: Final Report. 2020. Available online: https://op.europa.eu/en/publication-detail/-/publication/e2783d72-1752-11eb-b57e-01aa75ed71a1 (accessed on 23 April 2023).
  36. Danish Energy Agency and Energinet. Technology Data—Energy Plants for Electricity and District Heating Generation. First published August 2016. Available online: http://www.ens.dk/teknologikatalog (accessed on 23 April 2023).
  37. International Energy Agency. The Future of Hydrogen; International Energy Agency: Paris, France, 2019; Available online: https://www.iea.org/reports/the-future-of-hydrogen (accessed on 23 April 2023).
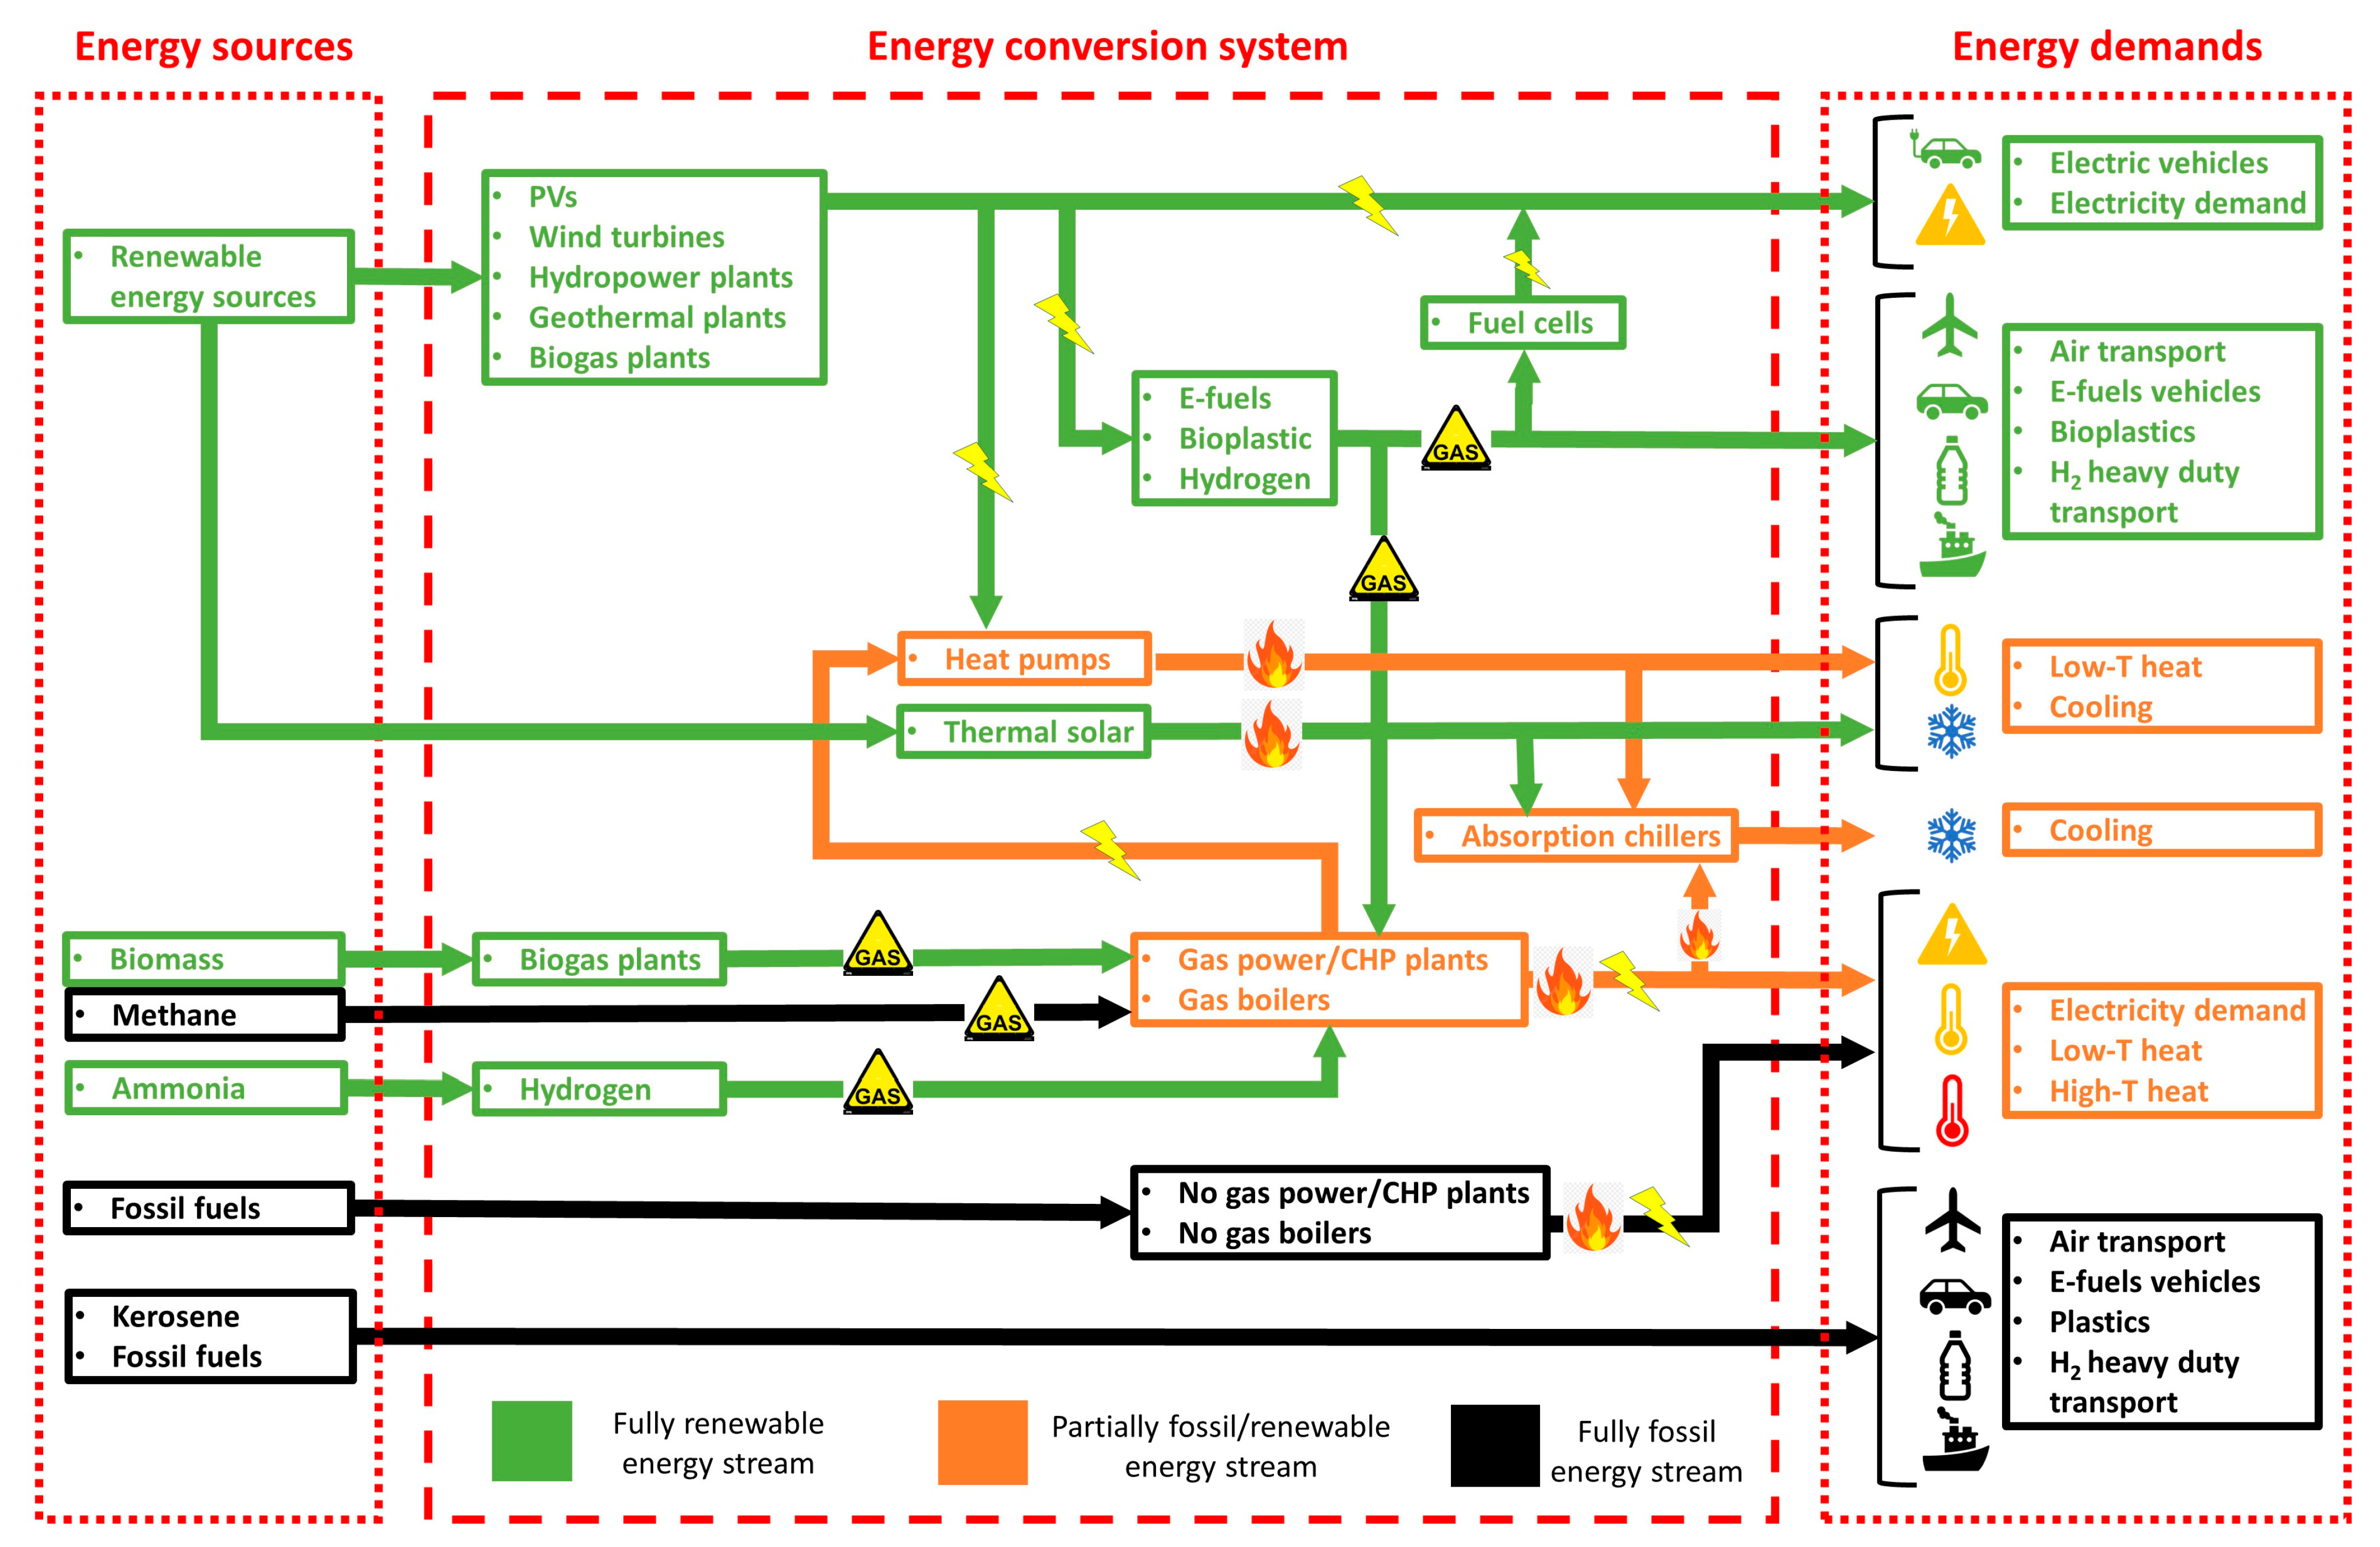
Figure 1. General framework of the national energy system.
Energies 16 05690 g001
Figure 2. Multi-regional layout of the energy system.
Energies 16 05690 g002
Figure 3. Trend of the energy demand in one day, representative of all days in one season for one macro-region of the Italian energy system.
Energies 16 05690 g003
Figure 4. Northern macro-region hourly energy demand for electric and e-fuel LDVs.
Energies 16 05690 g004
Figure 5. Energy supply chain of electric and e-fuel LDVs.
Energies 16 05690 g005
Figure 6. Cost projections.
Energies 16 05690 g006
Figure 7. Decarbonized fraction of the LDV energy demands against time.
Energies 16 05690 g007
Figure 8. LCOE and investment costs of electric and e-fuel vehicles in the considered scenarios.
Energies 16 05690 g008
Figure 9. Cost multiplying factor against system capacity factor (e-fuels).
Energies 16 05690 g009
Figure 10. Non-dimensional cumulative and step-by-step costs of the energy transition for scenarios 1,2,3 and 4.
Energies 16 05690 g010
Figure 11. Non-dimensional step-by-step costs associated with the expansion of the electric grid and electric storage for scenarios 1,2,3.
Energies 16 05690 g011
Figure 12. Non-dimensional step-by-step total and electric infrastructure costs associated with e-fueled vehicles and electric vehicles.
Energies 16 05690 g012
Table 1. List of the energy conversion units, energy storage systems, energy transport infrastructures, energy sources and demands included in the model.
Energy Conversion
Units
Energy Storage
Systems
Energy Transport InfrastructuresEnergy
Sources
Energy
Demands
Photovoltaics ElectricElectric gridSolarElectricity
Thermal solar HeatGas gridWindLow-T Heat
Wind turbinesCoolingThermal gridGeothermalHigh-T Heat
Geothermal plants Hydrogen Hydro-powerLDVs
Hydro-power plants Bio-massHDVs
Bio-methane plants AmmoniaAviation
Fuel cells MethanePlastics
Electrolyzers Fossil fuelsCooling
Fisher–Tropsch reactors Marine
Ammonia reactors
Gas power plants
Gas CHP plants
No-gas power plants
No-gas CHP plants
Gas boilers
No-gas boilers
Domestic heat pumps
Centralized heat pumps
Absorption chillers
Table 2. Types of costs utilized in the model.
Technology/FuelType of CostUnit
Gasunitary€/kWh
Bio-gasunitary€/kWh
Fossil fuel other than gasunitary€/kWh
Imported electricityunitary€/kWh
Electricity for electric LDVsunitary€/kWh
Fossil-power plantsLCOE€/kWhel
Imported hydrogenLCOH€/kWh
Bio-keroseneLCOK€/kWh
Bio-plasticLCOP€/kWh
PVLCOE€/kWhel
WindLCOE€/kWhel
PEM (gas grid injection of H2)LCOH€/kWh
H2 for heavy-duty transportationLCOH€/kWh
H2 as fuel for gas power plantsLCOH€/kWh
Charging infrastructure for electric LDVsLCOE€/kWh
Electricity for e-fuel conversion unitsLCOE€/kWh
Centralized heat pumpsInvestment€/kWth
Domestic heat pumpsInvestment€/kWth
Electric grid expansionInvestment€/kW
Gas heat pumpsInvestment€/kW
Thermal storageInvestment€/kWh
Electric storage (stationary)Investment€/kWh
Electric vehiclesInvestment€/kWh
E-fuel vehiclesInvestment€/kWh
Gas power plantsInvestment€/kW
Combined-cycle gas power plantsInvestment€/kW
No-Gas power plantsInvestment€/kW
No-Gas cogeneration power plantsInvestment€/kW
Absorption systemsInvestment€/kW
Thermal solar collectors (utility scale)Investment€/m2
Fuel cells (stationary)Investment€/kWel
Fuel cells (automotive)Investment€/kWel
H2 storageInvestment€/kWh
Gas boilersInvestment€/kW
Disclaimer/Publisher’s Note: The statements, opinions and data contained in all publications are solely those of the individual author(s) and contributor(s) and not of MDPI and/or the editor(s). MDPI and/or the editor(s) disclaim responsibility for any injury to people or property resulting from any ideas, methods, instructions or products referred to in the content.