Article

Features and Evolution of Global Energy Trade Patterns from the Perspective of Complex Networks

1
Business School, China University of Political Science and Law, Beijing 100088, China
2
Center for Artificial Intelligence and Mathematical Data Science, Okayama University, Okayama 700-8530, Japan
3
School of Economics, Hebei University, Baoding 071000, China
4
Graduate School of Humanities and Social Sciences, Okayama University, Okayama 700-0583, Japan
*
Author to whom correspondence should be addressed.
Energies 2023, 16(15), 5677; https://doi.org/10.3390/en16155677
Submission received: 15 June 2023 / Revised: 18 July 2023 / Accepted: 26 July 2023 / Published: 28 July 2023
(This article belongs to the Special Issue Risk Management in Carbon and Oil Markets)

Abstract

:
As an integral part of economic trade, energy trade is crucial to international dynamics and national interests. In this study, an international energy trade network is constructed by abstracting countries as nodes and representing energy trade relations as edges. A variety of indicators are designed in terms of networks, nodes, bilaterals, and communities to analyze the temporal and spatial evolution of the global energy trade network from 2001 to 2020. The results indicate that network density and strength have been steadily increasing since the beginning of the 21st century. It is observed that the position of the United States as the core of the international energy market is being impacted by emerging developing countries, thus affecting the existing trade balance based on topological analysis. The weighted analysis of bilateral relations demonstrates that emerging countries such as China, Brazil, and Saudi Arabia are pursuing closer cooperation. The community analysis reveals that an increasing number of countries possess strong energy trade capabilities, resulting in a corresponding increase in energy trade volumes.

1. Introduction

Energy is essential to a wide range of economic and social activities in modern societies, sometimes referred to as the “blood of the modern economy” [1]. From a micro perspective, energy is inseparable from an individual’s everyday life, as it serves as the foundation for various essential aspects such as food, transportation, and heating. With the advancement of relevant energy technologies, the lives of people are increasingly being affected by the broad impacts brought about by energy [2,3]. Simultaneously, multinational energy corporations, as micro-entities within the global energy trade network, are profoundly influenced by the fluctuations in energy trade, which significantly impact their operations and growth [4]. From a macro perspective, energy is a necessary resource for a country’s economic development, so for countries with scarce energy resources, energy is an important constraint on economic development [5]. For countries with enough energy resources, economic development can be achieved through energy export and processing. In addition, the economic structure of emerging countries remains dominated by secondary industries, which require large amounts of energy to support them. This also leads to a large global energy demand [6]. Simultaneously, the progress and emergence of renewable energy technologies, such as advancements in new energy vehicles and photovoltaic power generation, have contributed incalculably to sustainable development across various countries worldwide [7,8,9]. With the deepening of economic globalization, economic ties between countries around the world are strengthening, and cross-border trade is becoming more frequent. Due to the special economic and political status of energy [10], energy trade has become an important part of world commodity trade. However, the imbalance between supply and demand in energy regions is intensifying. As a result, international flows of energy have deepened, and energy trade has become spatially extensive, diversified in content, and complex inflow [11].
In recent years, the global geopolitical situation has undergone rapid and complex changes, and energy trade sanctions have become more frequent. Against the backdrop of international trade frictions and economic downturns, energy security has attracted the attention of the international community. Many studies have explored the dynamics of energy trade networks. For example, Zhang et al. analyzed the competitive network of the oil trade and found that today’s oil trade is highly interconnected, and global competitive patterns are taking shape [12]. Geng et al. investigated the global natural gas trade network and found that the North American trade area, the Asia-Pacific trade area, and the European trade area form the three largest natural gas trade clusters in the world, a “nuclear perimeter” structure. Although the European and Asian markets are more integrated, a unified global natural gas market has not yet formed [13]. Gao et al. applied the multilayer network theory to analyze international fossil energy trade and constructed three trade networks for natural gas, coal, and oil. They found that only a few countries have major trading partners and only a few countries play an important role in trade intensity. Furthermore, they showed that natural gas networks have more communities and greatest stability than coal and oil networks [14].
In the present study, complex network theory is introduced to cross-border energy trade, considering it as a heterogeneous network and a new method and perspective for understanding the global energy trade structure based on an analysis of the attributes of energy commodities is proposed. First, a cross-border energy trade network is constructed that includes a wide range of energy types and comprises two types of participants: energy sellers and energy buyers. Then, the diversity of national energy trade, national energy trade preferences, and the topological characteristics of the global energy trade are analyzed using different indices to determine the strength of energy investment relationships among countries.
The first contribution of this study is the application of a complex network approach to cross-border energy trade and the construction of a cross-border energy trade network that covers a more comprehensive range of energy types. This network model not only considers the energy trade relationships between different countries but also reflects the cooperation and competition among countries, thus providing a more comprehensive understanding of the forms and characteristics of cross-border energy trade. Furthermore, the methodology of this study offers new ideas and methods, expands the research perspective of cross-border energy trade, and helps to explore the evolution and trends of the energy market in depth.
The second contribution of this study is that we explore the evolutionary trends of the world’s energy trade network from spatial and temporal perspectives. First, this study considers the global energy trade network as a whole and identifies overall trends in its evolution. Then it analyzes the global trade network at three levels—points, lines, and communities—and identifies clusters of countries and regions that are strongly related in terms of discursive power, energy trade among countries, and energy markets.
The third contribution of this study is the formulation of recommendations related to the development of global energy trade networks. These recommendations have positive implications for the promotion of sustainable development of cross-border energy trade. Cross-border energy trade plays a vital role in globalization. It promotes cooperation and countries mutually benefiting and provides opportunities to balance energy supply and demand. However, cross-border energy trade also faces a series of challenges, including political risks, environmental sustainability, and energy security. With regard to this, the present paper offers relevant policy proposals from two perspectives: maintaining the stability of the global energy trade and enhancing the diversity of the global energy trade networks. These proposals are intended to help to ensure the stability and reliability of energy supplies, promote the energy industry’s sustainable development, and encourage international cooperation and win-win outcomes.
The remainder of this paper is summarized as follows: Section 2 presents the literature, Section 3 explains our dataset and methodologies, Section 4 shows the empirical results, and Section 5 concludes.

2. Literature

The existing literature on energy trade has provided valuable insights into the internal logic and global patterns of energy trade. However, the relevant research includes several flaws. With the deepening of globalization, all countries are part of a global network, and it is more reasonable to expand the area of study to a global analysis. To address these issues, this paper aims to overcome the limitations of a single-energy, local area analysis. Instead of expressing energy trade characteristics in terms of coal, natural gas, and oil, energy classifications, and codes are utilized in this study to comprehensively reflect energy (the standard of the energy codes used in this paper is GB/T 29870-2013 [15]). Countries are abstracted as nodes, and energy trade relations are represented as edges in order to construct an international energy trade network. Various indicators are designed in terms of networks, nodes, bilaterals, and communities. The evolutionary characteristics of the entire network are also analyzed from the two dimensions of time and space to explore the internal logic and essential causes behind the evolutionary history of energy trade. The goal is to provide a comprehensive understanding of the overall national and regional energy trade landscape, its place in energy trade, and a database for formulating international energy trade policies. Ultimately, the study contributes to the development of international energy trade.
Some studies have explored patterns of global energy trade by constructing networks for electricity [16] or clean energy [17], but studies focusing on transnational energy trade have used international institutions as their research samples. For example, Lu et al. analyzed new energy consumption and trade relations among the BRICS countries. They found that China’s competitiveness in coal trade with the other BRICS countries has been decreasing over the years, whereas Russia shows the opposite trend [18]. In addition, Chen et al. found that cooperation between China and Russia in crude oil trade is steadily increasing. India and Russia have strong complementarities in crude oil trade, but the drivers are not stable: Russia has always had a stable and superior supply capacity in natural gas trade among the BRICS countries [19]; Zhang et al. constructed an oil trade network for countries along the “One Belt, One Road Initiative” and the depth of trade revealed a strong relationship with regional politics, transportation facilities, and cultural exchanges [20]; Li et al. constructed a natural gas trade network for the countries along the “One Belt, One Road Initiative” and found that the countries have become more interdependent over time, indicating that trade ties between countries and regions along the “One Belt, One Road Initiative” are becoming stronger [21].
Some studies have also analyzed the cross-border energy trade of individual countries [22]. Zhong et al. constructed three major international trade networks of fossil energy and found that such international energy trade networks exhibit scale-free characteristics with a power-law distribution and high aggregation. They also exhibit a certain heterogeneity [23]. Studies have also analyzed energy trade from a regional perspective, focusing mainly on energy trade in specific countries. For example, Zhang et al. constructed a dual-mode network and determined that China plays an important role as an import initiator and core country in the trade network [24]. Yang conducted a thorough analysis of China’s domestic energy trade using the Input–Output method and concluded that there had been shifts from oil and gas energy trade to renewable energy trade, from oil and gas-based investment to diversified energy investment, and from explicit energy trade to implicit energy trade [25]. Song et al. constructed an energy trade network of countries along the “One Belt, One Road Initiative” and classified the networks as star or regular networks [26]. Gao et al. suggested that the energy trade networks of countries along the “One Belt, One Road Initiative” show an increasing connection but that these networks remain unstable [27].

3. Data and Methods

Section 3 provides a detailed description of energy data and explains the specific methodology used to construct the energy trade network. Diverse indicators are designed and defined from the perspectives of network, node, bilateral, and community.

3.1. Data

The present study examines global inter-country energy trade from 2001 to 2020. The data used in this study were obtained from the United Nations Comtrade database, and the energy definitions are based on the Energy Classification and Codes (standard number: GB/T 29870-2013). In HS 2002, 21 four-digit codes are selected to represent nine energy categories and their subcategories. These categories include petroleum and petroleum products (2708, 2709, 2710, 2712, 2713, 2715), coal and coal products (2701, 2702, 2704, 2705, 2706, 2707), natural gas (2711), biomass energy (1213, 4401, 4402), electric energy (2716), oil shale and oil sands (2714), cobalt (2605), peat and peat products (2703), and nuclear (2612).
To facilitate the study, transactions in which the cooperating country is “world” are excluded from the analysis. The remaining trade transaction data are organized in the order of exchange between the reporting and cooperating countries, with trade flows labeled as “imports” and “re-imports” unified as “exports”. Furthermore, trade volumes are unified to dollars. A total of 1,012,804 trade transaction data points are included in the final analysis. See Table 1 for more details.

3.2. A Global Energy Trade Network

A powerful framework is provided by complex network theory for studying and analyzing interconnected systems in various domains, including social networks, biological networks, and transportation networks. In the context of energy trade, the application of complex network methods offers a valuable approach to understanding the structure and dynamics of the global energy trade network. By representing energy trade exchanges as a network, the complex relationships and patterns among countries involved in the energy trade system can be explored. Through complex network analysis, a deeper examination of the characteristics and evolution of cross-border energy trade is enabled.
Energy trade exchanges can be considered a network where each country is represented by a node, and trade flows between two countries are represented by connections between two nodes. However, since trade varies between countries, the volume and quantity of trade must be considered to determine the strength of each connection. Although the limited range of trade frequencies makes it difficult to reflect differences across borders, the large volume of each trade can clearly reflect the differences in trade transactions and the strength of energy trade connections [28]. Therefore, this paper proposes constructing a weighted international energy trade network by utilizing trade volumes as the weights of the border assignments.
An international energy trade network G = C , L is constructed using the energy trading relationships between different countries. For the network, G = C , L , the number of countries is denoted as N, and country i is represented by one of N nodes, where the set of countries is denoted as C = i = 1 , 2 , 3 , , N . The directional connection between country i and country j is denoted by e ij = 1 i j , i C , j C , which represents the energy trade between the two countries, and the set of energy trades is denoted as L = { e ij   |   i = 1 , 2 , 3 , , N , j = 1 , 2 , 3 , , N , i j } . Additionally, since international energy trade occurs between different countries, it can be inferred that set L corresponds to an asymmetric matrix [29].
Next, consideration is given to assigning weights to the network in order to justify the trade volume. The larger the trade amount is, the stronger the energy trade connections between the two countries. An international energy trade-weighted network G = V , W is constructed where country i has n ij n ij 0 energy trade with country j . The total trade volume of these instances is m ij m ij 0 . The weight of the edge between country i and country j is W ij , denoted as W ij = m ij W ij 0 .

3.3. Analysis of the Global Energy Trade Network

3.3.1. Overall Characteristics of the Global Energy Trade Network

The average shortest path length is a metric defined as the average of the shortest path lengths between all pairs of countries in the network. It is used to quantify the average distance or number of connections that are required to reach one country from another. The value of the average shortest path length can be interpreted as a measure of the closeness or proximity between countries within the network. A smaller average shortest path length indicates shorter trade distances between countries, which implies better accessibility and closer trade links between them.
AL = 2 i > j d ij N N 1
where d ij represents the number of steps in the shortest path from node i to node j .
The average clustering coefficient is defined as the ratio between the number of countries involved in actual energy trade relations of a particular country and the maximum possible number of trade relations between these countries. It quantifies the degree of clustering or the extent to which countries tend to form clusters or trade with neighboring countries in the network [30]. A higher average clustering coefficient indicates a higher volume of trade interactions and a stronger clustering pattern between countries. Mathematically, the average clustering coefficient can be expressed as follows:
C i = 2 P i k i × ( k i 1 )
where k i represents the number of countries with which country i has energy trade and P i represents the maximum number of possible trade relationships for k i countries.

3.3.2. Characteristics of Global Energy Trading Network Nodes

The degrees of nodes in the network are divided into out-degree and in-degree. The out-degree represents the number of countries to which country i exports energy, while the in-degree represents the number of countries from which country i imports energy. In the international energy trade network, let k i , out and k i , in represent the out-degree and in-degree of country i , respectively. The larger the degree of a country, the more countries it has as trading partners, indicating a stronger and more central position of the country. Let f k out and f ( k in ) denote the sets of countries with out-degree and in-degree equal to k out and k in , respectively, as proportions of the total number of countries. Thus, the functional relationships between f k out and k out represent the out-degree distribution of countries, and that between f ( k in ) and k in represents the in-degree distribution [12,31].
The weighted degree of a node corresponds to the trade amount assigned to the country. s i , out = j = 1 n m ij represents the weighted out-degree of country i , which is the total amount of energy trade from country i to other countries. Similarly, s i , in = j = 1 n m ji represents the weighted in-degree of node i , which is the total amount of energy trade from other countries to country i . f s out and f ( s in ) denote the sets of countries whose weighted out-degree and in-degree are exactly equal to s out and s in , respectively, as proportions of the total number of countries. Therefore, the functional relationship between f s out and s out is the weighted out-degree distribution of countries, and that between f ( s in ) and s in represents the weighted in-degree distribution.

3.3.3. Bilateral Characteristics of the World Energy Trade Network

The unilateral bilateral relationship is defined as a metric that measures the intensity of energy exports from country i to country j. It serves as an indicator of the level of cooperation between country j and its energy trade partner, country i. When there is a higher unilateral intensity from country i to country j, it signifies a stronger collaboration between the two countries in terms of energy trade. To elaborate, the unilateral bilateral relationship captures the extent to which country i contributes to the energy supply of country j. It reflects the volume or magnitude of energy exports from country i to country j, thereby highlighting the importance and dependency of country j on country i as an energy supplier. A higher unilateral intensity implies a greater reliance and interconnectedness between the two countries in their energy trade activities [32]. The function is as follows:
OBR i j = d ij i = 1 N j = 1 N d ij  
The bilateral relationship is defined as a measure that quantifies the energy trade intensity between country i and country j. It is utilized as an indicator of the energy trade capacity between the two countries. When there is a higher bilateral relationship between countries i and j, it signifies a larger volume of energy imports and exports exchanged between them. To elaborate, the bilateral relationship captures the extent of energy trade activities between country i and country j. It reflects the magnitude and significance of energy imports and exports, thereby indicating the level of integration and collaboration in their energy trade. A higher bilateral relationship implies a stronger energy trade partnership and a greater volume of energy flows between the two countries. The function is as follows:
TBR i j = d ij + d ji i = 1 N j = 1 N d ij

3.3.4. Community Characteristics of the Global Energy Trade Network

The k-core algorithm is a subgraph mining algorithm used to identify a set of vertices in a graph that meets a specified coreness criterion. Within the resulting subgraph obtained from the k-core algorithm, each vertex is required to have a minimum degree of k, and all vertices must be connected to at least k other nodes within the subgraph. The k-core algorithm is typically utilized for subgraph partitioning a graph by eliminating less significant vertices, thereby revealing the subgraph that satisfies the desired criteria for further analysis. K-core represents the connectivity of the subgroups in the global energy trade network. In this study, the k-core algorithm is employed to remove countries with degrees below k and any duplicate links associated with them, and the resulting remaining subgroups are called k-core subgroups. When country i belongs to the k-core subgroup but not the (k + 1)-core subgroup, the value of country i is k. The highest k-value among all countries also represents the k-value of the network, and all countries with the highest k-value form a fully connected subgroup. In the global energy trade network, the countries with the highest k-value have important energy export or import capabilities and collectively occupy a central position in the energy trade market.

4. Analysis of Empirical Study Results

In Section 4, a detailed analysis of the evolutionary characteristics of the global energy trade network is conducted in terms of time and space, using the indicators designed in Section 3. The basic logic and essential causes behind the evolution of energy trade are explored.

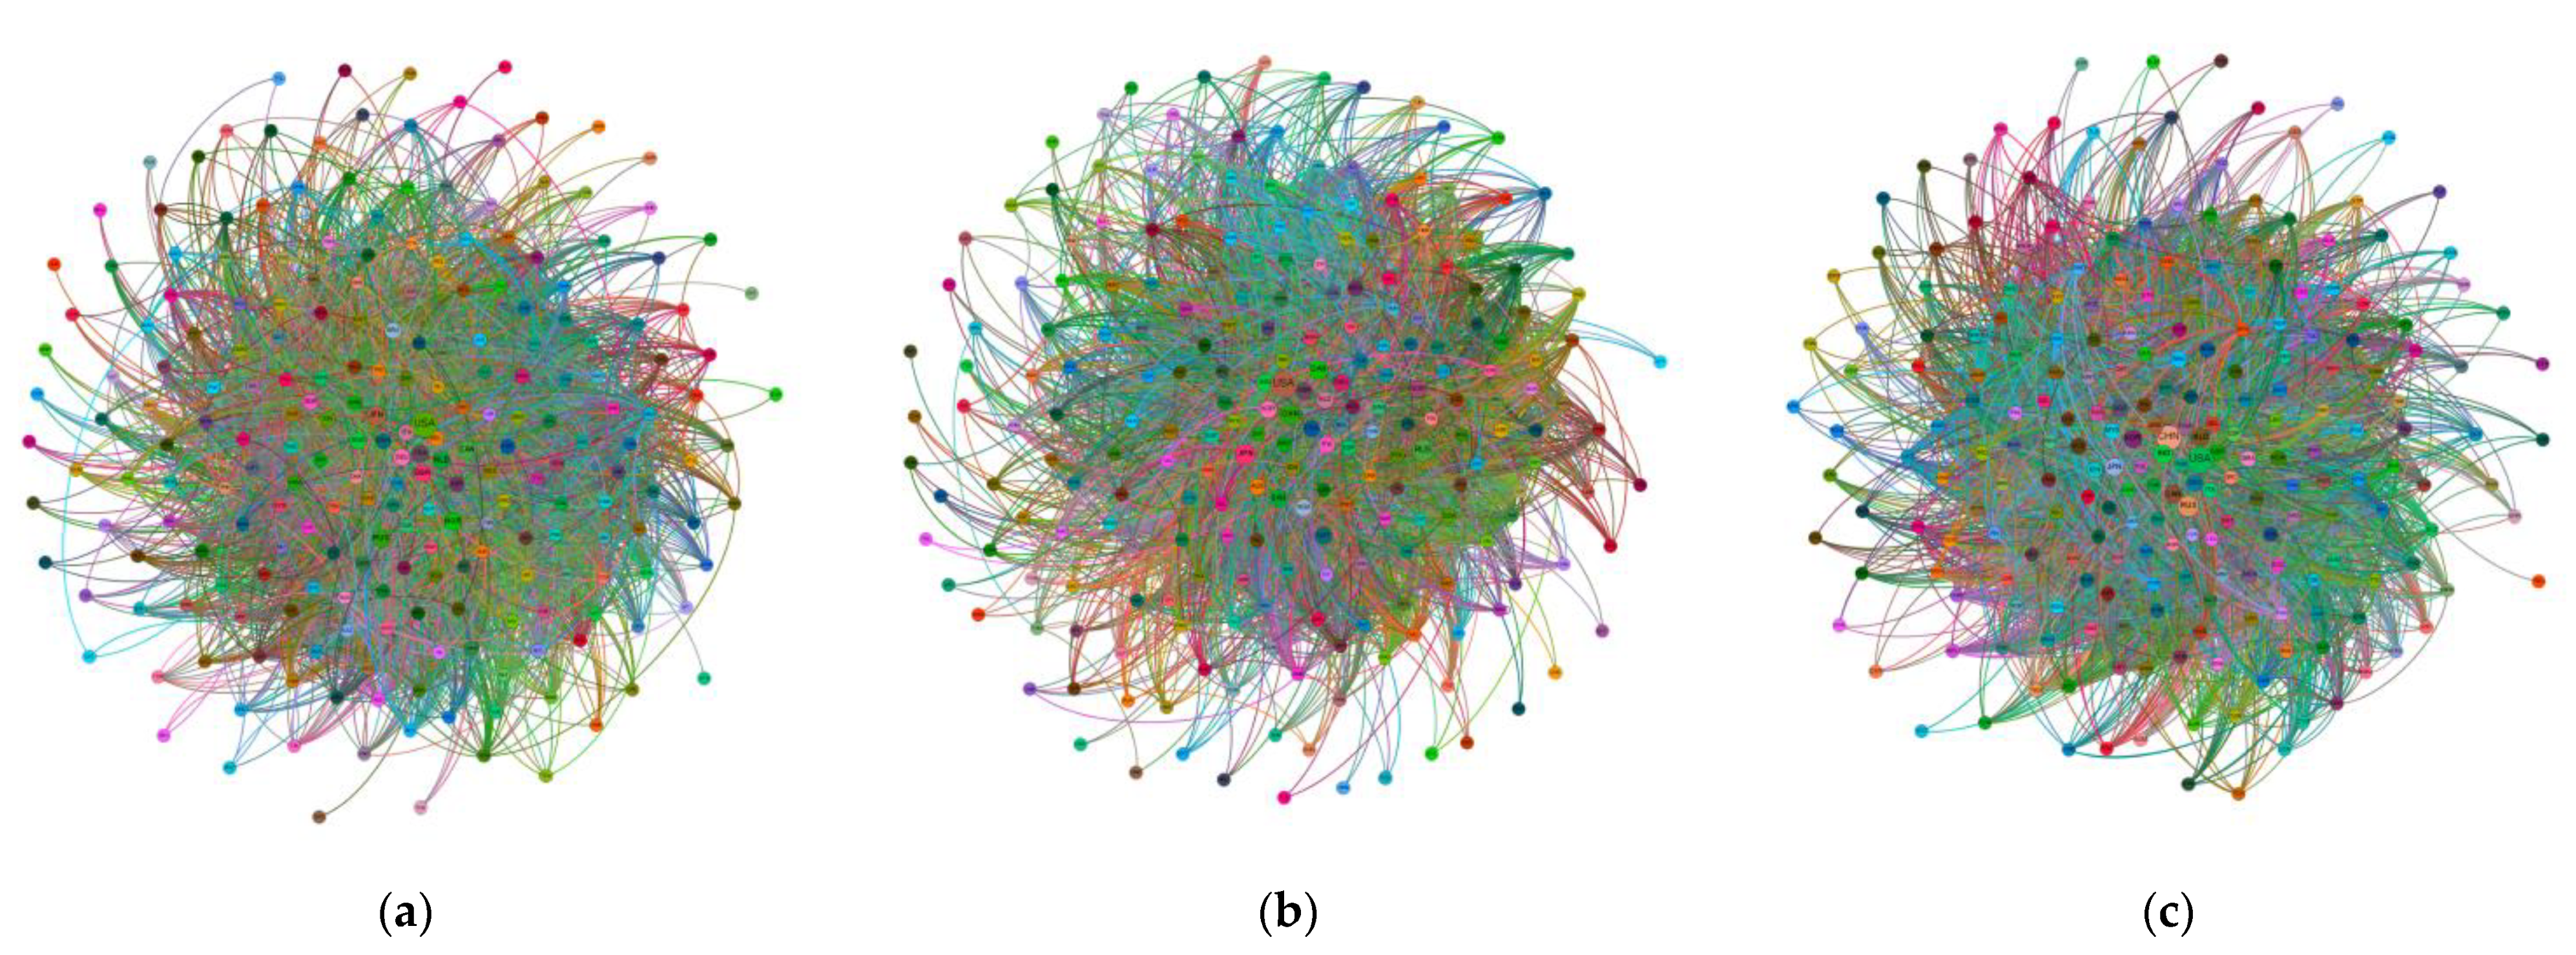
4.1. Temporal Evolution of the Global Energy Trade Network

To visualize the topology and evolution of the global energy cross-border trade network more visually, this study uses Gephi-0.9.2 software to create a visual representation of the cross-border trade country network: 2001 (Figure 1a), 2011 (Figure 1b), and 2020 (Figure 1c). In each case, the global energy trade network is constructed using trade values as weights. Comparing the spatial structure of trade networks provides insight into the evolutionary properties of the networks. The size of a country node in the network topology map represents the weight of that country, measured by the total number of M&As at that node, regardless of direction. The arrow direction of the lines in the map represents the direction of capital flows, and the line thickness represents the frequency of energy trade activities between the two connected countries. The result is a global cross-border energy trade network topology map.
For ease of reference, a table of country abbreviations is compiled, as shown in Table 2. Due to space limitations, only commonly mentioned countries in the text are presented.
As trade between energy-demanding and energy-supplying countries increases, the world energy trade network exhibits different stage characteristics over time. Table 3 records the main topological indicator values of the world energy trade network over the 20-year period from 2001 to 2020. Over this period, the number of countries involved in energy trade is projected to range from 228 to 234, indicating a clear trend in trade-exposed countries. The number of border zones has increased significantly, from 8089 in 2001 to 11,465 in 2020, implying an increase of 41.74%. The average order of the network was only 35.478 in 2001, but it has remained around 50 since 2012. The average clustering coefficient shows a slight upward trend from 0.613 to 0.717, indicating increases in the density and intensity of the global energy trade network. The average path length decreased sharply to 0.3001 in 2002; it has increased slightly since then but remains below the 2001 level. These results suggest that the world energy trade network is highly accessible and trade-efficient between countries during this period.
In terms of temporal movements, global energy trade experienced two major declines in 2011 and 2018, which can be attributed to the increased international interest in environmental issues. In particular, the United Nations Climate Change Conference held in Copenhagen in December 2009 led many countries to sign the Copenhagen Accord and commit to reducing greenhouse gas emissions [33]. These national policies and actions have had a direct impact on energy trade as demand in the global energy market has weakened and prices have fallen. Key network indicators showed special values in 2011. However, after markets adapted and adjusted to the policy changes, energy trade gradually recovered to its original levels, peaking again in 2018.
However, with the rise of unilateralism and protectionism in the world in 2019, intensifying trade friction, Brexit-related uncertainty, a surge in non-tariff measures, geopolitical tensions, and the impending climate crisis, energy trade did not recover significantly that year [34]. Furthermore, the outbreak of the COVID-19 pandemic in 2020 restricted the transportation industry, leading to a continued decline in energy trade trends [35]. At present, the energy trade market remains in a long recovery period.

4.2. Analysis of Import/Export Patterns in the Global Energy Trade Network

As mentioned, the out-degree represents the number of countries to which energy is exported, while the in-degree represents the number of countries from which energy is imported. By assigning trade amounts as weights to the out-degree and in-degree of a particular country, the weighted out-degree and weighted in-degree can be obtained. In Table 4, the top ten countries in terms of out-degree, in-degree, weighted out-degree, and weighted in-degree in global energy trade in 2001 are summarized and presented. As shown in Table 4, without considering trade volumes, the major energy-importing countries in 2001 were the U.S., France, the U.K., Germany, Belgium, Italy, Spain, and Japan. The major energy exporters are the U.S., the U.K., France, Germany, Belgium, the Netherlands, Norway, Canada, Saudi Arabia, and Venezuela. The largest importers and exporters, mainly developed Western countries, remain largely unchanged in their rankings.
When trade volumes are considered, the largest energy importers are the U.S., Japan, Germany, France, South Korea, the U.K., Italy, Spain, the Netherlands, and Belgium—the U.S. imports about twice as much as Japan, the second largest importer. The major energy exporters are Russia, Canada, Norway, Saudi Arabia, the U.K., the Netherlands, Kuwait, Venezuela, Iran, and Mexico.
Most of the largest energy importers are developed Western countries, which are heavily dependent on industry and have high energy demands. On the other hand, most energy exporters are emerging developing countries rich in natural resources and relying on energy exports as a driving force for economic growth. In sum, developed and developing countries played important but different roles in the global energy trade network at the beginning of the 21st century [36]. A comparison in Table 4 shows a significant change in ranking before and after weighting. Japan moves from 9th to 2nd place when weight is considered in the entry (i.e., penetration) ranking, while Korea jumps to 5th. These results suggest that Japan and Korea have maintained high trade volumes despite having few trading partners. In addition, in the weighted output rankings, the U.S. drops from 1st to 10th place, the U.K. drops from 2nd to 5th place, and the Netherlands drops from 6th to 9th place. Most Western industrialized countries have many export links, but their trade volumes and values are relatively small. Emerging developing countries, however, while having small numbers of trading partners, have large volumes of trade, indicating the presence of important energy trading partners [37,38].
Table 5 presents a summary of the top ten countries in terms of out-degree, in-degree, weighted out-degree, and weighted in-degree in global energy trade in 2011. In 2011, without weighting, the top five energy importing countries were China, the U.S., the U.K., Germany, and France, as shown in Table 5. For energy exports, the top five countries include China, Canada, the U.S., France, and the Netherlands. Notably, China, the U.S., and France are in the top five in both the import and export rankings and have multiple trading partners. After accounting for weights, the countries in the top five for both imports and exports are the U.S., Saudi Arabia, Russia, China, and the Netherlands. The top five countries with weighted exits are the U.S., China, Japan, Russia, and South Korea. The U.S., China, and Russia maintain the top five weighted entries and exits, indicating that their energy imports and exports are significant in terms of trade value.
A comparison of Table 5 with Table 4 reveals significant changes over the 10 years. With regard to imports and exports, the most notable change is that China has replaced the U.S. as the top importer and exporter, with 158 imports and 155 exports in 2011, respectively. It implies that China’s diversified trade association countries are associated with “in” and “out” strategies [39,40]. For weighted inputs and outputs, the U.S. has jumped significantly, reaching 1st place, unlike in 2001. Active U.S. trade has been boosted by the post-financial crisis economic recovery. Furthermore, since 2001, several emerging developing countries have moved into the top 10 in the weighted entry ranking, while several developed Western countries are in the weighted exit rankings. This is because emerging developing countries have embarked on large-scale infrastructure and industrial development that requires large energy supplies. On the other hand, Western developed countries have sufficient supplies to meet their own needs [33,41].
Table 6 presents a summary of the top ten countries in terms of out-degree, in-degree, weighted out-degree, and weighted in-degree in global energy trade in 2020. As shown in Table 6, the Netherlands, the U.S., China, the United Arab Emirates, and Belgium ranked among the top five energy importers in the 2020 Global Energy Trade Network. The Netherlands ranks first with a score of 150, lower than China’s 158 in 2011. China, the U.S., the Netherlands, Turkey, and France rank in the top five for energy exports. China’s export score of 199 is well above its highest scores in 2001 and 2011, indicating extensive energy export cooperation with other countries.
In terms of weighted in-degree, the U.S., China, Russia, Saudi Arabia, and the Netherlands rank in the top five after taking into account the weight of energy transactions. In terms of production, China, the U.S., Russia, India, and South Korea are among the top five. In weighted participation and weighted out-degree, the U.S., China, and Russia all rank in the top three, with the U.S. and China, respectively, in the first place positions.
The ranking shows that emerging developing countries such as the United Arab Emirates, India, China, and Turkey are playing a greater role in the global energy market compared to 2011. The Netherlands rose from 8th in 2001 to 6th in 2011 and 1st in 2020. China rose from 7th in 2001 to 1st in both 2011 and 2020, reflecting the current multipolar pattern. In addition, in terms of participation and output weights, developing countries such as China, Saudi Arabia, India, and Russia are major players in energy import and export transactions, approaching and influencing the central position of the U.S. in energy trade.
When considering Table 4 and Table 6 together, it can be observed that in 2001, among the top ten countries with the highest weighted in-degree, only China, a developing country, was included, ranking tenth. However, by 2020, four developing countries were among the top ten. This further confirms the earlier statement that the position of developing countries has been elevated in import patterns. Furthermore, in 2001, five of the top ten countries in terms of energy exports were developed countries. However, by 2020, developed countries occupied seven out of the top ten positions, thereby confirming the assertion that the presence of developed countries has increased in the export market. These findings provide further evidence of the rising importance of developing countries in the import landscape while indicating an increased involvement of developed countries in energy exports.

4.3. Analysis of Bilateral Relations between Countries in the Global Energy Trade Network

Table 7 displays the top 10 pairs of countries in terms of OBR values, showing that the top 10 unilateral export relationships in 2001, 2011, and 2020 represent 21.36%, 15.16%, and 15.58% of the network, respectively. Only a few countries are becoming less dominant in the global energy trade network, and the diversified nature of global energy trade is becoming increasingly evident [42].
Further examination of Table 7 shows that in 2001 and 2011, the country with the most unilateral bilateral relationships was the U.S., and Canada was a major U.S. energy importer. In 2001, Canada’s OBR to the U.S. was 7.12%, far ahead of Venezuela’s energy exports to the U.S., which ranked second. In 2011, Canada’s sole export to the U.S. declined but still ranked first. In 2020, China had five top 10 unilateral bilateral relationships. China’s influence in the energy trade market has increased, with its trading partners being mainly Russia, Iraq, and other lesser-mentioned countries, further indicating the collapse of the energy trade dominated by a few countries. It can be observed that China’s role in the energy trade network has been increasingly prominent. The underlying reasons for this can be attributed to China’s rapid economic development in the 2010s. Additionally, efforts have been made by China to seek cooperative development on the international stage. In 2013, the Belt and Road Initiative was proposed by China, effectively strengthening the energy trade activity and resilience between China and neighboring countries.
Table 8 shows the top 10 bilateral trade relations in terms of TBR. It is observed that the top 10 bilateral trade relations in 2001, 2011, and 2020 accounted for 23.33%, 20.09%, and 19.38% of the total network, respectively. Although the share of bilateral trade is slightly lower, it remains an integral part of the global energy trade network. The U.S. dominates international energy trade, as it occupies a very important position in bilateral trade relations with Canada and Mexico, consistently occupying the top three positions. Moreover, in 2001, the top four relations all included the U.S., followed by other developed countries such as the U.K., Norway, Germany, Hungary, and Belgium. However, by 2011, emerging developing countries such as Saudi Arabia, China, and Nigeria begin to appear in the top 10, and by 2020, China and Russia occupy a significant share of bilateral trade, surpassing the energy trade between the U.S. and Mexico, which has always been in second place. In addition, China’s bilateral trade with the U.S. and Mexico has increased, and Brazil and Saudi Arabia have also become important partners for China. Cooperation among the emerging developing countries, once in a “marginal” position, has become increasingly closer, influencing the “core” position of the developed countries for more than a decade [43].

4.4. Analysis of the Global Energy Trade Network

The global energy trade network shows that countries with the highest k-value have the largest trade volumes of energy exports or imports in the energy trade market. For Figure 2, the k-core algorithm is employed to calculate the group of countries with the highest k-values in the energy cross-border trade network in 2001 (Figure 2a), 2011 (Figure 2b), and 2020 (Figure 2c). The results show that in 2001, the highest k-value was 69, with 61 countries having this k-value, including the U.S., Canada, France, China, and Australia; in 2011, the highest k-value was 79, with 62 countries having this k-value, including the U.S., the U.K., China, and Saudi Arabia; in 2020, the highest k-value was 97, with 70 countries having this k-value, including the U.S., China, Japan, and Russia.
The increase in the number of countries with the highest k-value indicates that an increasing number of countries have greater energy import and export capacities in the international energy trade network. The increase in k-value also indicates that the energy import and export capacities of these countries are also increasing, giving these countries a stronger voice in the international energy trade network. Thus, these countries have become major players in the energy trade market. The subgroups of countries with the highest k-value and the ranking of bilateral intensity for each year show a high overlap. Countries with high bilateral intensity, such as the U.S., Canada, China, Saudi Arabia, France, and the U.K., also have high k-values. These findings suggest that there is a strong positive correlation between the countries with the highest k-value and those with the highest bilateral intensity.
Firstly, when considering the overall perspective, an increase in the number of countries with the highest k-values can be observed, from 61 countries in 2001 to 62 countries in 2011 and further to 70 countries in 2020. This indicates that a greater number of countries are gaining larger energy import and export capabilities within the global energy trade network. Moreover, it can be noted that there was a mere increase of one country between 2001 and 2011, whereas there was an increase of eight countries between 2011 and 2020. This suggests that over time, the rate of growth in the number of countries with strong energy trade capacities has intensified, leading to a faster convergence among nations participating in global energy trade. The k-values have also increased over time, with a k-value of only 69 in 2001, reaching 79 in 2011, and a notable high of 97 in 2020. This signifies the increasing energy import and export capabilities of these countries, granting them a stronger position and influence within the international energy trade network. Additionally, it can be observed that the decade from 2001 to 2011 witnessed a 10-unit increase in k-value, reflecting a growth rate of 14.493%, while the period from 2011 to 2020 saw an 18-unit increase, corresponding to a growth rate of 22.785%. These findings highlight the accelerating growth rate of energy import and export capacities over time.
Secondly, when examining the details, it can be observed that countries such as the United States, China, Saudi Arabia, France, Canada, and the United Kingdom have consistently held the highest k-values in global energy trade. Consequently, these countries have become major participants in the energy trade market. Furthermore, a strong correlation is evident between the groups of countries with the highest k-values and the rankings of bilateral intensities. Countries with high bilateral intensities, including the United States, Canada, and China, also exhibit high k-values. These findings indicate a significant positive relationship between countries with the highest k-values and those with the highest bilateral intensities.

5. Conclusions and Discussions

In this study, the HS2002 standard was employed to select 21 four-digit codes related to energy trade between 2001 and 2020. Global energy trade data was collected and compiled. In contrast to previous research that focused on specific fossil fuels or specific regions, a more comprehensive and reasonable approach to establishing the cross-border energy trade network was achieved. Additionally, an innovative analysis of the temporal and spatial evolution of the energy trade network was conducted. The specific comparison is shown in Table 9. Countries were abstracted as nodes, and energy trade relationships were abstracted as edges to construct the international energy trade network. The overall characteristics of the network were examined through the definition of metrics such as average shortest path length and average clustering coefficient. Import and export patterns were analyzed using metrics including out-degree, in-degree, weighted out-degree, and weighted in-degree. Bilateral relationships between countries were examined through metrics such as unilateral intensity and bilateral intensity. Furthermore, community characteristics were analyzed using the k-core algorithm. The global energy trade network was investigated from the perspectives of the network, nodes, bilateral relationships, and communities, allowing for an exploration of its temporal and spatial evolution. The results are summarized as follows.
  • The global energy trade network has been subject to a significant increase in density over time, with notable peaks observed in 2010 and 2018. However, it is crucial to acknowledge that distinct characteristics have been exhibited by the network during different periods, reflecting the evolving dynamics of international energy trade.
  • Since the early 21st century, the overall strength of the network has been steadily growing. Initially, owing to a global economic recession, the network’s density was exceptionally low in 2001. Nevertheless, as the global economy recovered, trade activities between countries became more frequent and robust.
  • The empirical analysis brings to light the growing participation of emerging developing countries in international energy markets. These countries, such as China, Brazil, and Saudi Arabia, have witnessed substantial growth in both energy inputs and outputs. They now possess significant trade volumes and exert financial influence, gradually approaching and impacting developed nations in a “multipolar” pattern.
  • A noteworthy finding is the transition of emerging developing countries from marginal positions to influential players within the global energy trade network. Their cooperation with each other, spanning over a decade, has exerted influence on the core positions of developed countries like the U.S. and Mexico. This finding signifies a departure from a trade pattern dominated by a few nations. Furthermore, the community structure analysis reveals an increasing number of countries with robust energy import and export capabilities within the international energy trade network. Moreover, a strong positive correlation is observed between the highest k-value and bilateral strength.
These findings collectively indicate a dynamic landscape in global energy trade characterized by evolving patterns and shifting power dynamics. The increasing participation of emerging developing countries and their growing influence on the global energy trade network have significant implications. Policymakers should recognize the need for a more inclusive and multipolar approach to energy trade, fostering cooperation among nations. Future research should delve further into the underlying factors driving these trends and assess their potential long-term impacts on global energy markets. Based on the findings, several key recommendations emerge to strengthen energy security, geopolitical stability, and national security and promote efficient and well-organized global energy trade. These recommendations provide valuable insights and guidance for policymakers and stakeholders in the energy sector.
First, policymakers should carefully analyze the topological structural characteristics of the current international energy trade networks and grasp the underlying trends in international energy markets. As the international energy trade network undergoes transformative changes and grows increasingly interconnected, the emerging role of developing countries in the market becomes significant. It is imperative for countries to seize this opportunity and actively participate in energy trade to enhance their economic power and global influence.
Second, governments should prioritize strengthening the legal frameworks relevant to energy trade and establish robust policy and institutional safeguards. These measures are essential to ensure transparency, fairness, and accountability in energy trade operations. By implementing effective regulations and enforcement mechanisms, countries can mitigate risks, prevent market distortions, and safeguard the interests of all stakeholders.
Furthermore, effective coordination and management of cross-border energy trade activities are critical for ensuring global energy security and geopolitical stability. This necessitates close collaboration among nations to foster mutually beneficial energy trade partnerships, build trust, and address potential challenges collectively. International cooperation platforms and mechanisms should be utilized to facilitate dialogue, information sharing, and coordination among energy-producing and energy-consuming countries.
By adopting these recommendations, countries can bolster their energy security, contribute to geopolitical stability, and foster a more efficient and well-structured global energy trade system. Proactive engagement with these strategies will enhance the resilience and sustainability of the energy sector while facilitating economic development and mutual prosperity.

Author Contributions

Conceptualization, Y.C.; methodology, Y.H.; software, Y.H. and S.C.; formal analysis, Y.C., Y.H. and S.C.; investigation, J.J.; resources and data curation, Y.C., Y.H. and S.C.; writing—original draft preparation, Y.C. and Y.H.; writing—review and editing, J.J. and X.C.; supervision, Y.C. and X.C.; funding acquisition, J.J. All authors have read and agreed to the published version of the manuscript.

Funding

This research is supported by JSPS KAKENHI Grant-in-Aid for Scientific Research (C) No. 22K01462 and JSPS KAKENHI Grant-in-Aid for Scientific Research (B) No. 22H00846.

Data Availability Statement

Data is available upon request.

Conflicts of Interest

The authors declare no conflict of interest.

References

  1. Economidou, M.; Ringel, M.; Valentova, M.; Castellazzi, L.; Zancanella, P.; Zangheri, P.; Serrenho, T.; Paci, D.; Bertoldi, P. Strategic energy and climate policy planning: Lessons learned from European energy efficiency policies. Energy Policy 2022, 171, 113225. [Google Scholar] [CrossRef]
  2. Estevez-Ben, A.A.; Lopez Tapia, H.J.C.; Valentin Carrillo-Serrano, R.; Rodriguez-Resendiz, J.; Vazquez Nava, N. A New Predictive Control Strategy for Multilevel Current-Source Inverter Grid-Connected. Electronics 2019, 8, 902. [Google Scholar] [CrossRef] [Green Version]
  3. Lopez, H.; Rodriguez-Resendiz, J.; Guo, X.; Vazquez, N.; Vazquez, N. Transformerless Common-Mode Current-Source Inverter Grid-Connected for PV Applications. IEEE Access 2018, 6, 62944–62953. [Google Scholar] [CrossRef]
  4. Zhang, D.; Kong, Q. Green energy transition and sustainable development of energy firms: An assessment of renewable energy policy. Energy Econ. 2022, 111, 106060. [Google Scholar] [CrossRef]
  5. Wang, Q.; Zhang, F. Free Trade and Renewable Energy: A Cross-income Levels Empirical Investigation Using Wwo Trade Openness Measures. Renew. Energy 2021, 168, 1027–1039. [Google Scholar] [CrossRef]
  6. Taghizadeh-Hesary, F.; Rasoulinezhad, E.; Yoshino, N.; Sarker, T.; Mirza, N. Determinants of the Russia and Asia–Pacific Energy Trade. Energy Strat. Rev. 2021, 38, 100681. [Google Scholar] [CrossRef]
  7. Alvarez-Diazcomas, A.; Lopez, H.; Carrillo-Serrano, R.V.; Rodriguez-Resendiz, J.; Vazquez, N.; Vazquez, N. A Novel Integrated Topology to Interface Electric Vehicles and Renewable Energies with the Grid. Energies 2020, 12, 4091. [Google Scholar] [CrossRef] [Green Version]
  8. Estevez-Ben, A.A.; Alvarez-Diazcomas, A.; Macias-Bobadilla, G.; Rodriguez-Resendiz, J. Leakage Current Reduction in Single-Phase Grid-Connected Inverters—A Review. Appl. Sci. 2020, 10, 2384. [Google Scholar] [CrossRef] [Green Version]
  9. Estevez-Ben, A.A.; Alvarez-Diazcomas, A.; Rodriguez-Resendiz, J. Transformerless Multilevel Voltage-Source Inverter Topology Comparative Study for PV Systems. Energies 2020, 13, 3261. [Google Scholar] [CrossRef]
  10. Tang, B.J.; Shi, X.P.; Chao, G.; Shen, C. Analysis on Embodied Energy of China’s Export Trade and the Energy Consumption Changes of Key Industries. Int. J. Energy Res. 2013, 37, 2019–2028. [Google Scholar] [CrossRef]
  11. Wu, G.; Pu, Y.; Shu, T. Features and Evolution of Global Energy Trade Network Based on Domestic Value-added Decomposition of Export. Energy 2021, 228, 120486. [Google Scholar] [CrossRef]
  12. Zhang, H.; Ji, Q.; Fan, Y. Competition, Transmission and Pattern Evolution: A Network Analysis of Global Oil Trade. Energy Policy 2014, 73, 312–322. [Google Scholar] [CrossRef]
  13. Geng, J.; Ji, Q.; Fan, Y. A Dynamic Analysis on Global Natural Gas Trade Network. Appl. Energy 2014, 132, 23–33. [Google Scholar] [CrossRef]
  14. Gao, C.; Sun, M.; Shen, B. Features and Evolution of International Fossil Energy Trade Relationships: A Weighted Multilayer Network Analysis. Appl. Energy 2015, 156, 542–554. [Google Scholar] [CrossRef]
  15. Shanghai Institute of Standardization; China National Institute of Standardization; Shanghai Energy Efficiency Center; Shanghai Energy Conservation and Emission Reduction Center Co., Ltd. Classification and Code of Energy Sources, 1st ed.; General Administration of Quality Supervision, Inspection and Quarantine of the People’s Republic of China; Standardization Administration of China: Beijing, China, 2013; pp. 2–6. [Google Scholar]
  16. Batalla, J.; Paniagua, J.; Trujillo-Baute, E. Energy Market Integration and Electricity Trade. Econ. Energy Environ. Policy 2019, 8, 78–87. [Google Scholar] [CrossRef]
  17. Dent, C.M. Clean Energy Trade Governance: Reconciling Trade Liberalism and Climate Interventionism? New Political Econ. 2018, 23, 728–747. [Google Scholar] [CrossRef]
  18. Lu, Z.; Gozgor, G.; Mahalik Mantu, K.; Padhan, H.; Yan, C. Welfare Gains from International Trade and Renewable Energy Demand: Evidence from the OECD Countries. Energy Econ. 2022, 112, 106153. [Google Scholar] [CrossRef]
  19. Chen, J.; Xie, Q.; Shahbaz, M.; Song, M.; Wu, Y. The Fossil Energy Trade Relations among BRICS Countries. Energy 2021, 217, 119383. [Google Scholar] [CrossRef]
  20. Zhang, C.; Fu, J.; Pu, Z. A Study of the Petroleum Trade Network of Countries along “The Belt and Road Initiative”. J. Clean Prod. 2019, 222, 593–605. [Google Scholar] [CrossRef]
  21. Li, J.; Dong, X.; Jiang, Q.; Dong, K.; Liu, G. Natural Gas Trade Network of Countries and Regions along the Belt and Road: Where to Go in the Future? Resour. Policy 2021, 71, 101981. [Google Scholar] [CrossRef]
  22. Hong, J.; Tang, M.; Wu, Z.; Miao, Z.; Shen, G.Q. The Evolution of Patterns within Embodied Energy Flows in the Chinese economy: A Multi-regional-based Complex Network Approach. Sustain. Cities Soc. 2019, 47, 101500. [Google Scholar] [CrossRef]
  23. Zhong, W.; An, H.; Fang, W.; Gao, X.; Dong, D. Features and evolution of international fossil fuel trade network based on value of emergy. Appl. Energy 2016, 165, 868–877. [Google Scholar] [CrossRef]
  24. Zhang, H.; Wang, Y.; Yang, C.; Guo, Y. The Impact of Country Risk on Energy Trade Patterns Based on Complex Network and Panel Regression Analyses. Energy 2021, 222, 119979. [Google Scholar] [CrossRef]
  25. Yang, Y. Energy Globalization of China: Trade, Investment, and Embedded Energy Flows. J. Geogr. Sci. 2022, 32, 377–400. [Google Scholar] [CrossRef]
  26. Song, Z.; Che, S.; Yang, Y. The Trade Network of the Belt and Road Initiative and its Topological Relationship to the Global Trade Network. J. Geogr. Sci. 2018, 28, 1249–1262. [Google Scholar] [CrossRef] [Green Version]
  27. Gao, C.; Tao, S.; Su, B.; Mensah Isaac, A.; Sun, M. Exploring Renewable Rnergy Trade Coopetition Relationships: Evidence from Belt and Road Countries, 1996–2018. Renew. Energy 2023, 202, 196–209. [Google Scholar] [CrossRef]
  28. Ren, B.; Li, H.; Shi, J.; Liu, Y.; Qi, Y. Identifying the Key Sectors and Paths of the Embodied Energy in BRICS Nations: A Weighted Multilayer Network Spproach. Energy 2022, 239, 122091. [Google Scholar] [CrossRef]
  29. Chen, W.; Hou, X.; Jiang, M.; Jiang, C. Identifying systemically important financial institutions in complex network: A case study of Chinese stock market. Emerg. Mark. Rev. 2022, 50, 100836. [Google Scholar] [CrossRef]
  30. Zhou, Y.; Xie, C.; Wang, G.; Zhu, Y.; Uddin, G.S. Analysing and forecasting co-movement between innovative and traditional financial assets based on complex network and machine learning. Res. Int. Bus. Financ. 2023, 64, 101846. [Google Scholar] [CrossRef]
  31. Feng, Z.; Cai, H.; Chen, Z.; Zhou, W. Influence of an interurban innovation network on the innovation capacity of China: A multiplex network perspective. Technol. Forecast. Soc. Chang. 2022, 180, 121651. [Google Scholar] [CrossRef]
  32. Li, H.; An, H.; Fang, W.; Wang, Y.; Zhong, W.; Yan, L. Global Energy Investment Structure from the Energy Stock Market Perspective Based on A Heterogeneous Complex Network Model. Appl. Energy 2016, 194, 648–657. [Google Scholar] [CrossRef]
  33. Barrera-Santana, J.; Marrero, G.A.; Ramos-Real, F.J. Income, energy and the role of energy efficiency governance. Energy Econ. 2022, 108, 105882. [Google Scholar] [CrossRef]
  34. Ding, G.; Guo, G.; Wu, C.; Yu, J. China-US Trade Friction and Welfare: The Role of Regional Trade Agreements. Econ. Model. 2022, 113, 105877. [Google Scholar] [CrossRef]
  35. Wang, F.; Wu, M. The Impacts of COVID-19 on China’s Economy and Energy in the Context of Trade Protectionism. Int. J. Environ. Res. Public Health 2021, 18, 12768. [Google Scholar] [CrossRef]
  36. Amador, J. Energy Content in Manufacturing Exports: A Cross-country Analysis. Energy Econ. 2011, 34, 1074–1081. [Google Scholar] [CrossRef] [Green Version]
  37. Ul Husnain, M.I.; Nasrullah; Khan, M.A. Testing Dependence Patterns of Energy Consumption with Economic Expansion and Trade Openness through Wavelet Transformed Coherence in Top Energy-consuming Countries. Environ. Sci. Pollut. Res. 2021, 28, 49788–49807. [Google Scholar] [CrossRef]
  38. Oliveira, T.D.; Gurgel, A.C.; Tonry, S. Potential Trading Partners of a Brazilian Emissions Trading Scheme: The Effects of Linking with A Developed Region (Europe) and Two Developing Regions (Latin America and China). Technol. Forecast. Soc. Chang. 2021, 171, 120947. [Google Scholar] [CrossRef]
  39. He, S.; Blasch, J.; van Beukering, P.; Wang, J. Energy labels and heuristic decision-making: The role of cognition and energy literacy. Energy Econ. 2022, 114, 106279. [Google Scholar] [CrossRef]
  40. He, F.; Ma, F.; Wang, Z.; Yang, B. Asymmetric Volatility Spillover between Oil-importing and Oil-exporting Countries’ Economic Policy Uncertainty and China’s Energy Sector. Int. Rev. Financ. Anal. 2021, 75, 101739. [Google Scholar] [CrossRef]
  41. Vernay, A.; Sebi, C.; Arroyo, F. Energy community business models and their impact on the energy transition: Lessons learnt from France. Energy Policy 2023, 175, 113473. [Google Scholar] [CrossRef]
  42. Meyer, T. Explaining Energy Disputes at the World Trade Organization. Int. Environ. Agreem. Politics Law Econ. 2017, 17, 391–410. [Google Scholar] [CrossRef]
  43. Li, F.; Yang, C.; Li, Z.; Failler, P. Does Geopolitics Have an Impact on Energy Trade? Empirical Research on Emerging Countries. Sustainability 2021, 13, 5199. [Google Scholar] [CrossRef]
Figure 1. Spatial structure of global energy trade network weighted by trade amount: (a) 2001; (b) 2011; (c) 2020.
Energies 16 05677 g001
Figure 2. Visualization of country subgroups with the highest k-value: (a) 2001; (b) 2011; (c) 2020.
Energies 16 05677 g002
Table 1. Energy classification and code selection.
CategoryHS2002 CodeSpecific MeaningData Volume
Petroleum and petroleum products2708Pitch and pitch coke extracted from coal tar13,677
2709Crude oil38,234
2710Oil other than crude oil255,406
2712Vaseline and wax102,845
2713Petroleum coke and other residues52,391
2715Asphalt mixture based on natural asphalt58,967
Coal and coal products2701Coal, coal balls, and similar solid fuels made of coal47,214
2702Lignite, whether or not agglomerated, excluding coal10,257
2704Coke and semi-coke from coal, lignite, or peat26,511
2705Gas, water gas, producer gas, and similar gases6293
2706Tar extracted from coal, lignite, or peat11,178
2707High-temperature coal tar oil and other products58,615
Natural gas2711Petroleum gas and other gaseous hydrocarbons81,237
Biomass energy1213Raw grain stalks and husks19,352
4401Fuelwood, logs, sticks, twigs, bundles, or similar73,044
4402Charcoal (including shell charcoal or nut charcoal), whether or not agglomerated63,195
Electric energy2716Electric energy12,721
Oil shale/oil sand2714Natural bitumen and asphalt28,975
Cobalt, the main material of electric vehicle battery2605Cobalt ore and concentrate3630
Peat and peat products2703Peat (including peat garbage)47,580
Nuclear energy2612Uranium or thorium ores and concentrates1482
Table 2. Abbreviation list of major countries.
Full Name of CountryAbbreviation of Country NameFull Name of CountryAbbreviation of Country NameFull Name of CountryAbbreviation of Country Name
AfghanistanAFGGermanyDEUNigeriaNGA
AngolaAGOAlgeriaDZAThe NetherlandsNLD
United Arab EmiratesARESpainESPNorwayNOR
ArgentinaARGFinlandFINPakistanPAK
AustraliaAUSFranceFRAPolandPOL
BelgiumBELUKGBRRepublic of KoreaPRK
BangladeshBGDHungaryHUNQatarQAT
BrazilBRAIndonesiaIDNRussian FederationRUS
Central African Rep.CAFIndiaINDSaudi ArabiaSAU
CanadaCANIraqIRQSingaporeSGP
SwitzerlandCHEItalyITAThailandTHA
ChinaCHNJapanJPNTurkeyTUR
Dem. Rep. of the CongoCODRepublic of KoreaKORUSAUSA
ColombiaCOLMexicoMEXVenezuelaVEN
Table 3. Main topological indicators of global cross-border M&A network from 2001 to 2020.
YearNumber of NodesNumber of BordersAverage DegreeAverage ClusteringAverage Path Length
2001228808935.4780.6132.005
2002225632128.0930.7361.704
2003225746933.1960.6911.711
2004226849137.5710.6701.715
2005226900639.8500.6701.729
2006228968942.4960.6571.731
200722810,26645.0260.6621.724
200822910,58846.2360.6661.736
200923010,82647.0700.6741.732
201023011,47449.8870.6721.721
2011227860237.8940.6651.836
201223311,62649.8970.6651.727
201323411,90050.8550.6791.725
201423111,92452.6190.6761.706
201523212,25652.8280.6861.704
201623012,24753.2480.6871.695
201723212,48453.8100.6891.690
201823212,51553.9440.6931.824
201923112,22152.9050.6981.839
202023011,46549.8480.7171.851
Table 4. Top 10 countries in terms of access and weighted access in 2001.
RankingIn-DegreeOut-DegreeWeighted In-DegreeWeighted Out-Degree
CountryValueCountryValueCountryValueCountryValue
1USA126USA184USA215293000000RUS80648205312
2FRA125GBR177JPN107698000000CAN72882588981
3GBR111FRA173DEU56162998322NOR66805994242
4DEU105DEU173FRA49082454877SAU56916456798
5BEL101BEL168KOR46647264130GBR44448304773
6ITA100NLD162ITA46444540609VEN40572955790
7CHN98CHN162NLD39379928988NGA35969289724
8NLD96ITA160GBR32634911333DZA34735850184
9JPN92CHE152ESP28580106331NLD31097418721
10ESP92JPN144CHN26744312155USA28126778511
Note: In-degree represents the number of countries from which country i imports energy; Out-degree represents the number of countries to which country i exports energy. Weighted In-degree is the number of countries from which country i imports energy weighted by trade amount; Weighted Out-degree is the number of countries from which country i exports energy weighted by the trade amount.
Table 5. Top 10 countries in terms of access and weighted access in 2011.
RankingIn-DegreeOut-DegreeWeighted In-DegreeWeighted Out-Degree
CountryValueCountryValueCountryValueCountryValue
1CHN158CHN155USA279727386866USA409761889496
2USA157CAN151SAU275986355287CHN256005169769
3GBR142USA150RUS260602307378JPN251234216706
4DEU137FRA146CHN133302705614RUS191902025042
5FRA136NLD145NLD125881460071KOR154313920144
6NLD135GBR142CAN123324694988IND151471761190
7ITA131IND140JPN114481229407CAN135573967318
8IND129DEU134ARE106940296615GBR103293632840
9BEL120ITA133NGA104114635207NOR102940462903
10ESP119BEL130GBR101027952034ITA100442798846
Note: In-degree represents the number of countries from which country i imports energy; Out-degree represents the number of countries to which country i exports energy. Weighted In-degree is the number of countries from which country i imports energy weighted by trade amount; Weighted Out-degree is the number of countries from which country i exports energy weighted by the trade amount.
Table 6. Top 10 countries in terms of access and weighted access in 2020.
RankingIn-DegreeOut-DegreeWeighted In-DegreeWeighted Out-Degree
CountryValueCountryValueCountryValueCountryValue
1NLD150CHN199USA226754210866CHN305258280540
2USA147USA192CHN134679951985USA297198803900
3CHN143NLD189RUS117976322213RUS182149976290
4ARE138TUR187SAU115049206501IND142286232069
5BEL137FRA186NLD98289492825KOR117741150316
6FRA135BEL185CAN92446010860JPN107785837414
7IND135KOR178AUS89164998758NLD90063022859
8KOR131GBR178ARE70438711358CAN88422500972
9SGP129DEU177SGP69700961398SGP73360771273
10GBR127ARE173KOR61968375068DEU60432371685
Note: In-degree represents the number of countries from which country i imports energy; Out-degree represents the number of countries to which country i exports energy. Weighted In-degree is the number of countries from which country i imports energy weighted by trade amount; Weighted Out-degree is the number of countries from which country i exports energy weighted by the trade amount.
Table 7. Unilateral strength rankings in 2001, 2011, and 2020.
Ranking200120112020
ij O B R
i j
ij O B R
i j
ij O B R
i j
1CANUSA7.12%CANUSA2.77%USACAN3.23%
2VENUSA2.69%USACAN2.76%CANUSA3.20%
3MEXUSA1.99%JPNSAU1.36%USAMEX1.98%
4NGAUSA1.63%USASAU1.32%CHNRUS1.33%
5NORGBR1.52%MEXUSA1.28%RUSCHN1.21%
6IDNJPN1.41%USAMEX1.24%CHNSAU1.16%
7AREJPN1.29%NORGBR1.14%JPNAUS0.98%
8SAUUSA1.28%JAPARE1.12%CHNAUS0.93%
9SAUJPN1.22%CHNSAU1.10%RUSNLD0.78%
10NLDBEL1.21%USAVEN1.07%CHNIRQ0.78%
total21.36%15.16%15.58%
Note: i and j represent countries i and j, respectively.
Table 8. Rankings of bilateral intensity in 2001, 2011, and 2020.
Year200120112020
ij T B R
i j
ij T B R
i j
ij T B R
i j
1CANUSA7.87%CANUSA5.53%CANUSA6.43%
2MEXUSA2.75%MEXUSA2.51%CHNRUS2.54%
3USAVEN2.71%GBRNOR2.11%MEXUSA2.38%
4NGAUSA1.64%JPNQAT1.58%AUSJPN1.33%
5GBRNOR1.57%NGAUSA1.53%AUSCHN1.22%
6BELNLD1.46%AUSJPN1.47%BELNLD1.21%
7HUNJPN1.42%CHNAGO1.38%CHNSAU1.17%
8DEUNLD1.35%JPNSAU1.36%NLDRUS1.04%
9JPNARE1.29%SAUUSA1.32%BRACHN1.04%
10SAUUSA1.28%DEURUS1.30%KORUSA1.03%
total23.33%20.09%19.38%
Note: i and j represent countries i and j, respectively.
Table 9. Comparing existing research.
Research DifferencesPrevious WorksThis Work
Selection of energy typesMain fossil energy or single fossil energyCover all energy types as much as possible
Selection of research subjectsA specific country or regionThe whole world
Research perspectiveCharacteristics at a certain time pointObserving its evolutionary characteristics
Disclaimer/Publisher’s Note: The statements, opinions and data contained in all publications are solely those of the individual author(s) and contributor(s) and not of MDPI and/or the editor(s). MDPI and/or the editor(s) disclaim responsibility for any injury to people or property resulting from any ideas, methods, instructions or products referred to in the content.

