Article

Using the Magnetic Anisotropy Method to Determine Hydrogenated Sections of a Steel Pipeline

by
Victor I. Bolobov
1,
Il’nur U. Latipov
2,
Valentin S. Zhukov
3 and
Gregory G. Popov
2,*
1
Faculty of Mechanical Engineering, St. Petersburg Mining University, 2, 21st Line, 199106 St. Petersburg, Russia
2
Department of Transport and Storage of Oil and Gas, Faculty of Oil and Gas Engineering, St. Petersburg Mining University, 2, 21st Line, 199106 St. Petersburg, Russia
3
LLC “Ferrologica”, 2A, Komendantskiy Pr., 197227 St. Petersburg, Russia
*
Author to whom correspondence should be addressed.
Energies 2023, 16(15), 5585; https://doi.org/10.3390/en16155585
Submission received: 28 May 2023 / Revised: 8 July 2023 / Accepted: 17 July 2023 / Published: 25 July 2023
(This article belongs to the Special Issue Modern Trends in Oil and Gas Industry)

Abstract

:
The paper deals with a non-destructive method of detecting hydrogenated sections of pipelines, which is based on variations of the level of mechanical stresses generated in the surface layers of the steel pipe material during its hydrogenation. The use of a magnetoanisotropic method based on the phenomenon of metal magnetoelastic anisotropy development, which consists in the variation of the magnetic properties of ferromagnetic materials in direction and magnitude under the influence of mechanical stresses, is proposed as a way to register that variation. Based on the results of tensile testing of carbon steel plates with measurement of the difference in principal mechanical stresses (DPMS) occurring in metal, as well as experiments on electrolytic hydrogenation of specimens with measurement of the DPMS signal, it was confirmed that when steel structures are saturated with hydrogen, tensile stresses are generated in the surface layers, the magnitude of which increases as the concentration of hydrogen increases in the metal. In this case, it is assumed that the indicated dependence between the hydrogen concentration in the metal and the stresses arising as a result of hydrogenation is linear. For the example of lamellar specimens made of pipe low-carbon steel, the possibility of using the magnetoanisotropic method for registering sections of underground pipelines with a high content of hydrogen is substantiated, which can become the basis for a method of diagnosing sections of pipelines with broken insulation for the possibility of their further operation. The scientific novelty of this article is the establishment of a relationship between the hydrogen content in the metal, the stresses that arise in this case, and the change in the magnetic properties of ferromagnetic materials, characterized by the magnitude of the DPMS signal. This study contributes to the understanding of the process of hydrogenation of metals, and may be useful in detecting and preventing damage to gas and oil pipelines caused by hydrogen embrittlement as a cause of stress corrosion.

1. Introduction

In accordance with [1,2,3,4,5], under certain conditions, e.g., high temperatures and pressures, electrolytic reactions, and the plastic deformation of metal, a significant amount of hydrogen can dissolve in metallic materials, subjecting them to “hydrogenation”, accompanied by a change in structure and mechanical properties of the metal [6], which in some cases may be the cause of the destruction of the metal structure [7,8]. Thus, according to the authors of [9,10], hydrogenation of the pipe material in an area with destroyed insulation, which occurs due to the presence of atomic hydrogen as a product of ground water electrolysis, on the metal surface, is exactly the cause of breakage of underground main gas pipelines due to stress corrosion damage. The above is also confirmed by the presence of a significant amount of hydrogen (up to 0.1 wt. % or 1000 ppm) [11] in metal layers adjacent to the outer surface of the destroyed pipe, exceeding the concentration of hydrogen in layers near the inner surface by 2–4 times, which is proved by experiment as per [9]. According to the same authors [9,10], the negative effect of hydrogen dissolved in metal is also the reason for the failure of pipelines carrying sulphur-containing oil products. In this case, the source of atomic hydrogen diffusing into the pipe wall is the pipe metal reaction with hydrogen sulphide. More details about this phenomenon, its causes and explanatory hypotheses are given in [12]. Therefore, timely detection of the pipeline section where the pipe wall was hydrogenated is a possible method of failure prevention [13,14,15]. The above conclusion is valid for both compressed hydrogen pipelines, where local hydrogenation of the pipe wall cannot be excluded, e.g., due to plastic deformation caused by soil movement [16] and other bending stresses [17,18,19], and pipelines carrying natural gas and oil products [20,21,22]. At the same time, currently existing methods of detecting increased hydrogen content in metal structures, both by measuring its concentration directly or indirectly—based on the change in mechanical properties of the metal—are destructive, since both use specimens cut from the analysed structure for research. The foregoing is also relevant for other areas of the energy sector, where hydrogen and its compounds can interact with metal structures [23,24,25,26]. This necessitates the development of new highly sensitive and effective methods of non-destructive testing to identify areas of local hydrogenation of pipelines and the means for their implementation, which are primarily based on new effects and phenomena.
One of the examples of such possible methods is the magnetoacoustic emission method (MAE) [27], based on an abrupt change in the magnetization of a ferromagnetic substance under a continuous change in external conditions (magnetic field, elastic stresses, temperature, etc.), leading to a change in the domain structure of the material (the Barkhausen effect). Since the presence of hydrogen in a ferromagnet affects its domain structure, the quantitative evaluation of the MAE signals of a hydrogenated specimen allows for the estimation of its hydrogen content.
This paper deals with another potentially possible method for detecting hydrogenated sections of gas and oil pipelines, based on the effect of the mechanical stress level variations that occur in the surface layers of the steel pipe during its hydrogenation. It is proposed to use the magnetic anisotropy method [28,29] developed by one of the authors of this paper as a way of registering this variation, and this is also described in [30]. Information about the relationship between the indicators obtained using the magnetic anisotropy method and the magnitude of stresses existing in structures is presented in [31,32,33]. Since the method can be used for ferromagnetic steels of any grade, it is, as a result, applicable to most main and process pipelines. In [12], the results of determining stresses in the surface layer of steel by the method of magnetic anisotropy are compared with the corresponding results obtained by X-ray diffraction analysis of the crystal structure of the samples under study, and their satisfactory convergence is noted.

2. General Information

The developed method is based on the well-known fact that when hydrogen is dissolved in metals, mechanical stresses are generated in the surface layers, due to their deformation [34].
In [35], the generation of residual macrostresses in metal sheets as a result of one-sided saturation with hydrogen by cathodic treatment was found in high-chromium stainless steel, experimentally. The maximum value of such residual stresses (compressive stresses, according to the authors) is 60–70 MPa; the thickness of the layer where these stresses are mainly concentrated is approximately 0.03 ÷ 0.04 mm. As a result of the exposure of hydrogenated plates to a temperature of 200–300 °C, the hydrogen is removed and the acquired curvature (deflection) of the plate almost completely disappears. According to [28], the occurrence of residual stresses is due to the uneven absorption of hydrogen by the metal surface, with the prevailing absorption along the grain boundaries.
The experiments by the authors of [36] demonstrated that during one-sided electrochemical saturation of palladium plates with hydrogen, the latter bend, which the authors attribute to the generation of mechanical stresses in the surface layer of the plates (the direction of the plate bend and whether the stresses are the compressive or tensile type is not specified in the paper). The presented data indicate the dependence of the magnitude of the deflection on the time of hydrogenation.
The papers [1,37] indicate that when electrolytic hydrogen penetrates into various steel specimens (spiral, tubular, wire) they elongate, which is therefore evidence of the tensile stress occurrence in the metal during hydrogenation. It was found that the elongation of the specimens during electrolytic hydrogenation is proportional to the amount of absorbed hydrogen, and even after the removal of hydrogen from the tubular specimens, the deformation remains, which, according to [1], confirms that the reason for the deformation of the entire specimen is the residual deformation of the metal on the inner surface of the ring caused by high pressure of molecular hydrogen in the pores. This is also evidenced by the buckling of the metal surface subjected to electrolytic hydrogenation.
According to the authors of this paper, the results of the cathodic treatment of notched ring specimens given in [1] also testify to the occurrence of tensile stresses as a result of hydrogenation (Figure 1a). At specified time intervals, the specimens were removed from the electrolysis unit to measure the notch width, and then the values were compared with the width before hydrogenation and after vacuum annealing at the relevant temperatures (50 °C, 200 °C and 650 °C). During annealing, the amount of released hydrogen was measured. As a result of the stresses generated during hydrogenation, the notch width increased. Figure 1b shows the change in the notch width g as a function of the hydrogenation time.
Table 1 illustrates the results of vacuum annealing and measurement of the hydrogen concentration in the metal of the ring specimen.
It is conspicuous that the deformation values of the specimens are practically equal for different times of saturation with hydrogen, and there is a significant variation in the established deformation values (0.46, 0.88, and 1.2 × 10⁻³ m); also conspicuous are the amounts of hydrogen released during annealing (41, 117, and 137 × 10−5 m3/kg) of three identical specimens (no. 1, no. 2, and no. 3), hydrogenated under very similar conditions. The first factor probably shows that the concentration limit of hydrogen in the metal is already reached within 5 min of hydrogenation, and the second one indicates the presence of some uncontrollable factors under electrolytic saturation, as per the authors [1], which affect the intensity of the hydrogenation process significantly.
As stated in [38], during the electrolytic “pumping” of the structure of 17GS steel with cathodic hydrogen, its microhardness increases by 10–30 × 106 Pa in 250 h, which is due to the occurrence of additional “hydrogen stresses” in steel (tensile stresses, as can be concluded from the continuation of the phrase), which in practice, added to the ring tensile stress caused by working pressure in the pipeline, leads to the appearance of a “hydrogen notch”.
The paper [27] reports the generation of local centres of mechanical triaxial tensile stresses in metal, which contribute to the redistribution of dislocations, under the influence of the hydrogen contained in the metal. But then it is also noted that hydrogen can unblock the movement of each individual dislocation and their accumulation.
The author of [39] also concludes that the lattice distortion and cold work (hardening) do increase the hydrogen absorption by steel, but reduce the diffusion of hydrogen. As a result, heat treatment used for the pipes used in underground pipelines (the removal of residual stresses/strains) [40,41] increases the diffusion of hydrogen, but reduces its absorption in the metal. (According to [39], hydrogen recombined in internal cavities can generate pressure of “several hundred atmospheres”; however, “… not many closed structural defects can serve as collector traps, penetrating into which hydrogen protons recombine”).

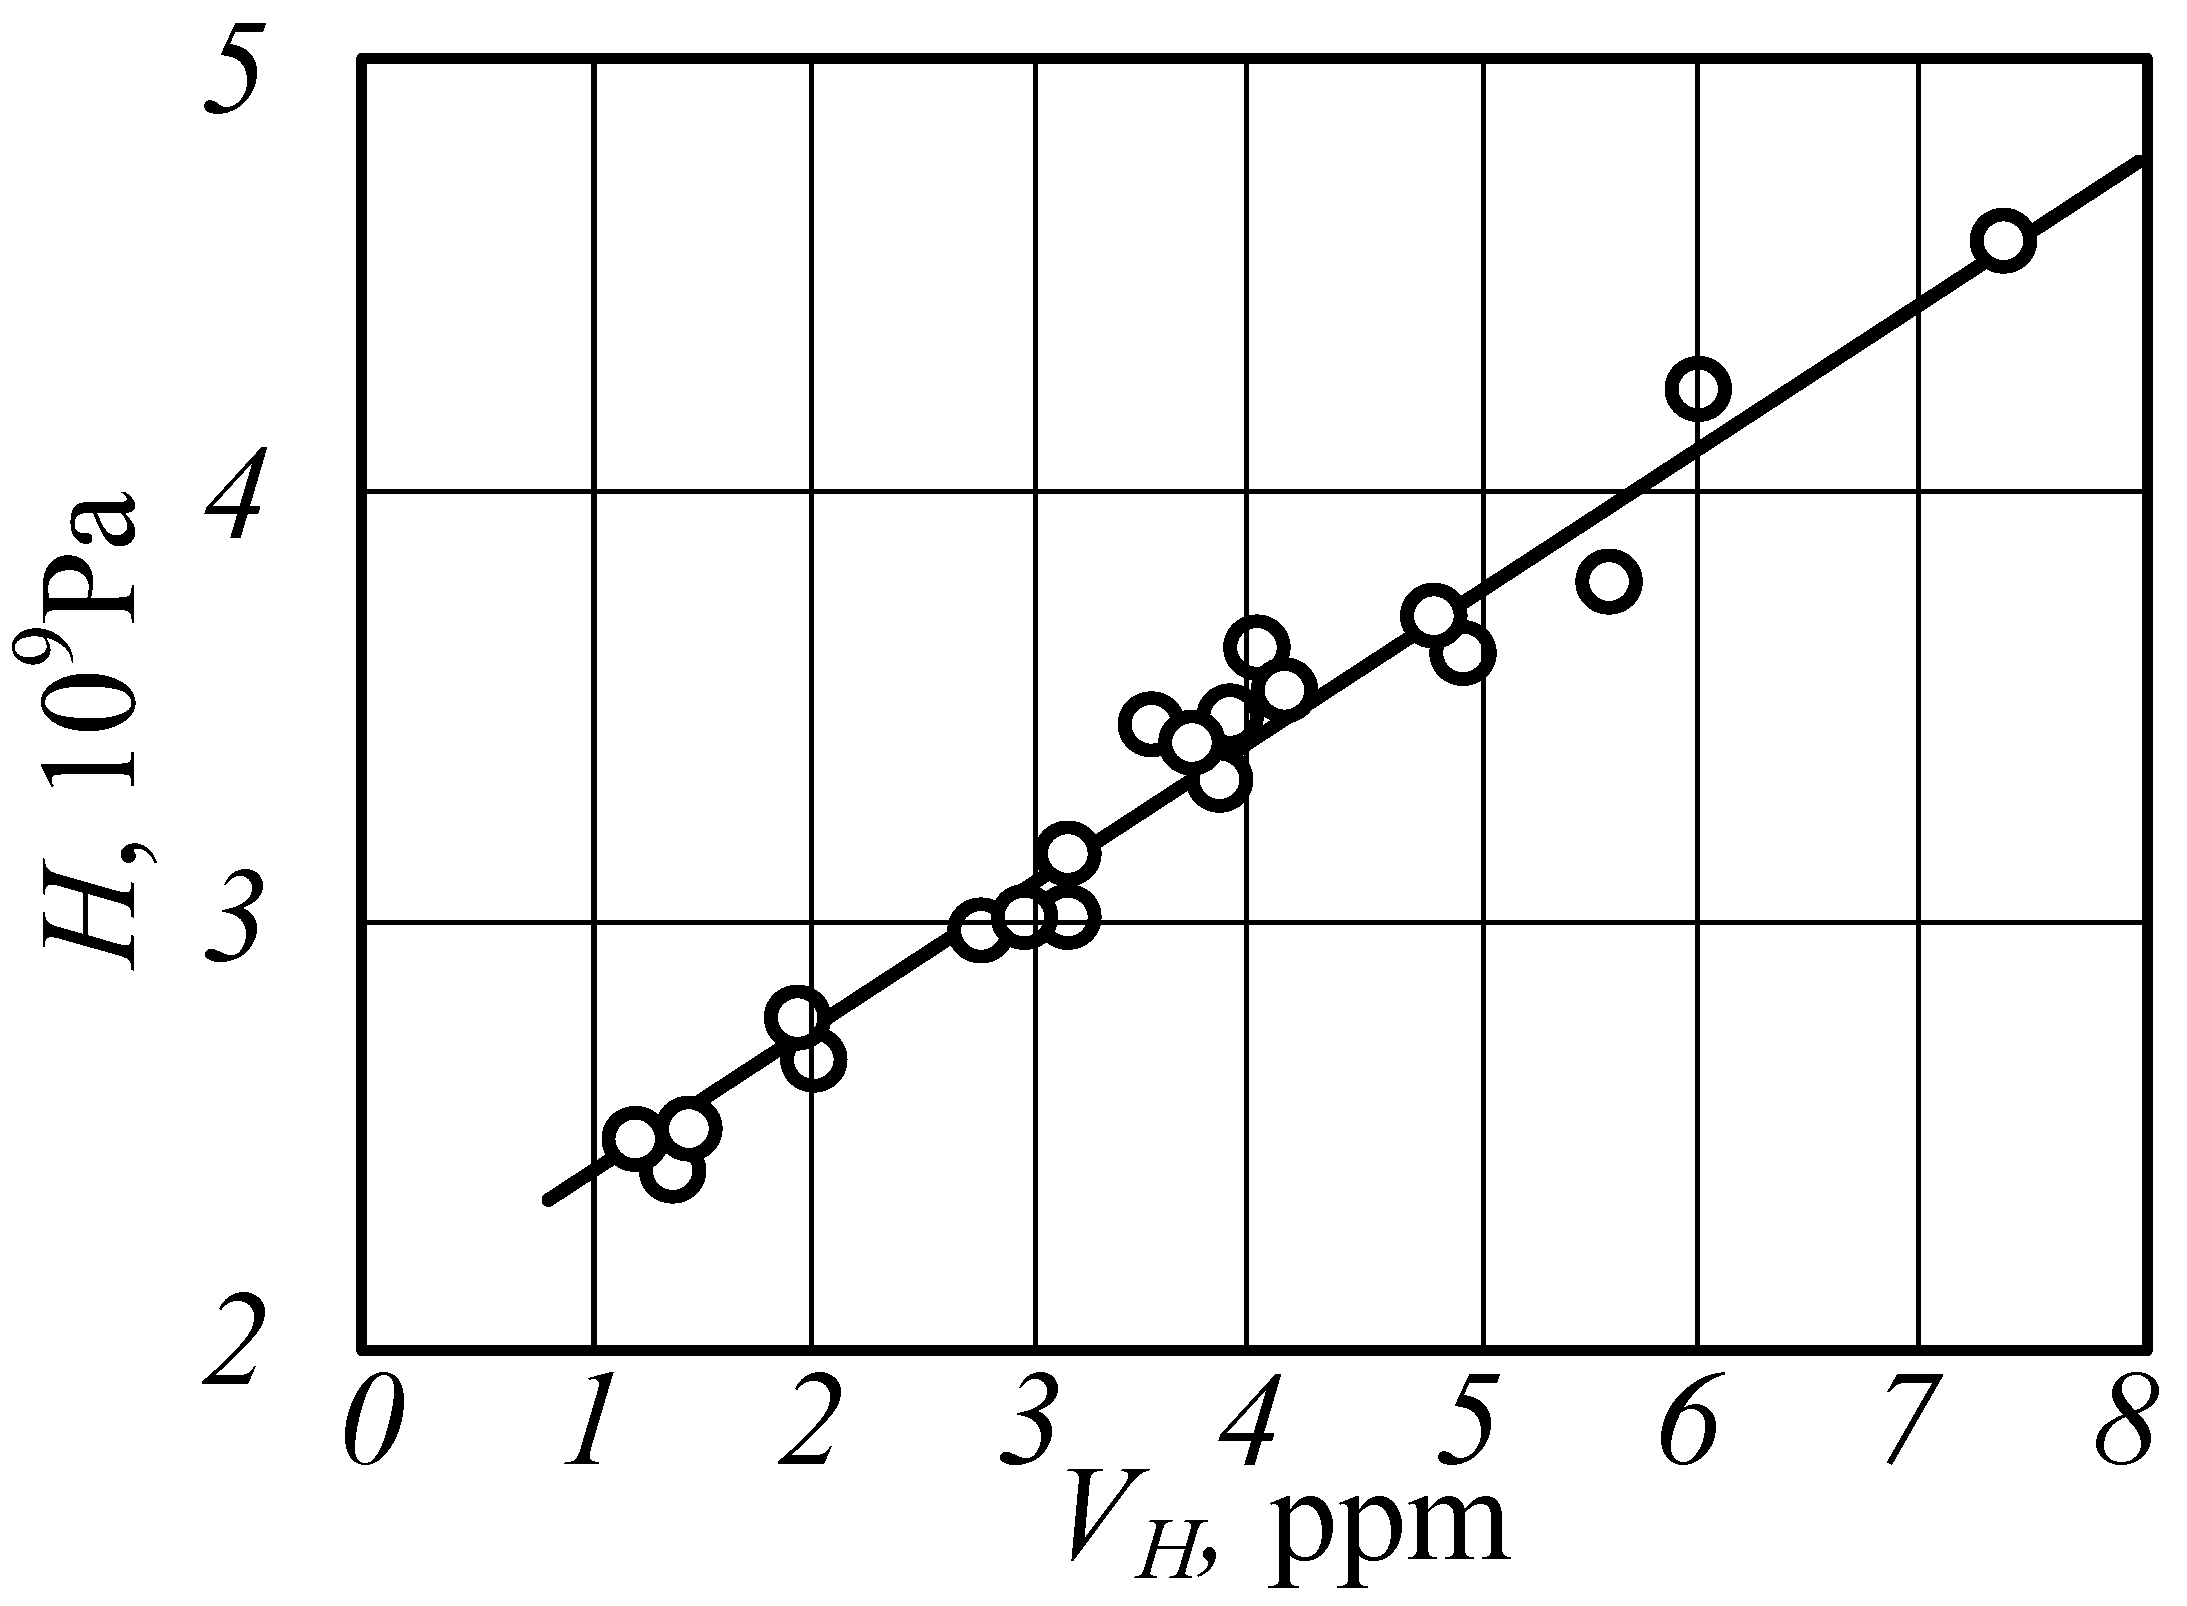
3. Effect of Hydrogenation on the Magnetic Properties of Steel

As noted by the authors of [42], the hydrogenation of steel causes an increase in coercive force Hc, a decrease in magnetic permeability μ, an increase in hysteresis losses, and a decrease in electrical conductivity, which is explained by an occurrence of a stressed state in the alloy lattice due to an increase in the pressure of molecular hydrogen in collectors. The authors also note that the observed changes in the magnetic and electrical properties depend not only, and sometimes not so much, on the hydrogen absorbed by the metal, but also on the changes that metal undergoes under the influence of hydrogen, as well as on the occurrence of residual stresses and discontinuities, decarburization, etc.
The paper [27] deals with the change in the magnetic anisotropy and domain structure of a ferromagnet on the appearance of pores, micro- and macrocracks formed as a result of exposure to high hydrogen concentrations in the metal. Based on the results of experiments carried out on specimens of low-carbon steels hydrogenated by the electrolytic method and from the gas phase, the authors outline that the presence of hydrogen affects the generation of magnetoacoustic emission (MAE) signals recorded during specimen remagnetization—the sum of the signal amplitudes increases by 16% compared to non-hydrogenated material, and for plastically deformed steel by 23%. According to the authors [27], such results provide a basis to consider the MAE method a new method of equipment for non-destructive testing, carried out in real time under operating conditions in order to identify centres of local hydrogen damage; in its development, it is necessary to take additional measures to eliminate the ambiguity of the concentration indicators at the same values of the total count of the MAE signals.
Since the magnetoanisotropic method is based on the analysis of the metal domain structure transformation under the influence of mechanical stresses, it was logical to correlate the magnitude of the signal recorded when using this method with the magnitude of mechanical stresses resulting from hydrogenation, and with the amount of hydrogen in the metal, accordingly.
A section of a steel structure with high concentration of local stresses is determined by the presence in the measurement zone of an exceeded average value of the difference in the principal mechanical stresses (DPMS)—longitudinal (σ1) and transverse (σ2) stresses—as parameters characterizing the range of the upper and lower limits of normal stresses acting on the platforms (sections) of the metal structure. The essence of the measurements is based on the existence of a relationship between the mechanical stresses and the magnetic properties of the medium, characterized by magnetoelastic sensitivity:
λ = B σ ,
where B is magnetic induction (characterized by the magnitude and direction of action), and σ is mechanical stress.
The principle of operation of a typical magnetoanisotropic transducer [43] is based on the rotation effect of the magnetic induction vector B created by the primary winding in the measurement zone. The voltage value at the output of the measuring winding U is described by Formula (2):
U = K · B a v · S 0 · f v · s i n β ω ,
where B a v is the average value of the induction; S 0 is the area covered by the winding; K is the coefficient of proportionality; β is the angle between the plane of the measuring winding ω and the magnetic induction vector B; and   f v is the frequency of the supply voltage.
The formula was obtained for the co-directional vectors of magnetic induction and mechanical stress. The rotation of the magnetic induction vector can be characterized by a change in its orthogonal components.
As a result, the magnitude of the signal U of the magnetic anisotropic transducer is proportional to the difference in the principal mechanical stresses (DPMS):
σ D P M S = σ 1 σ 2 ,
and the level of equivalent stresses in the surface layer of a given section of the metal structure, accordingly.

4. Materials and Methods

Lamellar specimens of low-carbon pipe steel (~0.2% C) were used to substantiate the application of the magnetic anisotropy method for determining the hydrogenated sections of a steel pipeline based on the results of measuring the difference in the main mechanical stresses of the original, and hydrogenated to different hydrogen content level specimens; this was followed by the recalculation of the obtained DPMS values into the values of the generated stresses. The recalculation was carried out based on the results of calibration tests carried out on plates of the same steel at their tensioning.

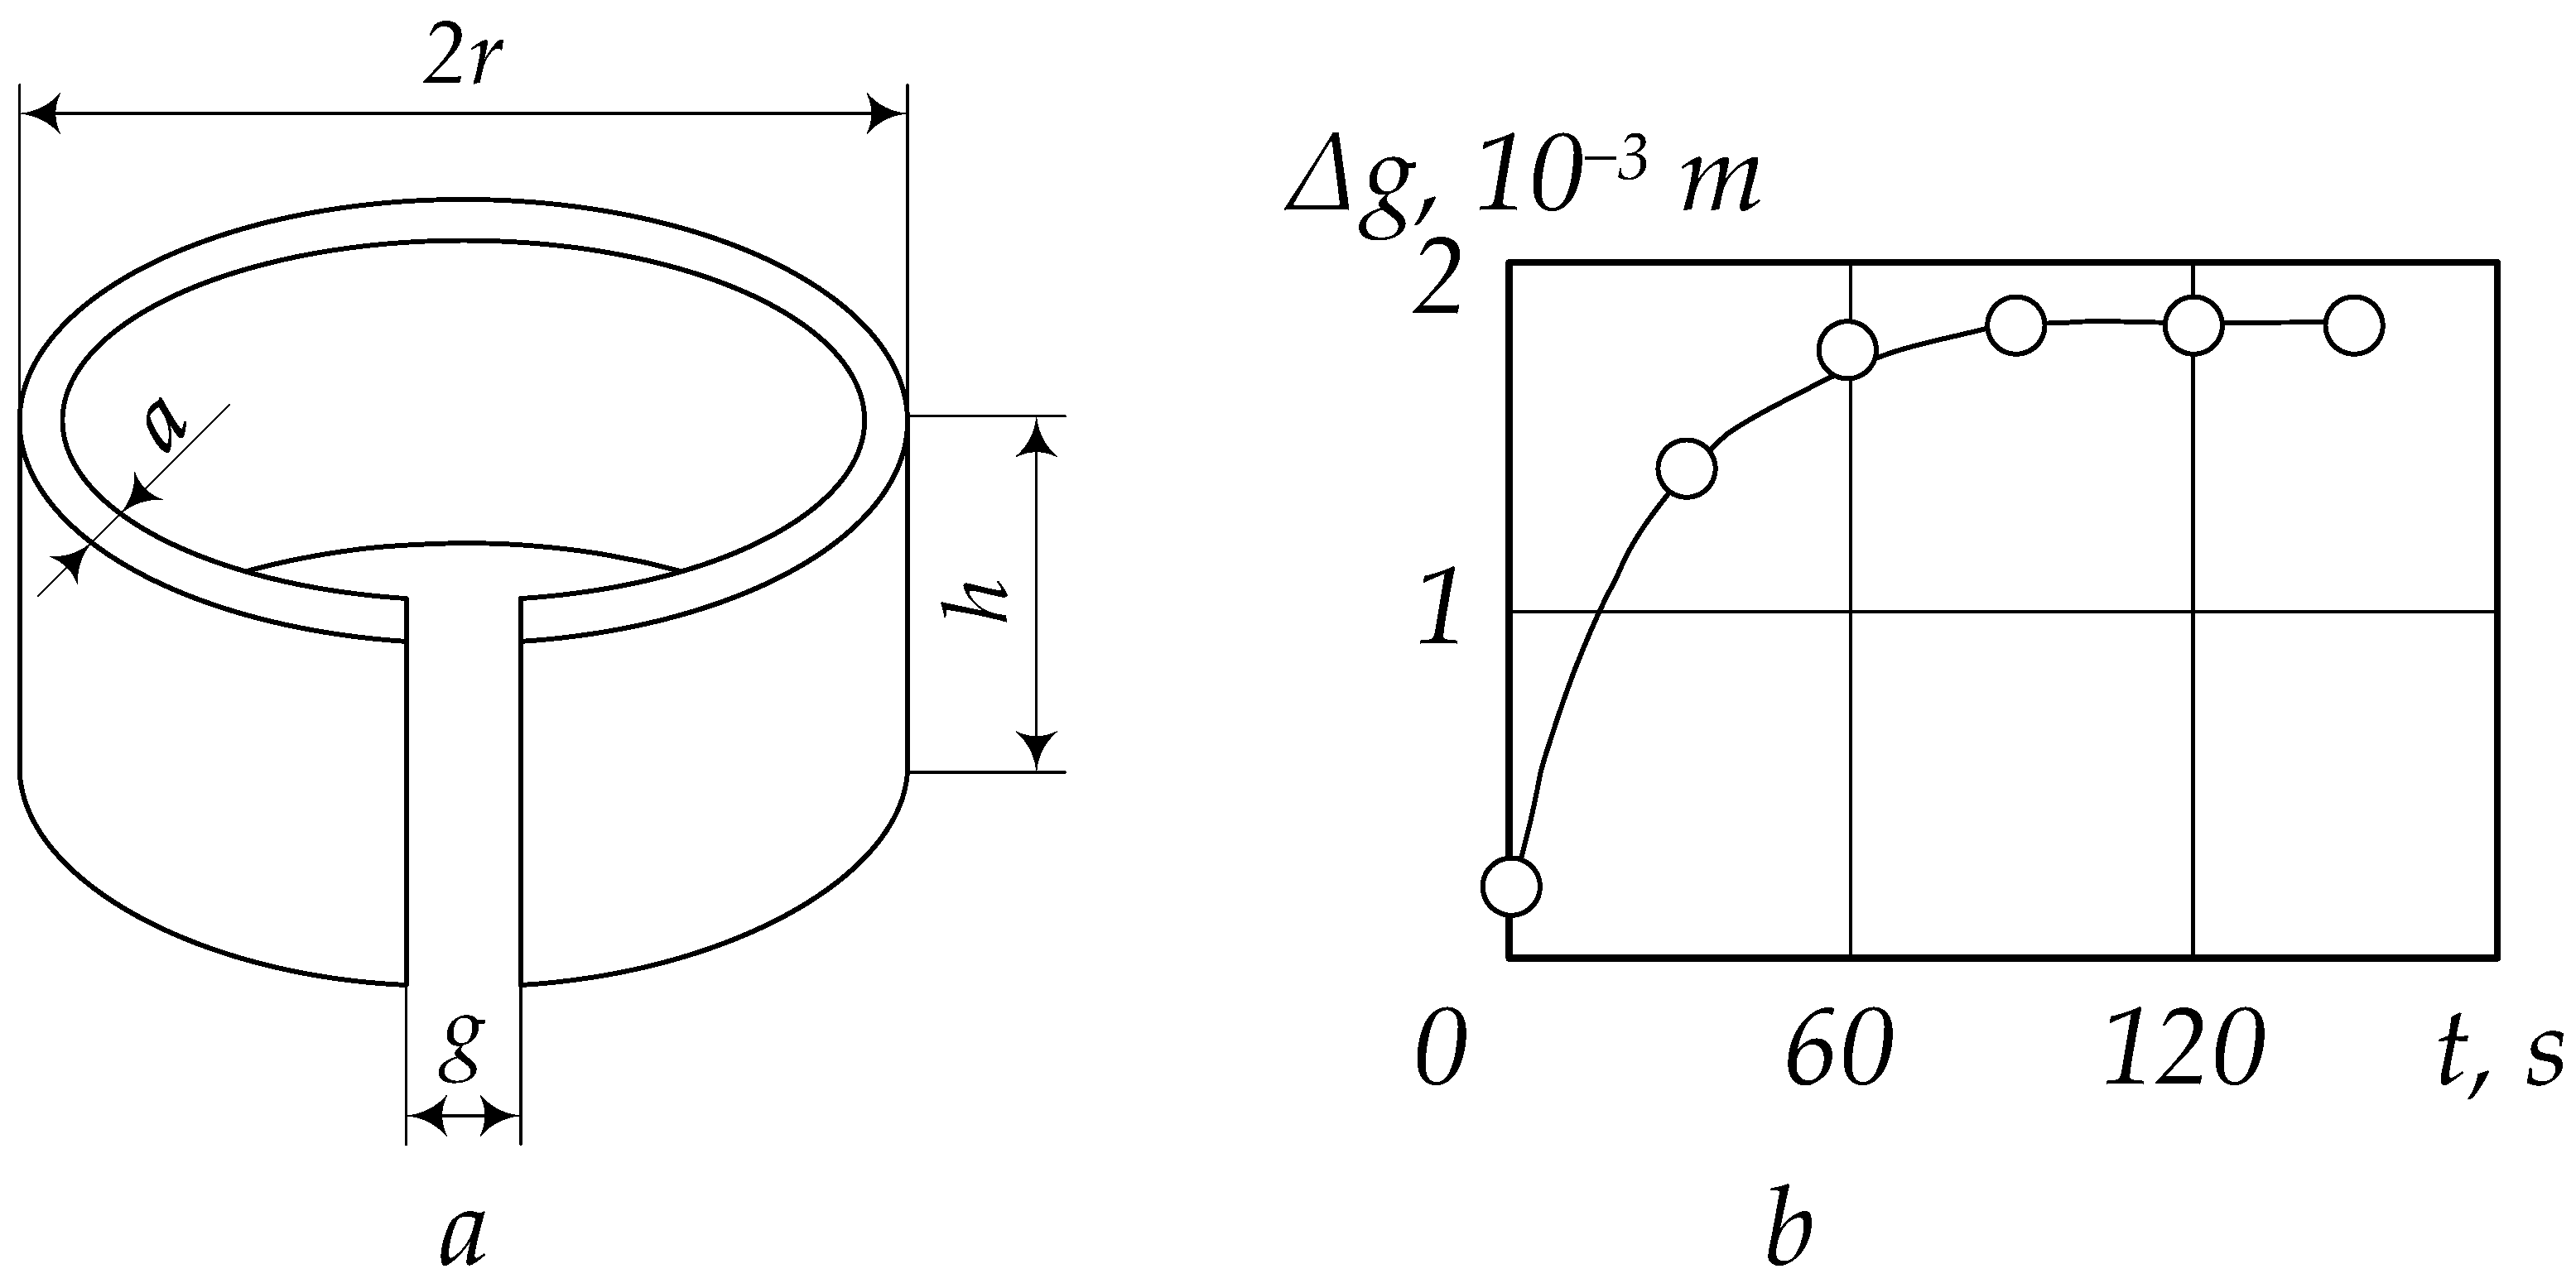
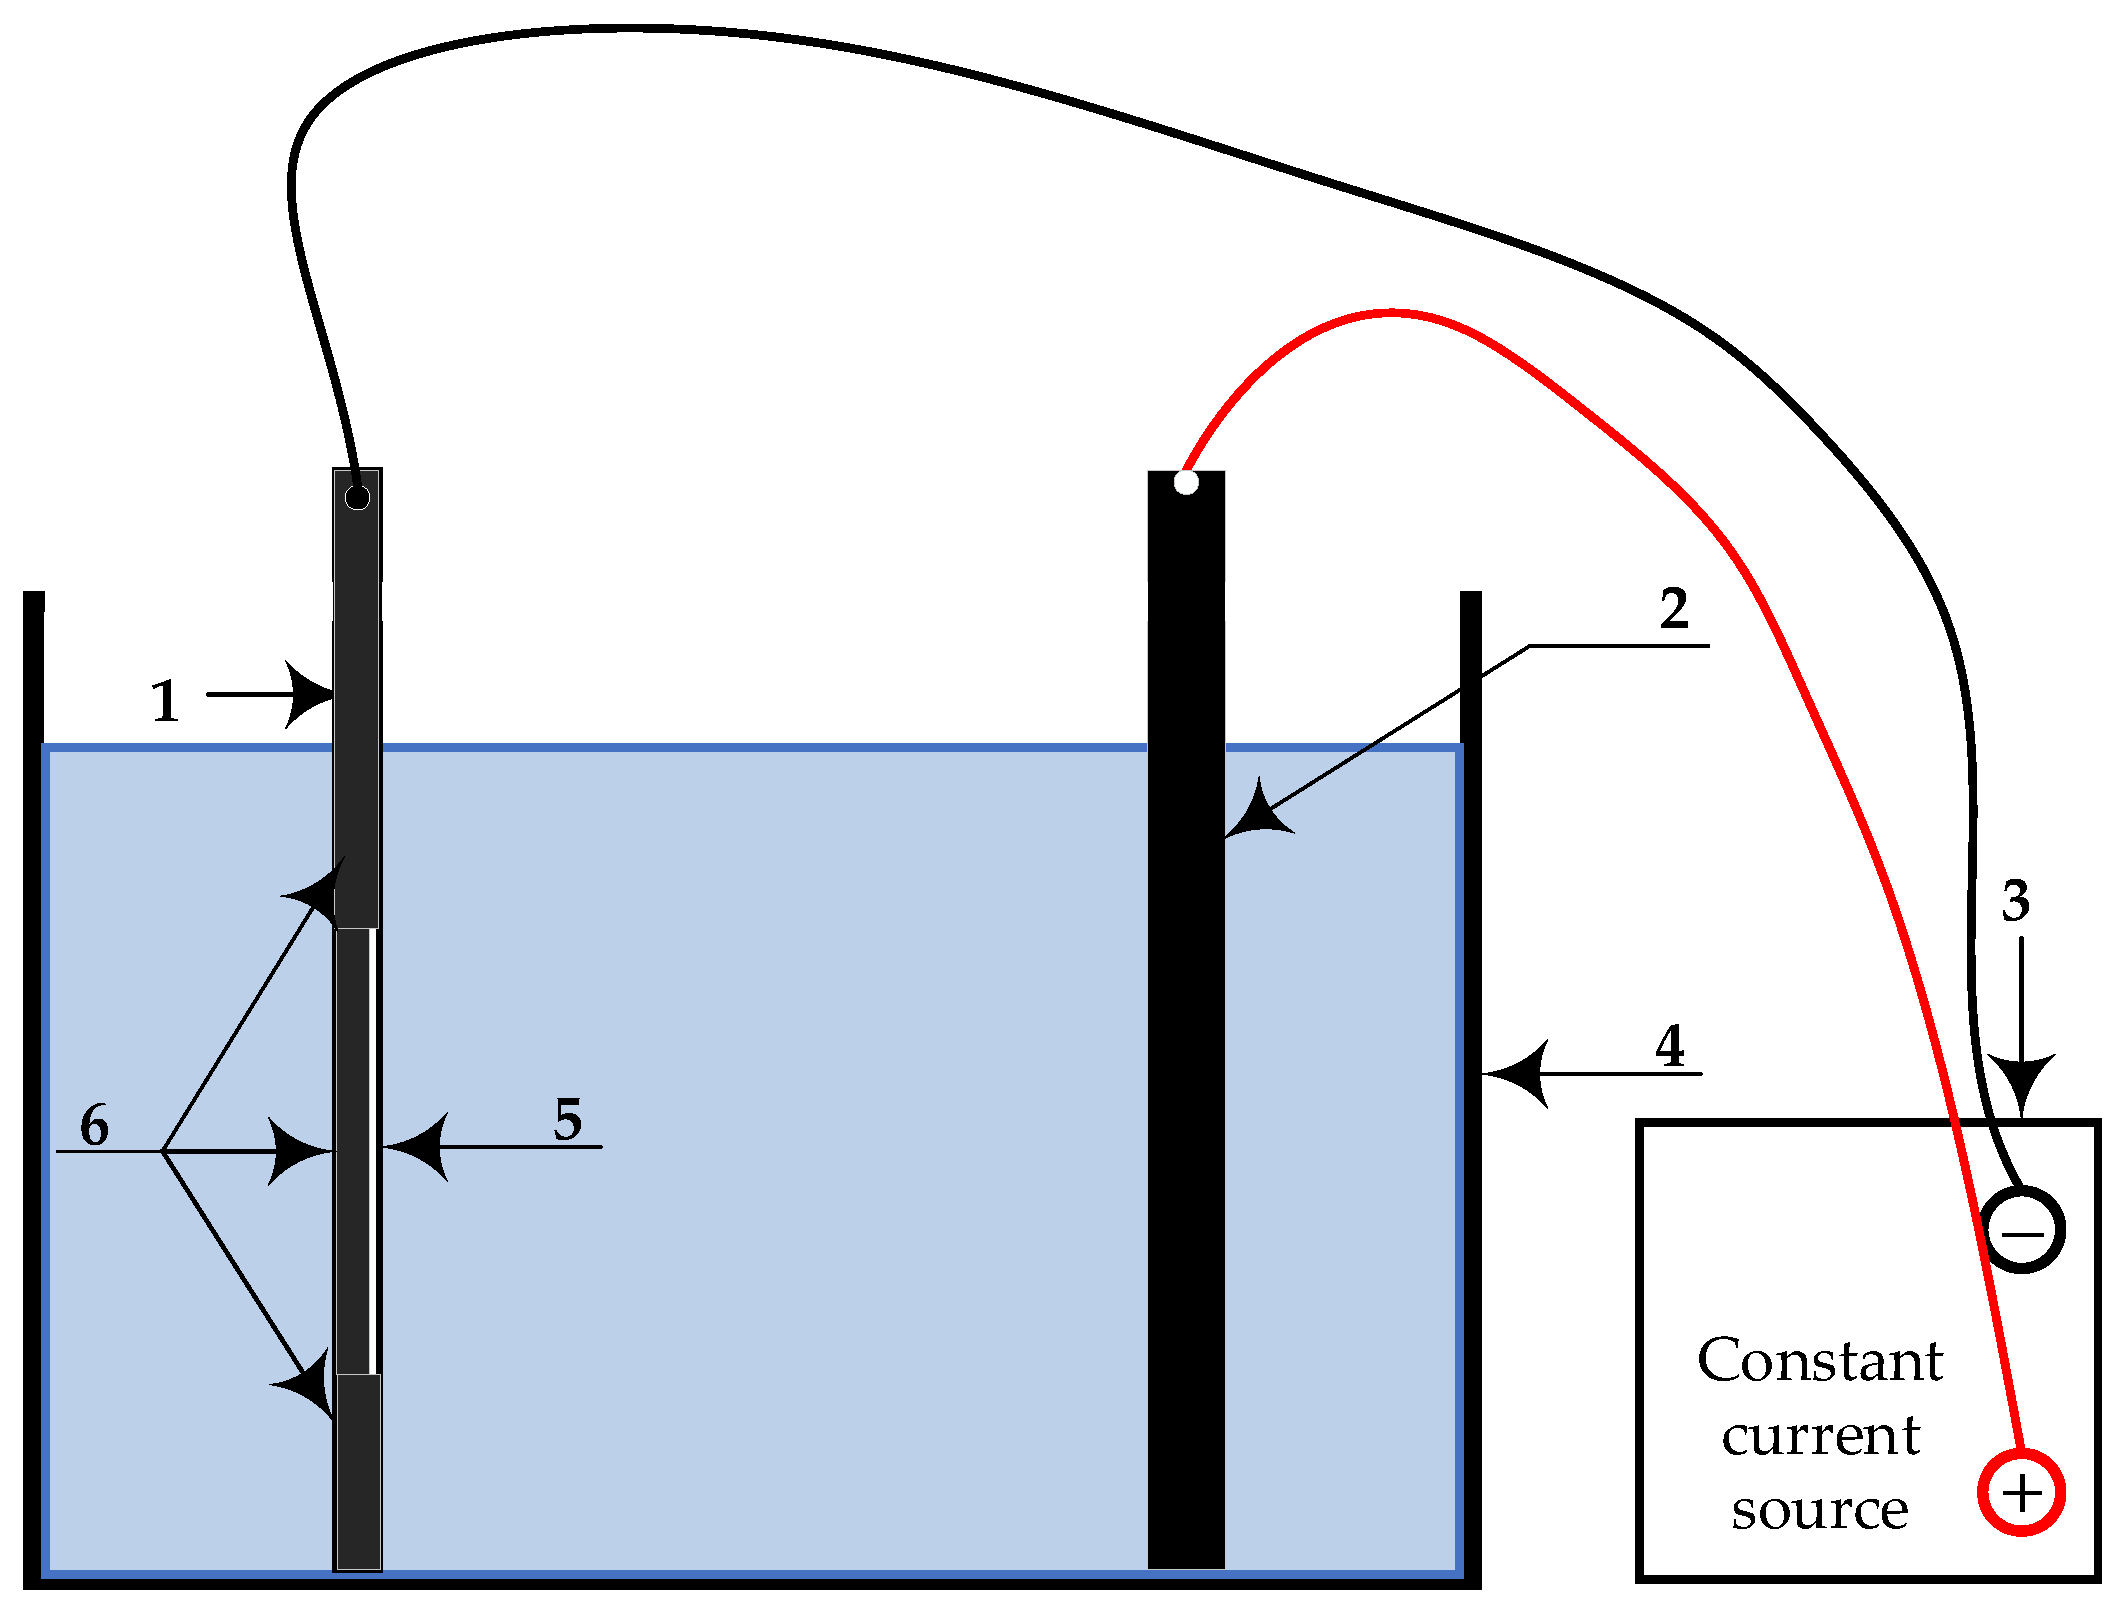
4.1. Test Preparation
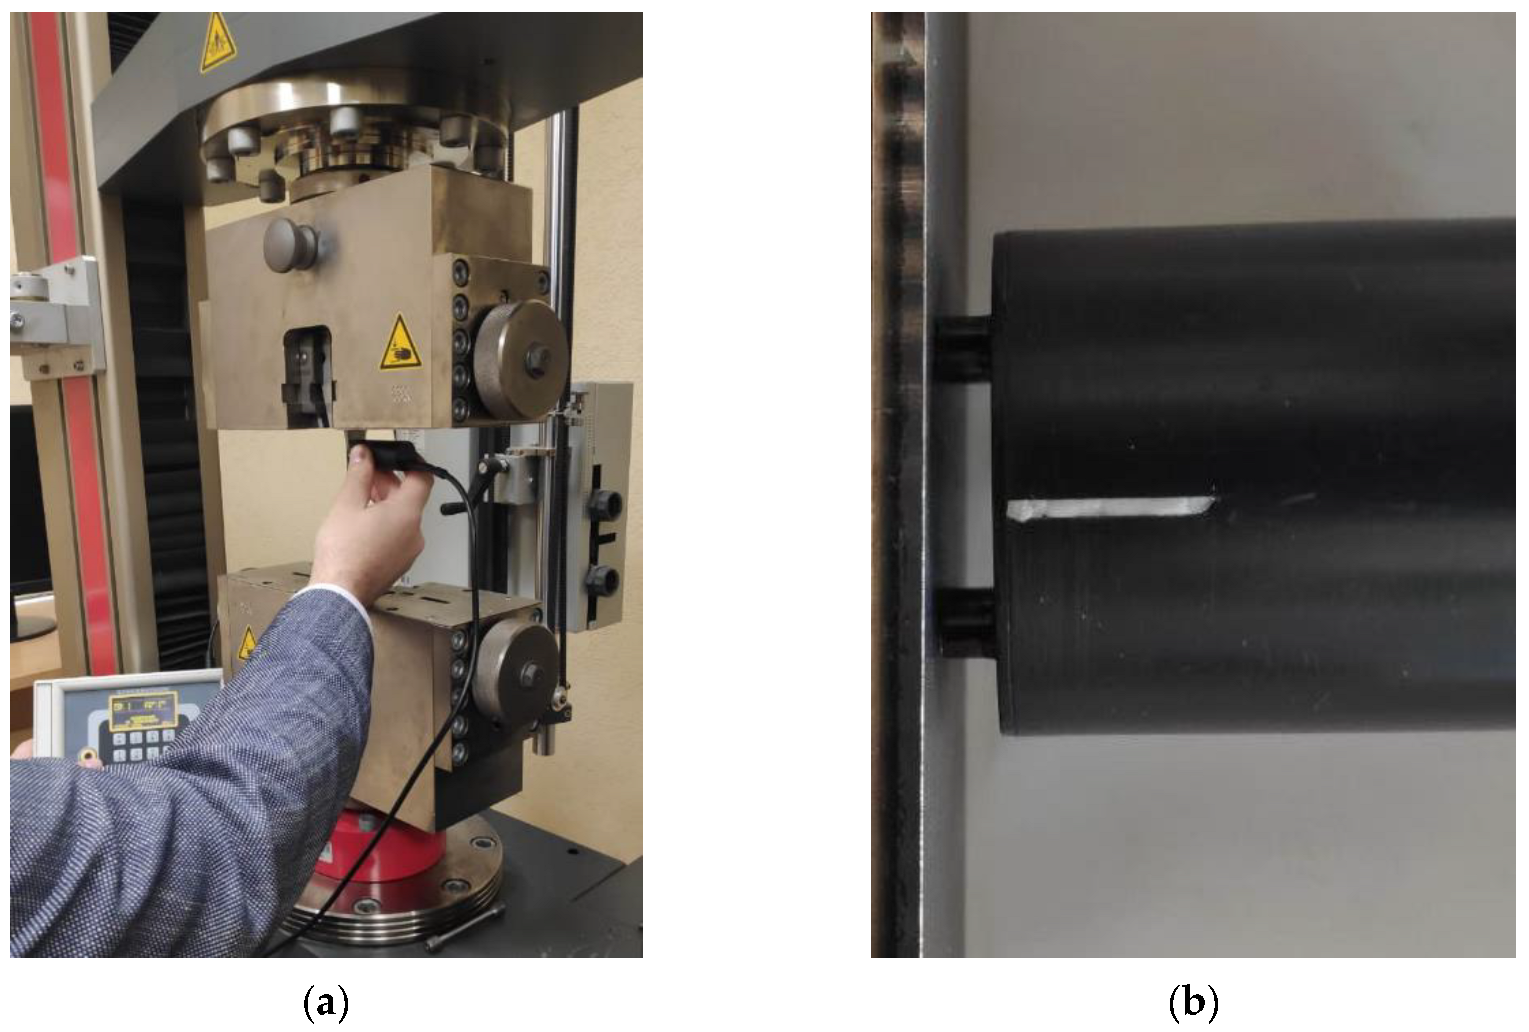
Specimens in the form of plates, cut from rolled steel, were subjected to tension on a ZwickRoell testing machine. The load was applied to the specimens in steps of 5 × 10³ N (by an increase in stress in the plate cross section of 33 × 106 Pa), until the “yield point” was reached on the “force”—“relative deformation”—curve. After an exposure of at least 60 s at each stage, using a mechanical stress scanner “Stressvision” with an operating principle based on the magnetoanisotropic method, with a scanning depth of up to 2 × 10⁻³ m, ten DPMS measurements were carried out in the middle part of the plates (Figure 2), and the arithmetic mean value was determined. The load at each step was recalculated to a corresponding tensile stress σ in the plate cross section, the value of which was compared with the corresponding average value of the DPMS. The comparison results are presented in the graph of Figure 3.
As follows from the test results (Figure 3), for all analysed values of tensile stresses σ, except for the initial one, where σ = 0, the DPMS (measured in conventional units) signal has a positive value. However, in the entire stress range up to values close to the yield strength of steel (σT = 174–183 × 106 Pa), the value of the DPMS signal increases in accordance with the following linear dependence:
DPMS = DPMS0 + K σ,
or   σ = Δ / K
where DPMS0 is the signal value corresponding to the level of residual equivalent stresses (compressive ones, as can be concluded) in the original plate (for this plate, DPMS0 = −10 c.u.); Δ = DPMS − DPMS0—the change in the level of DPMS as a result of the occurrence of additional tensile stresses in the process of the plate tensioning; and K is the coefficient of proportionality between the change in the DPMS signal magnitude and the magnitude of the stress σ that caused this change (K = 0.73 c.u./106 Pa)
The revealed dependence was used to determine the stresses occurring in plate specimens of the same steel as a result of hydrogenation.

4.2. Testing

Specimens in a form of plates of 0.15 × 0.05 × 0.003 m, cut from rolled low-carbon pipe steel and subjected to milling and grinding were the object of the analysis. The entire surface of the specimens was covered with a special dielectric insulation for protection from the impact of the environment, except for a small area of S = 0.05 × 0.05 m on one of the sides of the plate. Using the above stress scanner “Stressvision”, the values of DPMS0 were recorded at three fixed points of the specimen working area, located at a distance of 0.04 m from each other.
Each of the specimens 1 (Figure 4) was placed in container 4 filled with electrolyte—5% H2SO4 solution with the addition of thiourea CS(NH2)2 (1 g/L). Graphite plate 2 was immersed in the same solution at a distance of 40 mm from the working area of the plate, with the area of contact with the electrolyte (1 × 0.05 × 0.002 m) significantly exceeding the specimen working area. The specimen was connected to the positive pole of DC source 3, and the graphite plate was connected to the negative one. After activating source 3, the specimen, electrolyte, and graphite plate were subjected to a constant electric current I of a set value, in which the specimen served as a cathode, and the plate served as an anode. The current density was calculated relative to the cathode as j = I/S. Throughout the experiment, the values of I and j were maintained constant.
As a result of the electrolytic process, atomic hydrogen was released on the working unprotected part of the specimen; the main part was subjected to recombination and, in the form of bubbles, went up to the surface of the solution, whereas the remaining part was adsorbed on the surface of the specimen, from where it diffused into the metal. It is considered that, with such an electrolytic saturation of the metal with hydrogen, the concentration of the absorbed hydrogen, i.e., hydrogen diffused into the metal, increase as the current density increases during electrolysis. This point of view is in line with the data [44], which indicate that the concentration of absorbed hydrogen atoms will continuously increase, together with the cathodic polarization potential.
Therefore, to obtain specimens saturated to different hydrogen concentration levels, the electrolytic process was carried out at two significantly different cathode current densities: j1 = 500 A/m2 and j2 = 1360 A/m2. When selecting the indicated values j, we were aware of the opinion of the authors of [45,46], who believe that the results of specimen hydrogenation using such relatively high current densities are unrepresentative. However, as the performed analysis [47] shows, most scientific studies, for example [48,49,50,51,52], use similar current densities in the electrolytic saturation of specimens with hydrogen. Apart from changing the current density in the experiments, we also varied the hydrogenation time (t from 15 to 223 min), which, according to the authors, could also affect the difference in the concentration of absorbed hydrogen in the hydrogenated specimens.
The possibility of obtaining different concentrations of CH hydrogen in metal during its hydrogenation at various current densities was confirmed in original and hydrogenated (j = 500 and 1360 A/m2, t = 30 min) control specimens (cylinders ∅0.006 × 0.05 m), in which the integral mass fraction of the hydrogen content, similar to [1,11,53,54,55,56], was determined by the reductive melting method. The method is based on melting a specimen in a container made of ceramic material in a flow of an inert carrier gas (nitrogen), extracting hydrogen from the specimen, and determining its amount by physical or physicochemical methods. However, other methods for determining the hydrogen concentration could be used for this purpose; for example, the immersion of a hydrogenated specimen in a glass flask with silicone oil [45] followed by the determination of the volume of released hydrogen, during anodic dissolution of a hydrogenated specimen [27,57], using a mass-spectrometer [1], with a calculation according to Faraday’s law [46] or as per the empirical dependencies [45,51].
Next, the DPMS values were recorded in the same 3 points of each specimen, having undergone electrolytic hydrogenation at a given mode, which were then compared with the initial DPMS0 values. The values of this difference Δav, averaged for three points, were recalculated using Formula (5) into the values of generated stresses σ, and compared with the hydrogen content in the steel.

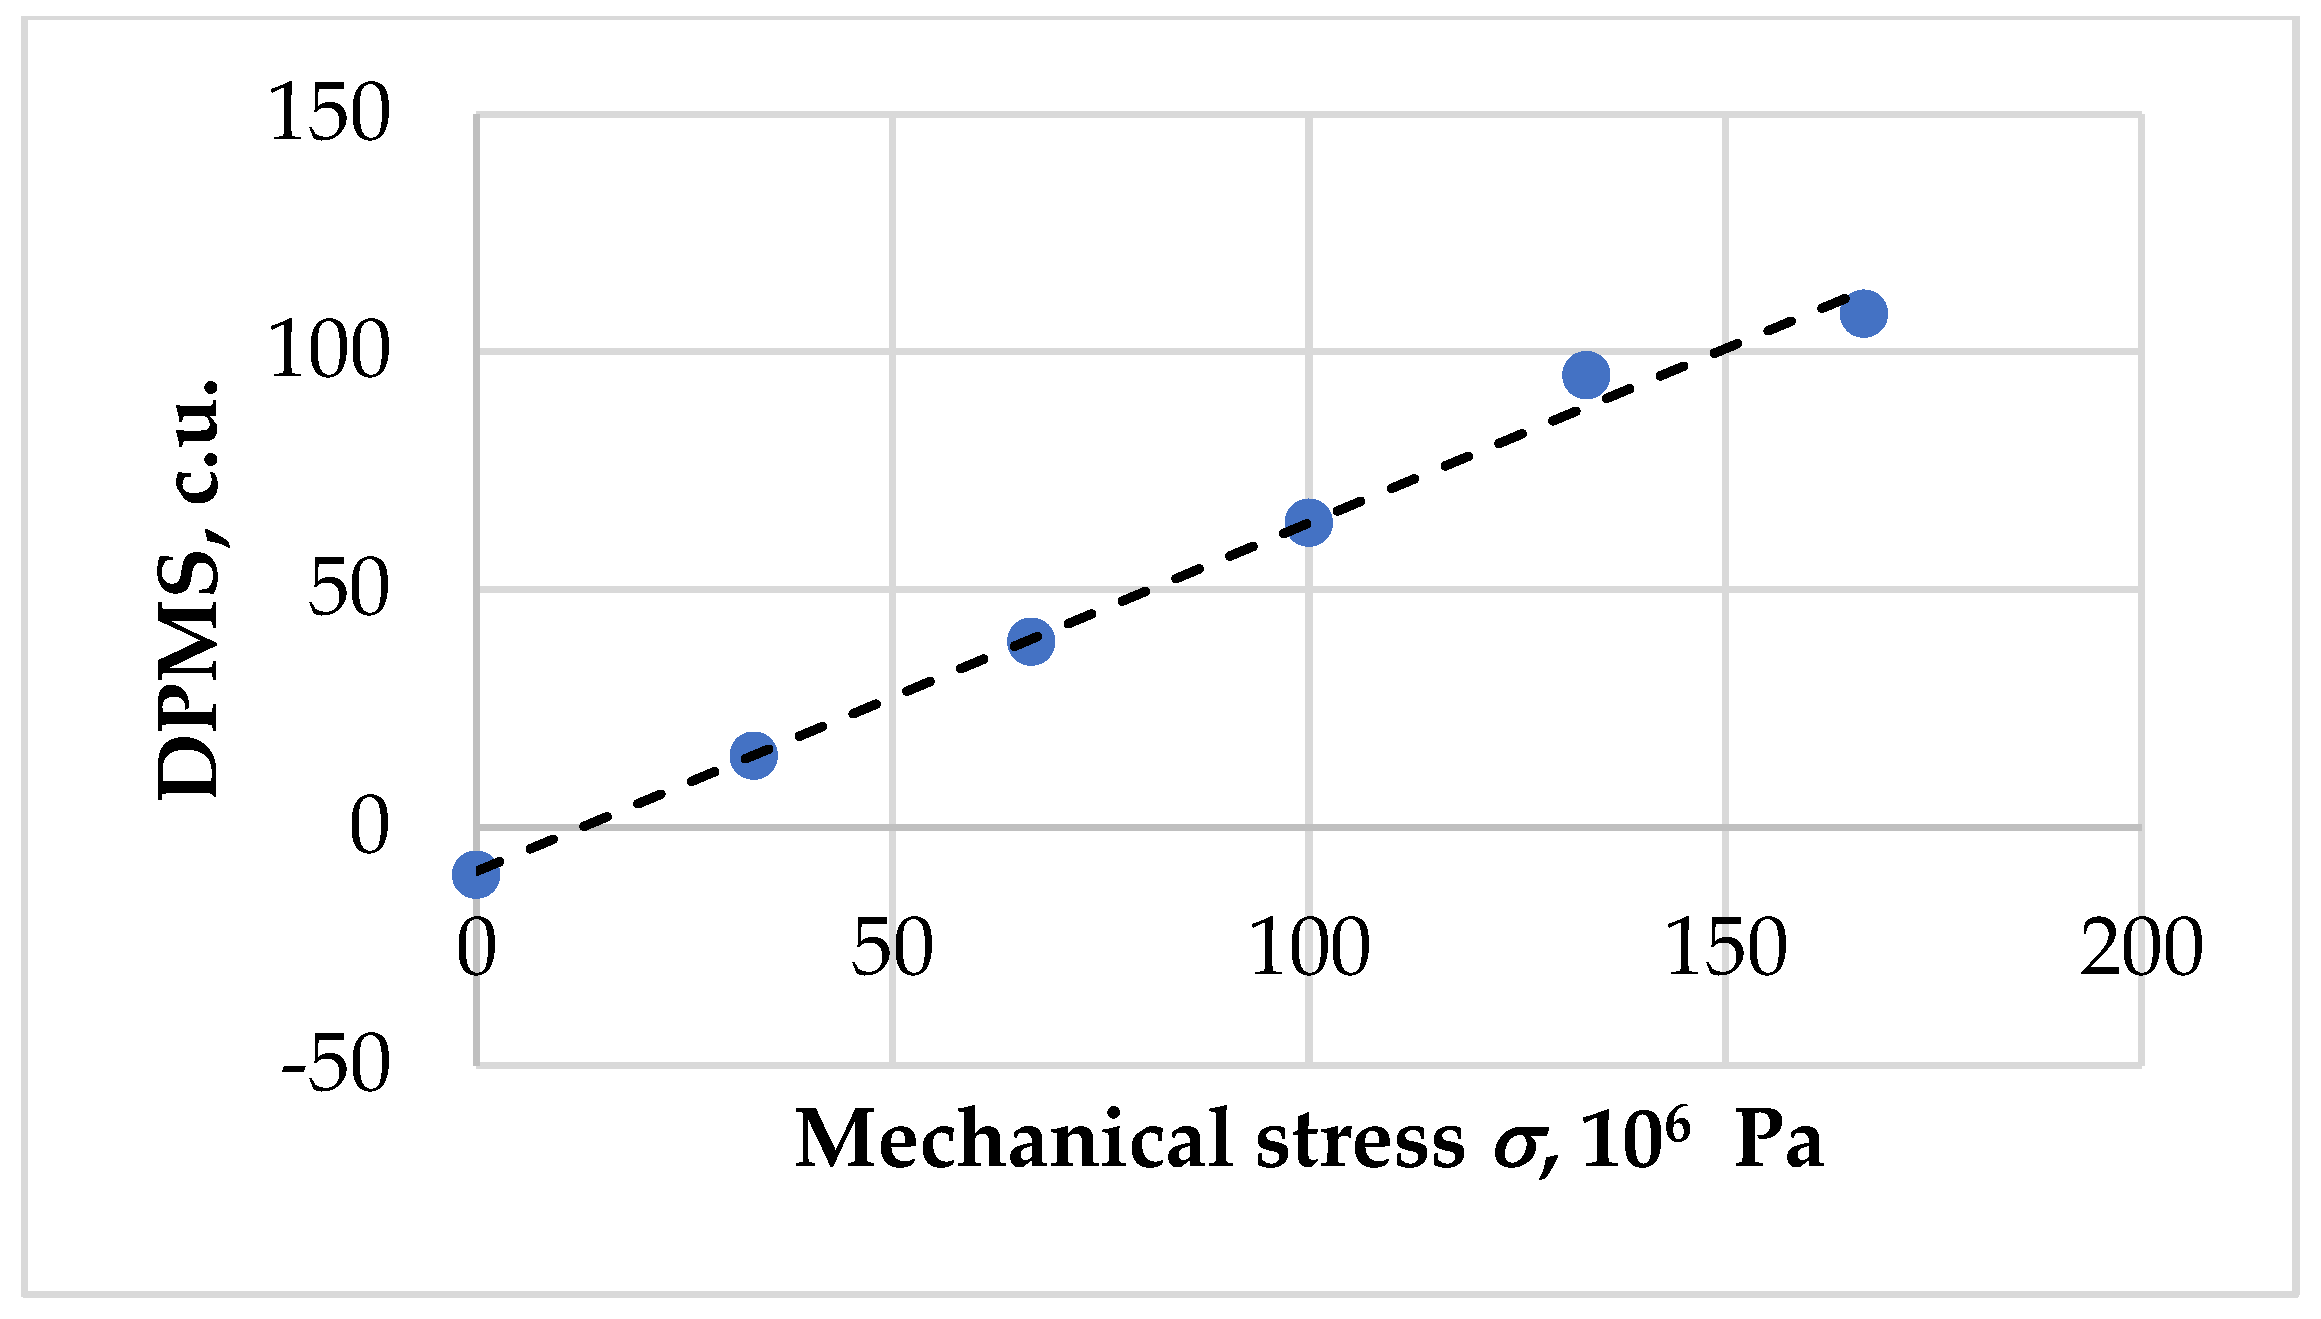
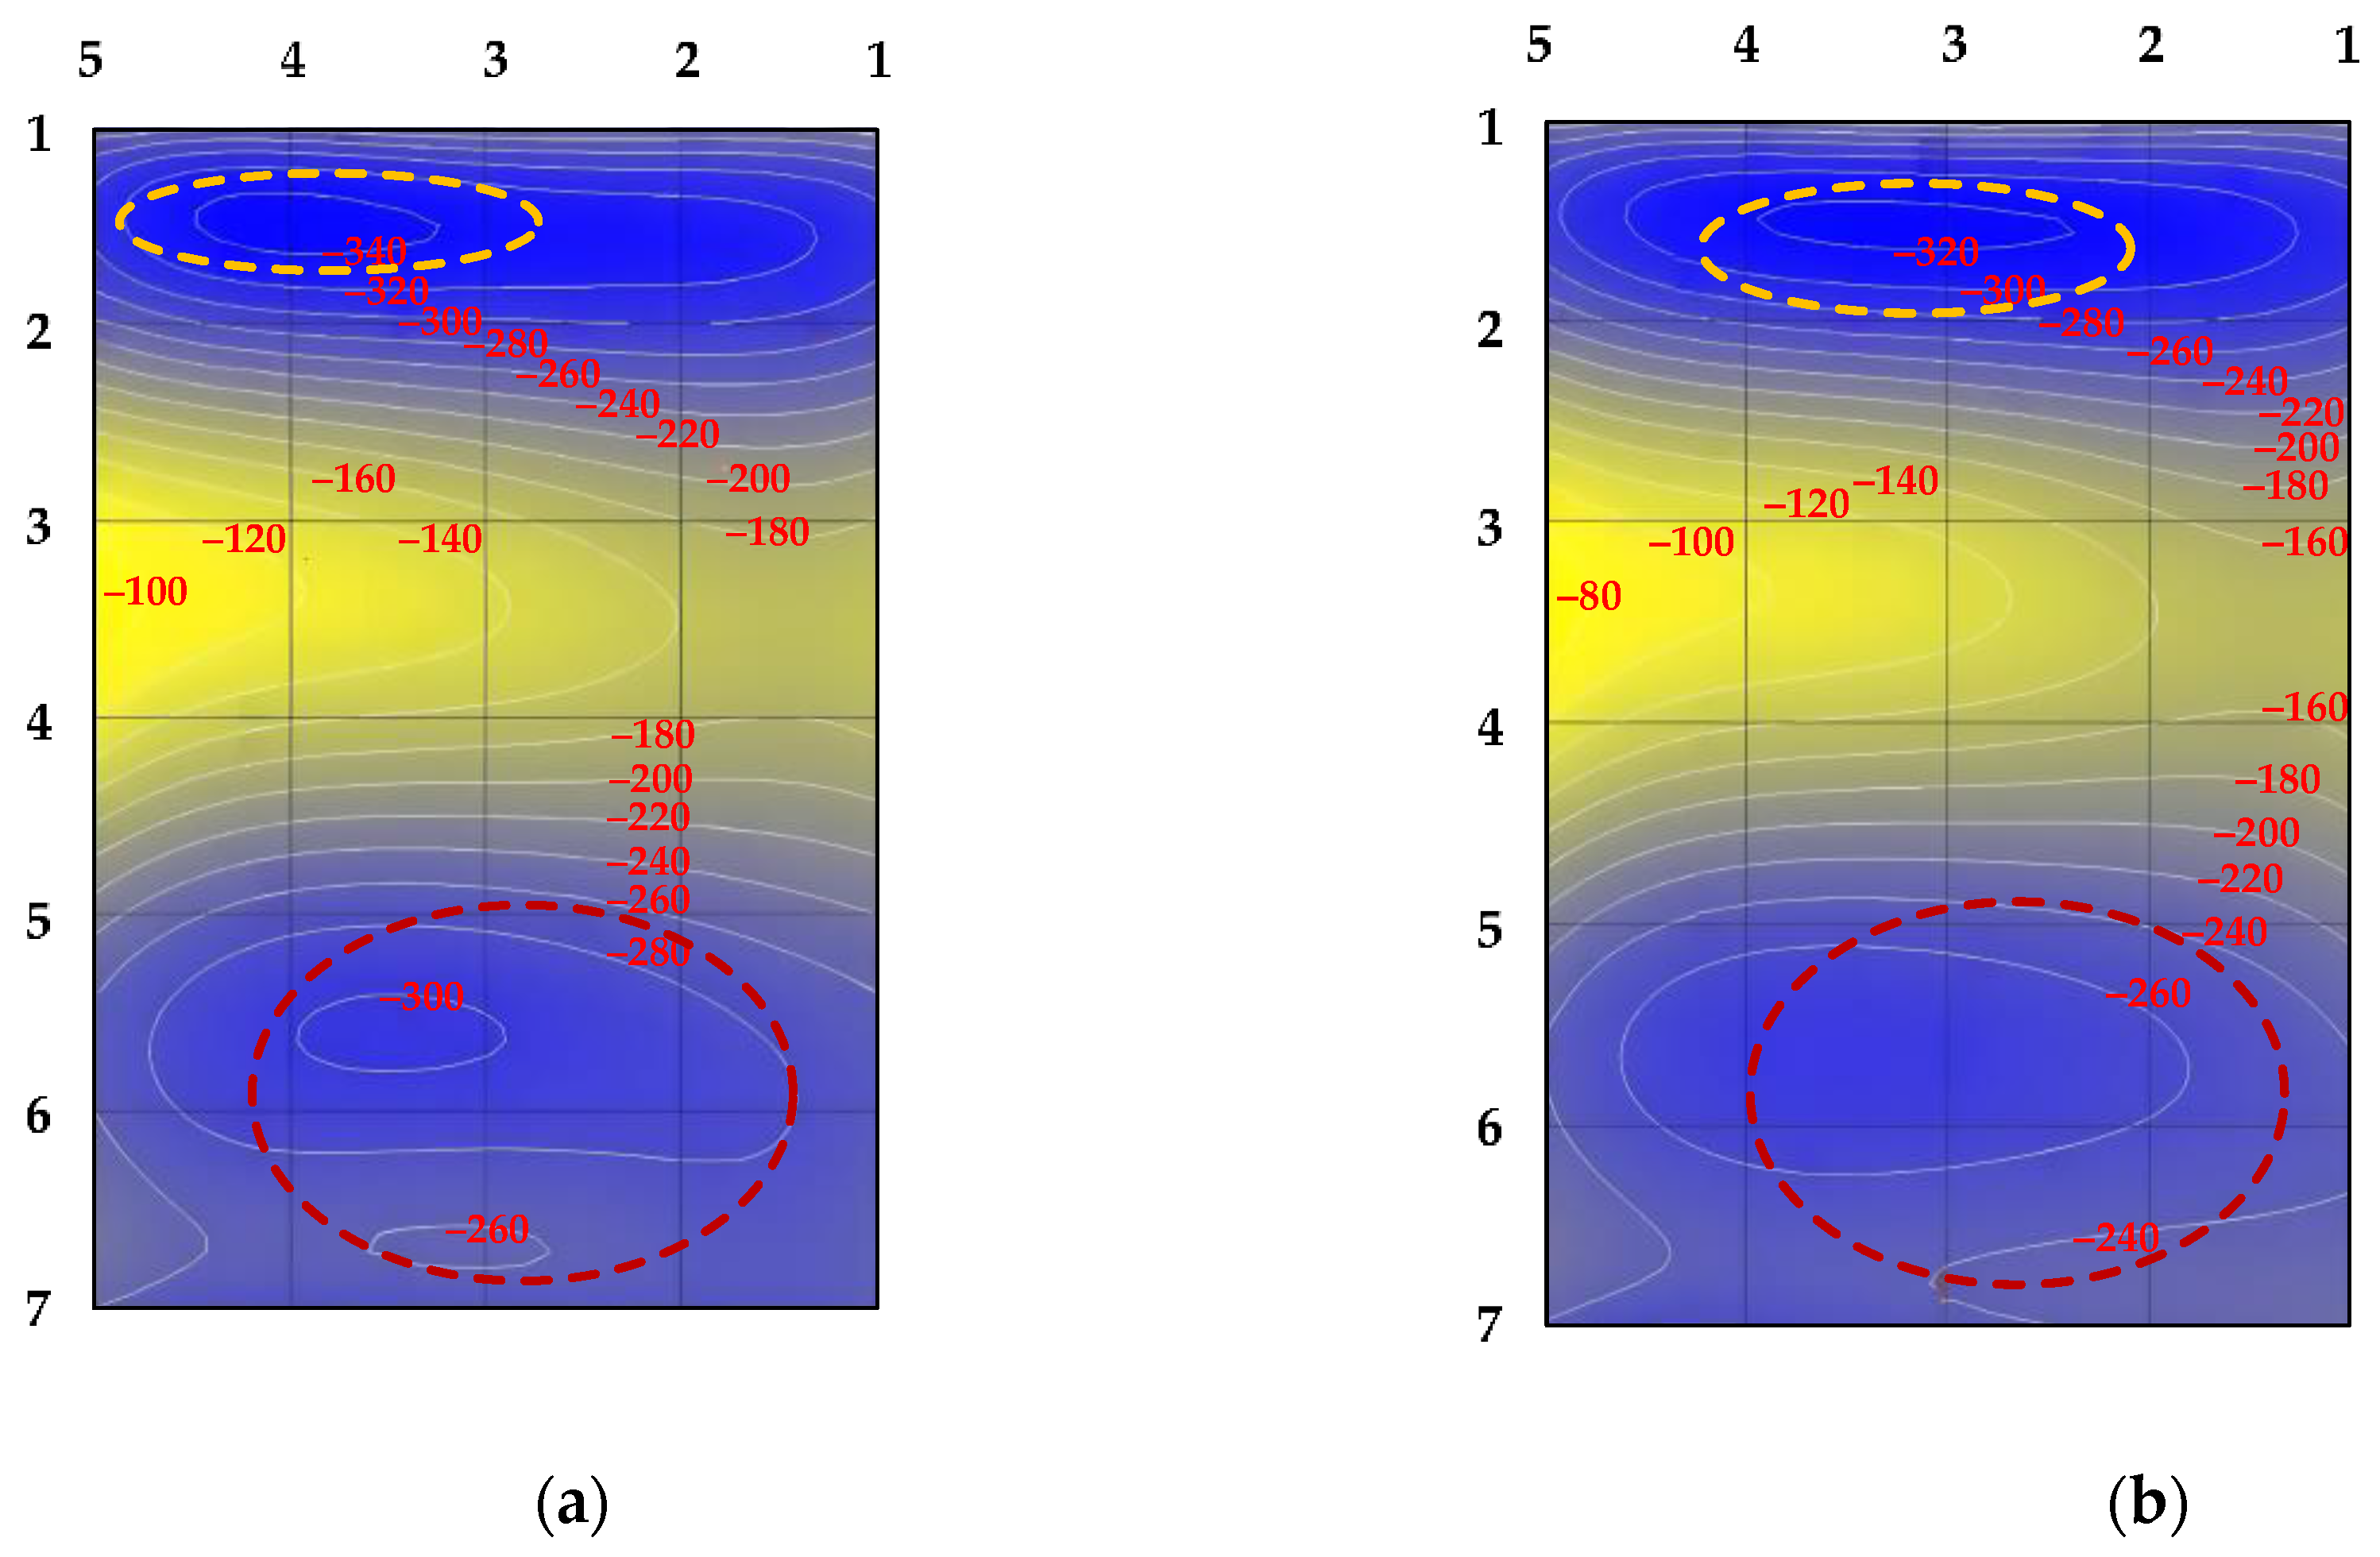
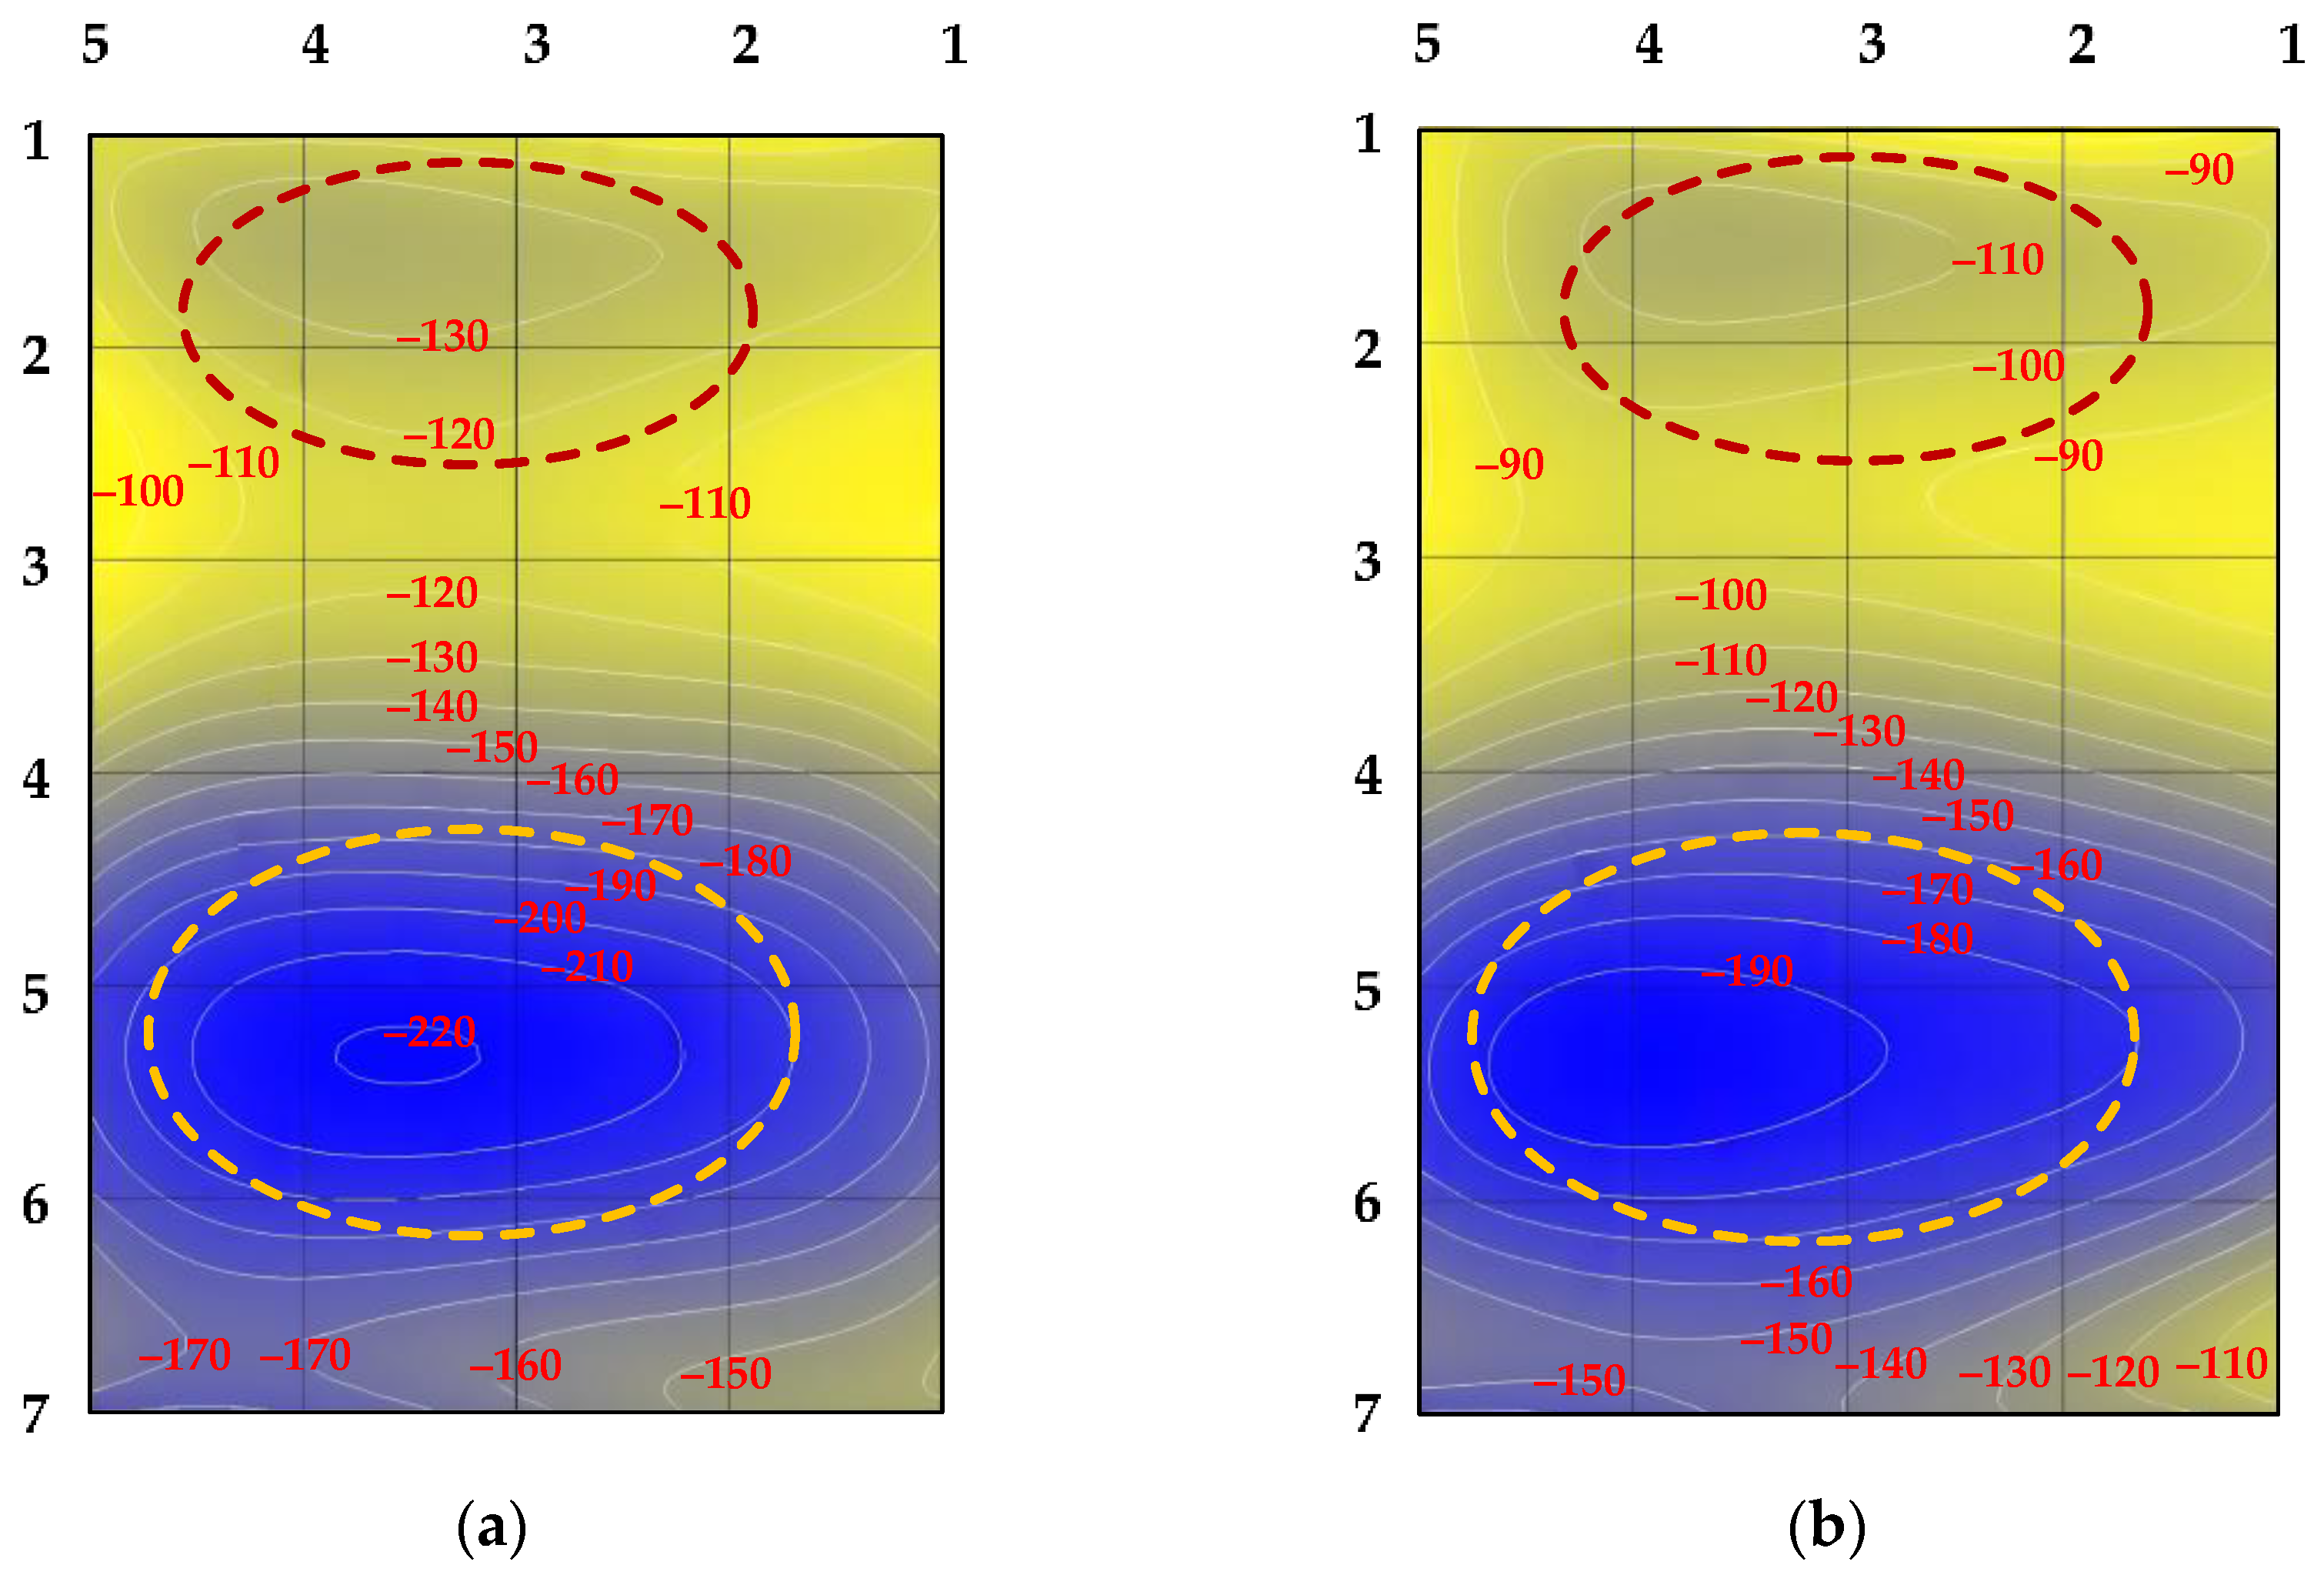
5. Results and Discussion

The results of the experiments on registering the DPMS signals from the specimens are presented in Table 2, as well as the stresses occurring in the specimens as a result of hydrogenation, calculated (5) based on the difference in the values of the recorded signals.
As follows from the data in Table 2, all recorded signal values, both for the original DPMS0 and hydrogenated specimens, have a negative sign, which, in accordance with the results of calibration tests (Figure 3), indicates the presence of compressive stresses in the surface layer of the metal. Milling and surface grinding used in the manufacture of specimens are the source of their occurrence. However, the signals in different points of the same specimen differ from each other significantly (for example, up to 34% for specimen no. 2), which stems from the fact that different forces are applied by the tool to different points of the specimen during the surface processing. This is also evidenced by the uneven distribution of isolines on the DPMS maps, which is different for different specimens (Figure 5 and Figure 6). It can be noted that for specimens cut directly from rolled products, without the indicated mechanical treatments, such as those used in calibration tests, the values of residual stresses and, consequently, the DPMS values, also have a negative sign, but are significantly lower in absolute value.
After hydrogenation, the pattern of the isolines’ distribution and their sign remains the same (Figure 5 and Figure 6); however, the values (in terms of absolute value) are reduced by Δ (Table 2), which corresponds, as it can be concluded, to tensile stresses generated due to hydrogen saturation of the specimen, which partially compensate for the existing residual compressive stress in the specimens. (Measurement of the DPMS in parts of the specimen protected from hydrogenation did not show a change in the signal value exceeding the measurement error (±2.5 c.u.)).
The conclusion on the occurrence of tensile stresses due to the exposure to hydrogen complies with the results of [1] on the slot enlargement in notched specimens during hydrogenation (Figure 1), but does not confirm the data of [28], and for this reason requires clarification.
It can be noted that the values of the indicated stresses (37–46 × 106 Pa), calculated (5) using the values Δ from the table, are close to the stress values determined physically on hydrogenated steel specimens under similar modes (j = 1000 A/m2, t ≥ 85 min), for instance, 60–70 × 106 Pa [35].
As follows from Table 2, the value Δ for the same current density as that in [1] (Table 1) is essentially independent of the hydrogenation time: for example, with an increase in exposure from 30 to 223 min for j = 500 A/m2 and from 15 to 180 min for j = 1360 A/m2, the value Δ changes only by 2 units. This may indicate that during the time t ≤ 15 min, the surface layer of the metal, which is less or equal in thickness to the signal penetration depth (up to 2 × 10⁻³ m), is saturated with hydrogen to its ultimate equilibrium concentration, which does not increase with further continuation of the electrolytic process. This conclusion confirms the results of experiments [35], which imply that, during electrolytic hydrogenation the resulting stresses are concentrated in a thin layer, with a thickness of about 3–4 × 10⁻⁵ m.
According to the results of the physical–chemical analysis of the specimens carried out using the method of reduction melting in a nitrogen flow, with an increase in current density during electrochemical saturation, the hydrogen content in the specimens actually increases: up to 1.8 ppm for a specimen hydrogenated at j1 = 500 A/m2 and up to 2.1 ppm for j2 = 1800 A/m2. Since this method determines the integral hydrogen content over the entire volume of the hydrogenated specimen, but practically only its thin surface layer is hydrogenated, it can be concluded that the hydrogen content in this layer proves to be significantly higher than 1.8 ppm or 2.1 ppm. If we assume that all hydrogen that has penetrated into the metal as a result of electrolytic saturation is concentrated in the surface layer with a depth of ~0.7 × 10⁻³ m [58], then its concentration in this layer will be 4.5 and 5.2 ppm.
It should be noted that the dependence of the DPMS signal increase on the increase of hydrogen content in steel, found in this study, slightly contradicts the data [27]. When studying the effect of the hydrogen concentration in hydrogenated low-alloy steels on the parameters of the magnetoacoustic emission (MAE) signal, the authors [27] discovered that an increase in the sum of the MAE signal amplitudes is observed up to a certain hydrogen concentration C* (~0.4 ppm), and then they decrease (amid an overall increase in the sum of amplitudes compared to the original state of the material). As a result, the value C* for each grade of low-carbon steel is different. The authors attribute this dualistic nature of MAE signal variation to the dual influence of hydrogen concentration on the number of dislocations in the metal, the number of which decreases with an increase in hydrogen concentration up to values C*, and then increases with stress relief when C > C*. From this point of view, the decrease in compressive stresses under the influence of dissolved hydrogen discovered in this paper could be explained not by changes in the stress state of the crystal lattice, but by the localized hydrogen-induced plasticity (HELP mechanism) [59].
In this regard, the following can be outlined. The method of magnetic anisotropy proposed by the authors of this paper is based on the dependence of the value of the DPMS signal on the difference between the principal mechanical stresses present in the surface layer of a metal structure. In this case, the DPMS signal variation for carbon and low-alloy steels, as found by the authors, is directly proportional to the increase or decrease in one of these stresses. At the same time, the authors of [27] do not report the existence of such a linear relationship between the MAE signal and the stress in the specimen. It is quite possible that, as in the case of the dependence MAE = f(CH*), it is shaped as a broken curve: the MAE signal increases up to a certain stress value σ*, and then it decreases. In this case, an increase in the hydrogen content above CH*, although accompanied by an increase in stresses in the metal above σ*, will lead to a decrease in the MAE signal.
Moreover, there are data [60] confirming the linear dependence of the stresses variation in the specimen depending on the concentration of dissolved hydrogen.
In [60], cylindrical specimens of X80 steel were hydrogenated using the electrolytic method at parameters (j = 2 ÷ 200 A/m2, t = 48 h) close to those used in this study, followed by the determination of the integral hydrogen content in the specimens by putting them in a glass flask with silicone oil and counting the released hydrogen. Using a tensile testing machine, the original and hydrogenated specimens were subjected to uniaxial tension until ruptured, with a recording of the stress Sk at which one or another specimen was destroyed. The magnitude of the occurring stress σ for each hydrogen concentration in the specimen was set as the difference between the values Sk0 of the non-hydrogenated and Ski of the hydrogenated specimens.
This interpretation of the experimental results implies that the stresses induced by the hydrogen presence in the specimen are tensile, complementary to those occurring from the tensile stress of the specimens Ski to the required critical level Sk0. It can be noted that the stresses determined in such manner, caused by dissolved hydrogen (up to 40 × 106 Pa), are of the same level as that determined as per the DPMS signal variation in the present study (37–46 × 106 Pa).
The data of the author of [58], albeit indirectly, also confirm the conclusion of the existence of a linear relationship between the parameters CH and σ. This paper presents the results of experiments on hardness variation of the low-carbon steel surface layer subjected to electrolytic hydrogenation up to various concentrations of hydrogen CH. Here, the distribution of hydrogen over the cross section of the specimen was determined by the method of stepwise anodic dissolution, i.e., by repeatedly removing thin layers of metal from the specimen in sequence, with intermediate weighing and measuring of the volume of hydrogen corresponding to this removed layer. As appears from the graph in Figure 7 of [58], there is a linear dependence between the microhardness of steel and the hydrogen content in it, in the concentration range of 1.3–9.7 ppm.
Since the hardness of steel is proportional to the relative deformation of the specimen, which, in turn, is a function of the stress applied to the specimen, these data can also indicate the existence of a linear dependence between the hydrogen concentration in the metal and the stresses resulting from hydrogenation.

6. Conclusions

In this article, a relationship is established between the hydrogen content in the metal, the stresses that arise during hydrogenation, and the change in the magnetic properties of ferromagnetic materials, characterized by the magnitude of the DPMS signal. For the example of lamellar specimens of pipe low-carbon steel subjected to varying intensity of electrolytic hydrogenation, the possibility of using the magnetoanisotropic method to register sections of underground pipelines with a high hydrogen content is substantiated, which can become the basis for a method for diagnosing sections of pipelines with broken insulation for their susceptibility to stress corrosion and the possibility of their further use. Here, adjacent sections of the pipeline with unbroken insulation can act as comparison points (values DPMS0). Since the method can be used for ferromagnetic steels of any grade, it is, as a result, applicable to most main and process pipelines.
Also, using the method of magnetic anisotropy, it was confirmed that when steel samples are saturated with hydrogen, tensile stresses arise in their surface layers, the magnitude of which increases with increasing hydrogen concentration in the metal.
The method proposed by the authors for non-destructive testing of the level of hydrogen content in the walls of underground pipelines, based on the physical phenomenon of magnetic anisotropy, will have a number of advantages when implemented, the main ones being the mobility of research equipment and the absence of the need for mechanical action on the pipeline wall. Its application in practice, accompanied by the collection of statistical data on the behaviour of various pipeline steels, will lead to a more detailed study of the properties of these materials and possible discoveries in the field of materials science, as well as a possible refinement of the proposed method.
The authors see the development of this method in carrying out measurements of the RGMN on other pipeline steels, which are, among other things, in the form of hydrogenated pipe fragments, as well as in comparing the results with those obtained by other methods for monitoring the stress state of a metal surface, for example, such as MAE, microhardness, and X-ray diffraction.

Author Contributions

Conceptualization, V.I.B. and V.S.Z.; methodology, I.U.L.; software, V.S.Z.; validation, G.G.P.; formal analysis, G.G.P.; investigation, V.S.Z. and I.U.L.; resources, V.I.B. and V.S.Z.; data curation, V.S.Z.; writing—original draft preparation, I.U.L.; writing—review and editing, V.I.B.; visualization, V.S.Z.; supervision, V.I.B.; project administration, G.G.P. All authors have read and agreed to the published version of the manuscript.

Funding

This research received no external funding.

Data Availability Statement

No Applicable.

Conflicts of Interest

The authors declare no conflict of interest. The funders had no role in the design of the study; in the collection, analyses, or interpretation of data; in the writing of the manuscript; or in the decision to publish the results.

References

  1. Moroz, L.S.; Chechulin, B.B. Hydrogen Brittleness of Metals; Gordon, L.M., Ed.; Metallurgy Publishing House: Moscow, Russia, 1967. [Google Scholar]
  2. Kolachev, S.V. Hydrogen Brittleness of Metals; Metallurgy Publishing House: Moscow, Russia, 1985. [Google Scholar]
  3. Litvinenko, V.S.; Tsvetkov, P.S.; Dvoynikov, M.V.; Buslaev, G.V. Barriers to Implementation of Hydrogen Initiatives in the Context of Global Energy Sustainable Development. J. Min. Inst. 2020, 244, 428–438. [Google Scholar] [CrossRef]
  4. Balitskii, A.I.; Ivaskevich, L.M.; Balitskii, O.A. Rotor Steels Crack Resistance and Fracture Behavior for Hydrogen Targeted Materials Ever-Widening Database. Eng. Fract. Mech. 2022, 260, 108168. [Google Scholar] [CrossRef]
  5. Pyshmintsev, I.Y.; Gizatullin, A.B.; Devyaterikova, N.A.; Laev, K.A.; Tsvetkov, A.S.; Al’khimenko, A.A.; Shaposhnikov, N.O.; Kurakin, M.K. Preliminary Assessment of the Possibility to Use Large-Diameter Pipes of X52 Steel for Transportation of Pure Gaseous Hydrogen under Pressure. Izv. Ferr. Metall. 2023, 66, 35–42. [Google Scholar] [CrossRef]
  6. Anijdan, S.H.M.; Sabzi, M.; Park, N.; Lee, U. Sour Corrosion Performance and Sensitivity to Hydrogen Induced Cracking in the X70 Pipeline Steel: Effect of Microstructural Variation and Pearlite Percentage. Int. J. Press. Vessel. Pip. 2022, 199, 104759. [Google Scholar] [CrossRef]
  7. Balitskii, A.I.; Dmytryk, V.V.; Ivaskevich, L.M.; Balitskii, O.A.; Glushko, A.V.; Medovar, L.B.; Abramek, K.F.; Stovpchenko, G.P.; Eliasz, J.J.; Krolikowski, M.A. Improvement of the Mechanical Characteristics, Hydrogen Crack Resistance and Durability of Turbine Rotor Steels Welded Joints. Energies 2022, 15, 6006. [Google Scholar] [CrossRef]
  8. Beloglazov, I.; Morenov, V.; Leusheva, E.; Gudmestad, O.T. Modeling of Heavy-Oil Flow with Regard to Their Rheological Properties. Energies 2021, 14, 359. [Google Scholar] [CrossRef]
  9. Silvestrov, S.A.; Gumerov, K.M. Change of Mechanical Properties of Pipe Metal in Hydrogen-Containing Media. In Proceedings of the VIII Ural Scientific and Practical Conference “Welding. Renovation. Tribotechnics”; Nizhny Tagil Institute of Technology (branch) UrFU, Nizhny Tagil, Russia, 2–3 February 2017. [Google Scholar]
  10. Lisin, Y.V.; Neganov, D.A.; Surikov, V.I.; Gumerov, K.M. Research of Changes in the Properties of Pipeline Metal in the Process of Operation: Generalization of the Results and Prospective Developments of the Ufa Scientific School. Sci. Technol. Oil Oil Prod. Pipeline 2017, 7, 22–30. [Google Scholar] [CrossRef]
  11. Silvestrov, S.A.; Gumerov, A.K. Latent Period of Stress Corrosion Cracking Development at the Main Pipelines. Probl. Gather. Treat. Transp. Oil Oil Prod. 2018, 113, 95–113. [Google Scholar] [CrossRef]
  12. Bolobov, V.I.; Latipov, I.U.; Zhukov, V.S.; Kasyanenko, S.V.; Nikulin, V.E.; Popov, G.G.; Sumin, E.I. Role of hydrogen in corrosion and sulfide cracking of pipelines. GAS Ind. Russ. 2023, 850, 90–99. [Google Scholar]
  13. Zemenkova, M.Y.; Chizhevskaya, E.L.; Zemenkov, Y.D. Intelligent Monitoring of the Condition of Hydrocarbon Pipeline Transport Facilities Using Neural Network Technologies. J. Min. Inst. 2022, 258, 933–944. [Google Scholar] [CrossRef]
  14. Tan, N.; Zhou, L.; Zheng, W.; Song, H.; Sun, Z.; Wang, Z.; Wang, G.; Wang, G.; Zhang, L.; Zhou, X. Using Finite Element Method for Stress-Strain Evaluation of Commonly Used Buried Pipelines in Fault. Energies 2022, 15, 1655. [Google Scholar] [CrossRef]
  15. Goldobina, L.A.; Orlov, P.S. Analysis of the Causes of Corrosion Damage in Underground Pipelines and New Solutions for Increasing the Corrosion Resistance of Steel. J. Min. Inst. 2016, 219, 459–464. [Google Scholar] [CrossRef]
  16. Aginey, R.; Firstov, A. Improving the Method for Assessment of Bending Stresses in the Wall of an Underground Pipeline. J. Min. Inst. 2022. Online first. [Google Scholar] [CrossRef]
  17. Baktizin, R.N.; Zaripov, R.M.; Korobkov, G.E.; Masalimov, R.B. Assessment of Internal Pressure Effect, Causing Additional Bending of the Pipeline. J. Min. Inst. 2020, 242, 160–168. [Google Scholar] [CrossRef]
  18. Karyakina, E.; Shammazov, I.; Voronov, V.; Shalygin, A. The Simulation of Ultra-High Molecular Weight Polyethylene Cryogenic Pipeline Stress-Strain State. Mater. Sci. Forum 2021, 1031, 132–140. [Google Scholar] [CrossRef]
  19. Cristescu, N.; Craciun, E.-M.; Soós, E. Mechanics of Elastic Composites; Chapman & Hall/CRC: Boca Raton, FL, USA, 2004; ISBN 1584884428. [Google Scholar]
  20. Shammazov, I.; Dzhemilev, E.; Sidorkin, D. Improving the Method of Replacing the Defective Sections of Main Oil and Gas Pipelines Using Laser Scanning Data. Appl. Sci. 2022, 13, 48. [Google Scholar] [CrossRef]
  21. Palaev, A.G.; Nosov, V.V.; Krasnikov, A.A. Simulating Distribution of Temperature Fields and Stresses in Welded Joint Using ANSYS. Sci. Technol. Oil Oil Prod. Pipeline Transp. 2022, 12, 353–361. [Google Scholar]
  22. Lyubchik, A.N.; Krapivsky, E.I.; Bolshunova, O.M. Forecasting the Technical Condition of Main Pipelines Based on the Analysis of Emergency Situations. J. Min. Inst. 2011, 192, 153–156. [Google Scholar]
  23. Sultanbekov, R.; Beloglazov, I.; Islamov, S.; Ong, M.C. Exploring of the Incompatibility of Marine Residual Fuel: A Case Study Using Machine Learning Methods. Energies 2021, 14, 8422. [Google Scholar] [CrossRef]
  24. Vidas, L.; Castro, R.; Pires, A. A Review of the Impact of Hydrogen Integration in Natural Gas Distribution Networks and Electric Smart Grids. Energies 2022, 15, 3160. [Google Scholar] [CrossRef]
  25. Sultanbekov, R.; Schipachev, A. Manifestation of Incompatibility of Marine Residual Fuels: A Method for Determining Compatibility, Studying Composition of Fuels and Sediment. J. Min. Inst. 2022. Online first. [Google Scholar] [CrossRef]
  26. Shammazov, I.; Karyakina, E. The LNG Flow Simulation in Stationary Conditions through a Pipeline with Various Types of Insulating Coating. Fluids 2023, 8, 68. [Google Scholar] [CrossRef]
  27. Skalskyi, V.; Nazarchuk, Z.; Stankevych, O.; Klym, B. Influence of Occluded Hydrogen on Magnetoacoustic Emission of Low-Carbon Steels. Int. J. Hydrogen Energy 2023, 48, 6146–6156. [Google Scholar] [CrossRef]
  28. Zhukov, S.V.; Zhukov, V.S. RU 2195636 C2 Method for Determining Mechanical Stresses and Device for Its Implementation 2002. Available online: https://www.elibrary.ru/item.asp?id=37897742 (accessed on 7 July 2023).
  29. Zhukov, S.V.; Zhukov, V.S. RU 2079825 C1 Device for Measuring Mechanical Stresses in Metal Products 1997. Available online: https://www.elibrary.ru/item.asp?id=38062207 (accessed on 7 July 2023).
  30. Rajnak, M.; Wu, Z.; Dolnik, B.; Paulovicova, K.; Tothova, J.; Cimbala, R.; Kurimsky, J.; Kopcansky, P.; Sunden, B.; Wadso, L.; et al. Magnetic Field Effect on Thermal, Dielectric, and Viscous Properties of a Transformer Oil-Based Magnetic Nanofluid. Energies 2019, 12, 4532. [Google Scholar] [CrossRef] [Green Version]
  31. Evstratikova, Y.I.; Nikulin, V.E. Control of Residual Weld Stresses Using Magnetic Anisotropic Method After Applying Ultrasonic Impact Treatment. Weld. Diagn. 2019, 4, 38–42. [Google Scholar]
  32. Stepanov, M.A.; Stepanov, A.P. Evaluation of the Distribution of Bending Stresses and Defects Within Symmetrical Cross Sections of a Steel Beam. Mod. Technol. Syst. Anal. Model. 2019, 63, 22–31. [Google Scholar]
  33. Sakai, Y.; Unishi, H.; Yahata, T. Non-Destructive Method of Stress Evaluation in Linepipes Using Magnetic Anisotropy Sensor. In JFE Technical Report; JFE Steel Corporation: Tokyo, Japan, 2004; pp. 47–53. [Google Scholar]
  34. Korneev, A.V.; Treschev, A.A. Accounting for the Influence of a Hydrogen-Containing Environment on the Stress-Strain State of Materials Based on Titanium Alloys. News Tula State Univ. Eng. Sci. 2009, 116–123. Available online: https://cyberleninka.ru/article/n/uchet-vliyaniya-vodorodosoderzhaschey-sredy-na-napryazhenno-deformirovannoe-sostoyanie-materialov-na-osnove-titanovyh-splavov (accessed on 7 July 2023).
  35. Glikman, L.A.; Snezhkova, T.N. On the Occurrence of Residual Stresses at the Electrolytic Saturation of the Steel Surface with Hydrogen. J. Tech. Phys. 1952, 22, 1104–1108. [Google Scholar]
  36. Shchegoleva, T.A.; Glukhova, Z.L.; Vetchinov, A.V. Technique of Experimental Research of Form Change of Matellic Plates. J. Theor. Appl. Mech. 2021, 76, 25–31. [Google Scholar]
  37. Smyalovsky, M.; Shklyarskaya-Smyalovskaya, Z. Principle of a New Method for Investigating the Diffusion of Cathodic Hydrogen. Izv. AN SSSR 1954, 226–229. [Google Scholar]
  38. Khizhnyakov, V.I. On the Controlling Role of the Current Density of Cathodic Protection in the Formation of Corrosion and Stress-Corrosion Defects on the External Surface of the Main Gas and Oil Pipelines. Tomsk State Univ. J. 2013, 18, 2248–2252. [Google Scholar]
  39. Galaktionova, N.A. Hydrogen in Metals; Metallurgy Publishing House: Moscow, Russia, 1967. [Google Scholar]
  40. Schipachev, A.M.; Dmitrieva, A.S. Application of the Resonant Energy Separation Effect at Natural Gas Reduction Points in Order to Improve the Energy Efficiency of the Gas Distribution System. J. Min. Inst. 2021, 248, 253–259. [Google Scholar] [CrossRef]
  41. Fetisov, V.; Shalygin, A.V.; Modestova, S.A.; Tyan, V.K.; Shao, C. Development of a Numerical Method for Calculating a Gas Supply System during a Period of Change in Thermal Loads. Energies 2022, 16, 60. [Google Scholar] [CrossRef]
  42. Karpenko, G.V.; Kripyakevich, R.I. Effect of Hydrogen on the Properties of Steel; Metallurgizdat: Moscow, Russia, 1962. [Google Scholar]
  43. Shevchenko, G.I. Magnetic Anisotropic Sensors; Energy: Moscow, Russia, 1967. [Google Scholar]
  44. Capelle, J.; Gilgert, J.; Dmytrakh, I.; Pluvinage, G. Sensitivity of Pipelines with Steel API X52 to Hydrogen Embrittlement. Int. J. Hydrogen Energy 2008, 33, 7630–7641. [Google Scholar] [CrossRef]
  45. Li, H.L.; Gao, K.W.; Qiao, L.J.; Wang, Y.B.; Chu, W.Y. Strength Effect in Stress Corrosion Cracking of High-Strength Steel in Aqueous Solution. Corrosion 2001, 57, 295–299. [Google Scholar] [CrossRef]
  46. Dey, S.; Mandhyan, A.K.; Sondhi, S.K.; Chattoraj, I. Hydrogen Entry into Pipeline Steel under Freely Corroding Conditions in Two Corroding Media. Corros. Sci. 2006, 48, 2676–2688. [Google Scholar] [CrossRef]
  47. Latipov, I.U.; Sherstneva, A.O.; Popov, G.G.; Bolobov, V.I. Analysis of Existing Techniques for Hydrogenation and Testing of Steel Specimens for the Effect of Hydrogen. GAS Ind. Russ. 2022, 836, 36–43. [Google Scholar]
  48. Karpenko, G.V.; Kripyakevich, R.I. Influence of Steel Polarization on Its Mechanical Properties. Rep. Acad. Sci. USSR 1958, 120, 827–829. [Google Scholar]
  49. Irzhov, G.G.; Golovanenko, S.A.; Sergeeva, T.K. Resistance to Hydrogen Embrittlement of Steels for Main Pipelines. Physicochem. Mech. Mater. 1982, 4, 89–93. [Google Scholar] [CrossRef]
  50. Efimenko, E.A.; Sidorenko, A.V.; Ivanova, Y.S.; Sarafanova, Y.A. Evaluation of the Hydrogen Embrittlement Degree for Low-Carbon Steels. ISJAEE 2003, 9, 22–25. [Google Scholar]
  51. Li, X. Hydrogen Effects on X80 Steel Mechanical Properties Measured by Tensile and Impact Testing; University of South Florida: Tampa, FL, USA, 2016. [Google Scholar]
  52. Hardie, D.; Charles, E.A.; Lopez, A.H. Hydrogen Embrittlement of High Strength Pipeline Steels. Corros. Sci. 2006, 48, 4378–4385. [Google Scholar] [CrossRef]
  53. Newman, J.F.; Shreir, L.L. Role of Hydrides in Hydrogen Entry into Steel from Solutions Containing Promoters. Corros. Sci. 1969, 9, 631–641. [Google Scholar] [CrossRef]
  54. Lunarska, E.; Ososkov, Y.; Jagodzinsky, Y. Correlation between Critical Hydrogen Concentration and Hydrogen Damage of Pipeline Steel. Int. J. Hydrogen Energy 1997, 22, 279–284. [Google Scholar] [CrossRef]
  55. Morozov, A.N. Hydrogen and Nitrogen in Steel, 2nd ed.; Metallurgy: Moscow, Russia, 1968. [Google Scholar]
  56. Sahakyan, L.S.; Efremov, A.P.; Soboleva, I.A. Protection Oilfield Equipment from Corrosion: A Workers’ Handbook; Nedra: Moscow, Russia, 1985. [Google Scholar]
  57. Cheng, Y.F. Analysis of Electrochemical Hydrogen Permeation through X-65 Pipeline Steel and Its Implications on Pipeline Stress Corrosion Cracking. Int. J. Hydrogen Energy 2007, 32, 1269–1276. [Google Scholar] [CrossRef]
  58. Beloglazov, S.V. Hydrogenation of Steel in Electrochemical Processes; Leningrad University Press: Leningrad, Russia, 1975. [Google Scholar]
  59. Djukic, M.B.; Bakic, G.M.; Sijacki Zeravcic, V.; Sedmak, A.; Rajicic, B. The Synergistic Action and Interplay of Hydrogen Embrittlement Mechanisms in Steels and Iron: Localized Plasticity and Decohesion. Eng. Fract. Mech. 2019, 216, 106528. [Google Scholar] [CrossRef]
  60. Zhang, T.; Chu, W.Y.; Gao, K.W.; Qiao, L.J. Study of Correlation between Hydrogen-Induced Stress and Hydrogen Embrittlement. Mater. Sci. Eng. A 2003, 347, 291–299. [Google Scholar] [CrossRef]
Figure 1. Cathodic treatment of notched ring specimens, (a) scheme of a ring specimen (2r = 38 × 10−3 m; h = 15 × 10−3 m; a = 4 × 10⁻⁴ m; g = 5 × 10⁻⁴ m); (b) the dependence of its deformation on the duration of hydrogen saturation of the inner surface [1].
Energies 16 05585 g001
Figure 2. ZwickRoell testing machine (a) with a Stressvision Expert scanner recording mechanical stresses in the middle working part of a specimen, and a view of the scanner head (b) (compiled by the authors).
Energies 16 05585 g002
Figure 3. Dependence between the DPMS (mean value from 10 measurements) and tensile stress in the low-carbon steel plate (dashed line is an approximation line) (compiled by the authors).
Energies 16 05585 g003
Figure 4. Scheme of installation for hydrogenation of specimens: 1—working electrode (specimen), 2—auxiliary (counter) electrode, 3—power supply, 4—container with electrolyte, 5—open metal surface, 6—dielectric isolation (compiled by the authors).
Energies 16 05585 g004
Figure 5. Distribution map of the DPMS isolines over the width of the middle part of specimen No. 1 in the original state (a) and after hydrogenation at j1 = 500 A/m2, t = 15 min (b). The dotted line marks the areas where the change in the stress state of the specimen surface is better seen. (Compiled by the authors).
Energies 16 05585 g005
Figure 6. Distribution map of the isolines of the DPMS over the width of the middle part of specimen No. 4 in the original state (a) and after hydrogenation at j1 = 500 A/m2, t = 223 min (b). The dotted line marks the areas where the change in the stress state of the specimen surface is better seen. (Compiled by the authors).
Energies 16 05585 g006
Figure 7. Dependence of the microhardness of low-carbon steel from the amount of hydrogen absorbed during cathodic polarization [58].
Energies 16 05585 g007
Table 1. Deformation of a ring specimen as a result of saturation with hydrogen and subsequent hydrogen desorption during relief and vacuum annealing [1].
No.Deformation, 10−3 m, afterThe Amount of Released Hydrogen,
10−5 m3/kg, as a Result of Vacuum
Annealing at a Temperature, °K
Saturation with HydrogenHydrogen Saturation and Vacuum Annealing at Temperature, °K
300 sin a Day323473923323473923
10.460.470.440.440.494118.4-
20.880.900.870.870.971171.83.5
31.21.21.171.21.34137-29.1
Table 2. Comparison of the difference values between the main mechanical stresses of the original and hydrogenated specimens of low-carbon steel (compiled by the authors).
Specimen
No.
j, A/m2t, minThe Value of the DPMS at Three Points of the Specimens
Original (DPMS0)HydrogenatedΔΔav
150030−273−2502324
−275−24629
−291−27021
290−98−673129
−127−10027
−132−10329
390−226−2062026
−251−22031
−267−24027
4223−162−1403227
−198−17523
−214−18826
Δav1 = 26.5
σ1 = 37 × 106 Pa
5136015−118−843433
−131−8546
−131−11318
645−118−744435
−131−10625
−131−9635
7180−231−2013031
−299−26237
−299−27227
Δav2 = 33
σ2 = 46 × 106 Pa
Disclaimer/Publisher’s Note: The statements, opinions and data contained in all publications are solely those of the individual author(s) and contributor(s) and not of MDPI and/or the editor(s). MDPI and/or the editor(s) disclaim responsibility for any injury to people or property resulting from any ideas, methods, instructions or products referred to in the content.

