Abstract
This paper publishes the experimental performance results of a novel small dual−stage wind turbine at different speeds under wind tunnel testing. The results confirm its superiority at low wind speeds <7 m/s, which is consistent with natural wind conditions in most countries around the world. At lower wind speeds, the efficiency of the small, dual−stage wind turbine is higher than that of a conventional single−stage turbine. At wind speeds of <6 m/s, the novel dual−stage wind turbine always produces approximately 2.5 times more power than a single−stage wind turbine; the power coefficient is greater than 0.4. Thanks to this feature, the novel small, dual−stage wind turbine is effective in practical applications. For windy areas in Vietnam, the power generated over the same amount of time by the novel dual−stage wind turbine can be more than double that of a single−stage turbine. Next, a standard CFD model is established and validated with the above experimental measurements. This method ensures the objectivity and authenticity of the computational model. This standard CFD model is applicable to a horizontal double−stage wind turbine with any configuration and blade profile. The URANS simulation method, which uses sliding meshes and the k−omega SST turbulence model, was implemented with rotational domains of the minimum thicknesses of rotational domains (in this paper, 0.09Rfront and 0.06Rrear, accordingly). This method predicts higher mechanical work for the turbine than the actual value by an interval of <10% in the same speed range as in the experiment. This is an acceptable deviation.
1. Introduction
According to the World Bank’s assessment, many countries have average annual wind speeds on land that are not too high. For example, Vietnam is one of the countries with the largest wind power potential in Asia due to its mountainous terrain and 3000 km long coastline. Over 39% of the land area has an average annual wind speed of over 6 m/s at an altitude of 65 m [1]. Such countries have the potential to develop small−capacity wind power projects on the scales of households, farms, and communities. Wind turbines suitable for such applications with capacities below 10 kW are collectively referred to as small and micro−scale wind turbines. In order to further improve the power and efficiency of small wind turbines, a two−stage wind turbine with an independent rotating shaft was invented [2]. In the framework of this paper, we built a wind tunnel to test the performance of the new patented dual−stage turbine at different speeds ranging from 3 to 7 m/s. The results confirm the superiority of the newly patented dual−stage wind turbine at low wind speeds, which is suitable for natural conditions in most countries around the world. Next, a standard CFD model is established and validated with experimental measurements. This method ensures the objectivity and authenticity of the article. This standard CFD model can be applied to the double−stage wind turbine problem for any turbine configuration, regardless of which blade profile is used.
Many theoretical studies on double and multistage wind turbines were conducted worldwide, which have led the way for later experimental and computational studies. Newman and his colleagues [3] could be considered the first to study this problem in 1986. Based on “linear momentum theory” or called “one−dimensional momentum theory”, Newman predicted the maximum power coefficient for a double−stage wind turbine − with the same blade stage sizes—to be 64%, which is about 5% higher than a single−stage turbine (Betz limit). Chantharasenawong et al. [4], Agrawal [5] also used linear momentum theory to study double−stage wind turbines. They concluded that a double−stage turbine with the same rotor size gives a maximum power coefficient of up to 81.4%, which is about 22% higher than the Betz limit and 17.4% higher than Newman’s research results. Haripriya Sundararaju et al. [6] considered the impact of practical parameters such as: distance between 2 rotors, relative size between rotors, and blade tip speed ratio of each rotor in addition to the results of previous research groups. They derive a more general formula for studying the double−stage wind turbines. The maximum power coefficient they obtained was also 81.4%.
There have been many studies in the world on horizontal−axis wind turbines with two blades. In 2005, Jung et al. [7] performed an experiment on a 30 kW double−stage wind turbine, investigating the efficiency of the turbine configuration when changing the ratio of the diameters of the two turbines and the distance between them. However, the model in this study used a planetary gear system for transmission, and the obtained results show that the energy efficiency of a double−stage turbine is not much greater than that of a single−stage turbine. Lucia−Andreea Mitulet and colleagues [8] conducted an experiment to test the power of a double−stage wind turbine, confirming an average power increase of about 40% in the range of speed from 5.5 to 10 m/s when compared to a single−stage turbine. P. Santhana Kumar and colleagues [9] conducted experiments with a miniature model of a double−stage turbine, measured its power, and compared it with CFD simulation results. However, according to the invention of the new transmission structure, there is no wind tunnel experiment to properly evaluate the turbine’s performance.
Regarding the application of CFD to simulate wind turbines, Li Zhiqiang et al. [10] theoretically studied and performed a CFD research on horizontal−axis wind turbines. Using the simulation model LBM−LES, the team obtained the turbine’s power when changing the angles of the blades and the distance between the two blade stages. Rosenberg et al. [11] used the RANS model to optimize the design of the turbine and then used the LES model to validate the efficiency of the double−stage turbine. F.F. Yin et al., [12] after proposing a computational theory for double−stage turbines, performed a CFD simulation to confirm their use value. Amr Mohamed et al. [13] used the MRF model to simulate a small double−stage turbine with a diffuser−tube accelerator installed. In addition, there are many studies on the application of CFD for single−stage wind turbines [14,15]. However, these studies did not specify the specific setup of the CFD model, which can be applied to many different types of double−stage turbine configurations. Whichever models were used, MRF and frozen rotor or sliding mesh, they did not provide a study of how the results change according to the depth of the rotating domain. For a wind turbine with small distance between the two rotating domains, like our patented turbine, further study is required to determine an appropriate model.
In this paper, a small, newly invented dual−stage wind turbine is introduced. In addition, the power superiority of this turbine is practically proven via testing it in a wind tunnel with a full set of parameters.
At lower wind speeds, the efficiency of the novel dual−stage turbine is higher than that of a single−stage by about 40%. Next, a CFD model using the URANS algorithm will be applied, and the settings are clearly published so that it can be widely applied to this type of problem.
2. The Invention of a Dual−Stage Wind Turbine with an Independent Rotating Shaft
Figure 1 is a cross−sectional figure showing all the components and structures of a two−stage wind turbine that rotates independently according to the invention of the research team [2]. Basically, the turbine uses a permanent magnet synchronous generator. The rotation speed of the generator (the rotating speed of the magnetic field, which creates an induced electrical current) is increased because the two blade stages (1 and 2 on Figure 1) rotate in opposite directions (7, 9). The commutator (18) is used to transfer power from the turbine down to the transmission system.
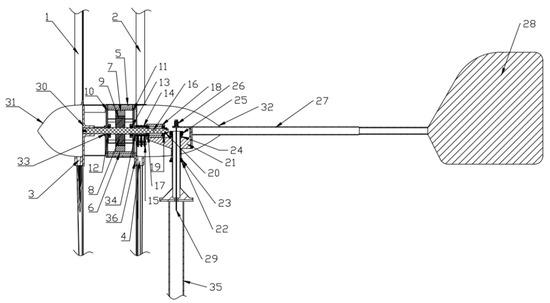
Figure 1.
The basic configuration of the novel dual−stage turbine with an independent rotating shaft.
In reality, the reasons for using one dual−stage rotor rather than two single−stage rotors are as follows:
- +
- The expectation that the method will more efficiently extract energy from the wind, especially low−speed wind, and can operate in low−speed winds.
- +
- For reasons of CapEx and maintenance. The manufacturing price and maintenance price for small−dual stage wind turbine does not exceed 20% of a single−stage turbine.
- +
- There are applications in which there is not enough space to build two single wind turbines.
3. Experimental Setup and Result
The experimentally installed dual−stage wind turbine model is basically the same as the model shown in Figure 1; the only difference is that the experimental system has no hub 31 and no yawing system. Table 1 shows the parameters when setting up the test for the novel dual−stage turbine.

Table 1.
Basic parameters when setting up the test for the dual−stage turbine.
The wind tunnel is composed of a system of eight blades with GOE 222 profiles; the largest diameter is 4.2 m, with a global pitch angle of 9°, and the smallest diameter is 2.2 m, with a global pitch angle of 20°. The base system and frame are covered by corrugated iron sheets.
The uniformity of the wind speed in the wind tunnel is ensured by the vane system, which is placed 2 m from the fan surface. Calibration is performed carefully to ensure an even wind speed and system stability. The wind speed was measured by a calibrated anemometer (Figure 2a). Finally, the wind tunnel produces a wind velocity profile like that of an axial fan, with an error of about <10%, and an error of >10% only occurs at right angles at the edges and in a small center circle space in the wind tunnel (Figure 2b). However, since the wind turbine has a circular cross−section and the wind generated from the wind tunnel is uniform in the area of interest, the wind tunnel used in this experiment can be considered appropriate.
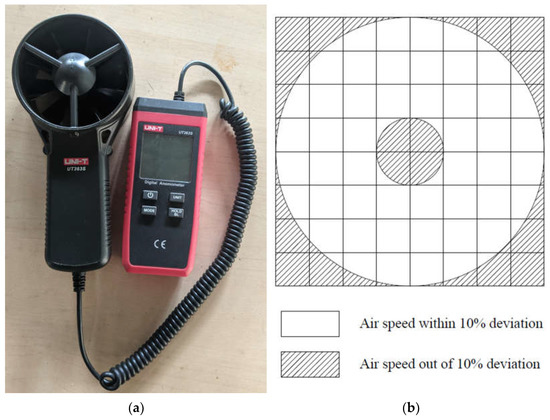
Figure 2.
Wind tunnel speed testing: (a) calibrated anemometer for measurement; (b) axial velocity profile of the wind tunnel.
The test model was set up as follows (Figure 3a): the wind tunnel fan was controlled by the inverter (1). The wind turbine rotated and generated an alternating current, which was then rectified by a diode bridge (3). Next, one output was connected to the negative terminal of the battery system (4) (including three 12 V batteries). The anode was left open. The multimeter (6) was pinned to the front of the diode bridge (3) to measure the frequency of the alternating current from the turbine (the pink dashed line), and to measure and check the output voltage.
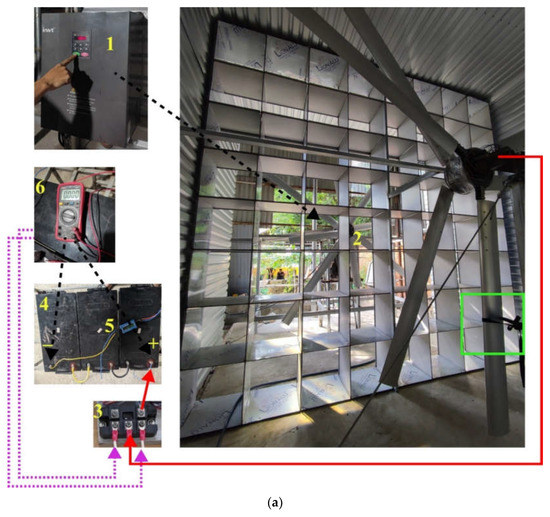
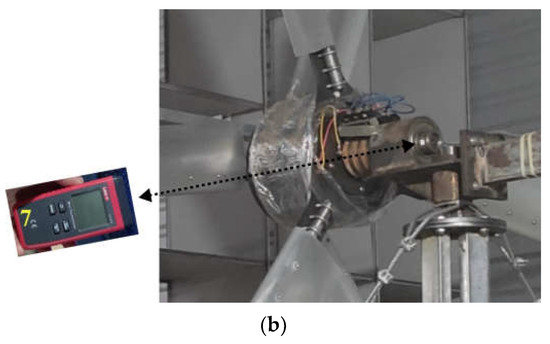
Figure 3.
Experimental setup of wind tunnel testing for a novel dual−stage wind turbine: (a) wind turbine capacity testing; (b) front−stage rotation speed testing.
To obtain the power generated from the turbine, the instantaneous values of power were measured at the moment the positive terminal was connected to the battery system while the turbine rotated steadily, and the average values were calculated. This approach limits the error in the implementation process caused by the turbine braking phenomenon when connected to the load (i.e., the battery).
The rotational speed parameters of the front stage can be measured by a tachometer (7) with an error of 0.02 rpm (Figure 3b). From the multimeter, the alternating current frequency is obtained when the turbine operates stably at a certain wind speed in the wind tunnel. This received frequency is denoted as . From the value of , the algebraic sum of the rotational speeds of the two stages is obtained according to the following formula:
The rotational speeds of the rear blades rr are calculated by the formula:
From the above data, the wind tunnel test results of the novel dual−stage wind turbine are provided in the following table (Table 2):

Table 2.
Wind tunnel experiment result for novel dual-stage wind turbine.
To confirm the efficiency of the dual−stage turbine according to the new invention compared to the single−stage turbine, the rear blade stage was locked with a lanyard, as shown in Figure 3a (highlighted in green). The above plan ensures objectivity; there is no need to remove the turbine components to test with another device. The single−stage turbine in this case is equivalent to the front stage of a two−stage turbine. Measurement then proceeded as described above to obtain results, which are shown in Table 3 and Figure 4:

Table 3.
Wind tunnel experimental results for a single−stage wind turbine.
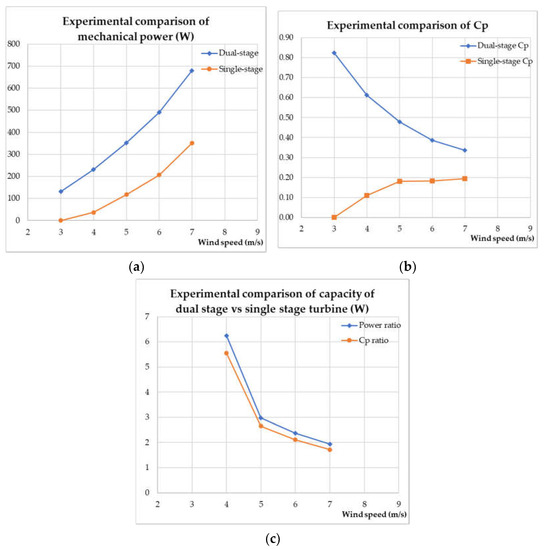
Figure 4.
Performance comparison charts between dual and single-stage wind turbines: (a) experimental comparison of mechanical power; (b) experimental comparison of Cp; (c) experimental comparison of power ratio and Cp ratio.
From the results obtained (Figure 4), it can be concluded that at lower speeds, the dual−stage wind turbine is more efficient than the single−stage turbine. The capacity of a dual−stage turbine is always 200% larger than that of a single−stage turbine at speeds below 7 m/s. In particular, at a wind speed of 3 m/s, the dual−stage wind turbine can start and produce power while the single−stage turbine does not work. These are good properties, proving the applicability of this type of turbine in small, windy areas. The dual−stage turbine also has a very high power coefficient at low speeds, with a peak of 0.82 at 3 m/s and a decreasing trend that approaches that of a single−stage turbine at higher speeds.
The torque of each rotor stage was not measured; a rope–dynamometer system will be applied in a later study to measure the torque of each rotor.
The maximum theoretical power coefficient for a dual−stage wind turbine was discovered by H. Sundararaju, K. H. Lo, R. Metcalfe, and S. S. Wang [6] to be 0.814. For our simple wind tunnel test, there was a 1% deviation when comparing our wind turbine power coefficient at 3 m/s to the maximum theoretical power coefficient. This discrepancy appears because of the small degree of unreliability of the measuring device and human factors.
This experiment also declares the characteristics of the patented dual−stage wind turbine. As it does not comprise the gear system, two rotors work only on aerodynamic forces. In other words, the turbine’s rotation speed at each stage is not intended to be controlled by auxiliary motors. As a consequence, at a higher wind speed, the front stage extracts most of the wind energy, less air flows through the rear stage, and the overall Cp approaches the Cp of a single−stage configuration.
The experimental result will be used as a method of validating the CFD model constructed later. During model validation, the turbulence intensity of the wind tunnel is often required to be declared, but we did not include it for two reasons:
- +
- The experiment was set up in a simple way, and at the moment it was performed, no turbulence−intensity measuring device could be bought in the country. However, as there are still new things to investigate for this patented wind turbine, this value will be investigated and declared in a future article.
- +
- When applying a turbulence intensity from 5–10%, we do not observe a severe difference in the CFD result (<2%).
4. Building CFD Models and Simulation Results
In this section, we identify a reasonable depth for the rotating domain, which can be used for small double−stage wind turbines with short distances between the two blade stages. Then, a standard numerical simulation model with usable parameters for equivalent double−stage turbines is published.
4.1. Investigate the Applicability of the MRF–Frozen Rotor Model for Simulation
Beginning with the fact that the distance between the blades of the turbine is about 250 mm (dimension B), for the CFD simulation, a maximum depth of about 200 mm, i.e., 0.12Rf, was constructed. A simulation in Ansys Fluent using an MRF (multiple reference frame) frozen rotor was built and used to evaluate the dependence of the NREL VI turbine shaft torque result [16] on the depth of rotation; then, the experimental data were used to analyze the results. Two turbulence models, k omega SST and Realizable k epsilon Scalable wall treatment (RKE), were used. The second spatial discretization scheme, the “Coupled” scheme for pressure–velocity coupling, was also used to ensure the accuracy of the problem.
The mesh was built mostly from polyhedral elements (Figure 5), which also reduced the computational cost compared to a tetrahedral mesh. Approximately 16 boundary layers (Figure 5d) were used in the meshing process to ensure the correct depiction of the lift and aerodynamic drag of the blades and to save on computational costs.
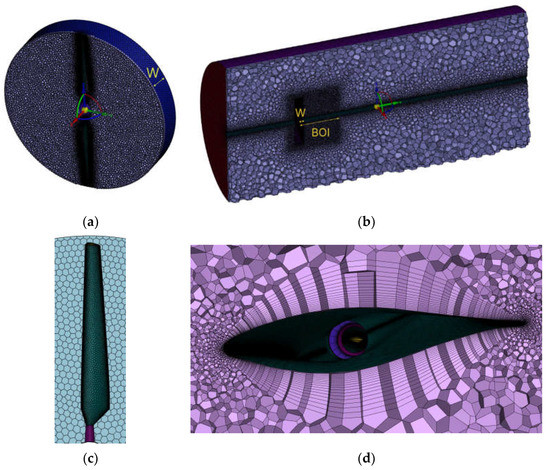
Figure 5.
Meshes of the domains for the NREL VI case using the MRF–frozen rotor model: (a) grid of the rotating domain; (b) grid of the static domain; (c) surface mesh of the blade.; (d) typical boundary layers.
Below are the results of the simulation (Table 4):

Table 4.
Simulation result for the NREL case using the MRF–frozen rotor model.
The purpose of this paper is not to calculate the most correct power of the NREL VI turbine, so the grid independence problem can be ignored; because the highest torque result obtained during the survey is 1019.1 N·m, the model reached an error of about 8% compared with the experimental result of 1106 N·m.
From the obtained results (Table 4 and Figure 6), it can be seen that the MRF−frozen rotor option is not suitable for the invented turbine, which has the depth of rotation domain of the front stage in the CFD of 0.12Rf. The reason is with this depth of rotation, the obtained results show large errors in comparison with the experiment.
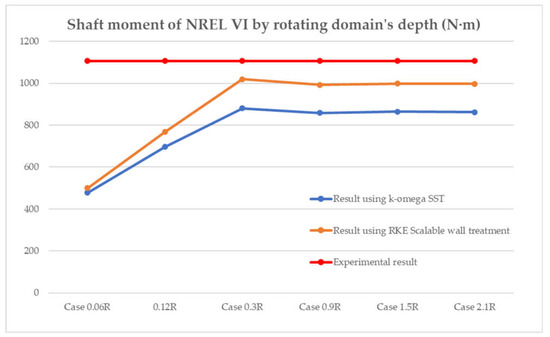
Figure 6.
CFD shaft moment of NREL VI by the rotating domain’s depth using the MRF–frozen rotor model (N·m).
If the double−stage turbine is later modified so that the distance between stages is ≥0.3Rf, the MRF−frozen rotor model can then be used for CFD calculations. This issue will be studied further in future papers. For turbines with a distance between stages of <0.3Rf, it is necessary to use another type of model.
4.2. Investigating the Applicability of the MRF–Sliding Mesh Model
Theoretically, beginning from the need for the simulation problem to investigate the power characteristics and the wind interaction between the two stages over time, it is be more suitable to use the MRF−sliding mesh model in Ansys Fluent than the MRF−frozen rotor.
In terms of numerical computation, the conclusion was made as in Section 4.1. In addition, when a transient simulation was conducted, the URANS (unsteady Reynolds−averaged Navier–Stokes), MRF−sliding mesh model with a k omega SST turbulence model for an NREL VI turbine was used with the same parameters as in the cases of 0.06Rf (m_0.2R on Figure 7) and 0.09Rf (m_0.3R on Figure 7).The second spatial discretization scheme, the PISO scheme for Pressure−Velocity Coupling (widely used and accuracy proven [17,18]) are also used. The torque results on the turbine shaft are 1138 N·m and 1141 N·m, respectively. These results are 2.9% and 3.2% larger, respectively, than the experimental results. This is an acceptable level of error.
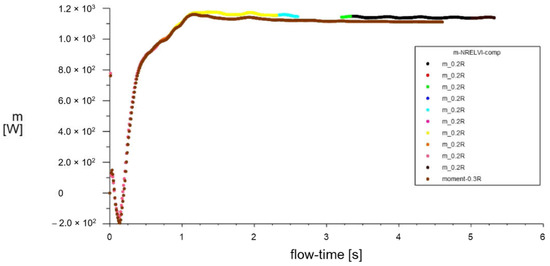
Figure 7.
CFD shaft moment of NREL VI turbine using URANS, MRF−sliding mesh for cases 0.06Rf and 0.09Rf.
Based on the above results, the conclusion can be drawn that if it is necessary to use a rotation domain with a small depth, the URANS model and an MRF–sliding mesh approach can be used instead of the MRF–frozen rotor model to achieve accurate simulation results. This is also the method applied in this article.
4.3. Building a Standard Simulation Model for a Dual−Stage Wind Turbine
Table 5 and Figure 8 show the main dimensions of the model used to simulate the novel dual−stage turbine in this research.

Table 5.
Dimensions used for simulation of a dual−stage wind turbine.
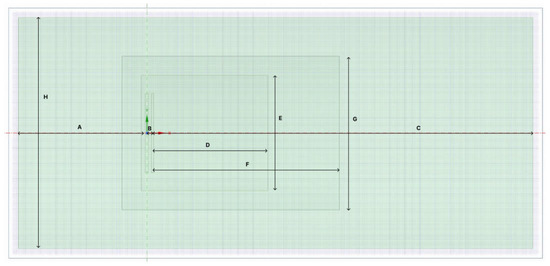
Figure 8.
Dimensions used for simulating a dual−stage wind turbine.
4.3.1. Grid Independence Problem
To save computational resources, the grid independence problem was considered based on the MRF model, using the dimensions shown in the Figure 8 above. The independent solution was then chosen for use in the URANS model. To ensure the objectivity of the grid independence problem, the “mesh smoothing ratio” between each case must be at least 1.3 [19] to be met. Just as in the case of NREL VI, polyhedral and prism mesh elements were used for this case. Around 8 to 22 boundary layers were used in the meshing process by case to research the correct depiction of the lift and aerodynamic drag of the blades. Table 6 shows the input conditions of the problem for the independent consideration of the mesh.

Table 6.
The input conditions of the problem for the independent consideration of the mesh.
The shaft mechanical capacity (W) was calculated in Ansys Fluent using the expression:
{torquef} × 0.1047198 × rf − {torquer} × 0.1047198 × rr
An illustration of the meshes used in this section is shown below (Figure 9):
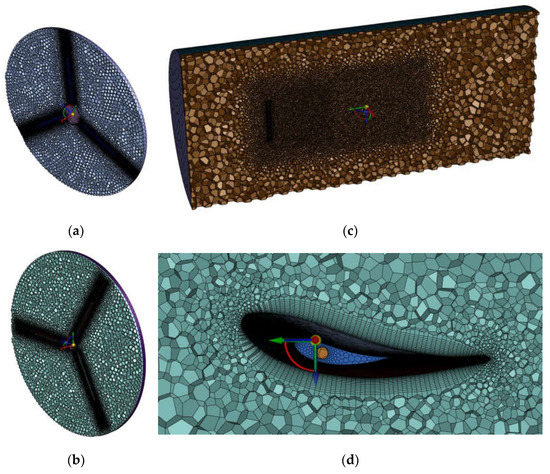
Figure 9.
Meshes of the domains for the dual−stage wind turbine case: (a) The grid of the front rotating domain—front rotor; (b) the grid of the rear rotating domain—rear rotor; (c) the grid of the static domain; (d) typical boundary layers.
Table 7 shows the main parameters and Figure 10 shows the results of the mechanical power on the shaft according to the calculation grids with increasing element numbers:

Table 7.
Mesh parameters and results for the independence study.
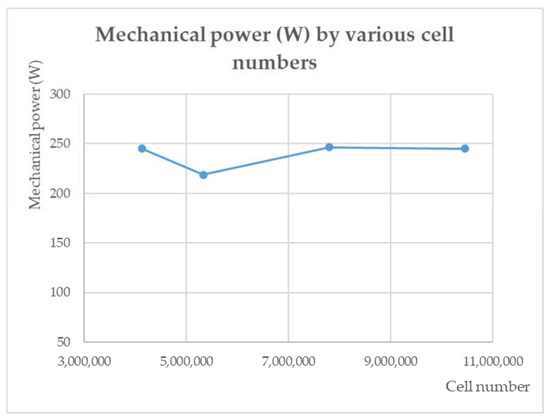
Figure 10.
Shaft mechanical power for various mesh cases.
It was found that the case of the third grid with 7,631,283 elements provided a result with a deviation of only 0.7% compared to the fourth grid, which had 10,449,976 elements. From here, increasing the number of elements will not produce significantly different results. It can be said that the solution is independent of the grid. Hence, the third grid will be used.
4.3.2. The Study of the Dual−Stage Wind Turbine
With the calculation mesh selected as above, a transient simulation in Ansys Fluent for the novel dual−stage wind turbine was conducted with input parameters and convergence parameters as per Table 8.

Table 8.
Input parameter and convergence criteria.
The timestep values in this paper were selected based on the following calculation formulas [20,21], and the smaller value was chosen as the reference:
However, in order to ensure the accuracy and convergence of the problem according to the requirements listed in Table 8, the real timestep used in the simulation was usually at least two times smaller than the results calculated using the formulas above.
Using a dual Intel(R) Xeon(R) CPU E5−2696 v4 with 128 GB RAM, each simulation lasted for more than 3 days. Table 9 below shows the mechanical shaft torque and turbine power results derived from the CFD simulation:

Table 9.
CFD torque and power results of the dual−stage wind turbine.
We see that there is a small difference between the simulation and experimental results, but these deviations are all less than 10% and are considered insignificant. Thus, we can conclude that this CFD simulation is suitable.
For the simulation results for the 3 m/s case, when the rear blades are locked, the experimental power obtained is 0 W. This is because the battery charging system has a charging voltage that must be greater than or equal to 36 V. At a speed of 3 m/s, the turbine does not generate this voltage, so the measured current is zero. However, from the CFD simulation, the power is 17.46 W, which proves more clearly that the turbine still has the mechanical work, but it is not enough to generate the voltage needed to charge the battery.
Another result that can be observed is that the turbine power changes periodically (shown in Figure 11). At the convergence value of the simulation, the turbine power tends to change continuously from a minimum value to a maximum value. It can be understood that each time the front rotor blades coincide with the rear rotor blades on a plane, there are significant decreases in thrust and torque for the rear stage and significant increases in thrust and torque for the front stage.
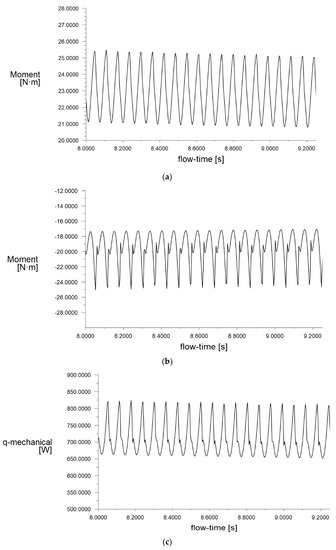
Figure 11.
Typical power and torque fluctuations of a dual−stage wind turbine: (a) Front rotor torque (N·m) at 7 m/s wind speed; (b) rear rotor torque (N·m) at 7 m/s wind speed; (c) turbine mechanical power fluctuation (W) at 7 m/s wind speed.
Observing the variation in torque with wind speed in Figure 12, it can be seen that the front stage suffers from a momentary fluctuation in the range of 18–19% compared to the mean. The algebraic value of the fluctuation is less than 5 N·m. The rear stage has a much larger mean torque fluctuation, which is about 43%, and the algebraic value of the oscillation is also larger than that of the front blades at all wind speeds.
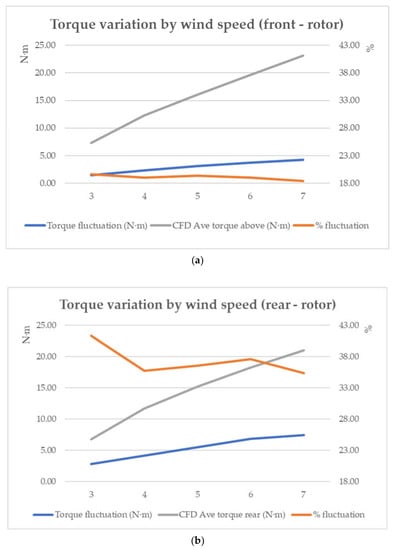
Figure 12.
Torque variations in front and rear rotors by wind speed: (a) shaft torque variation of the front rotor with wind tunnel wind speed; (b) shaft torque variation of the front rotor with wind tunnel wind speed.
This phenomenon requires a closer study of the process of designing of the novel dual−stage turbine, especially the issue of the fatigue load experienced by the rear blades, which is often overlooked.
4.3.3. The Study of the Blockage Effect on the CFD Result when Using the Real Topology of the Wind Tunnel
Another aspect to be concerned about is the effect of the blocking ratio (the ratio of the size of the wind turbine to wind tunnel section) [22,23] on the CFD result. The blockage ratios of the front, rear, and two−stage rotors are calculated to be: 3.75%, 3.87%, and 7.62%, respectively, for our novel dual−stage wind turbine.
Although the blockage ratio is significantly low, a simulation using the same meshing, boundary condition settings was still carried out to compare the results when applying a very large static domain when applying the real wind tunnel topology for the static domain (Figure 13).
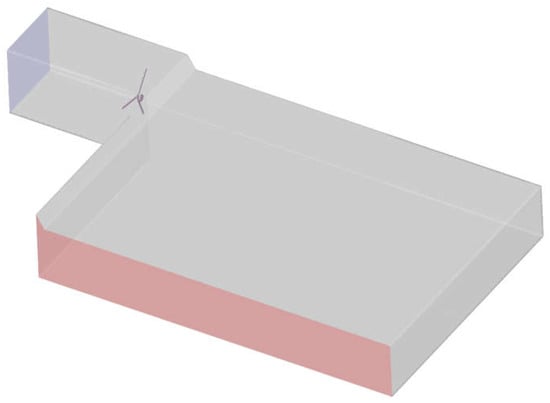
Figure 13.
Real wind tunnel topology for the experiment.
The main dimensions of the wind tunnel are as follows:
- + A length of 22 m from the center point of the wind turbine;
- + A roof height after the core windy space of 4 m;
- + The core windy section was described by Figure 2b.
The simulation result is as follows on Table 10:

Table 10.
Simulation result when applying the real topology of the wind tunnel.
We find that for each wind velocity, the wind turbine mechanical power for case B is always larger than case A.
This can be explained by the fact that in a narrower space, the wind flow passing through turbine stages cannot expand freely like in a larger space. In other words, the dynamic energy flux from the wind will not be significantly dissipated into the surrounding plenum. As a consequence, more energy can be extracted from the wind in case B than case A, and the quantitative assessment is shown in Figure 14.
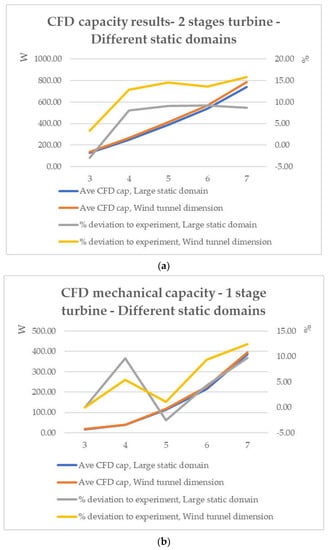
Figure 14.
CFD results for different static domains:(a) dual−stage wind turbine; (b) single−stage wind turbine.
Case B provides a more reliable result because it was properly set up with all experimental inputs, including the original topology of the wind tunnel. Although the obtained turbine power is always larger than in case A, the deviation from the experimental results is always <16% at the same time. This is an acceptable error, especially when we understand that the experimental results obtained are indirect results from the turbine’s output electrical power. The small electrical tool losses also partly cause the experimental results to be smaller than the real mechanical power output of the turbine. We still assume that these losses can be ignored. However, they can account for the fact that the results obtained from the CFD are larger than the experimental results.
Figure 15 shows us the typical wake structure at a wind speed of 7 m/s for case A and B. There is a deformation in wake structure for case B. But again, it is proved to be not that much affects on the result.
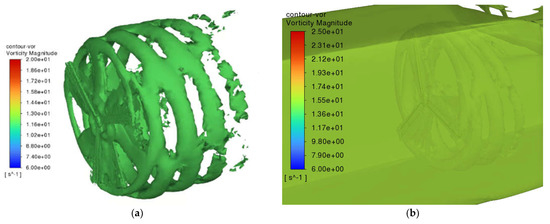
Figure 15.
Typical wake vortex structures of the novel dual−stage turbine at a wind speed of 7 m/s: (a) isosurface: vorticity = 12 s−1 for case A; (b) isosurface: vorticity = 16 s−1 for case B.
Finally, we can confirm that with the insignificant difference from the experiment, the simulation method used in this paper is reliable.
5. Conclusions
Using a wind tunnel experiment, this article proved the efficiency of a newly invented dual−stage turbine compared to a single−stage turbine.
- +
- At lower speeds, the newly invented dual−stage wind turbine is more efficient than a single−stage turbine. The capacity of a dual−stage turbine is always 200% larger than that of a single−stage turbine at speeds below 7 m/s, especially at a wind speed of 3 m/s; the dual−stage wind turbine can start and produce power, while the single−stage turbine does not work. These are good properties, proving the applicability of this type of turbine in low−speed windy areas.
- +
- The dual−stage turbine also has a very high power coefficient in low speed ranges, with a peak of 0.82 at 3 m/s, and tends to decrease gradually, approaching the properties of a single−stage turbine’s at higher speeds.
The proposed standard CFD model can be used for other double−stage turbines with the following conclusions:
- +
- The URANS model should be used if the distance between the two blade stages is <0.3Rf.
- +
- When using the URANS model, the depth of the rotation domain is chosen to be as small as possible, depending on the most protruding part of the turbine blade relative to the vertical plane.
- +
- The dual−stage wind turbine experiences changes over time in the force acting on the blade, torque, etc. Therefore, it is necessary to calculate the appropriate fatigue strength.
- +
- Further development can be made to complete the research in the following directions:
- +
- Implementing a plan to measure mechanical power directly without electrical conversion devices to reduce errors (generator conversion efficiency, actuator torque, rectifier loss, loss of transmission by wires, etc.). This option can be realized by applying a rope–dynamometer system.
- +
- Studying the phenomenon that the rear stage loses energy and rotates in the same direction as the front stage during turbine operation and discussing related parameters.
- +
- Studying the performance characteristics of the new, patented dual−stage turbine in connection with different types of loads.
Author Contributions
Investigation, writing and original draft preparation, D.H.L.; editing the original draft and article finalization, T.B.N.; setting up and carrying out the experiments, V.M.N. All authors have read and agreed to the published version of the manuscript.
Funding
This research was funded by the Ho Chi Minh City University of Technology (HCMUT), VNUHCM, under grant number BK−SDH−2070336.
Data Availability Statement
Data is available by contacting the authors directly.
Conflicts of Interest
The authors declare no conflict of interest. The funders had no role in the design of the study; in the collection, analyses, or interpretation of data; in the writing of the manuscript; or in the decision to publish the results.
References and Note
- Available online: http://nangluongvietnam.vn/news/vn/dien-hat-nhan-nang-luong-tai-tao/tong-tiem-nang-ky-thuat-dien-gio-tren-bo-va-ngoai-khoi-cua-viet-nam.html (accessed on 3 May 2023).
- Patent for Two-Stage Wind Turbine with Independent Rotating Shaft. No. 1-2021-03837; Industrial Property Official Gazette No. 418, part A—Volume 1. 27 January 2023.
- Newman, B. Multiple actuator-disc theory for wind turbines. J. Wind. Eng. Ind. Aerodyn. 1986, 24, 215–225. [Google Scholar] [CrossRef]
- Chantharasenawong, C.; Suwantragul, B.; Ruangwiset, A. Axial momentum theory for turbines with co-axial counter rotating rotors. In Proceedings of the Commemorative International Conference of the Occasion of the 4th Cycle Anniversary of KMUTT (SDSE2008), Bangkok, Thailand, 7–9 April 2009. [Google Scholar]
- Agrawal, V.V. Design and Aero-Acoustic Analysis of a Counter-Rotating Wind Turbine, Purdue University, 2010. Available online: https://docs.lib.purdue.edu/dissertations/AAI1489640/ (accessed on 11 June 2023).
- Sundararaju, H.; Lo, K.H.; Metcalfe, R.; Wang, S.S. Aerodynamics and CFD analysis of equal size dual-rotor wind turbine. J. Renew. Sustain. Energy 2017, 9, 043305. [Google Scholar] [CrossRef]
- Jung, S.N.; No, T.S.; Ryu, K.W. Aerodynamic performance prediction of a 30kW counter-rotating wind turbine system. Renew. Energy 2005, 30, 631–644. [Google Scholar] [CrossRef]
- Mitulet, L.-A.; Oprina, G.; Chihaia, R.-A.; Nicolaie, S.; Nedelcu, A.; Popescu, M. Wind Tunnel Testing for a New Experimental Model of Counter-rotating Wind Turbine. Procedia Eng. 2015, 100, 1141–1149. [Google Scholar] [CrossRef]
- Kumar, P.; Abraham, A.; Bensingh, R.; Ilangovan, S. Computational and Experimental analysis of a Counter-Rotating Wind Turbine system. J. Sci. Ind. Res. 2013, 72, 300–306. [Google Scholar]
- Zhiqiang, L.; Yunke, W.; Jie, H.; Zhihong, Z.; Wenqi, C. The study on performance and aerodynamics of micro counter-rotating HAWT. Energy 2018, 161, 939–954. [Google Scholar] [CrossRef]
- Rosenberg, A.; Selvaraj, S.; Sharma, A. A Novel Dual-Rotor Turbine for Increased Wind Energy Capture. J. Phys. Conf. Ser. 2014, 524, 012078. [Google Scholar] [CrossRef]
- Yin, F.F.; Chen, J.J.; Li, X.K.; Ye, Z.L.; Tang, W.; Shen, X.; Guo, X.J. A blade element momentum model for dual-rotor wind turbines considering inter-rotor velocity interferences. J. Phys. Conf. Ser. 2022, 2265, 042058. [Google Scholar] [CrossRef]
- Amr, M.; Ahmed, E.-B.; Nabil, M.; Ashraf, H.; Ahmed, E. CFD Simulation of Ducted Dual Rotor Wind Turbine for Small-Scale Applications. Am. Soc. Mech. Eng. 2019, 83532, V002T06A001. [Google Scholar] [CrossRef]
- Pinto, M.L.; Franzini, G.R.; Simos, A.N. A CFD analysis of NREL’s 5MW wind turbine in full and model scales. J. Ocean Eng. Mar. Energy 2020, 6, 211–220. [Google Scholar] [CrossRef]
- Qunfeng, L.; Chen, J.; Chen, J.; Qin, N.; Danao, L. Study of CFD simulation of a 3-D wind turbine. In Proceedings of the International Conference for Renewable Energy & Environment (ICMREE), Shanghai, China, 20–22 May 2011. [Google Scholar]
- Hand, M.M.; Simms, D.A.; Fingersh, L.J.; Jager, D.W.; Cotrell, J.R.; Schreck, S.; Larwood, S.M. Unsteady Aerodynamics Experiment Phase VI: Wind Tunnel Test Configurations and Available Data Campaigns; National Renewable Energy Laboratory (U.S.), United States, Department of Energy, Office of Scientific and Technical Information: Golden, CO, USA, 2001. [Google Scholar]
- Barton, I.E. Comparison of SIMPLE- and PISO-type algorithms for transient flows. Int. J. Numer. Methods Fluids 1998, 26, 459–483. [Google Scholar] [CrossRef]
- Otic, I, Cheng, X. PISO-SIMPLE-type algorithms for transient incompressible turbulent flows. Trans. Am. Nucl. Soc. 2010, 102, 634. [Google Scholar]
- Roache, P.J. Perspective: A method for uniform reporting of grid refinement studies. Trans. Am. Soc. Mech. Eng. J. Fluids Eng. 1994, 116, 405. [Google Scholar] [CrossRef]
- Wimshurst, A.; “Youtube”. 25 May 2020. Available online: https://www.youtube.com/watch?v=oa-xcE0_0UY&t=420s (accessed on 21 June 2023).
- ANSYS. Lecture 13: Transient Flow Modeling, ANSYS Fluent Getting Started; ANSYS: Canonsburg, PA, USA, 2020. [Google Scholar]
- Al-Obaidi, A.S.M.; Madivaanan, G. Investigation of the Blockage Correction to Improve the Accuracy of Taylor’s Low-Speed Wind Tunnel. J. Phys. Conf. Ser. 2022, 2222, 012008. [Google Scholar] [CrossRef]
- Eltayesh, A.; Hanna, M.B.; Castellani, F.; Huzayyin, A.S.; El-Batsh, H.M.; Burlando, M.; Becchetti, M. Effect of wind tunnel blockage on the performance of a horizontal axis wind turbine with different blade number. Energies 2019, 12, 1988. [Google Scholar] [CrossRef]
Disclaimer/Publisher’s Note: The statements, opinions and data contained in all publications are solely those of the individual author(s) and contributor(s) and not of MDPI and/or the editor(s). MDPI and/or the editor(s) disclaim responsibility for any injury to people or property resulting from any ideas, methods, instructions or products referred to in the content. |
© 2023 by the authors. Licensee MDPI, Basel, Switzerland. This article is an open access article distributed under the terms and conditions of the Creative Commons Attribution (CC BY) license (https://creativecommons.org/licenses/by/4.0/).
