
Safeguarding Biodiversity and Promoting Sustainable Development: Assessing the Energy–Water Nexus of San Andrés Island, Colombia


 ,
,
Abstract
:1. Introduction
2. Data Resource and Methods
2.1. Water and Energy Resources
2.2. Methods
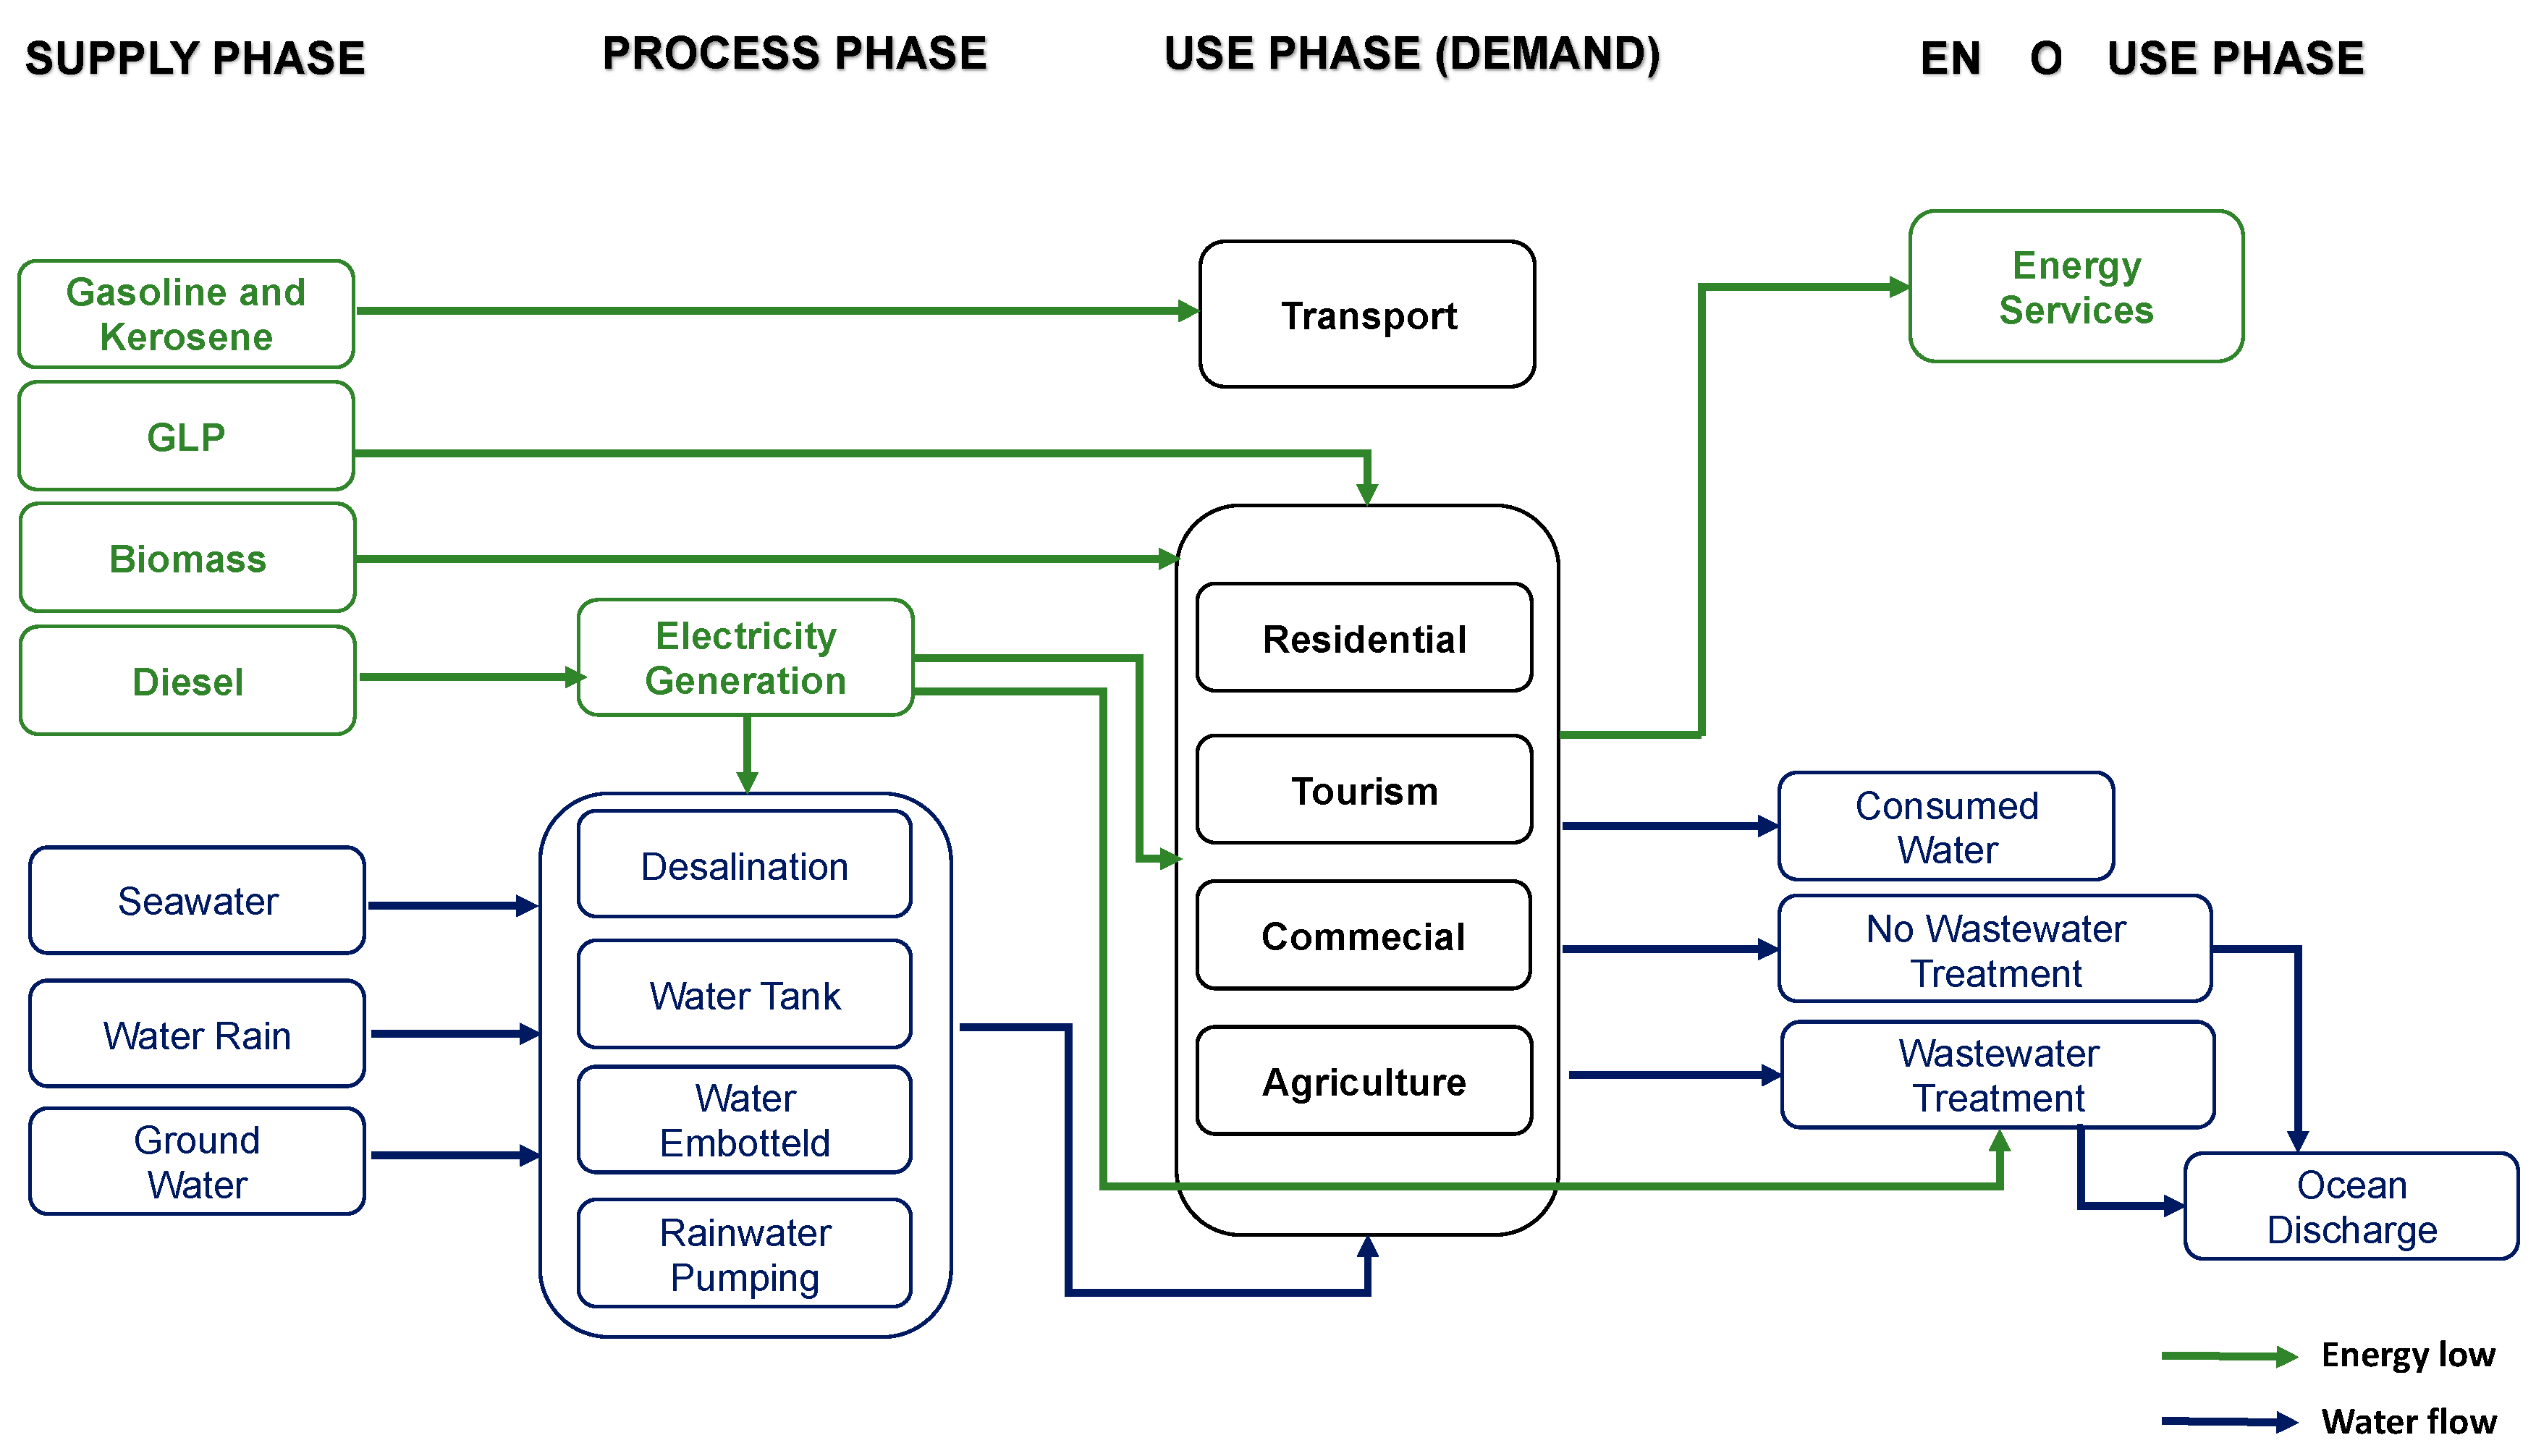
2.2.1. Supply Phase Analysis
2.2.2. Process and Demand Phase
2.2.3. Final Use Phase
2.3. Green House Gas (GHG) Emissions
3. Results
3.1. Water Results
3.2. Energy Results
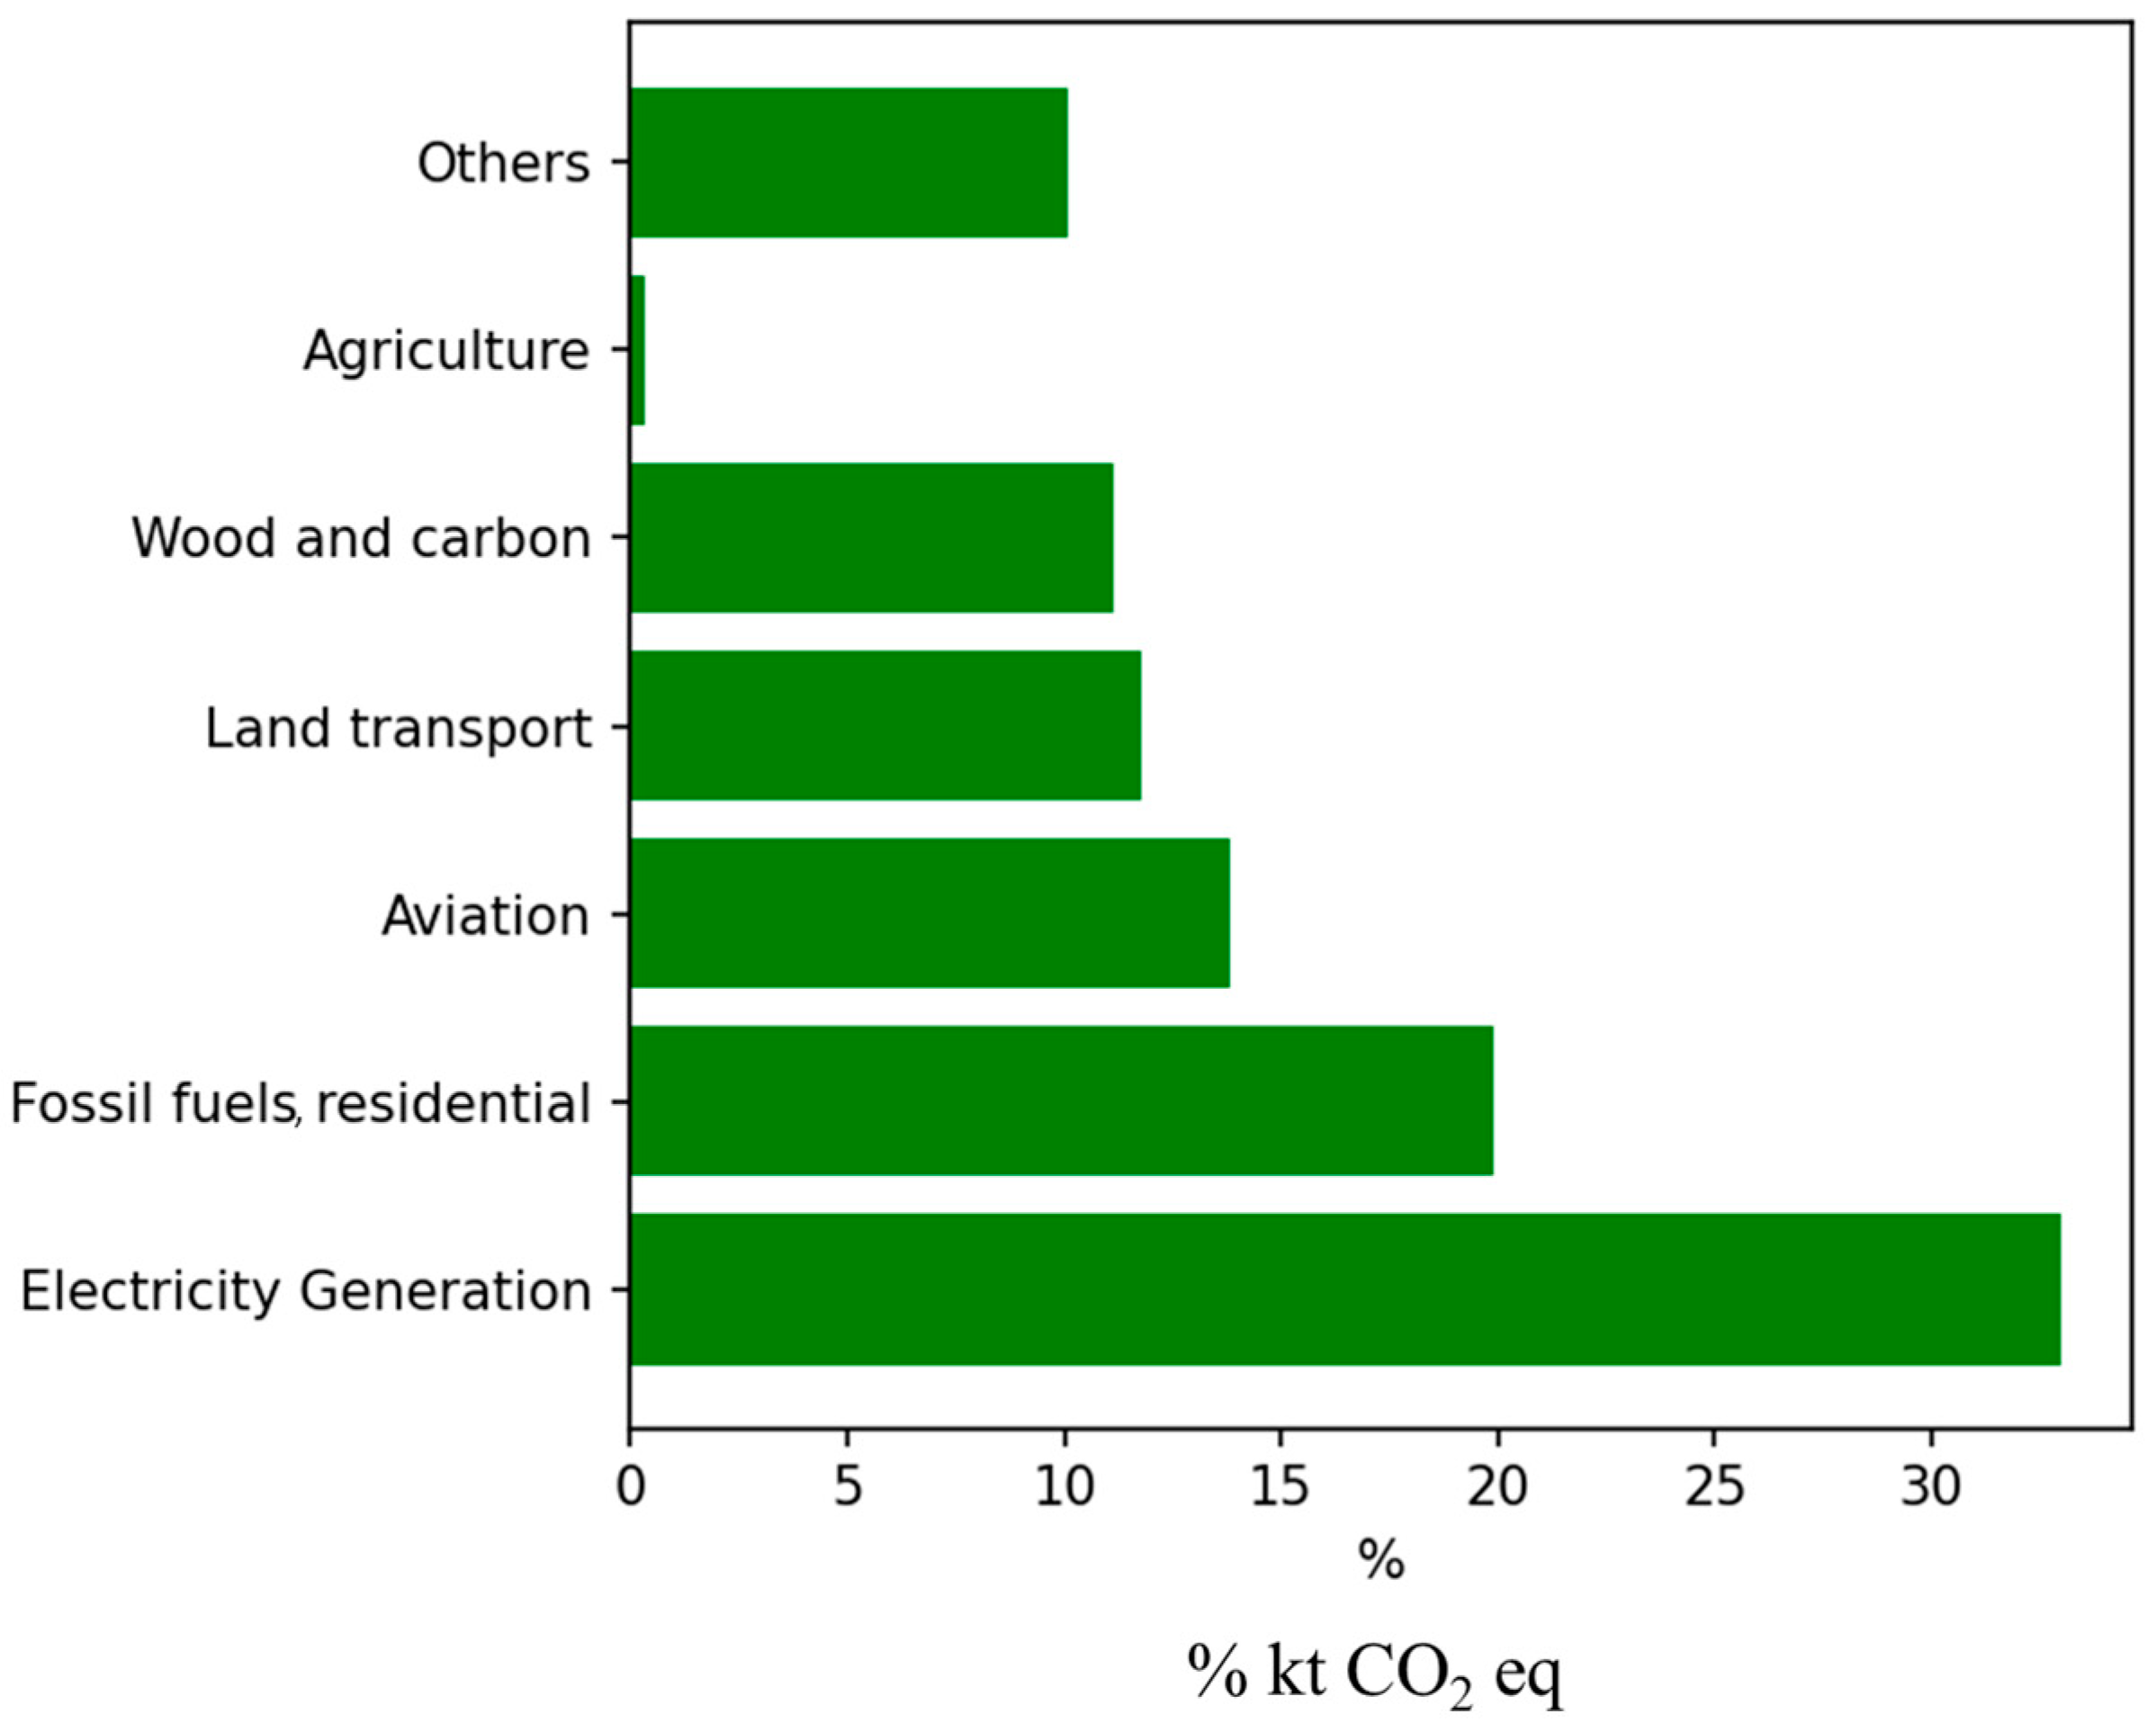
3.3. CO2 Emmisions
4. Policy Implications
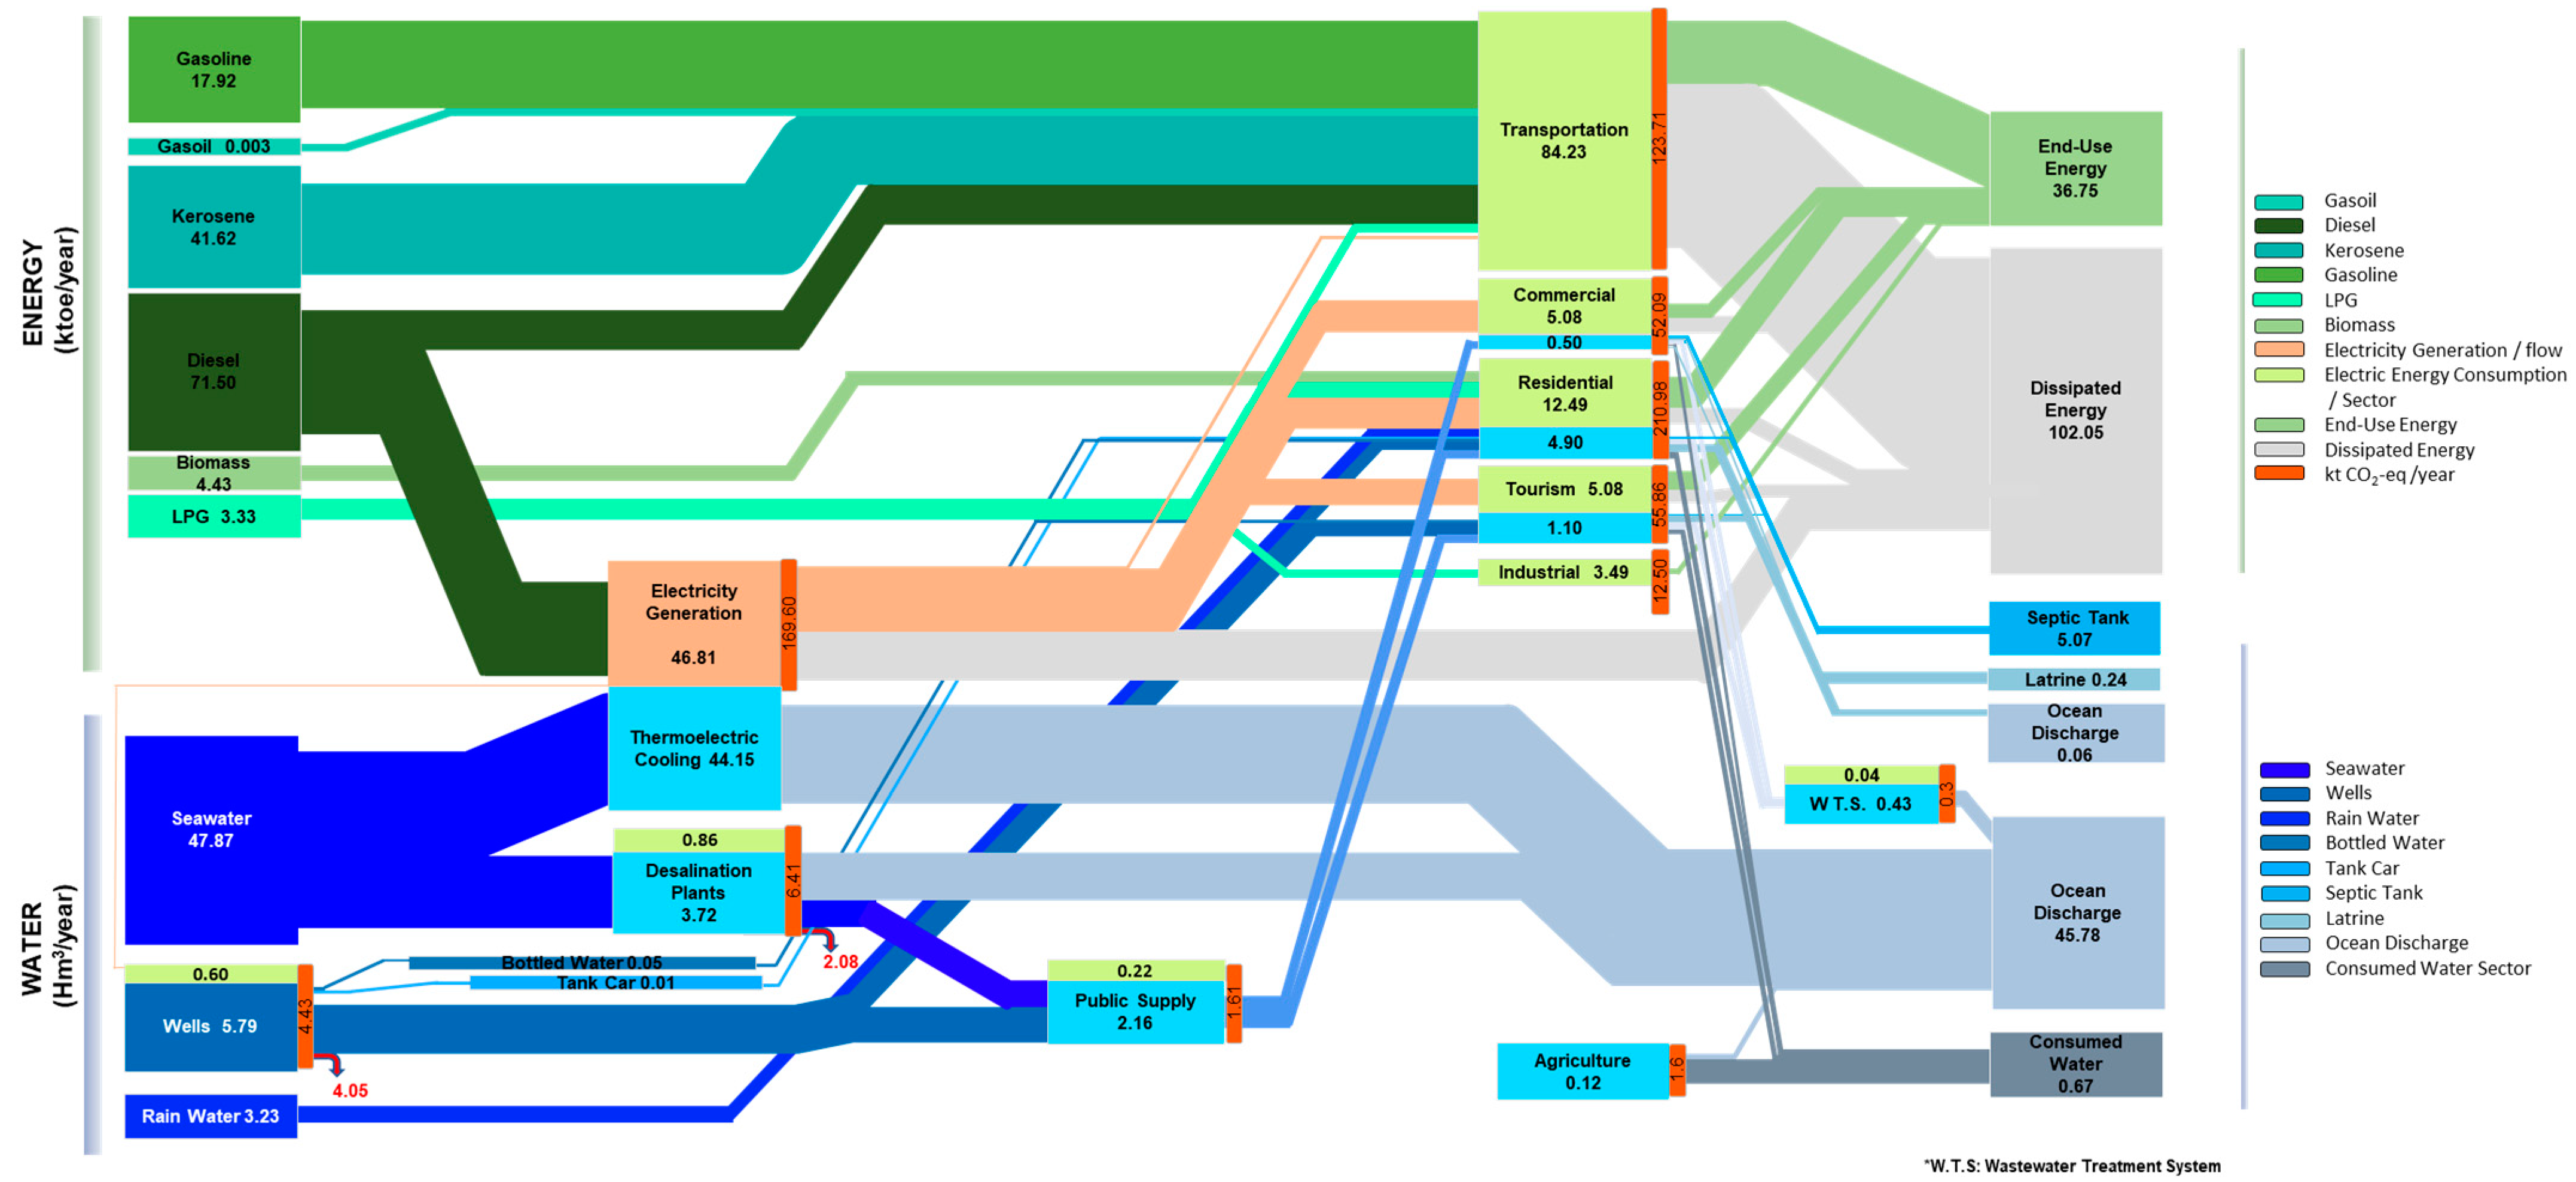
- Colombia aims to achieve a 30% share of non-conventional renewable energy in its energy matrix by the year 2030. Considering the specific case of San Andrés, where 46.81 ktoe/year of energy currently comes from fossil fuels (Figure 9), a 30% reduction in this reliance through the adoption of non-conventional renewable energies, such as solar and wind power, would result in a diesel reduction of 14.04 ktoe/year. This reduction in fossil fuel consumption would lead to a significant decrease in emissions, which would be, per our estimations, 28.19% lower than the current levels. The tourism and commercial sectors would be the most benefited, with 20.25% and 19.52% fewer emissions, respectively.
- In a more ambitious scenario (the transforming energy scenario, TES), considering 100% renewables, some interesting results were obtained as follows: The emissions from electricity generation would be reduced to 10.23 kt CO2-eq. The most benefited sectors would be commercial and tourism, with a reduction of 65.1% and 67.45% in their emissions, respectively.
- On the other hand, irrespective of the aforementioned scenarios, the implementation of a fiscal roadmap committed to promoting energy efficiency and reducing energy consumption by 10% through targeted tax incentives and regulations demonstrates positive outcomes. The case study revealed that applying this reduction strategy across the commercial, residential, tourism, and industrial sectors would result in a 3.68% decrease in emissions for the analyzed year, as illustrated in Figure 9.
- Finally, considering the projected operation of 600,000 electric vehicles in Colombia by the year 2030 and based on the census population, it is estimated that San Andrés would require 755 electric vehicles to meet the country’s commitments. According to [32], San Andrés had a total of 26,436 vehicles of various types in use during the study year, indicating that 755 electric vehicles would only represent 3%. However, considering a more ambitious scenario, such as the TES model, and given that San Andrés is a biosphere reserve region, the implementation of 20% electric mobility would result in a 2.5% increase in emissions. This is primarily due to the island’s heavy reliance on diesel power plants for electricity generation in addition to losses in electric transport. If San Andrés intends to establish an electric vehicle fleet with these characteristics, it would be necessary to install renewable energy sources representing at least 10.4% of the total generation capacity to ensure an 80% daily charging availability for the electric vehicles.
- Establishing regulations and standards for the sustainable development of tourism, promoting environmentally friendly practices, and engaging local communities in decision-making processes.
- Encouraging research and development activities and investing in project financing, pilots, and programs that foster regional innovation. This will facilitate the development of efficient and environmentally friendly solutions tailored to local needs.
- Prioritizing the development of drinking water and sanitation infrastructure, particularly in improving wastewater treatment and ensuring proper management of septic tanks. This is essential for reducing pollution and preserving water resources. Strict regulations should be enforced to govern the proper disposal of wastewater.
5. Discussion
6. Conclusions
Author Contributions
Funding
Data Availability Statement
Conflicts of Interest
References
- United Nations COP 21 | UNFCCC. Available online: https://unfccc.int/event/cop-21 (accessed on 16 May 2023).
- Cauchi, J.P.; Moncada, S.; Bambrick, H.; Correa-Velez, I. Coping with Environmental Hazards and Shocks in Kiribati: Experiences of Climate Change by Atoll Communities in the Equatorial Pacific. Environ. Dev. 2021, 37, 100549. [Google Scholar] [CrossRef]
- Gavio, B.; Palmer-Cantillo, S.; Mancera, J.E. Historical Analysis (2000–2005) of the Coastal Water Quality in San Andrés Island, SeaFlower Biosphere Reserve, Caribbean Colombia. Mar. Pollut. Bull. 2010, 60, 1018–1030. [Google Scholar] [CrossRef] [PubMed]
- How Fiji Is Affected by Climate Change—Cop23. Available online: https://cop23.com.fj/fiji-and-the-pacific/how-fiji-is-affected-by-climate-change/ (accessed on 21 October 2021).
- Baine, M. Special Issue on the Galapagos Islands and the San Andres Archipelago. Ocean Coast. Manag. 2007, 50, 145–147. [Google Scholar] [CrossRef]
- Dueñas, A.; Jiménez-Uzcátegui, G.; Bosker, T. The Effects of Climate Change on Wildlife Biodiversity of the Galapagos Islands. Clim. Chang. Ecol. 2021, 2, 100026. [Google Scholar] [CrossRef]
- Chen, I.C.; Wang, Y.H.; Lin, W.; Ma, H.W. Assessing the Risk of the Food-Energy-Water Nexus of Urban Metabolism: A Case Study of Kinmen Island, Taiwan. Ecol. Indic. 2020, 110, 105861. [Google Scholar] [CrossRef]
- Triantafyllou, P.; Koroneos, C.; Kondili, E.; Kollas, P.; Zafirakis, D.; Ktenidis, P.; Kaldellis, J.K. Optimum Green Energy Solution to Address the Remote Islands’ Water-Energy Nexus: The Case Study of Nisyros Island. Heliyon 2021, 7, e07838. [Google Scholar] [CrossRef] [PubMed]
- Li, R.; Zhao, R.; Xie, Z.; Xiao, L.; Chuai, X.; Feng, M.; Zhang, H.; Luo, H. Water–Energy–Carbon Nexus at Campus Scale: Case of North China University of Water Resources and Electric Power. Energy Policy 2022, 166, 113001. [Google Scholar] [CrossRef]
- Calise, F.; Cappiello, F.L.; Vicidomini, M.; Petrakopoulou-Robinson, F. Water-Energy Nexus: A Thermoeconomic Analysis of Polygeneration Systems for Small Mediterranean Islands. Energy Convers. Manag. 2020, 220, 113043. [Google Scholar] [CrossRef]
- Eckstein, D.; Künzel, V.; Winges, M. Índice de Riesgo Climático Global 2020: Resumen. Available online: www.germanwatch.org/en/cri (accessed on 14 October 2022).
- Honduras, Zona Cero del Cambio Climático en América Latina | Sociedad | EL PAÍS. Available online: https://elpais.com/sociedad/2020/02/08/actualidad/1581121631_785715.html (accessed on 22 October 2021).
- Departamentos de Colombia y Sus Capitales—Colombia. Available online: https://elturismoencolombia.com/turismo-colombia/departamentos-colombia-capitales/ (accessed on 13 October 2022).
- Portz, L.; Manzolli, R.P.; Villate-Daza, D.A.; Fontán-Bouzas, Á. Where Does Marine Litter Hide? The Providencia and Santa Catalina Island Problem, SEAFLOWER Reserve (Colombia). Sci. Total Environ. 2022, 813, 151878. [Google Scholar] [CrossRef] [PubMed]
- Iregui Parra, P.M.; Perez Amaya, N. La Protección del Seaflower Como Materialización de los Derechos al Patrimonio Histórico y Cultural y al Medioambiente Sano. In Intereses de Colombia en el Mar: Reflexiones para la Construcción del país Marítimo; Escuela Superior de Guerra: Bogotá, Colombia, 2018; pp. 201–228. [Google Scholar]
- Zonas No Interconectadas|CREG. Available online: https://creg.gov.co/publicaciones/7821/zonas-no-interconectadas/ (accessed on 10 October 2022).
- Anuario Estadístico 2018. Secretaría de Planeación Departamental. Available online: https://www.sanandres.gov.co/index.php/gestion/planeacion/plan-de-desarollo/estadisticas/10909-anuario-estadistico-2018/file (accessed on 16 November 2022).
- Ministry of Mines and Energy. Law 1715 of 2014; Ministry of Mines and Energy: Bogotá, Colombia, 2014.
- Ministry of Mines and Energy. Law 2099 of 2021; Ministry of Mines and Energy: Bogotá, Colombia, 2021.
- Agencia UNAL. Urge Transición Energética Para San Andrés, Providencia y Santa Catalina. Available online: http://agenciadenoticias.unal.edu.co/detalle/urge-transicion-energetica-para-san-andres-providencia-y-santa-catalina (accessed on 13 October 2022).
- James Cruz, J.L.; Barrios Torrejano, D.J. Valoración Del Uso Del Agua En La Isla de San Andrés: Turistas, Hoteles y Viviendas Turísticas. PASOS Rev. Tur. Patrim. Cult. 2020, 18, 293–308. [Google Scholar] [CrossRef]
- CDM Smith—INGESAM/FINDETER Plan Director del Recurso Hídrico de San Andres-PDRH. Available online: https://observatorio.coralina.gov.co/index.php/es/publicaciones/item/477-plan-director-del-recurso-hidrico-de-san-andres-pdrh (accessed on 27 April 2023).
- Guerrero Jiménez, T. Crisis del Agua, Turismo y Variabilidad Climática en La Isla de San Andrés. Tur. Soc. 2019, 26, 127–154. [Google Scholar] [CrossRef]
- Gil, J.W.I.; Chaparro, F.; Jiménez, J.D.R.; Quiroga, H.G.; Fabian, C.L. Acuíferos de San Andrés Evaluación de La Problemática Ambiental. Available online: https://santototunja.edu.co/cong/images/memorias2016/31.%20Acu%C3%ADferos%20de%20San%20Andr%C3%A9s%20Evaluaci%C3%B3n%20de%20la%20Problem%C3%A1tica%20Ambiental..pdf (accessed on 20 June 2022).
- Marítima Terranova. Distancias Entre Puertos Cercanos a San Andres Islas. Available online: https://maritimaterranova.com/distancia-entre-puertos-cercanos-a-san-andres-islas/ (accessed on 17 October 2022).
- Gobierno de Colombia Encuesta de Hábitat y Usos Socioeconómicos, 2019—Archipiélago de San Andrés, Providencia y Santa Catalina. Available online: https://www.dane.gov.co/index.php/estadisticas-por-tema/informacion-regional/encuesta-de-habitat-y-usos-socioeconomicos-2019-archipielago-de-san-andres-providencia-y-santa-catalina (accessed on 14 October 2022).
- Wilmer Pinto Parque Eólico Offshore Para la Isla de San Andrés. Available online: https://virtual.urbe.edu/tesispub/0106785/ (accessed on 16 November 2022).
- Superintendencia de Servicios Públicos Domiciliarios Evaluación Integral de Prestadores Sociedad Productora de Energía de San Andrés y Providencia S.A. E.S.P. Available online: https://www.superservicios.gov.co/sites/default/files/inline-files/evaluacion_integral_de_prestadores_sopesa_2017.pdf (accessed on 17 March 2023).
- Plan de Acción Indicativo de Eficiencia Energética 2017–2022. Available online: https://www1.upme.gov.co/DemandaEnergetica/MarcoNormatividad/PAI_PROURE_2017-2022.pdf (accessed on 7 June 2023).
- Silvera, O.C.; Chamorro, M.V.; Ochoa, G.V. Wind and Solar Resource Assessment and Prediction Using Artificial Neural Network and Semi-Empirical Model: Case Study of the Colombian Caribbean Region. Heliyon 2021, 7, e07959. [Google Scholar] [CrossRef] [PubMed]
- Asociación Nacional de Centros de Diagnóstico Automotor Cifras de la RTM y EC en Colombia. Available online: https://www.aso-cda.org/wp-content/uploads/2020/05/BOLETIN-CIFRAS-CONSOLIDADO-2019-ASO-CDA.pdf (accessed on 12 February 2023).
- Comisión de Regulación de Energías y Gas. Gobierno de Colombia. Propuesta de Metodología para la Remuneración de las Actividades de Distribución y Comercialización Minorista de GLP en El Archipiélago de San Andrés, Providencia y Santa Catalina. Available online: https://gestornormativo.creg.gov.co/gestor/entorno/docs/resolucion_creg_0133_2019.htm (accessed on 17 November 2022).
- Asociación Nacional de Centros de Diagnóstico Automotor Boletín Estadístico Consolidado 2020. Available online: https://www.aso-cda.org/wp-content/uploads/2021/01/BOLETIN-CIFRAS-CONSOLIDADO-2020.pdf (accessed on 10 June 2022).
- Rodríguez-Urrego, D.; Cañadillas-Ramallo, D.; González-Díaz, B.; Guerrero-Lemus, R. Analysis of the Water-Energy Nexus Applied to an Insular System: Case Study of Tenerife. Sustainability 2022, 14, 1653. [Google Scholar] [CrossRef]
- Nair, S.; Timms, W. Freshwater Footprint of Fossil Fuel Production and Thermal Electricity Generation and Water Stresses across the National Electricity Market (NEM) Region of Australia. J. Clean. Prod. 2020, 267, 122085. [Google Scholar] [CrossRef]
- Ministerio de Minas y Energía. Gobierno de Colombia. Integración de las Energías Renovables No Convencionales en Colombia; Unidad de Planeación Minero Energética: Bogotá, Colombia, 2015; ISBN 978-958-8363-26-4. [Google Scholar]
- Ramón Gómez, J.; Afanador, J.E.; Luis Rodríguez, J. Hacia la Sostenibilidad Eléctrica en El Archipiélago de San Andrés, Providencia y Santa Catalina, Colombia: Análisis de Alternativas. Available online: https://publications.iadb.org/es/hacia-la-sostenibilidad-electrica-en-el-archipielago-de-san-andres-providencia-y-santa-catalina (accessed on 27 March 2023).
- Luque, R. Christian Edward Proposal of Energy Alternative for the Island of San Andrés, an Approach Based on Resilience and Sustainability Criteria. Available online: https://repositorio.uniandes.edu.co/handle/1992/54461 (accessed on 4 June 2022).
- Chica-Olmo, J.; Sánchez, A.; Sepúlveda-Murillo, F.H. Assessing Colombia’s Policy of Socio-Economic Stratification: An Intra-City Study of Self-Reported Quality of Life. Cities 2020, 97, 102560. [Google Scholar] [CrossRef]
- Departamento Administrativo Nacional de Estadística (DANE). La Heterogeneidad de los. Caracterización de la Estratificación Socioecónomica en las Principales Ciudades de Colombia a Partir del CNPV 2018; Departamento Administrativo Nacional de Estadística (DANE): Bogotá, Colombia, 2022; ISBN 978-958-5437-23-4. [Google Scholar]
- Proactiva Aguas del Archipielago, S.A. Plan de Saneamiento y Manejo de Vertimientos Para la Isla de San Andrés. Available online: https://proactivasai.com/areasocial/descargas/Plan%20de%20Saneamiento%20y%20Manejo%20de%20Vertimientos.pdf (accessed on 17 November 2022).
- Así Se Energiza San Andrés y Providencia—Energía Limpia para Colombia. Available online: https://energialimpia.co/asi-se-energiza-san-andres-y-providencia/ (accessed on 24 May 2023).
- IDEAM Inventario Nacional y Departamental de Gases de Efecto Invernadero. Available online: http://www.cambioclimatico.gov.co/inventario-nacional-de-gases-efecto-invernadero (accessed on 17 November 2022).
- Ministry of Mines and Energy. Law 1964 of 2019; Ministry of Mines and Energy: Bogotá, Colombia, 2019.
- Mehrjerdi, H. Modeling and Optimization of an Island Water-Energy Nexus Powered by a Hybrid Solar-Wind Renewable System. Energy 2020, 197, 117217. [Google Scholar] [CrossRef]
- Ambientum Ta’u, La Isla de Samoa Americana Que Trabaja al 100% Con Energía Solar—Ambientum Portal Lider Medioambiente. Available online: https://www.ambientum.com/ambientum/energia/tau-la-isla-de-samoa-americana-que-trabaja-al-100-con-energia-solar.asp (accessed on 27 May 2023).


| Source Type | Share (%) |
|---|---|
| Seawater | 38.09 |
| Rainwater | 34.89 |
| Groundwater | 26.93 |
| Sector (Energy Consumption) | Specific Consumption (kWh/m3) |
|---|---|
| Public services | 1.17 |
| Water treatment | 1.20 |
| Desalination | 2.70 |
| Wells | 1.20 |
Disclaimer/Publisher’s Note: The statements, opinions and data contained in all publications are solely those of the individual author(s) and contributor(s) and not of MDPI and/or the editor(s). MDPI and/or the editor(s) disclaim responsibility for any injury to people or property resulting from any ideas, methods, instructions or products referred to in the content. |
© 2023 by the authors. Licensee MDPI, Basel, Switzerland. This article is an open access article distributed under the terms and conditions of the Creative Commons Attribution (CC BY) license (https://creativecommons.org/licenses/by/4.0/).
Share and Cite
Rodríguez-Urrego, D.; González-Díaz, B.; Rodríguez-Urrego, L.; García-Afonso, O.; Guerrero-Lemus, R. Safeguarding Biodiversity and Promoting Sustainable Development: Assessing the Energy–Water Nexus of San Andrés Island, Colombia. Energies 2023, 16, 5448. https://doi.org/10.3390/en16145448
Rodríguez-Urrego D, González-Díaz B, Rodríguez-Urrego L, García-Afonso O, Guerrero-Lemus R. Safeguarding Biodiversity and Promoting Sustainable Development: Assessing the Energy–Water Nexus of San Andrés Island, Colombia. Energies. 2023; 16(14):5448. https://doi.org/10.3390/en16145448
Chicago/Turabian StyleRodríguez-Urrego, Daniella, Benjamín González-Díaz, Leonardo Rodríguez-Urrego, Oscar García-Afonso, and Ricardo Guerrero-Lemus. 2023. "Safeguarding Biodiversity and Promoting Sustainable Development: Assessing the Energy–Water Nexus of San Andrés Island, Colombia" Energies 16, no. 14: 5448. https://doi.org/10.3390/en16145448
APA StyleRodríguez-Urrego, D., González-Díaz, B., Rodríguez-Urrego, L., García-Afonso, O., & Guerrero-Lemus, R. (2023). Safeguarding Biodiversity and Promoting Sustainable Development: Assessing the Energy–Water Nexus of San Andrés Island, Colombia. Energies, 16(14), 5448. https://doi.org/10.3390/en16145448