1. Introduction
Managing the process of the sustainable development of Russian energy companies is becoming particularly relevant in difficult economic conditions due to the presence of significant risk factors and sanctions imposed by Western countries against Russia. In this regard, the identification of problems in the functioning of Russian energy companies and the methodology for assessing the risks of sustainable development have considerable practical significance. Due to the high importance of the activities of energy companies for the economic development of the country, it is advisable to use modified and integrated approaches using methods of system analysis and integral ranking for data analysis, along with standard approaches [
1,
2,
3]. Under these conditions, it is unacceptable to use barometric methods that are based on forecasting the simulated system based on the most important indicators measured at the present time. The use of barometric methods makes it possible to use several key parameters of the analyzed process, which are statistical indicators of the regularity of the further development of a dynamic process [
4,
5].
This article is devoted to the development and justification of a multi-stage ranking and indexing system for leading companies in the most important energy production sectors of the Russian economy—the oil and gas industry and the electric power industry. The willingness to finance companies for the purposes of their long-term development, from the point of view of the investor, the state, the owner, contractors and partners, inevitably faces the problem of the comprehensive assessment and selection of companies that are reliable and promising in terms of obtaining material returns (profits) and strengthening the structure of processing raw materials for the purpose of improving the quality of life in Russia [
6,
7].
The structure of the ownership forms of the largest oil and gas and energy companies in Russia is presented in
Table 1.
The largest state-owned oil and gas companies include Rosneft, with a 70.5% share, and Gazprom, with a 50.2% state share. In the companies Lukoil, Novatek and Surgutneftegaz, the main shareholders have management roles in the companies. Inter RAO and Rosseti energy holdings are the largest state-owned energy companies in the country.
The approach described in this article relates to barometric methods for assessing the sustainability of Russian energy companies, their current status and economic trends. The application of barometric methods to the data reports in the balance sheets of companies necessitates the identification of the most important groups of indicators and the formation of a step-by-step algorithm for aggregating data and calculating the integral index. When constructing this strategy, prospects for the implementation of improvements, including the use of a mathematical apparatus incorporating a high-speed algorithm for software data processing, were evaluated. The ranking of companies is necessary to determine the directions and vectors for stimulating the investment activity of high-tech, innovative projects implemented by the government in the oil and gas sector and the electric power industry. The monitoring of the innovative activity of energy companies was carried out by the authors on the basis of an integrated approach, including the aggregation of multidimensional data and the clustering of companies into leading groups [
8,
9].
The selection is based on the rating of the assets of energy industry enterprises’ [
10,
11] revenue, balance sheet totals, net profit, equity capital and ratio of equity to debt. However, it should be noted that there is a significant imbalance in the absolute (the amount of funds, the amount of net profit, proceeds from sales) and relative indicators of the capital structure and a significant dependence on external sources of financing that create the maximum risk. According to the authors, the most important relative indicator is the ratio of the company’s equity to debt capital, and the main problem is to find an index for ranking fulfillment and perform an annual assessment of the risk of maintaining stability, which has not been previously considered in the scientific literature.
The methodology for the analysis and integral assessment of the financial condition of large companies in the oil and gas and electric power sectors of the Russian economy is under development [
12,
13,
14]. On the one hand, energy industries seem to be very conservative, and on the other hand, conservatism in developing new business lines is a process of risk stabilization [
15,
16]. The state of the technical infrastructure at individual enterprises is the highest priority for the long-term development of large energy companies [
17,
18,
19,
20,
21,
22].
The main activities in the management of oil and gas companies in the modern world are the reduction in and optimization of equipment repair costs, the need to allocate significant funds for the introduction of innovative, environmentally friendly and improved technologies and the replacement of some equipment using the latest materials that do not require complex disposal processes. To analyze this problem, the authors evaluated the balance of the main indicators of the reference group of companies in the oil and gas and energy industries. The reasons for the problems in high-tech Russian exports, according to many foreign analysts, are the lack of “a well-founded model of working on global technological digital platforms and creating complex technological products by the most important industry companies”. At the same time, the statistics of company reports demonstrate the counterarguments of the problem—the improvement of the financial situation of the largest industry companies according to the most important indicators of financial analysis.
The authors used the publicly available financial statements of companies (balance sheets and profit and loss statements) as initial information for a comprehensive assessment and integral ranking.
The purpose of this study was to develop a methodology for the complex analysis and integral ranking of Russian companies in high-tech sectors of the economy according to the degree of the reliability of their development in terms of key financial indicators.
The objectives of this study were to develop a mechanism, model and mathematical method for implementing sub-index calculations for rating energy and oil and gas companies in Russia as a basis for business development, reducing volatility based on modeling sub-indexes and a hierarchical rating system.
The subjects of this study are cluster and indicator models that allow the assessment of the degree of innovative development of Russian energy companies.
Hypothesis—The proposed approach will allow us to develop an integral rating methodology that takes into account the influence of the interval volatility of the financial indicators of leading companies using non-smooth analysis.
For companies with low total assets and revenue, this approach needs to be adapted by using weighting coefficients and the linear scaling method in the group.
The tested data are from large companies in the oil and gas industry (PJSC Gazprom [
23,
24], PJSC Lukoil [
25,
26], PJSC Rosneft [
27,
28], PJSC Novatek [
29,
30,
31], PJSC Tatneft [
32,
33], PJSC Surgutneftegaz) [
34] and the electric power industry (PJSC Inter Rao [
35,
36], PJSC Rosseti [
37,
38]).
2. Data and Methods
When evaluating multi-criteria solutions, a problem that arises is choosing an integral indicator, which entails constructing optimization models and summing them into a single criterion based on the calculation of a weighting indicator. At the same time, the intermediate stage of modeling and optimization contains high noise that prevents the justification of the identification of the research goal. Recently, more and more attention has been paid to the structural and problem-oriented analysis of the contribution of factor features to the effectiveness of the integral index based on a systematic hierarchical approach.
To unify the units of measurement, all indicators are replaced by normalized analogs, which are formed by linear scaling. Since the scale and units of measurement of various indicators for companies may be different, the linear scaling method is used for each indicator of the companies, and its normalized analog is recalculated:
Thus, the minimum value of this indicator is 0, and the maximum is 1. When considering the largest companies that are comparable in terms of activity, rationing is not required, and it is sufficient to adjust the resulting integral index according to the level of ESG and volatility (variability).
Data analysis algorithm. The authors’ approach to the construction of an integral rating of energy companies with a high market share contains three consecutive stages:
Stage I. Collection of primary data and calculation of relative (index) indicators.
Stage II. Calculation of the integral rating based on primary indicators 1–4 obtained in stage I. At this stage, the procedure for sub-indexing the initial indicators by means of the hierarchical construction of the final indicator is applied.
Stage III. Rating volatility estimation using approximation problems—the OLS method and Chebyshev minimax problem [
39].
Stage IV. Corrections to the initial ratings according to the levels of EGS and volatility using the well-known method of weighting coefficients.
Stage V. Analysis of calculation results.
Next, the analysis stages are detailed.
Stage I. Collection of primary data and calculation of relative (index) indicators. The following key financial indicators of the primary analysis are used in this study:
The express analysis of the financial condition of leading energy companies is based on the following important indicators:
- (1)
Financial stability;
- (2)
Return on equity.
All rating indicators are calculated for each company.
Stage II. Calculation of the integral rating based on primary indicators 1–4 obtained in stage I. At this stage, the procedure for sub-indexing the output indicators is applied by means of the hierarchical construction of the final indicator (“integral” or “aggregated” index).
The authors of this article propose a three-stage procedure for grouping indicators into an integral rating. With regard to the enterprises in the energy industry, the ratings calculated in the second stage will allow internal decisions to be made that contribute to strengthening the financial position of the companies.
The analysis procedure contains three stages.
Step 1. In the first stage, the absolute indicators of the primary analysis of data on the size of funds are convoluted into a single sub-index, I1, according to the formula:
Step 2. The convolution of the indicators of in-depth (relative) data analysis into a single sub-index, I2, is performed according to the formula:
Step 3. The integral rating is calculated using the formula:
where:
R—the rating of indicators, where the best is 1;
I—sub-index;
RI—level 2 integral rating for two sub-indexes;
A—total assets;
E—equity;
RS—financial stability;
ROE—return on equity.
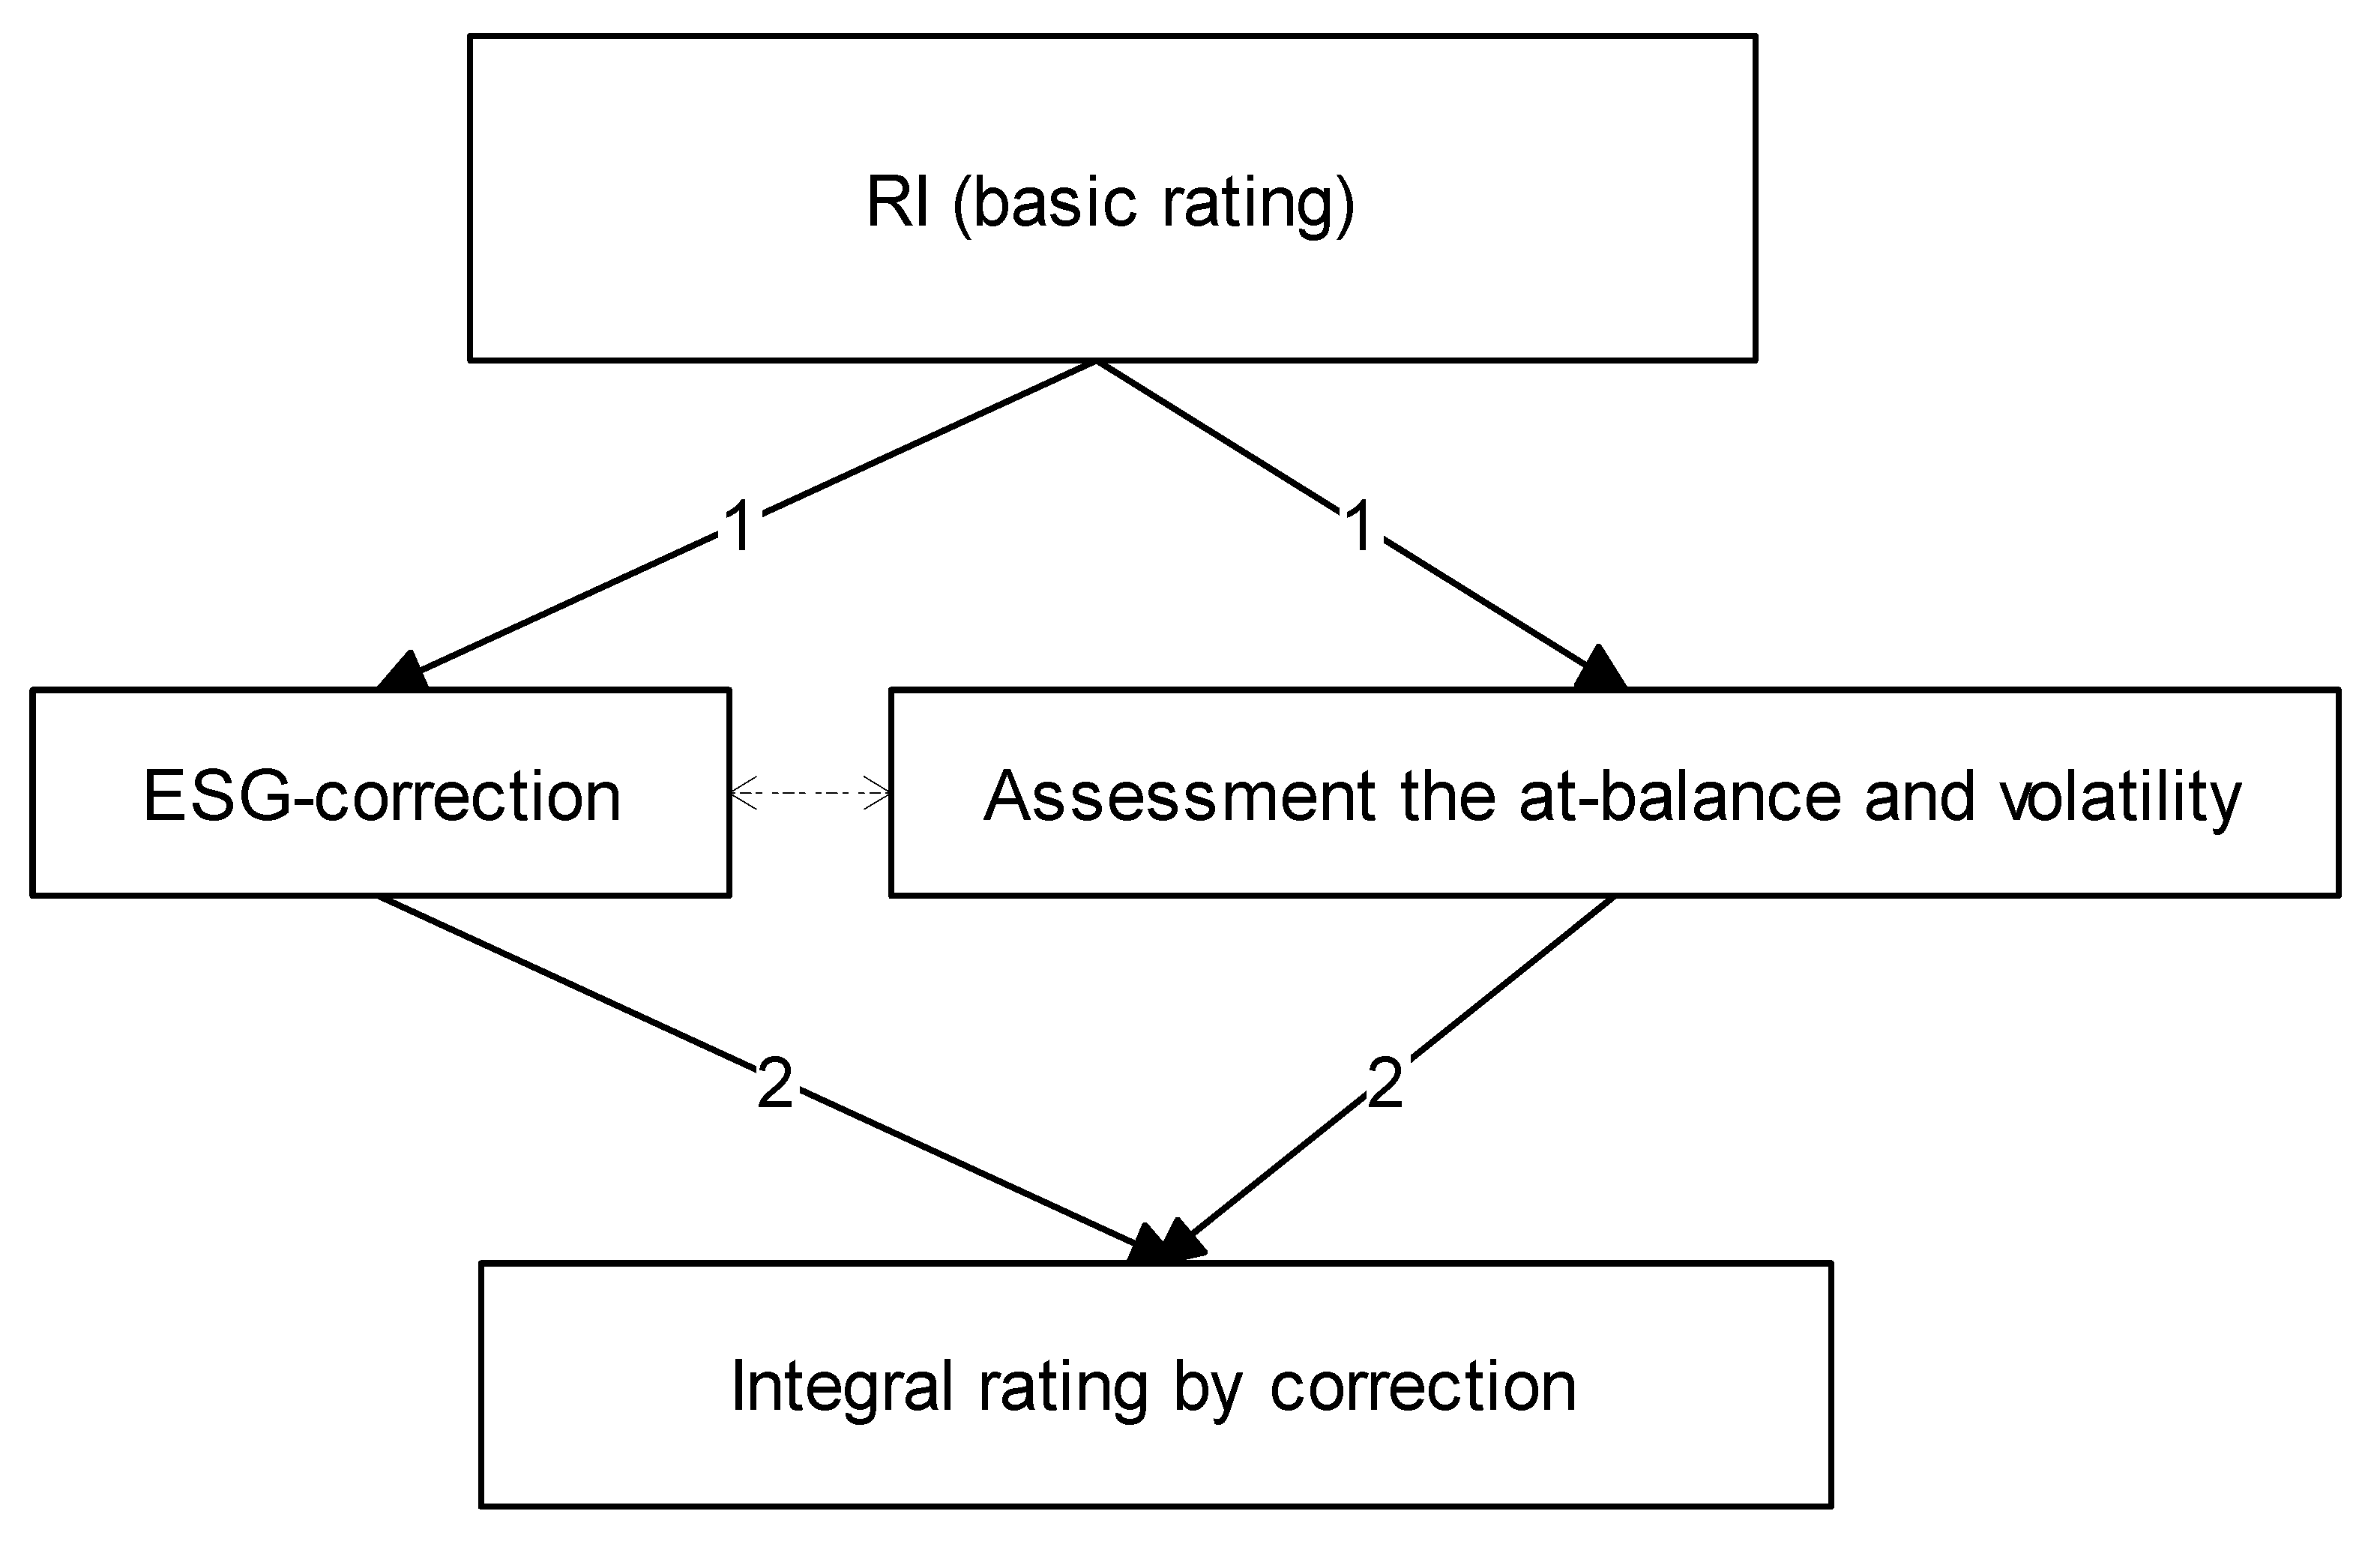
The algorithm for calculating the integral rating is shown in
Figure 1.
The arrow labels in
Figure 1 correspond to the steps of the algorithm presented above. The labels “1” and “2” at the first level indicate that sub-indexes I1 and I2 can be calculated independently, and at the second stage, the label “3” indicates that the final rating is calculated using both sub-indexes, which should be calculated by this time.
Stage III. Assessment of the risks of rating instability (volatility). Chebyshev interpolation is used to construct corrective volatility estimates for three periods; with an increase in the number of periods, it will be necessary to apply an approximation according to the Chebyshev problem with a possible restriction [
40].
The use of Chebyshev interpolation is expedient due to the absence of the need to fulfill the Gauss–Markov theorem, as is the case for the use of minimax (OLS), which makes the use of OLS unacceptable for a small sample, since the errors can be significant and the result is unreliable. The application of the minimax methodology will allow us to show significant deviations (for three observations, all deviations are significant), to obtain the rate of change (coefficient for a variable) and to draw up a development strategy that takes into account a reasonable alternative method that balances deviations evenly (for each observation) in terms of the amplitude of changes (and not in terms of the standard deviation for the entire period, as in OLS).
Let
yk (
k = 0, 1, 2) be the rating of the company for periods 0, 1 and 2 (years), and let the observation periods be designated as a grid of
T values of the variable
t:
. The Chebyshev problem is formulated as follows [
41]:
For approximations of the values of
yk, there will be a polynomial,
. To solve this problem, an intermediate parameter h is introduced, with modulo equal to the minimum value of the objective function of the problem. Chebyshev’s problem has a unique solution. The solution of the Chebyshev problem for
h,
a0 and a
1 is obtained from the system [
42,
43,
44]:
The methods based on the solutions of the Chebyshev problem and the results of OLS do not contradict each other (
Table 2,
Figure 2).
The optimal angle of inclination for a three-point approximation is preserved, and the free coefficient (shift of the polynomial) changes slightly (
Figure 2).
Stage IV. Adjustments to the initial rating according to the level of EGS and volatility. Since the sale of bonds is an important means of mobilizing financial resources for companies in high-tech industries, it is necessary to adhere to the opinions of society, the state and public organizations when forming a general rating. At the same time, the stock price, its dynamics and the trading mode (sale, purchase or abstention from transactions) are significant for the investor as a means of achieving stable income and confidence in the development of the company. In addition, the stock market is subject to fairly high volatility from political, economic and demographic changes, and therefore, the specifics of the stock market of multinational energy companies in Russia demonstrate little effectiveness in scalping strategies. Indeed, the risks of short transactions are higher than buying shares for long-term ownership and receiving dividends, so the timeliness of the purchase is relevant, which usually falls in April, August and December. According to the results obtained, in 2022, the dynamics of shares of leading companies remained more stable, which is a positive trend for Russia. Therefore, the authors consider it appropriate to take into account the integral ratings of ESG and CGQ to form the final rankings of companies.
The corrective ratings of companies are based on possible ESG risks; they are applied to the last period of analysis and based on official statistics of the Russian rating agency “Expert-RA”.
The procedure for adjusting the ratings obtained above (RI,
Figure 1, also basic ratings) is shown in
Figure 3.
It should be noted that the adjustment using the ESG and volatility weighting coefficients can be performed in the bypass mode involving all arrows or by following any branch with weights “1,2”. The adjustment is performed using the standard formula for weighting coefficients (the weights are ESG and volatility). The integral rating is obtained as the arithmetic mean of two corrective ratings [
45,
46,
47,
48,
49,
50].
Stage V of the study is described in detail by the authors in the Results Section.
3. Results
We analyzed data on the two most important energy-efficient industries, namely, oil and gas and electric power, for 2020 and 2021. Data for 2020 are presented in
Table 3.
Table 3 shows the net profit; if the companies are unprofitable (Gazprom and Rosneft in 2020 and Rosseti in 2021), the value “0” is indicated in the “Net profit” column.
Table 3 shows that the financial stability of Rosneft has changed, which was caused by the crisis in 2019 in Russia. At the same time, the zero profit for Gazprom and the low profitability of the projects of the electric power giants Rosseti and Inter RAO are still only a signal of a possible loss of stability. To obtain a more complete picture, it is necessary to analyze indicators of the dynamics.
Table 3 shows the calculation of the sub-index I1 based on
Table 4, as well as the ranking numbers for the assets from the balance sheets of companies and equity.
Table 4 shows that Gazprom was one of the leaders in 2020. The ratings for I1 are highly balanced (
Figure 1). To support the conclusions about the stability of the company, the relative indicators are considered (
Table 5).
By analyzing
Table 6, we can observe a decrease in two indicators: return on equity and financial stability.
As can be seen from
Table 7, the companies Rosseti and Tatneft are assigned a rank of 5.6, while Transneft and Inter RAO occupy the 7th and 8th places. Analytical data for 2021 are presented in
Table 5. In view of the above, dynamics were very important in the era of the 2019 crisis. It is the data before the crisis (2019), in the crisis year (2020) and after the crisis (2021) that will allow us to judge the quality and reliability of companies in the Russian oil and gas and electric power industries.
Comparing
Table 8,
Table 9 and
Table 10, it should be noted that there is an improvement in the reliability of companies and their profits. Rossetti is still lagging behind other companies, although the company has less debt, which is the result of the repayment of outstanding debts by debtors. According to the accepted procedure, the sub-indexes are calculated.
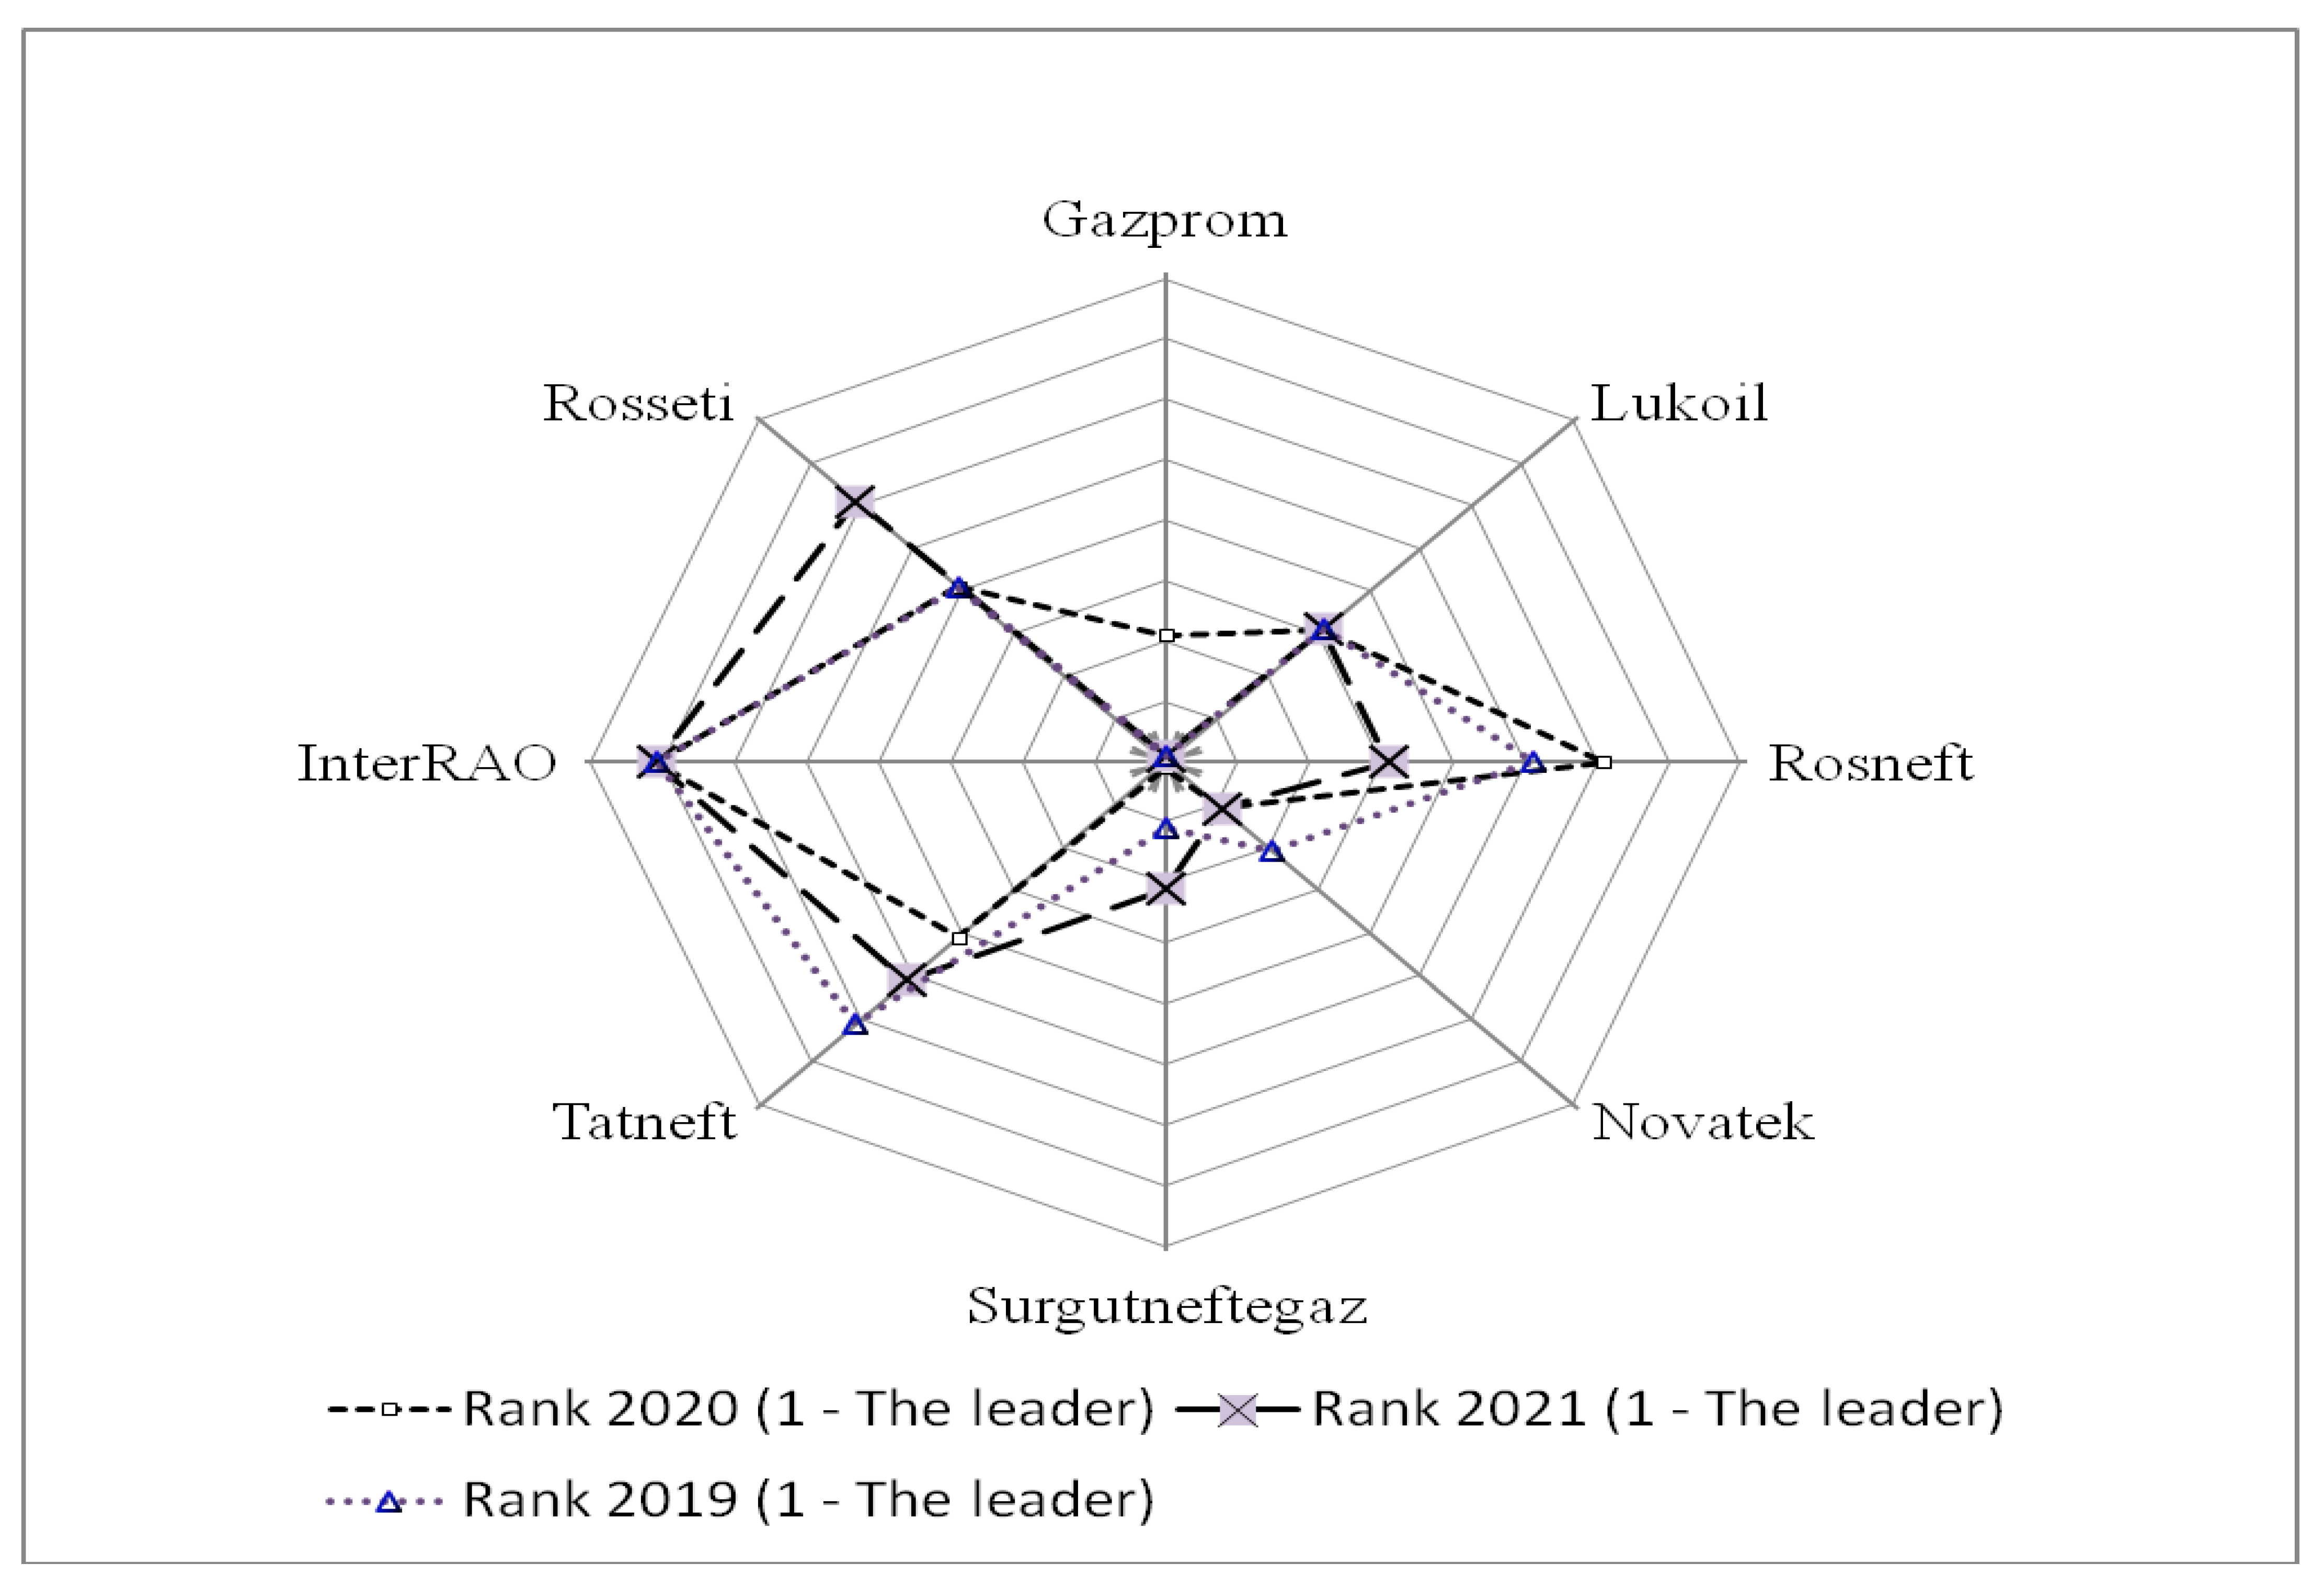
As a result of the analysis of the sub-indexes, an integral rating was obtained (
Table 11), and a comparative diagram was generated (
Figure 4).
To obtain an assessment of the reliability of companies, it is advisable to apply the authors’ methodology for hierarchical rating construction by means of a tree-like expert system. The algorithm was tested using data for the 3 studied years.
It follows from
Table 11 and
Figure 4 that the main oil and gas companies in the industry have increased their development indicators and are functioning stably. The results of the study reveal that Gazprom and Novatek are the leaders of the industry, Lukoil is consistently in third place, and Rosneft is in fourth place, and its leadership position is strengthening relative to Surgutneftegaz. At the same time, it is necessary to pay attention to the state of electric power companies that need to replace equipment and install new means of production (smart generation machines, laying lines and testing equipment), obtain automatic house and testing machines and train high-profile specialists with high wages.
As can be seen in
Figure 4, Gazprom, having temporarily lost profits in 2020, is confidently leading in 2021, Lukoil continues to be stable, and Tatneft, Novatek and Surgutneftegaz are trying to compete with the leaders.
The volatility estimates are presented in
Table 12.
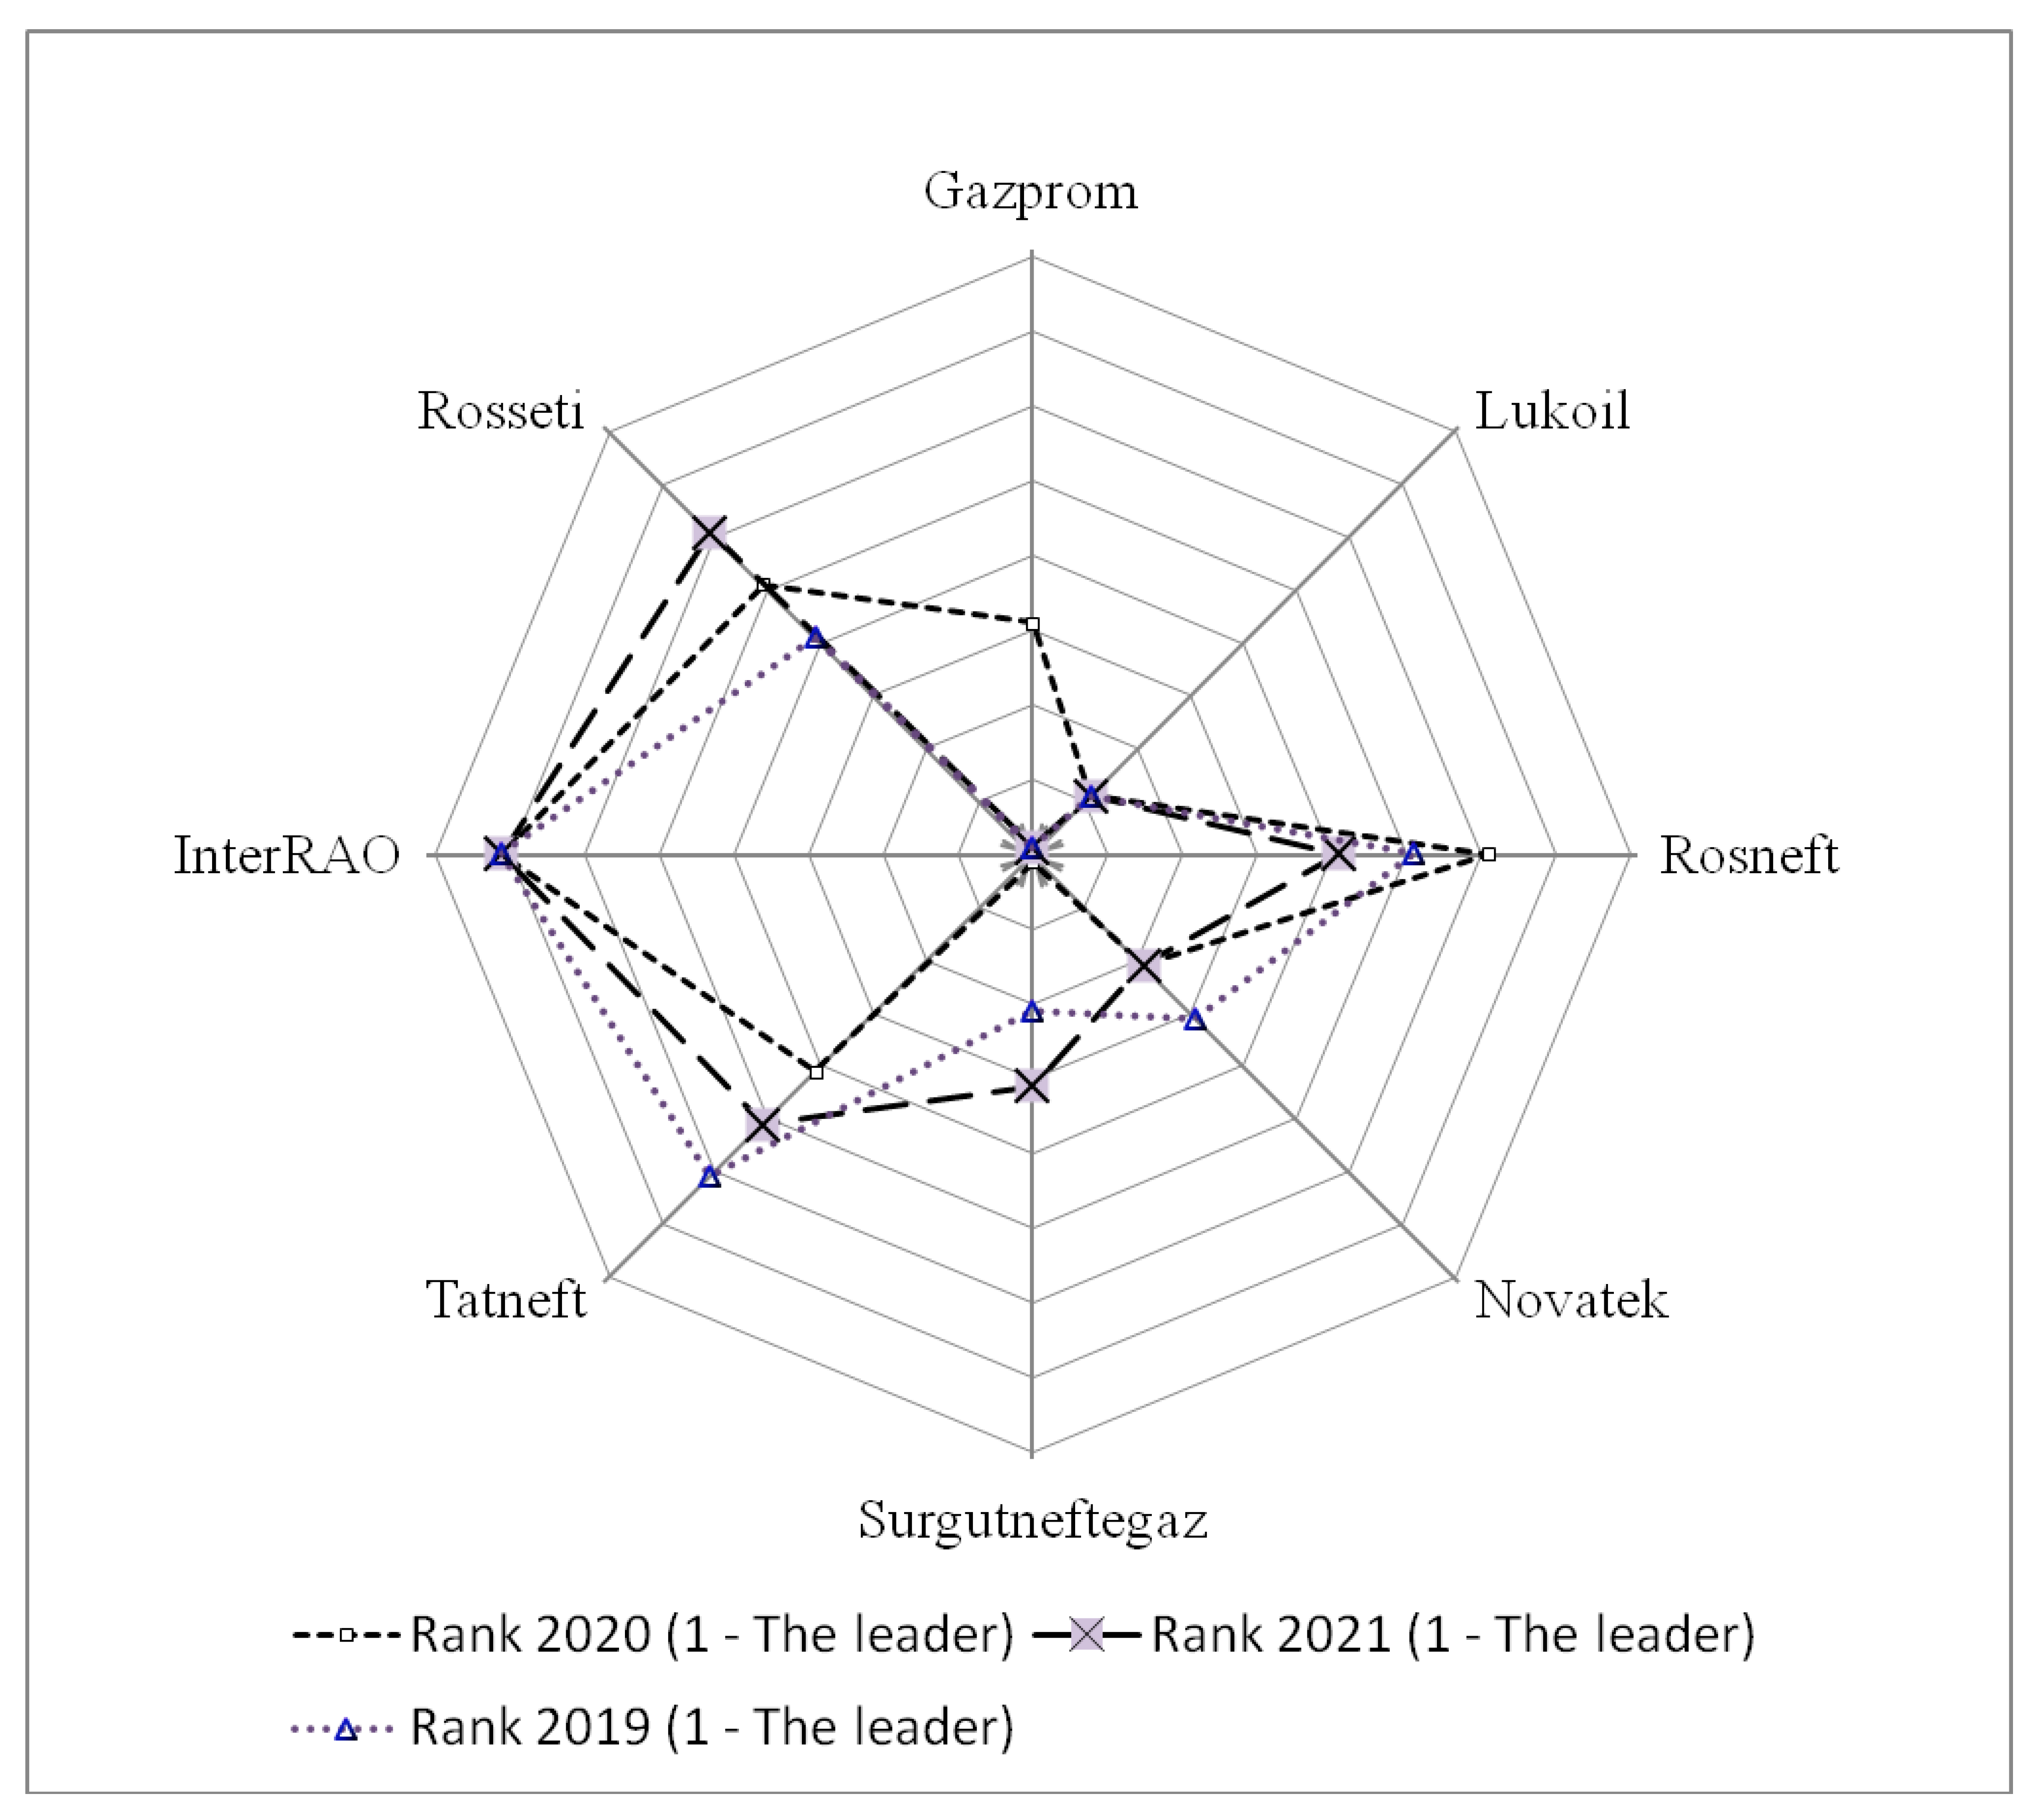
We adjusted the ranks according to the ESG ratings in 2022 (
Table 13,
Figure 5).
In
Figure 5, it can be seen that the top three are Gazprom, Lukoil and Novatek (first, second and third places, respectively), as we also see in
Table 11.
Of the analyzed companies, according to the experts of the Russian agency “RaExpert”, the rating of Group A was assigned to PJSC Lukoil, and the rest of the companies received the ratings of Group B. After adjustment, taking into account the credit rating of the company “RSG”, Lukoil ranks second for 2019–2021. At the same time, according to the authors, Lukoil has no significant influence on the Russian market, since 50% of the capital consists of borrowed funds, and equity is 13 times lower than Gazprom’s assets (
Table 13). The authors believe that high-quality, environmentally friendly products and a sufficiently high speed of customer service are the main requirements that are necessary to ensure competitiveness in the domestic market. In general, it should be noted that it is necessary to finance new projects, radically modernize the material base, synchronously improve equipment and maintain its high quality for the oil and gas sector and the electric power industry.
4. Discussion
This article is devoted to the development and substantiation of a multi-stage system for ranking and indexing the leading companies in the energy production sector of the Russian economy—the electric power industry and the oil and gas industry. The authors used a financial analytics apparatus based on the systematic financial (accounting) statements of companies according to accepted forms, and balance sheets and reports on financial results were applied. The authors developed and tested a methodology for sub-indexing important indicators from financial statements: capital structure—debt capital and equity, highly liquid assets (cash and settlement accounts in reliable banks, short-term financial investments) and net profit. The authors took into account the total amounts of funds (balance sheet totals), and the results show that the scale of development, effectiveness and quality are the basis for an effective assessment of financial statements. Based on the results of the article, we propose the following conclusions:
In conditions of high symmetry in the development of the Russian oil and gas companies Gazprom PJSC and Surgutneftegaz PJSC, Gazprom is the leader in terms of risks and dynamics, prospective changes, volume of assets, sales of oil and petroleum products, etc.
The development of the second largest independent producer of natural gas in Russia, PJSC Novatek, is optimal, increasing its own capital and production capacity, for which an increase in investments of 10–20% will slightly increase financial dependence, but with the effective management of resources (projects, processing, supplies), it will significantly increase profits.
The largest national oil and gas companies, PJSC Rosneft and PJSC Lukoil, compete with Gazprom Joint Stock Company in the industry, for which mutual cooperation in large-scale projects (construction, ecology, transport, space industry) is more relevant.
Despite considerable methodological development in this area, there are debatable problems that require further research: determining the degree of instability of the amount of equity, calculating the imbalance between profits and own resources from campaigns and applying a system of measures to improve the financial stability of companies (growth of equity in the structure of working capital; the probability of reducing the risk of loss of profit through the introduction of a comprehensive monitoring system and combined procedures; prospects for improving the financial performance of the company for the long term, maintaining the level of return on equity and increasing equity over debt capital).
The rating method proposed in this article is based on a comprehensive assessment and integral ranking of financial indicators disclosed by companies in annual financial reports published in the open press [
51,
52]. The rating method proposed by the authors involves calculations in five stages. In the first stage, primary data are collected, and relative (index) indicators are calculated. Then, in stage II, the integral rating is calculated based on the primary indicators obtained in stage I, and the procedure for sub-indexing the initial indicators is applied by means of the hierarchical construction of the final indicator. In stage III, the rating volatility is evaluated using approximation problems—the OLS method and the Chebyshev minimax problem. Stage IV involves making adjustments to the initial rating based on the levels of EGS and volatility using the method of weighting coefficients. Stage V is devoted to the analysis of the results of calculations. Further, the obtained values are analyzed, and a score is assigned to each indicator, which is summed up by taking into account the weight of the corresponding aspect in the final assessment. Based on the results of the assessment, the authors compiled an integral rating of Russian companies in the oil and gas and electric power industries for 2019–2021. The results of the study reveal that Gazprom and Novatek are the leaders of the industry, Lukoil takes second place, and Rosneft and Surgutneftegaz take third place.
At the same time, the analysis of panel data reveals that the discussed problems that require further research, such as factors of instability of equity, measures to improve financial stability and prospects for improving financial indicators and maintaining the level of profitability, continue to be relevant for oil and gas and electric power companies. The results of the article can be applied by rating agencies in assessing the financial stability of companies in terms of revenue, balance sheet results, net profit, equity and the ratio of equity to debt.


