Abstract
According to the EU Directive, the so-called RED II, there is increasing significance for biofuels produced from biomass with low indirect land use change (ILUC) risk. Such an alternative and sustainable feedstock could be microalgae, among others, used for biodiesel production. This is due to the high lipid content of their cells and their potential ability to accumulate significant amounts of carbon dioxide in their biomass, which has a positive effect on the carbon footprint of the product. The aim of this study was to determine the effect of adding algal biodiesel to conventional diesel fuel on selected performance parameters of a diesel engine, taking into account the composition of the emitted exhaust gas. Energy-related engine performance parameters such as power, hourly and specific fuel consumption, engine thermal efficiency, and indicated efficiency were determined. No significant differences were found in the energy parameters of engine operation with the fuels tested. In terms of carbon monoxide and NOx emissions, at the highest engine torque, more favorable parameters were obtained for fuel with biodiesel produced from rapeseed oil (B/RME). Under the same conditions, carbon dioxide emissions for the fuel with the addition of biodiesel from microalgae (B/Algae) were 8.1% lower.
1. Introduction
A significant amount of fossil fuels are used as transport fuels [1]. Their combustion in engines emits harmful compounds into the atmosphere, including carbon dioxide, carbon monoxide, and hydrocarbons [2]. For environmental reasons, but also for technological limitations related to oil extraction and the instability of oil prices on world markets, interest in alternative fuels has increased [3]. For the commonly used diesel fuel, biodiesel is a good substitute and can be successfully used in diesel engines [4]. This biofuel, compared to conventional fuel, has better lubricity properties, a higher flash point, and lower exhaust emissions in terms of sulfur and aromatics [5]. Some limitations are related, among others, to the freezing of biodiesel at low temperatures and lower stability during storage [6]. At present, food feedstocks are primarily used to produce this biofuel [7], which implies a fuel-food competition. The European Commission’s view, expressed in the Renewable Energy Directive (RED II) of December 2018, is that the use of food and feedstocks should be reduced in favor of non-food feedstocks.
Lignocellulosic wastes and crops grown on uncultivated agricultural land can be used for biofuel production [8], while microalgae are promising candidates for the production of third-generation advanced biofuels. Their cultivation does not compete with crop production and can be carried out using not only freshwater but also salt water, saline water, and various types of wastewater [9,10,11]. Compared to plants, they are characterized by a high photosynthetic rate. Under favorable conditions, their growth rate and the yield of biomass obtained are higher compared to terrestrial plants [12]. For biodiesel production, it is important that the oil content of microalgae cells be higher than that of the best oilseed crops [13,14]. The level of lipid accumulation in the biomass and its composition depend, among other things, on the composition of the culture medium and the cultivation parameters, including temperature, type of light, intensity, and time of illumination of the culture [15]. The properties of algal oil are similar to the physicochemical parameters of vegetable oils [16]. The fatty acid profile of microalgae oil indicates that it is a good substrate for biodiesel production [17]. Monounsaturated fatty acids, which constitute the majority in triacylglycerols [18,19], can be converted to fatty acid methyl esters during transesterification [20,21]. The oil content of microalgae cells, as well as their fatty acid composition, varies with cultivation conditions [22].
For the economics of microalgal biodiesel production, the cost of biomass cultivation and transformation as well as the method of lipid extraction will be important [23], while for the evaluation of the energy potential, parameters providing evidence of combustion quality in the engine will be essential [24]. The physical and chemical properties of algal biofuel are similar to those of conventional diesel fuel [25,26]. However, research results on the use of algal biofuel in engines compared to conventional fuel are not consistent. Some indicate that the use of algal biofuel blends results in higher thermal efficiency [27], while others report a decrease in maximum cylinder pressure, an increase in specific fuel consumption [28], a decrease in brake thermal efficiency, and an increase in exhaust gas temperature [29]. In a study carried out by Al-Iwayzy and Yusaf [30], there were no differences between diesel-fueled engine performance and the comparative algal biofuel blend.
One of the most important issues related to the use of fuels is the emissions that enter the environment. Special attention is given to carbon dioxide as the main greenhouse gas of human origin. Naturally, CO2 emissions and uptake should balance each other over a period of time, but at the present time, the level of emissions caused by human activity and the use of fossil fuels in various sectors of the economy, including transport, is too high. This has a significant impact on climate change [31], hence the need for technologies that promote the reduction of these emissions and increased CO2 sequestration [32]. Considering life cycle assessment, microalgae fit perfectly into these requirements. The carbon dioxide necessary for microalgae growth can come from the atmosphere or from industrial emissions [33]. The photosynthetic efficiency of microalgae ranges from 10 to 20%, while for most terrestrial plants it is 1 to 2% [34]. It is assumed that more than 1.8 kg of carbon dioxide can be fixed to every 1 kg of biomass, although this value may differ according to the type of microalgae [35]. Microalgae use CO2 to produce their own biomass, which can be converted to bioenergy [36], including biofuels, potentially promoting the decarbonization of transport. Algal biomass can be converted to biomethane [37], bioethanol [38], or biohydrogen [39]. Another possibility to obtain an alternative fuel is the production of refined bio-crude from hydrothermal liquefaction [40,41]. For algal biodiesel, the concentration of CO, CO2, hydrocarbons (HC), and NO in emissions from an engine fueled by it depends on the percentage of biofuel in the blend [42], the type of algae used to obtain the oil for biodiesel production [43], and the cultivation method and culture conditions [44].
The aim of the present study was to evaluate selected engine performance indicators operating at different torques, powered by a diesel fuel mixture containing biodiesel produced from microalgal biomass oil. The algal biodiesel was introduced into the diesel at exactly the same dosage as in commercial fuel containing biodiesel made from rapeseed oil as a biocomponent. As part of the study, dynamometer tests were performed on a single-cylinder diesel engine with direct injection. During the measurements, the following engine parameters were determined: effective power, fuel consumption per hour and specific fuel consumption, average indicated pressure, thermal efficiency, indicated efficiency, and specific exhaust emissions (CO, NOx, hydrocarbons, and CO2). The novelty of the paper was to determine how the addition of microalgae biofuel instead of RME would affect the energy and environmental performance of a diesel engine operating under varying torque conditions. The results of the study may be useful in the formulation of new, more environmentally friendly fuel blends.
2. Materials and Methods
2.1. Biodiesel from Algal Oil
The study used diesel fuel obtained from a Polish refinery. A 7% addition of biofuel from microalgae (B/Algae) was introduced into this fuel. The biofuel was prepared in the laboratory by a transesterification process using methanol and a homogeneous alkaline catalyst. The precursor for biofuel production was oil extracted from the biomass of two microalgal strains: Chlorella vulgaris and Scenedesmus. A commercial diesel containing a 7% addition of biodiesel produced from rapeseed was used as a control (B/RME).
2.2. Experimental Setup
2.2.1. Microalgal Biomass Production
Microalgae of Scenedesmus and C. vulgaris (ratio 70:30) were cultivated in vertical tube photobioreactors 204 cm high and 24 cm in diameter with a total volume of 100 L (Figure 1). Cultures were grown using commercial F/2 medium. LED lighting with red, blue, and white LEDs in a ratio of 70:20:10 at an intensity of 285 µmol m−2 s−1 was used to illuminate the culture. A photoperiod of 18/6 h of light/dark cycles was used. Carbon dioxide was introduced into the culture with atmospheric air using a membrane pump (HAILEA ACO-500A, Guangdong, China) with 175 W and a capacity of 275 L·min−1. The experiment was carried out as a batch culture for 10 days.
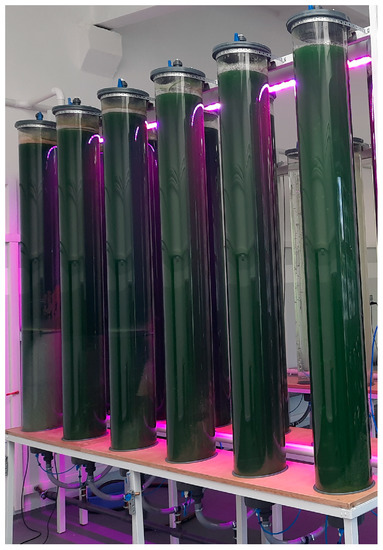
Figure 1.
Tubular photobioreactors with a 100 L capacity.
After cultivation, the microalgal biomass was dewatered using a centrifuge at 8000 rpm. Oil extraction from the algae was carried out after biomass drying.
2.2.2. Lipid Extraction
The biomass was dried at 55 °C for 48 h. Microalgal cells were extracted with methanol. The biomass was flooded with solvent in a 1:3 ratio (w/w). After 24 h, the methanol-oil solution was separated using a vacuum filtration system. The methanol from the solution was removed using a rotary evaporator.
2.2.3. Transesterification
Transesterification of microalgal oil was carried out with methanol. The molar ratio of methanol to oil was 6:1. Potassium hydroxide (KOH) at 1.5% (w/w) was used as a catalyst. The oil was adjusted to 50 °C, followed by the addition of the previously prepared potassium methanolate. The temperature was adjusted to 55 °C and stirred intensively (650 rpm) for 30 min. At the end of the process, the mixture was transferred to a separating funnel and allowed to separate the glycerol phase from the biodiesel phase.
2.2.4. Dynamometric Stand
Dynamometer tests were carried out in the combustion engine laboratory. The test system included a four-stroke diesel engine (TD200) (Table 1), a volumetric fuel gauge, display modules, an engine cycle analyzer (ECA 100), an exhaust gas calorimeter (TDX00a), and an exhaust emission diagnostic analyzer (CAP3201). A schematic of the test stand is shown in Figure 2.

Table 1.
Technical specifications of the four-stroke diesel engine TD200.
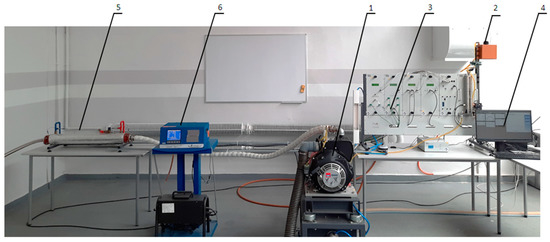
Figure 2.
Scheme of the test stand: 1—diesel engine; 2—fuel tank; 3—measuring devices; 4—computer; 5—calorimeter; 6—exhaust gas analyzer.
Partial power characteristics were carried out at an initial speed setting of 2000 rpm, followed by an increase in engine torque.
Engine speed and torque were measured each time. From this, the usable power of the engine was determined. The time of consumption of a fixed dose of fuel (8 mL) was also measured. These data were used to determine hourly and specific fuel consumption. The mean cylinder pressure indicated was measured using a piezoelectric sensor. From this, the engine’s indicated power and efficiency were calculated. To determine the overall efficiency, the average calorific value was taken according to available literature data: 42.6 MJ·kg−1 for B/RME (according to the commercial fuel producer data) and 41 MJ·kg−1 for B/Algae [25], respectively. In addition, an emissions composition analysis was performed using an exhaust gas analyzer. Measurements were taken and converted according to standards: PN-ISO 15550 2009 [45], PN-ISO 3046-1 2009 [46], PN-ISO 3046-3 2009 [47], and PN-ISO 3046-5 2009 [48]. Exhaust emissions were determined according to standards: PN-ISO 8178-1 1999 [49] and PN-ISO 8178-6 2000 [50].
All analyses were reduced to normal conditions. Normal atmospheric conditions, according to accepted standards, are a temperature of 25 °C and a pressure of 100 kPa. Engine performance was monitored using TecQuipment software (Nottingham, UK).
2.3. Statistical Analysis
All analyses were carried out in triplicate. Results were statistically analyzed using Statistica software (version 13.3, 2016; Dell Inc., Tulsa, OK, USA). A one-way analysis of variance was used. The significance of differences between means was assessed using Tukey’s test at p ≤ 0.05. Standard deviations (SD) were also determined.
3. Results and Discussion
3.1. Energy Efficiency of the Engine
Increased engine torque resulted in a reduction in engine speed. These changes were partially compensated by the reaction of a centrifugal mechanical speed controller, but it was clearly found that the engine fueled with microalgae biofuel reacted more favorably (by about 7%) (Figure 3a). When the engine was loaded with 6 Nm of torque, the engine speed was 1731 rpm for B/Algae and 1725 rpm for B/RME (Figure 3b). According to other authors’ studies [51], changes in engine speed may also be related to a lower cetane number in the fuel, which is responsible for lowering the combustion performance of the fuel mixture and reducing the energy released per unit volume of fuel, thus reducing the braking power at high torque.

Figure 3.
Relationship between speed and engine torque (a); speed at the highest engine torque of 6 Nm (b). Different letters above the error bars (i.e., ±SD) indicate significant differences (p < 0.05) between the means; means followed by the same letter do not statistically differ from each other (Tukey’s post-hoc test).
The relation of useful engine power to engine speed is shown in Figure 4a. The higher engine power was obtained for B/Algae fuel, where the torque-dependent value ranged from 0.205 kW to 1.087 kW. For B/RME fuel, the usable power was lower by between 0.3 and 0.5%. The engine’s power is influenced by the calorific value of the fuel. In a study carried out by Serrano et al. [52], a decrease in engine power was observed after the use of fuel with lower calorific value biocomponents. The higher useful power may also be related to the higher viscosity of the biofuel. Its increase results in less internal leakage at the fuel pump, which consequently increases engine power [53]. Tüccar and Aydin [54] reported a reduction in engine power after using algal biodiesel.

Figure 4.
Relationship between engine power and engine speed (a); engine power at 6 Nm torque (b). Different letters above the error bars (i.e., ±SD) indicate significant differences (p < 0.05) between the means; means followed by the same letter do not statistically differ from each other (Tukey’s post-hoc test).
In the presented study, the lowest hourly fuel consumption was observed for B/Algae fuel. Depending on the engine torque, fuel consumption ranged from 175 g∙h−1 to 328 g∙h−1 (Figure 5a). For B/RME fuel, an increase in hourly fuel consumption relative to B/Algae was found in the range of 0.3 to 2.5%. When analyzing the highest engine torque (6 Nm), the hourly fuel consumption for B/Algae was lower by 0.3% (Figure 5b). This parameter is mainly influenced by the calorific value of the fuel, as confirmed by Reis et al. [55] in their study, where, together with the calorific value of the fuel, the fuel consumption increased. In our study, the biocomponent concentration in the fuel blend was at the same level, and the calorific value for both biofuels is also very similar; therefore, the differences between B/Algae and B/RME variants were not significant.
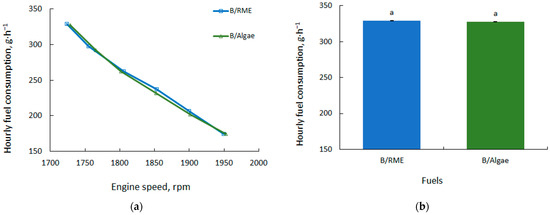
Figure 5.
Hourly fuel consumption in relation to engine speed (a); hourly fuel consumption at 6 Nm torque (b). Different letters above the error bars (i.e., ±SD) indicate significant differences (p < 0.05) between the means; means followed by the same letter do not statistically differ from each other (Tukey’s post-hoc test).
In the study carried out, the highest specific fuel consumption was observed at the lowest engine torque, which confirms studies by other authors [56,57]. The B/Algae fuel proved to be more advantageous in this aspect. At a torque of 6 Nm compared to B/RME fuel, the difference was 0.95% (Figure 6). In addition to calorific value, specific fuel consumption is also influenced by parameters such as viscosity, specific gravity, and engine injection system [58]. A decrease in the calorific value and an increase in the viscosity of the fuel require an increase in the fuel mixture flow rate to maintain the same operating conditions. In a study carried out by Khiari et al. [59], a high proportion of biodiesel with a higher viscosity and lower calorific value resulted in a significant increase in specific fuel consumption. Murad and Al-Dawody [60] found that the use of algal methyl ester (AME) blends with diesel increased brake-specific fuel consumption. Similar results for the amount of fuel consumed per unit of braking power (SFC) were obtained by Subramaniam et al. [27] in a comparative study of diesel and microalgal fuel.
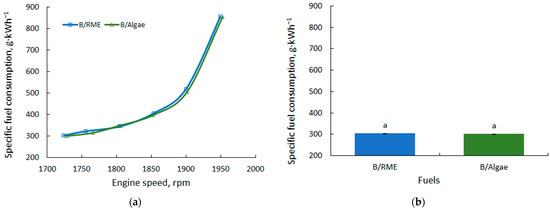
Figure 6.
Specific fuel consumption in relation to engine speed (a); specific fuel consumption at 6 Nm torque (b). Different letters above the error bars (i.e., ±SD) indicate significant differences (p < 0.05) between the means; means followed by the same letter do not statistically differ from each other (Tukey’s post-hoc test).
The indicated efficiency of the engine powered with the microalgae biofuel blend was higher compared to B/RME, from 43.8 to 46.2% (Figure 7a). The highest indicated efficiency at the characteristic points tested was recorded for an engine torque of 4 Nm for B/Algae and 3 Nm for B/RME. The type of fuel had no significant effect on the indicated efficiency in this experiment. Lebedevas et al. [61] found that differences in indicated efficiency for diesel fuel and pure oil from P. moriformis did not exceed 2–3% (at moderate dynamics, m = 0.5).
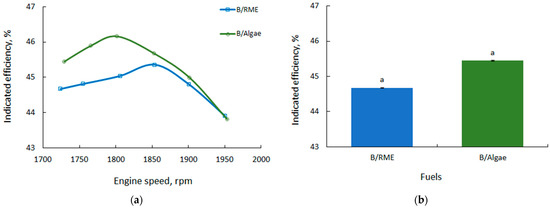
Figure 7.
Indicated efficiencies in relation to engine speed (a); indicated efficiencies at 6 Nm torque (b). Different letters above the error bars (i.e., ±SD) indicate significant differences (p < 0.05) between the means; means followed by the same letter do not statistically differ from each other (Tukey’s post-hoc test).
The engine thermal efficiency is shown in Figure 8a. For the tested fuels, the most beneficial parameters were observed at the highest engine torque and lowest engine speeds. For B/Algae fuel, the efficiency ranged from 10% (1 Nm) to 28% (6 Nm). For B/RME, there was a slight reduction in efficiency (1.26% on average). Fuel parameters that partly affect engine efficiency are mainly fuel viscosity and molecular weight. Higher fuel viscosity results in lower fuel atomization, which consequently increases the amount of fuel combusted in the diffusion mode, resulting in lower combustion efficiency [62]. Less beneficial combustion parameters are related to an increase in carbon monoxide emissions at high engine speeds, as confirmed in the present study.

Figure 8.
Engine thermal efficiency in relation to engine speed (a); engine thermal efficiency at 6 Nm torque (b). Different letters above the error bars (i.e., ±SD) indicate significant differences (p < 0.05) between the means; means followed by the same letter do not statistically differ from each other (Tukey’s post-hoc test).
Figure 9 presents the engine cylinder pressure waveforms as a function of crankshaft angle for the combustion of the two fuels. According to the results, for higher torque, slightly higher pressures were observed for the tested fuels. The maximum indicated pressure slightly exceeded 60 bars. No significant differences were observed for the tested fuels at different torque levels, and it was therefore concluded that the type of fuel has a non-significant effect on this parameter. Similar conclusions were presented by Vadivelu et al. [63] in their study, where the highest cylinder pressure was determined for a fuel with biocomponents.
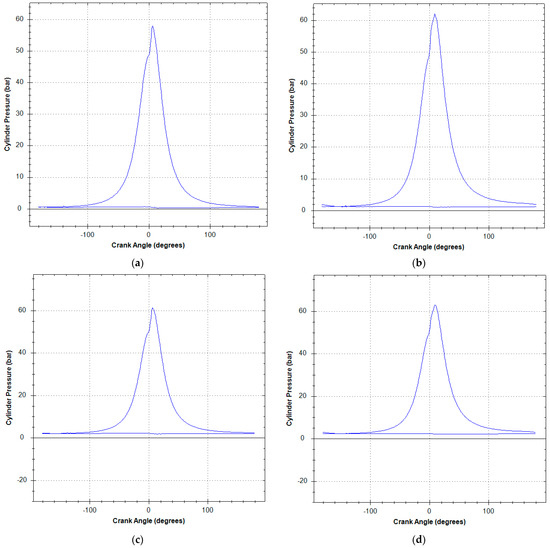
Figure 9.
Engine cylinder pressure for B/RME/1 Nm (a), B/RME/6 Nm (b), B/Algae/1 Nm (c), and B/Algae/6 Nm (d).
The average indicated pressure is shown in Figure 10. When analyzing the tested fuels, values similar to each other were observed, where the maximum differences between the fuel mixture variants at the measuring points were 0.1 bar. At the highest torque, a 1% lower effective pressure was observed for the B/RME fuel.

Figure 10.
Mean effective indicated pressure in relation to engine speed (a); mean effective pressure at 6 Nm torque (b). Different letters above the error bars (i.e., ±SD) indicate significant differences (p < 0.05) between the means; means followed by the same letter do not statistically differ from each other (Tukey’s post-hoc test).
3.2. Engine Emissions
Carbon monoxide (CO) emissions in the exhaust gas were determined by the engine torque and fuel type. For the lowest torque (1 Nm), more beneficial results were obtained for the B/Algae variant, where emissions were 67% lower compared to B/RME (Figure 11a). With increasing torque and decreasing speed, emissions already at 2 Nm torque were lower for B/RME than for B/Algae. Analyzing the emissions at the highest torque, for B/RME it was 1.6 g·kWh−1 (Figure 11b), while for B/Algae it was 1.05 g·kWh−1 higher. Carbon monoxide is formed as a result of incomplete combustion due to, among other things, a lack of oxygen or short combustion reaction times, so emissions of this compound increase with the biofuel content in the fuel mixture, where the amount of oxygen needed to atomize the carbon is lower [64]. However, as observed in this study, the amount of oxygen for fuel combustion was sufficient, and the Lambda coefficient (air ratio) was above unity at all measurement points (Figure 12a). At the lowest speed, the Lambda coefficient was 2.65 for B/RME and 2.62 for B/Algae. CO emissions are influenced by the calorific value of the fuel, which is related to the amount of energy stored in the fuel that is released during the combustion process. A lower calorific value implies a higher amount of fuel injected to obtain the same amount of energy, which can result in an increase in emissions [52].
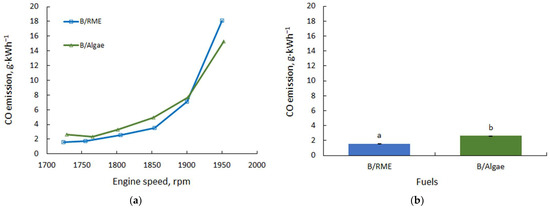
Figure 11.
Carbon monoxide emissions in relation to engine speed (a); carbon monoxide emissions at 6 Nm torque (b). Different letters above the error bars (i.e., ±SD) indicate significant differences (p < 0.05) between the means; means followed by the same letter do not statistically differ from each other (Tukey’s post-hoc test).

Figure 12.
Lambda coefficient in relation to speed (a); Lambda coefficient at 6 Nm torque (b). Different letters above the error bars (i.e., ±SD) indicate significant differences (p < 0.05) between the means; means followed by the same letter do not statistically differ from each other (Tukey’s post-hoc test).
Figure 13 shows CO2 emissions as a function of engine speed. Carbon dioxide is a greenhouse gas largely responsible for global warming, so this parameter is very important in the environmental assessment of fuels. Lower CO2 emissions were observed for variant B/Algae. Values in the range of 1.06 to 2.55 kg·kWh−1 were obtained at the analyzed engine performance points. Carbon dioxide emissions for B/RME were higher by an average of 6.7%. At 6 Nm torque, where the most beneficial engine parameters in terms of energy were found, the difference in emissions was 8.1% for the benefit of B/Algae. In a study carried out by El-Baz et al. [65], during combustion of a blend containing 20% biofuel prepared from microalgae oil, a reduction in CO2 emissions of a maximum of 8% was obtained compared to diesel for the blend. According to these authors, the emission reduction is related to the lower C/H ratio compared to conventional fuel.

Figure 13.
Carbon dioxide emissions in relation to engine speed (a); carbon dioxide emissions at 6 Nm torque (b). Different letters above the error bars (i.e., ±SD) indicate significant differences (p < 0.05) between the means; means followed by the same letter do not statistically differ from each other (Tukey’s post-hoc test).
The total carbon balance for biofuels includes the stages associated with cultivation, transport, biomass conversion, and the amount of CO2 absorbed from the atmosphere [66,67]. When analyzing the biofuel production cycle in terms of carbon dioxide emissions, algal oil-based fuels have lower carbon dioxide emissions (16.10 g CO2·MJ−1) with respect to RME (21.60 g CO2·MJ−1) [68]. For the combustion of biofuels, the aspect of carbon dioxide capture from the atmosphere during the growth of the biomass used to produce the biofuel should also be considered. For example, the total carbon sequestration in winter oilseed rape biomass, including primary, secondary, and root yield (less than 10 t·ha−1), was 15.6 t CO2 ha−1·yr−1 [69]. Theoretically, using solar energy, 280 tonnes of dry algal biomass can be produced per hectare per year, using around 513 tonnes of CO2 [70].
The hydrocarbon emissions are shown in Figure 14. The lowest emissions were recorded at the lowest engine speed, where the engine torque achieved its maximum value. For B/RME, only at this measurement point was the emission value lower than for B/Algae, at 0.01 g·kWh−1 and 0.05 g·kWh−1, respectively. Increasing engine speed caused an increase in HC emissions. As the engine torque decreased, hydrocarbon emissions for B/RME were higher than for B/Algae, with an average increase of 53%. Dębowski et al. [71] compared emissions for Chlorella protothecoides algae biodiesel and rapeseed oil biodiesel and found that at low engine torque, HC emissions determined for the algae biodiesel were significantly lower than those for the RME biodiesel. An increase in HC emissions with speed was also reported by Serrano et al. [72]. The level of HC emissions is determined by the engine’s mode of operation. For engine operation characteristic of urban vehicle operation, HC emissions are lower while increasing in the non-urban cycle, as reported by Armas et al. [73]. These results are consistent with the data obtained in this study.
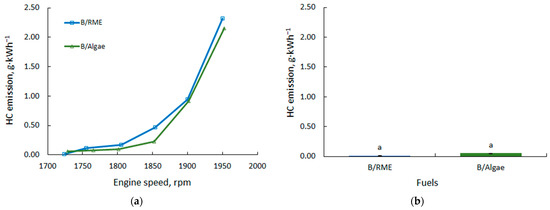
Figure 14.
Hydrocarbon emissions in relation to engine speed (a); HC emissions at 6 Nm torque (b). Different letters above the error bars (i.e., ±SD) indicate significant differences (p < 0.05) between the means; means followed by the same letter do not statistically differ from each other (Tukey’s post-hoc test).
NOx emissions were lower for B/RME and ranged from 0.74 to 3.02 g·kWh−1 (Figure 15). NOx emissions for B/Algae ranged from 0.88 to 3.16 g·kWh−1, respectively. In most studies, an increase in NOx emissions is observed when biodiesel is used. This is attributed to the higher oxygen content of the fuel, which favors complete combustion [74]. An increase in NOx emissions as a result of the addition of methyl esters from microalgae to diesel fuel was also reported by Sharif et al. [75]. In a study by Wahlen et al. [76], biodiesel from the microalgae Chaetoceros gracilis had lower NOx emissions than conventional diesel fuel.
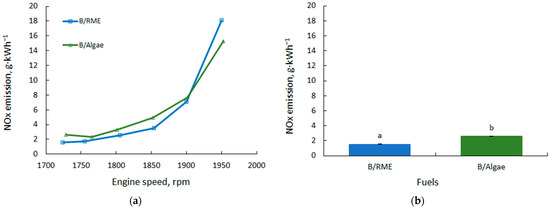
Figure 15.
NOx emissions in relation to engine speed (a); NOx emissions at 6 Nm torque (b). Different letters above the error bars (i.e., ±SD) indicate significant differences (p < 0.05) between the means; means followed by the same letter do not statistically differ from each other (Tukey’s post-hoc test).
4. Conclusions
This paper presents the results of tests on a diesel engine powered with a mixture of diesel with 7% RME or biofuel obtained from the oil of microalgae (Scenedesmus and C. vulgaris). The effect of fuel type on the energy and environmental parameters of the tested engine was evaluated.
The lack of significant differences in energy parameters means that the fuel produced from microalgae oil can be used to power a diesel engine. For useful power, the differences for both fuels did not exceed 0.7%. For specific fuel consumption, the maximum differences were 2.3% in favor of the B/Algae blend. Also, the indicated efficiency and overall engine efficiency indicators determined in the study were more favorable for B/Algae (approximately 2.5%). For the applied fuels, no significant differences were recorded for changes in engine indicated pressure as a function of crankshaft rotation angle.
For both fuel blends, all emissions were below the standards applicable to the tested engine. Specific CO emissions for the highest engine torque were 1.05 g·kWh−1 lower for the B/RME fuel than for NOx emissions. HC emissions were also lower, with a reduction rate of only 0.04 g·kWh−1 compared to the B/Algae variant. A significant difference in favor of the microalgae biofuel blend was found for CO2 emissions. The values determined in the B/Algae variant were more than 8% lower compared to B/RME. Since microalgae have the ability to absorb significant amounts of CO2 during growth, the overall balance for third-generation fuels is lower, making them competitive with first-generation fuels.
The study demonstrated that the tested fuels are very similar in energy terms. Some emissions of harmful exhaust components from an engine fueled with microalgae biofuel were slightly higher compared to RME but did not exceed the acceptable standard for this type of engine. The use of a B/Algae blend was found to be a better alternative with regard to the use of renewable resources while maintaining increasingly stringent exhaust emission standards. Biofuel from microalgae can successfully represent the fuel of the future, especially in freight transport, for which electromobility technology will still remain less viable due to its high power requirements.
Author Contributions
Conceptualization, M.H.-P. and A.K. (Adam Koniuszy); methodology, M.H.-P., A.K. (Adam Koniuszy), P.R., W.G., A.K. (Andrzej Kwaśnica) and D.M.; validation, M.H.-P., A.K. (Adam Koniuszy) and P.R.; formal analysis, P.R., A.K. (Adam Koniuszy), W.G., A.K. (Andrzej Kwaśnica) and D.M.; writing—original draft preparation, P.R., M.H.-P. and A.K. (Adam Koniuszy); writing—review and editing, P.R., M.H.-P. and A.K. (Adam Koniuszy); visualization, P.R., M.H.-P. and A.K. (Adam Koniuszy); supervision, P.R., M.H.-P. and A.K. (Adam Koniuszy). All authors have read and agreed to the published version of the manuscript.
Funding
This research received no external funding.
Data Availability Statement
Not applicable.
Conflicts of Interest
The authors declare no conflict of interest.
References
- Mandley, S.; Daioglou, V.; Junginger, H.; van Vuuren, D.; Wicke, B. EU bioenergy development to 2050. Renew. Sustain. Energy Rev. 2020, 127, 109858. [Google Scholar] [CrossRef]
- Bhatia, S.K.; Bhatia, R.K.; Jeon, J.M.; Pugazhendhi, A.; Awasthi, M.K.; Kumar, D.; Kumar, G.; Yoon, J.J.; Yang, Y.H. An overview on advancements in biobased transesterification methods for biodiesel production: Oil resources, extraction, biocatalysts, and process intensification technologies. Fuel 2021, 285, 119117. [Google Scholar] [CrossRef]
- García Martín, J.F. Recent Developments in Jatropha Research; Nova Science Publishers, Inc.: Hauppauge, NY, USA, 2021. [Google Scholar]
- Singh, D.; Sharma, D.; Soni, S.L.; Inda, C.S.; Sharma, S.; Sharma, P.K.; Jhalani, A. A comprehensive review of physicochemical properties, production process, performance and emissions characteristics of 2nd generation biodiesel feedstock: Jatropha curcas. Fuel 2021, 285, 119110. [Google Scholar] [CrossRef]
- Giakoumis, E.G.; Rakopoulos, C.D.; Dimaratos, A.M.; Rakopoulos, D.C. Exhaust emissions of diesel engines operating under transient conditions with biodiesel fuel blends. Prog. Energy Combust. Sci. 2012, 38, 691–715. [Google Scholar] [CrossRef]
- Moser, B.R. Biodiesel production, properties, and feedstocks. In Vitro Cell. Dev. Biol.-Plant 2009, 45, 229–266. [Google Scholar] [CrossRef]
- Sharma, Y.; Singh, B.; Upadhyay, S. Advancements in development and characterization of biodiesel: A review. Fuel 2008, 87, 2355–2373. [Google Scholar] [CrossRef]
- Daroch, M.; Geng, S.; Wang, G. Recent advances in liquid biofuel production from algal feedstocks. Appl. Energy 2013, 102, 1371–1381. [Google Scholar] [CrossRef]
- He, P.J.; Mao, B.; Shen, C.M.; Shao, L.M.; Lee, D.J.; Chang, J.S. Cultivation of Chlorella vulgaris on wastewater containing high levels of ammonia for biodiesel production. Bioresour. Technol. 2013, 129, 177–181. [Google Scholar] [CrossRef] [PubMed]
- Pancha, I.; Chokshi, K.; Maurya, R.; Trivedi, K. Salinity induced oxidative stress enhanced biofuel production potential of microalgae Scenedesmus sp. CCNM 1077. Bioresour. Technol. 2015, 189, 341–348. [Google Scholar] [CrossRef] [PubMed]
- Damiani, M.C.; Popovich, C.A.; Constenla, D.; Leonardi, P.I. Lipid analysis in Haematococcus pluvialis to assess its potential use as a biodiesel feedstock. Bioresour. Technol. 2010, 99, 3389–3396. [Google Scholar] [CrossRef]
- Huerlimann, R.; de Nys, R.; Heimann, K. Growth, lipid content, productivity, and fatty acid composition of tropical microalgae for scale-up production. Biotechnol. Bioeng. 2010, 107, 245–257. [Google Scholar] [CrossRef]
- Chisti, Y. Biodiesel from microalgae beats bioethanol. Biotechnol. Adv. 2007, 25, 294–306. [Google Scholar] [CrossRef]
- Su, Y.; Song, K.; Zhang, P.; Su, Y.; Cheng, J.; Chen, X. Progress of microalgae biofuel’s commercialization. Renew. Sustain. Energy Rev. 2017, 74, 402–411. [Google Scholar] [CrossRef]
- Halim, R.; Danquah, M.K.; Webley, P.A. Extraction of oil from microalgae for biodiesel production: A review. Biotechnol. Adv. 2012, 30, 709–732. [Google Scholar] [CrossRef]
- Chen, M.; Tang, H.; Ma, H.; Holland, T.C.; Ng, K.Y.S.; Salley, S.O. Effects of nutrients on growth and lipid accumulation in the green algae Dunaliella tertiolecta. Bioresour. Technol. 2011, 102, 1649–1655. [Google Scholar] [CrossRef]
- Hawrot-Paw, M.; Ratomski, P.; Koniuszy, A.; Golimowski, W.; Teleszko, M.; Grygier, A. Fatty Acid Profile of Microalgal Oils as a Criterion for Selection of the Best Feedstock for Biodiesel Production. Energies 2021, 14, 7334. [Google Scholar] [CrossRef]
- Yang, M.; Fan, Y.; Wu, P.C.; Chu, Y.D.; Shen, P.L.; Xue, S.; Chi, Z.Y. An Extended Approach to Quantify Triacylglycerol in Microalgae by Characteristic Fatty Acids. Front. Plant Sci. 2017, 8, 1949. [Google Scholar] [CrossRef]
- Maltsev, Y.; Maltseva, K. Fatty acids of microalgae: Diversity and applications. Rev. Environ. Sci. Biotechnol. 2021, 20, 515–547. [Google Scholar] [CrossRef]
- Ramos, M.J.; Fernández, C.M.; Casas, A.; Rodríguez, L.; Pérez, Á. Influence of fatty acid composition of raw materials on biodiesel properties. Bioresour. Technol. 2009, 100, 261–268. [Google Scholar] [CrossRef] [PubMed]
- Zhu, L.D.; Li, Z.H.; Hiltunen, E. Strategies for Lipid Production Improvement in Microalgae as a Biodiesel Feedstock. BioMed Res. Int. 2016, 2016, 8792548. [Google Scholar] [CrossRef]
- Yusof, Y.A.M.; Basari, J.M.H.; Mukti, N.A.; Sabuddin, R.; Muda, A.R.; Sulaiman, S.; Makpol, S.; Ngah, W.Z.W. Fatty acids composition of microalgae Chlorella vulgaris can be modulated by varying carbon dioxide concentration in outdoor culture. Afr. J. Biotechnol. 2011, 10, 13536–13542. [Google Scholar]
- Jungmin, K.G.Y.; LEE, H.; Lim, J.; Kim, K.; Woong, K.C.; Park, M.S.; Yang, J.W. Methods of downstream processing for the production of biodiesel from microalgae. Biotechnol. Adv. 2013, 31, 862–876. [Google Scholar]
- Atadashi, I.M.; Aroua, M.K.; Aziz, A.A. High quality biodiesel and its diesel engine application: A review. Renew. Sustain. Energy Rev. 2010, 14, 1999–2008. [Google Scholar] [CrossRef]
- Brennan, L.; Owende, P. Biofuels from microalgae—A review of technologies for production, processing, and extractions of biofuels and co-products. Renew. Sustain. Energy Rev. 2010, 14, 557–577. [Google Scholar] [CrossRef]
- Mandal, S.; Mallick, N. Biodiesel production by the green microalga Scenedesmus obliquus in a recirculatory aquaculture system. Appl. Environ. Microbiol. 2012, 78, 5929–5934. [Google Scholar] [CrossRef]
- Subramaniam, M.; Solomon, J.M.; Nadanakumar, V.; Anaimuthu, S.; Sathyamurthy, R. Experimental investigation on performance, combustion and emission characteristics of DI diesel engine using algae as a biodiesel. Energy Rep. 2020, 6, 1382–1392. [Google Scholar] [CrossRef]
- Rehman, M.; Kesharvani, S.; Dwivedi, G. Numerical Investigation of Performance, Combustion, and Emission Characteristics of Various Microalgae Biodiesel on CI Engine. Fuels 2023, 4, 132–155. [Google Scholar] [CrossRef]
- Joshi, M.P.; Thipse, S.S. Combustion analysis of ci engine fuelled with algae biofuel blends. Therm. Eng. 2019, 5, 214–220. [Google Scholar] [CrossRef]
- Al-lwayzy, S.H.; Yusaf, T. Chlorella protothecoides Microalgae as an Alternative Fuel for Tractor Diesel Engines. Energies 2013, 6, 766–783. [Google Scholar] [CrossRef]
- Jones, M.W.; Peters, G.P.; Gasser, T.; Andrew, R.M.; Schwingshackl, C.; Gütschow, J.; Houghton, R.A.; Friedlingstein, P.; Pongratz, J.; Le Quéré, C. National contributions to climate change due to historical emissions of carbon dioxide, methane, and nitrous oxide since 1850. Sci. Data 2023, 10, 155. [Google Scholar] [CrossRef]
- Ighalo, J.O.; Dulta, K.; Kurniawan, S.B.; Omoarukhe, F.O.; Ewuzie, U.; Eshiemogie, S.O.; Ojo, A.U.; Abdullah, S.R.S. Progress in Microalgae Application for CO2 Sequestration. Clean. Chem. Eng. 2022, 3, 100044. [Google Scholar] [CrossRef]
- Cheah, W.Y.; Show, P.L.; Chang, J.S.; Ling, T.C.; Juan, J.C. Biosequestration of atmospheric CO2 and flue gas-containing CO2 by microalgae. Bioresour. Technol. 2015, 184, 190–201. [Google Scholar] [CrossRef] [PubMed]
- Singh, U.B.; Ahluwalia, A.S. Microalgae: A promising tool for carbon sequestration. Mitig. Adapt. Strateg. Glob. Chang. 2013, 18, 73–95. [Google Scholar] [CrossRef]
- Iglina, T.; Iglin, P.; Pashchenko, D. Industrial CO2 Capture by Algae: A Review and Recent Advances. Sustainability 2022, 14, 3801. [Google Scholar] [CrossRef]
- Sarwer, A.; Hamed, S.M.; Osman, A.I.; Jamil, F.; Al-Muhtaseb, A.H.; Alhajeri, N.S.; Rooney, D.W. Algal biomass valorization for biofuel production and carbon sequestration: A review. Environ. Chem. Lett. 2022, 20, 2797–2851. [Google Scholar] [CrossRef]
- Jehlee, A.; Rodjaroen, S.; Waewsak, J.; Reungsang, A.; O-Thong, S. Improvement of biohythane production from Chlorella sp. TISTR 8411 biomass by co-digestion with organic wastes in a two-stage fermentation. Int. J. Hydrogen Energy 2019, 44, 17238–17247. [Google Scholar] [CrossRef]
- Oumer, A.; Hasan, M.; Baheta, A.T.; Mamat, R.; Abdullah, A. Bio-based liquid fuels as a source of renewable energy: A review. Renew. Sustain. Energy Rev. 2018, 88, 82–98. [Google Scholar] [CrossRef]
- Karishma, S.; Saravanan, A.; Kumar, P.S.; Rangasamy, G. Sustainable production of biohydrogen from algae biomass: Critical review on pretreatment methods, mechanism and challenges. Bioresour. Technol. 2022, 366, 128187. [Google Scholar] [CrossRef]
- Bleta, R.; Schiavo, B.; Corsaro, N.; Costa, P.; Giaconia, A.; Interrante, L.; Monflier, E.; Pipitone, G.; Ponchel, A.; Sau, S.; et al. Robust Mesoporous CoMo/γ-Al2O3 Catalysts from Cyclodextrin-Based Supramolecular Assemblies for Hydrothermal Processing of Microalgae: Effect of the Preparation Method. Appl. Mater. Interfaces 2018, 10, 12562–12579. [Google Scholar] [CrossRef]
- Arora, P.; Chance, R.R.; Hendrix, H.; Realff, M.J.; Thomas, V.M.; Yuan, Y. Greenhouse Gas Impact of Algal Bio-Crude Production for a Range of CO2 Supply Scenarios. Appl. Sci. 2021, 11, 11931. [Google Scholar] [CrossRef]
- Mathimani, T.; Senthil, K.T.; Chandrasekar, M.; Uma, L.; Prabaharan, D. Assessment of fuel properties, engine performance and emission characteristics of outdoor grown marine Chlorella vulgaris BDUG 91771 biodiesel. Renew. Energy 2017, 105, 637–646. [Google Scholar] [CrossRef]
- Hariprakash, S.R.; Prakash, T. A Review on Microalgae Biofuel Production and use in CI Engine Applications. Nat. Environ. Pollut. Technol. 2021, 21, 1531–1541. [Google Scholar] [CrossRef]
- Piloto-Rodríguez, R.; Sánchez-Borroto, Y.; Melo-Espinosa, E.A.; Verhelst, S. Assessment of diesel engine performance when fueled with biodiesel from algae and microalgae: An overview. Renew. Sustain. Energy Rev. 2017, 69, 833–842. [Google Scholar] [CrossRef]
- PN-ISO 15550; Reciprocating Internal Combustion Engines—Determination and Method of Measuring Engine Power—General Requirements. Polish Committee for Standardisation: Warsaw, Poland, 2009. Available online: https://sklep.pkn.pl/pn-iso-15550-2009p.html (accessed on 9 March 2023).
- PN-ISO 3046-1; Reciprocating Internal Combustion Engines—Performance—Part 1: Declaration of Power, Fuel and Lubricating Oil Consumption and Test Methods—Additional Requirements for General Purpose Engines. Polish Committee for Standardisation: Warsaw, Poland, 2009. Available online: https://sklep.pkn.pl/pn-iso-3046-1-2009p.html (accessed on 9 March 2023).
- PN-ISO 3046-3; Reciprocating Internal Combustion Engines—Performance—Part 3: Test Measurements. Polish Committee for Standardisation: Warsaw, Poland, 2009. Available online: https://sklep.pkn.pl/pn-iso-3046-3-2009p.html (accessed on 9 March 2023).
- PN-ISO 3046-5; Reciprocating Internal Combustion Engines—Performance—Part 5: Torsional Vibrations. Polish Committee for Standardisation: Warsaw, Poland, 2009. Available online: https://sklep.pkn.pl/pn-iso-3046-5-2009p.html (accessed on 9 March 2023).
- PN-ISO 8178-1; Reciprocating Internal Combustion Engines—Exhaust Emission Measurement—Measurement of Gaseous Components and Particulate Emissions on a Test Stand. Polish Committee for Standardisation: Warsaw, Poland, 1999. Available online: https://sklep.pkn.pl/pn-en-iso-8178-1-1999p.html (accessed on 9 March 2023).
- PN-ISO 8178-6 2000; Reciprocating Internal Combustion Engines—Exhaust Emission Measurement—Part 6: Report of Measuring Results and Test. Polish Committee for Standardisation: Warsaw, Poland, 2000. Available online: https://sklep.pkn.pl/pn-en-iso-8178-6-2000p.html (accessed on 9 March 2023).
- Zhang, Z.; Li, J.; Tian, J.; Dong, R.; Zou, Z.; Gao, S.; Tan, D. Performance, combustion and emission characteristics investigations on a diesel engine fueled with diesel/ethanol/n-butanol blends. Energy 2022, 249, 123733. [Google Scholar] [CrossRef]
- Serrano, L.; Carvalho, P.; Bastos, D.; Pires, N. Effects on Performance, Efficiency, Emissions, Cylinder Pressure, and Injection of a Common-Rail Diesel Engine When Using a Blend of 15% Biodiesel (B15) or 15% Hydrotreated Vegetable Oil (HVO15) (No. 2023-01-0266); SAE Technical Paper; SAE International: Warrendale, PA, USA, 2023. [Google Scholar]
- Adaileh, W.M.; AlQdah, K.S. Performance of Diesel Engine Fuelled by a Biodiesel Extracted from A Waste Cocking Oil. Energy Procedia 2012, 18, 1317–1334. [Google Scholar] [CrossRef]
- Tüccar, G.; Aydın, K. Evaluation of methyl ester of microalgae oil as fuel in a diesel engine. Fuel 2013, 112, 203–207. [Google Scholar] [CrossRef]
- dos Reis, E.F.; Cunha, J.P.B.; Mateus, D.L.S.; Delmond, J.G.; Couto, R.F. Performance and emissions of a diesel engine-generator cycle under different concentrations of soybean biodiesel. Rev. Bras. Eng. Aagríc. Ambient. 2013, 17, 565–571. [Google Scholar]
- Siqueira, W.C.; Fernandes, H.C.; Teixeira, M.M.; Santos, N.T.S.; Abrahão, S.A. Desempenho na barra de tração de um trator agrícola de pneus, alimentado com misturas de óleo diesel e óleo de soja reutilizado. Rev. Ceres 2013, 60, 793–801. [Google Scholar] [CrossRef]
- Paula, V.R.D.; Barbosa, J.A.; Romanelli, T.L.; Volpato, C.E.S.; Salvador, N. Curvas de desempenho motor de um trator agrícola utilizando diferentes proporções de biodiesel de soja. Rev. Agrogeoambiental 2016, 8, 119–127. [Google Scholar] [CrossRef]
- Tarabet, L.; Loubar, K.; Lounici, M.S.; Hanchi, S.; Tazerout, M. Eucalyptus biodiesel as an alternative to diesel fuel: Preparation and tests on DI diesel engine. J. Biomed. Biotechnol. 2012, 10, 1155. [Google Scholar] [CrossRef]
- Khiari, K.; Awad, S.; Loubar, K.; Tarabet, L.; Mahmoud, R.; Tazerout, M. Experimental investigation of pistacia lentiscus biodiesel as a fuel for direct injection diesel engine. Energy Convers. Manag. 2016, 108, 392–399. [Google Scholar] [CrossRef]
- Murad, M.E.; Al-Dawody, M.F. Effect of microalgae biodiesel blending on diesel engine characteristics. Heat Transf. 2022, 51, 6616–6640. [Google Scholar] [CrossRef]
- Lebedevas, S.; Raslavičius, L. Prognostic Assessment of the Performance Parameters for the Industrial Diesel Engines Operated with Microalgae Oil. Sustainability 2021, 13, 6482. [Google Scholar] [CrossRef]
- Ahmed, A.; Campion, B.B.; Gasparatos, A. Biofuel development in Ghana: Policies of expansion and drivers of failure in the jatropha sector. Renew. Sustain. Energy Rev. 2017, 70, 133–149. [Google Scholar] [CrossRef]
- Vadivelu, T.; Ramanujam, L.; Ravi, R.; Vijayalakshmi, S.K.; Ezhilchandran, M. An Exploratory Study of Direct Injection (DI) Diesel Engine Performance Using CNSL—Ethanol Biodiesel Blends with Hydrogen. Energies 2023, 16, 415. [Google Scholar] [CrossRef]
- Kaya, T.; Taskiran, O. Evaluation of the Effects of Biodiesel on Emissions and Performance by Comparing the Result of the New European Drive Cycle and Worldwide Harmonized Light Vehicles Test Cycle. Energies 2018, 11, 2814. [Google Scholar] [CrossRef]
- El-Baz, F.K.; Gadb, M.; Abdoc, S.M.; Abedd, K.; Mattere, I.A. Performance and exhaust emissions of a diesel engine burning algal biodiesel blends. Int. J. Mech. Mechatron. Eng. 2016, 16, 151–158. [Google Scholar]
- Rajaeifar, M.A.; Tabatabaei, M.; Aghbashlo, M.; Hemayati, S.S.; Heijungs, R. Biodiesel Production and Consumption: Life Cycle Assessment (LCA) Approach. Biofuel Biorefin. Technol. 2018, 8, 161–192. [Google Scholar]
- Morales, M.; Collet, P.; Lardon, L.; Hélias, A.; Steyer, J.-P.; Bernard, O. Life-cycle assessment of microalgal-based biofuel. In Biofuels from Algae, 2nd ed.; Elsevier: Amsterdam, The Netherlands, 2019; pp. 507–550. [Google Scholar]
- Ferreira, A.F.; Baptista, P.; Silva, C. Analysis of Energy Consumption and CO2 Emissions of the Life Cycle of Biohydrogen Applied to the Portuguese Road Transportation Sector. In Proceedings of the 18th World Hydrogen Energy Conference 2010-WHEC 2010, Essen, Germany, 16–21 May 2010; pp. 42–50. [Google Scholar]
- Kwiatkowski, C.A.; Pawłowska, M.; Harasim, E.; Pawłowski, L. Strategies of Climate Change Mitigation in Agriculture Plant Production—A Critical Review. Energies 2023, 16, 4225. [Google Scholar] [CrossRef]
- Bilanovic, D.; Andargatchew, A.; Kroeger, T.; Shelef, G. Freshwater and marine microalgae sequestering of CO2 at different C and N concentrations–Response surface methodology analysis. Energy Convers. Manag. 2009, 50, 262–267. [Google Scholar] [CrossRef]
- Dębowski, M.; Michalski, R.; Zieliński, M.; Kazimierowicz, J. A Comparative Analysis of Emissions from a Compression–Ignition Engine Powered by Diesel, Rapeseed Biodiesel, and Biodiesel from Chlorella protothecoides Biomass Cultured under Different Conditions. Atmosphere 2021, 12, 1099. [Google Scholar] [CrossRef]
- Serrano, L.M.V. Análise Comparativa do Desempenho de Motores de Combustão Interna Quando Utilizam Biocombustíveis. Ph.D. Thesis, Faculdade de Ciências e Tecnologia, Universidade de Coimbra, Coimbra, Portugal, 2012. [Google Scholar]
- Armas, O.; García-Contreras, R.; Ramos, Á. Impact of alternative fuels on performance and pollutant emissions of a light duty engine tested under the new European driving cycle. Appl. Energy 2013, 107, 183–190. [Google Scholar] [CrossRef]
- Chen, H.; Xie, B.; Ma, J.; Chen, Y. NOx emission of biodiesel compared to diesel: Higher or lower? Appl. Therm. Eng. 2018, 137, 584–593. [Google Scholar] [CrossRef]
- Sharif, S.K.; Rao, B.N.; Jagadish, D. Comparative performance and emission studies of the CI engine with Nodularia Spumigena microalgae biodiesel versus different vegetable oil derived biodiesel. Appl. Sci. 2020, 2, 858. [Google Scholar] [CrossRef]
- Wahlen, B.D.; Morgan, M.R.; McCurdy, A.T.; Willis, R.M.; Morgan, M.D.; Dye, D.J.; Bugbee, B.; Wood, B.D.; Seefeldt, L.C. Biodiesel from microalgae, yeast, and bacteria: Engine performance and exhaust emissions. Energy Fuels 2013, 27, 220–228. [Google Scholar] [CrossRef]
Disclaimer/Publisher’s Note: The statements, opinions and data contained in all publications are solely those of the individual author(s) and contributor(s) and not of MDPI and/or the editor(s). MDPI and/or the editor(s) disclaim responsibility for any injury to people or property resulting from any ideas, methods, instructions or products referred to in the content. |
© 2023 by the authors. Licensee MDPI, Basel, Switzerland. This article is an open access article distributed under the terms and conditions of the Creative Commons Attribution (CC BY) license (https://creativecommons.org/licenses/by/4.0/).