Article

A Health-Aware Energy Storage Sharing Mechanism for a Renewable Energy Base

1
State Grid Gansu Electric Power Company, Lanzhou 730030, China
2
State Grid Gansu Electric Power Research Institute, Lanzhou 730070, China
3
School of Electrical and Electronic Engineering, North China Electric Power University, Beijing 102206, China
*
Author to whom correspondence should be addressed.
Energies 2023, 16(14), 5356; https://doi.org/10.3390/en16145356
Submission received: 14 June 2023 / Revised: 8 July 2023 / Accepted: 11 July 2023 / Published: 13 July 2023
(This article belongs to the Topic Advances in Renewable Energy and Energy Storage)

Abstract

:
With the increasing global demand for renewable energy (RE), the growing share of new energy sources has become an inevitable trend. However, due to the uncertainty and fluctuation of renewable energy generation, this poses challenges to the stability of the power system. To mitigate the volatility of wind power output, ensure reliable power supply, and improve energy storage utilization, shared energy storage (SES) can be deployed in renewable energy bases (REBs) to alleviate the pressure on the power supply. However, electrochemical energy storage (EES) faces issues such as lifespan degradation and maintenance cost allocation. In this regard, this paper establishes an EES characterization model considering the dynamic degradation characteristics of batteries and analyzes the coupled relationship between lifespan degradation laws and key parameters in SES operation. Additionally, to assess the impact of electrochemical energy storage’s dynamic degradation characteristics on energy capacity allocation and operational strategies, an optimization model for SES in REBs is developed. Building upon this, a cost allocation mechanism is designed based on the marginal contribution in both the day-ahead and the real-time markets to address the differing demands for SES among different units within the REBs. Case studies are conducted to validate the rationality of the proposed optimization model for SES in REBs and the adaptability of the cost allocation mechanism. The results provide valuable insights for practical applications.

1. Introduction

With the implementation of the dual-carbon target, it has become clear that large-scale renewable energy generation, specifically through wind and photovoltaic power, is the direction and necessary choice for new power systems in the future [1,2,3]. To achieve the strategic goals of building a new power system, China has proposed to further build REBs to facilitate the high-quality and rapid development of RE. The “14th Five-Year Plan for China’s Economic and Social Development and the Long-Range Objectives through the Year 2035” released in March 2021 proposes to focus on developing nine clean energy bases and four offshore wind power bases during the duration of the 14th Five-Year Plan. In June 2022, the National Development and Reform Commission and nine other departments issued the “14th Five-Year Plan for the Development of RE”, which explicitly proposes active steps to promote the development of wind and solar power generation facilities, and expedite the construction of large-scale REB projects, with a particular emphasis on desert, Gobi, and other barren regions [4,5,6]. However, the “anti-peak” characteristic of wind power and the weather impact on photovoltaic power generation have increased volatility of the net load curve, which imposes higher requirements on flexible resources for the new power system. Several provinces have implemented policies mandating that RE plants install a specific percentage of ES to reduce the influence of RE integration on the safety and stability of the power grid. The integration of energy storage systems with renewable energy sources addresses the mismatch between renewable energy generation and load demand and reduces the uncertainty of renewable energy output, thereby enhancing the overall operational efficiency of the grid, lowering power supply costs, improving system stability, and enhancing power quality [7,8,9].
Due to the instability of RE, ES is needed to improve the total efficiency and stability of the power grid, reduce electricity supply costs, and enhance the utilization rate of RE. Currently, EES is the main ES technology, and its application has become increasingly widespread as its technology continues to develop and costs continue to decline [10]. Nevertheless, when ES is solely coupled with REBs, its usage rate is comparably low, making it challenging to recoup the expenses of ES, particularly in the present scenario where raw material costs are surging while RE project prices continue to fall [11,12]. The utilization rate of ES will further decrease when coupled solely with REBs, thereby hindering the promotion of the development of RE. To address the low utilization rate and poor economics of ES paired only with REBs, SES can provide an effective solution. By using SES, ES expenses can be reduced and utilization rates can be increased, thereby better supporting the development of RE [13,14,15].
A large-scale REB is composed of multiple wind and photovoltaic units, as well as their collection and transmission networks. Essentially, configuring SES for REBs means meeting the ES needs of various RE units within the base. Therefore, we need to consider the differences in ES needs of different RE units within the base to achieve fair distribution of ES costs. The core of the SES mechanism for REBs is how to quantify the contribution of SES to the ES capacity requirements of various RE units and then share the cost of SES accordingly [7]. Several studies have been conducted on the modes of operation for SES and cost allocation among RE units. Some researchers have investigated the impact of performance quality and prediction errors of renewable energy units on the demand for energy storage capacity and the allocation of energy storage costs [16]. Ref. [17] proposed a wind power cluster and SES coordination optimization mechanism, and allocated the benefits of each member of the alliance to demonstrate that the coordination optimization mechanism is conducive to reducing operating costs of each member and ensuring fairness of benefit distribution. In [18], a novel non-cooperative game mechanism is proposed, which optimally regulates the operation of distributed generation and flexibility resources by considering economic factors and electric power quality. Ref. [19] introduced a new two-stage credit-based model for SES which, considering time accumulation effects, developed an SES pricing strategy and a capacity planning scheme, and demonstrated the advantages of the proposed novel shared model in the field of economic efficiency and the utilization rate of ES. The research results indicate that SES has enormous potential value, not only for configuring SES in REBs but also for applying SES to various links in the power supply chain. Ref. [20] aimed to examine the real advantages of implementing SES in residential neighborhoods, established optimization operation models for independent and SES, compared and analyzed the optimal energy operations of the two, and developed an efficient control strategy suitable for the use of SES to demonstrate the advantages of SES in saving electricity costs and improving the ES utilization rate. Some studies have also proposed transactional operation mechanisms for energy storage systems based on non-cooperative game theory [21,22]. In [22], an interactive energy management scheme is defined for multiple SES systems and users to achieve information sharing. These studies have provided certain theoretical support and a decision-making basis for the formulation of SES modes among a considerable quantity of RE units within a large REB. Existing research has primarily focused on optimal capacity allocation and economic benefits of SES among renewable energy units while neglecting the impact of cost allocation mechanisms on the sustainable operation of SES. Therefore, this paper formulates a fair cost allocation mechanism considering the differential ES demands of each renewable energy unit within the base, aiming to achieve equitable distribution of ES costs.
EES, mainly consisting of energy storage batteries, is one of the most economically advantageous ES technologies among existing RE storage technologies. However, it should be noted that EES has the characteristic of dynamic degradation of its lifespan. Although SES operation modes can improve ES utilization rate, they can accelerate the degradation of the lifespan of EES. However, in the research on SES for renewable energy integration currently, the influence of shared operation on energy storage battery lifespan degradation is often overlooked or simplified. For instance, some studies consider the working efficiency of energy storage batteries as a constant value, disregarding the dynamic changes in charging and discharging efficiencies [23,24]. However, in actual operation, energy storage batteries experience dynamic changes in charging and discharging efficiencies due to power losses generated during operation to meet load demand [25,26]. Additionally, to simplify the complex degradation variations in practical operation, certain studies assume the same degree of lifespan degradation under different operating conditions, without accounting for the nuanced degradation of ES capacity under different operational scenarios [27]. However, it is clear that the lifespan of EES will gradually shorten with changes in the state of charge (SOC) and the number of charging-and-discharging cycles. To more accurately estimate the degradation of the lifespan of energy storage batteries, equivalent circuit models, empirical models, and aging mechanism models are currently mainly used [28]. Ref. [29] proposed a method to detect the decay of the available capacity of energy storage batteries using the discharge curve and capacity data based on a first-order Thevenin equivalent circuit model. Ref. [30] established a calendar aging model of energy storage batteries based on experimental data and quantified the impact of SOC, temperature, and battery operating time on the degree of battery life decay. Ref. [31] studied the dynamic performance changes of energy storage batteries under different environmental conditions in a residential photovoltaic energy storage battery system, and analyzed the impact of charging-and-discharging curves on battery aging. Moreover, existing research tends to focus on the lifespan degradation characteristics of distributed independent energy storage systems, lacking investigations on the impact of dynamic degradation characteristics of SES on system operation. This paper, however, conducts a refined analysis of the dynamic degradation characteristics in the actual operation of EES.
Moreover, due to the diverse output characteristics of different renewable energy units, there are variations in the capacity requirements for SES. Existing research has primarily focused on optimal capacity allocation and economic benefits of SES among renewable energy units while neglecting the impact of cost allocation mechanisms on the sustainable operation of SES. To analyze the influence of dynamic degradation characteristics on the operational strategies and capacity allocation of electrochemical shared energy storage in REBs, and to address the issue of uneven cost allocation resulting from differences in ES capacity requirements, this paper presents a refined modeling of SES lifespan degradation. Building upon the health status of EES, known as the state of health (SoH), this research investigates the optimization of operational strategies and cost allocation mechanisms for SES in REBs by considering dynamic degradation characteristics. The main innovations can be summarized in the following three aspects:
  • This paper refines the coupling relationship between the degradation laws and key parameters in the operation process of shared energy storage, and establishes a refined degradation model for the operation of electrochemical energy storage sharing. This model can better reflect the changes in performance parameters such as shared energy storage charging and discharging efficiencies and state of health (SoH), thus quantifying the degree of degradation in the lifespan of shared energy storage. It also provides important theoretical support for the practical application of shared energy storage.
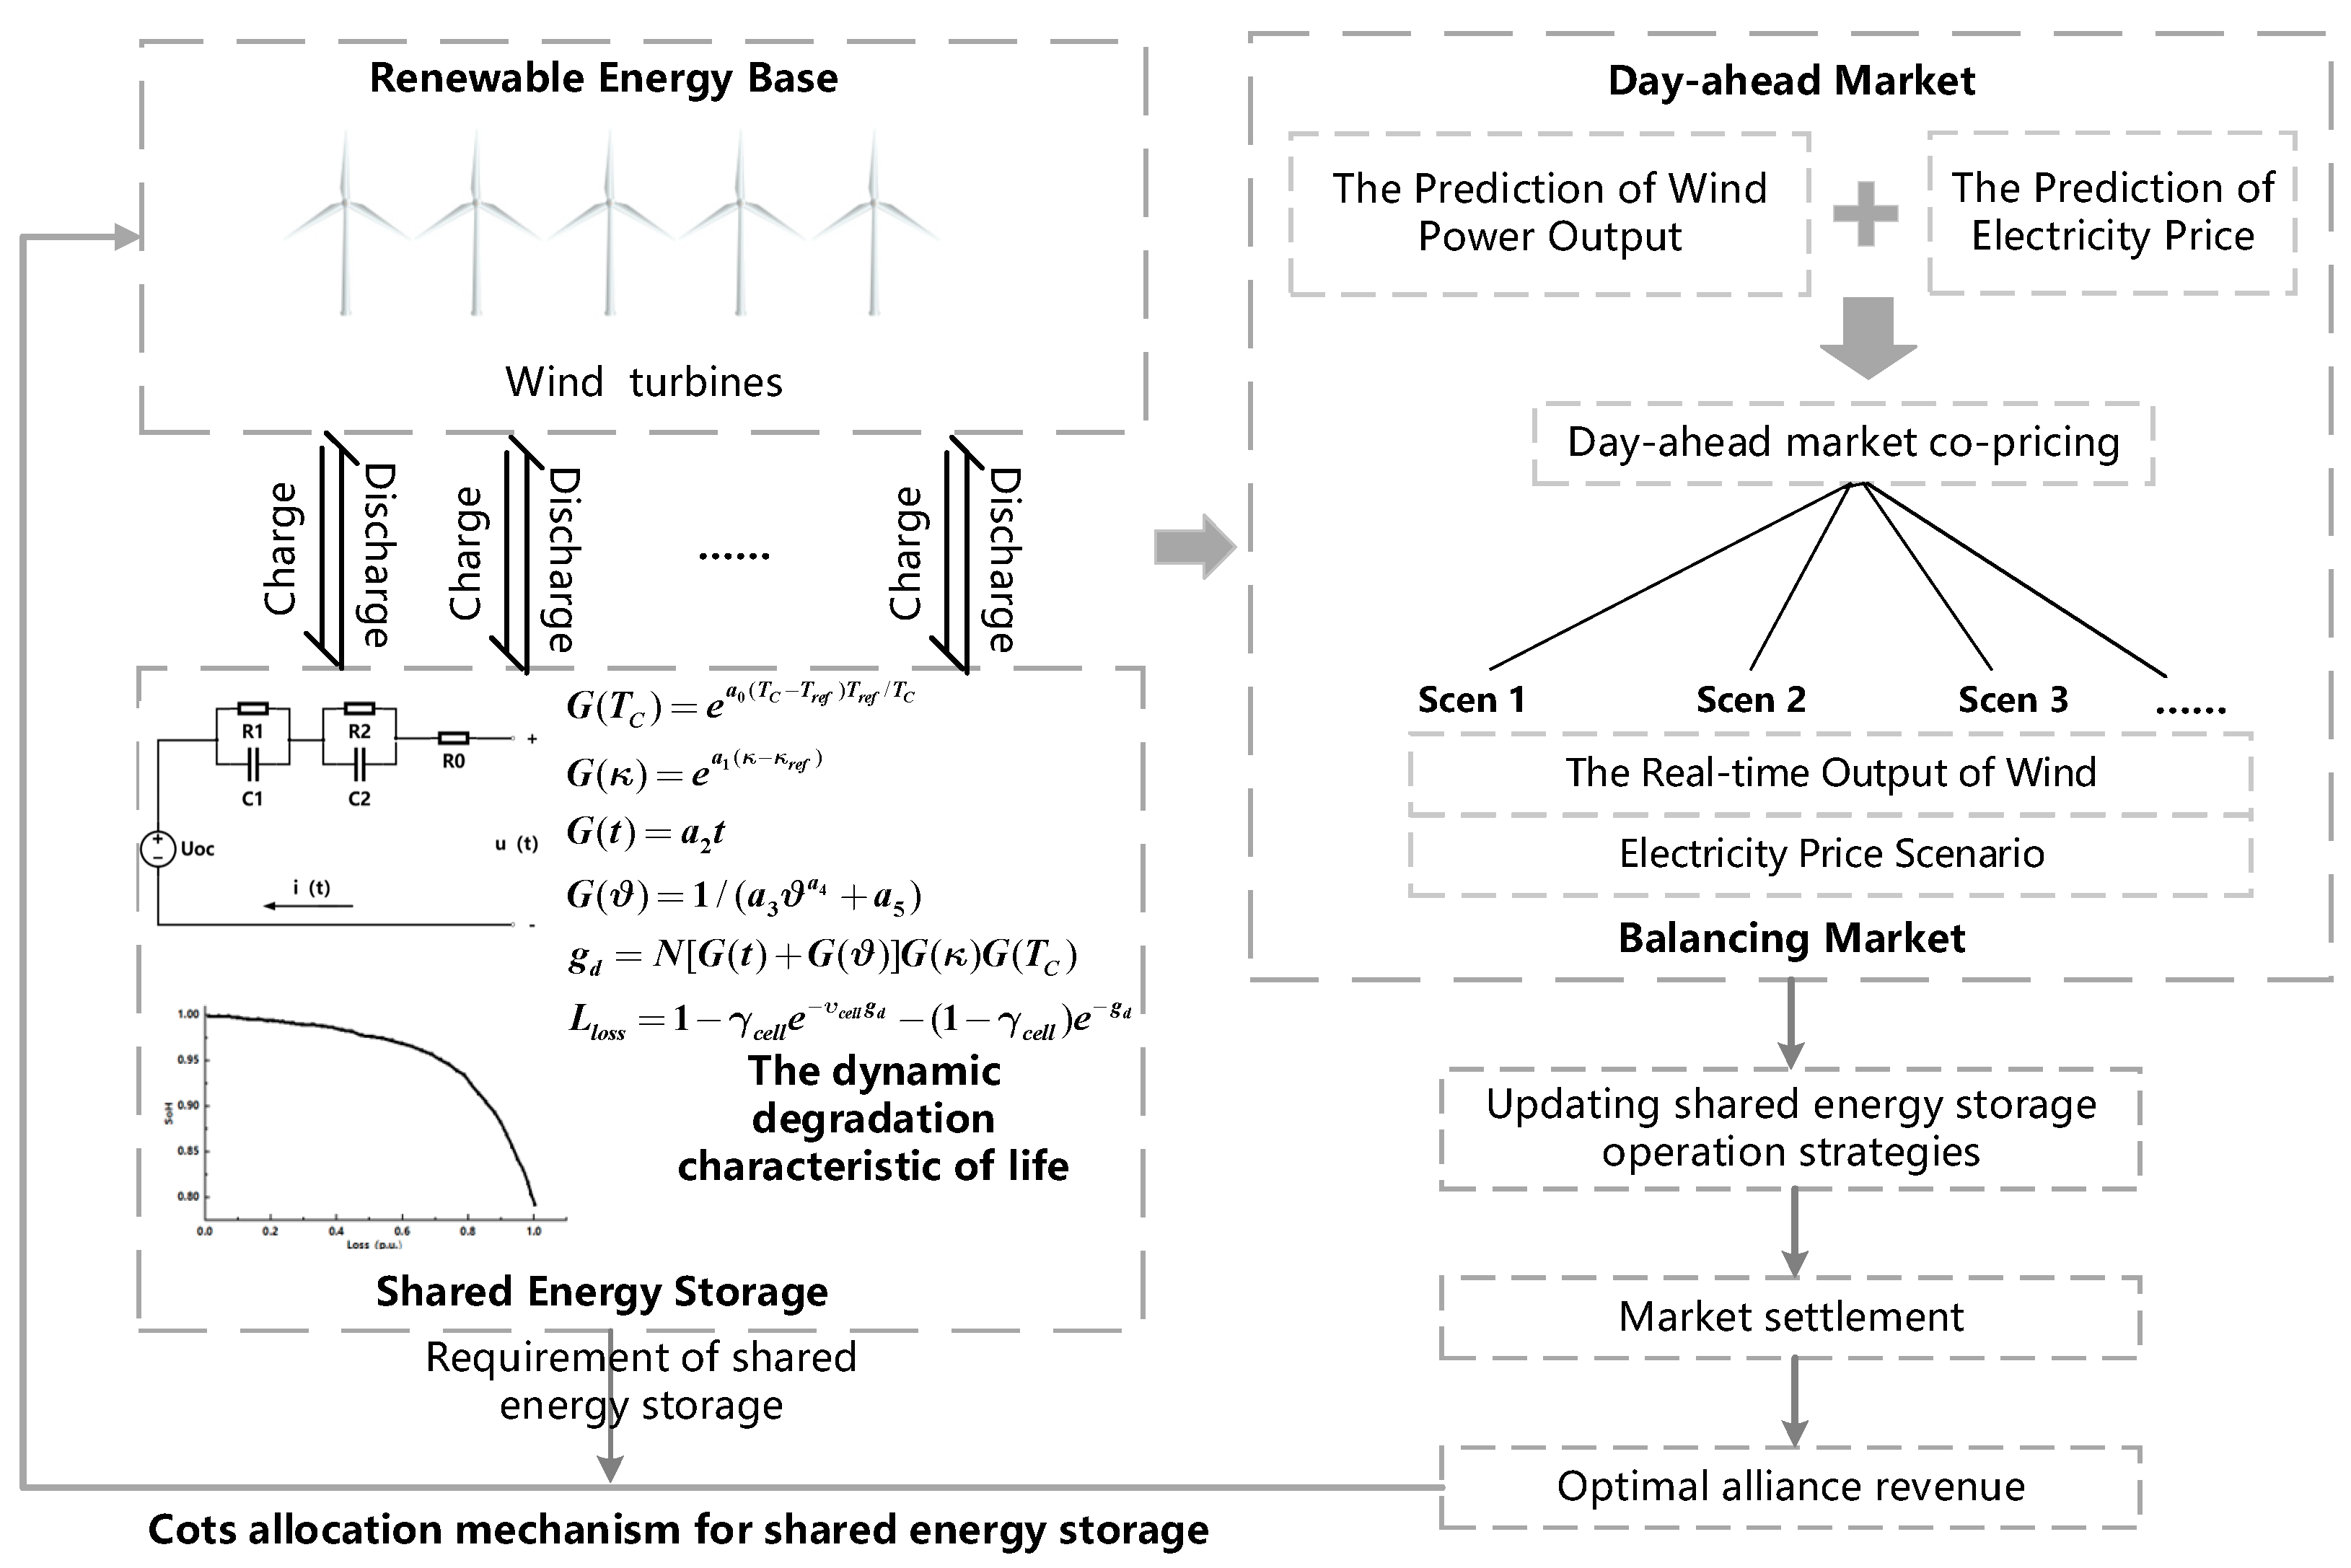
  • A renewable energy base–shared energy storage operation framework that considers dynamic lifespan degradation is designed. This framework fully utilizes the advantages of shared energy storage and enhances the profitability of various units within high renewable energy bases in the day-ahead market through “peak shaving and valley filling”. At the same time, it mitigates the uncertainty of wind power output and reduces the assessment cost of real-time balancing markets. The design of this framework can better promote the sustainable development of renewable energy generation.
  • A shared energy storage cost allocation mechanism is proposed for renewable energy bases based on the marginal contribution in both the day-ahead and the real-time market. This mechanism can meet the energy storage demands of different renewable energy generators and incentivize compatibility. The numerical results demonstrate a positive correlation between the shared energy storage costs allocated to different renewable energy generators and their corresponding energy storage demands. The implementation of this mechanism can better promote the coordinated optimization of renewable energy and shared energy storage operations, achieving a win-win situation.
The rest of this paper is structured in the following manner. The SES operation framework for a REB is proposed in Section 2. The refined model of dynamic life decay of EES is introduced in Section 3. In Section 4, an optimized operational approach for SES in a REB is presented, taking into account the dynamic degradation characteristics of EES. The SES cost allocation mechanism based on the marginal contribution in both the day-ahead and real-time markets is introduced in Section 5. Section 6 contains the conclusions and future prospects of this study.

2. Framework of Energy Storage Sharing

A two-stage optimal collaborative operation strategy for a REB and SES is proposed by combining day-ahead optimization and real-time optimization. This strategy includes two stages: during the first stage, the optimization of day-ahead scheduling is carried out, and each unit in the REB optimizes its day-ahead operation strategy based on the day-ahead output prediction data. In the second stage, the charging and discharging operation statuses of SES vary according to real-time electricity prices and the uncertainty of wind power output, then embedded it into the day-ahead optimization model of the first stage. Meanwhile, the dynamic degradation characteristics of the SES’s lifespan are taken into account, and the influence of battery health status changes on ES capacity allocation is considered. Considering the differential SES capacity demands of different units within the REB, this paper measures the contribution of each member to the overall alliance and allocates the investment and operational costs of SES among various renewable energy units within the base. This allocation is performed in a manner that reflects the varying needs of different units and ensures a fair distribution of the investment and operational costs associated with SES. This strategy aims to optimize the overall operation of the system, fully consider the uncertainty and fluctuations of wind power output in actual operation, and improve the efficiency and economic viability of RE generation. The Operation framework for energy storage sharing in a renewable energy base is shown in Figure 1.

3. Dynamic Degradation Model in Battery Energy Storage Sharing

To alleviate the impact of large-scale RE, such as wind and solar power, it may be necessary to frequently adjust the charge and discharge states of RE batteries and the power flow in and out of the grid. Therefore, the capacity degradation caused by the changes in charge and discharge behavior of RE batteries in a brief span of time cannot be ignored. It is necessary to consider the influence of changes in charge and discharge power on the performance and lifespan of ES devices. Therefore, the fine-grained dynamic degradation characteristics of EES are of great significance. In this section, the dynamic degradation characteristics of EES will be finely modeled to provide more theoretical support for the subsequent research on operation and cost allocation mechanisms of SES in REB.

3.1. Health-Aware Perception Model

The previous literature has used the SoH of an electrochemical battery to characterize its degree of life degradation. Within this segment, a health-aware perception model utilizing the battery’s equivalent circuit is established. Since the dual-polarization (DP) equivalent circuit model is superior to the Thevenin model in the field of balance estimation precision and calculative speed, the DP model has been chosen to characterize the SOH of the battery. The DP model is essentially a series circuit, consisting of a power source, internal resistance, and a second-order RC parallel circuit, shown in Figure 2 [32].
The spatial state equations for the DP equivalent circuit can be derived as follows:
u t = U o c u c 1 , t u c 2 , t i t R 0 i t = u c 1 , t R 1 + C 1 d u c 1 , t d t = u c 2 , t R 2 + C 2 d u c 2 , t d t
where  U o c  is the open circuit voltage,  R 0  is the internal resistance of the battery,  i t  is the internal current of the battery, and  u c 1 , t  and  u c 2 , t  represent voltage across the two RC circuits. By measuring the open circuit voltage and voltage across each RC circuit, the circuit current can be calculated using the spatial state equations. Battery capacity can then be calculated using Equation (2).
E S E S , t = E S E S , t 0 η S E S t 0 t i t d t
where  η S E S  is the Coulombic efficiency of the battery,  E S E S , t 0  represents the rated capacity of the battery at initial state,  E S E S , t  represents the capacity of the battery at time  t , and  t 0  represents the initial operating time of the battery. Based on the stored energy capacity, the SoH of the ES battery can be calculated.
The SoH of the ES battery at time  t   S O H t  is expressed as the present available capacity divided by the rated capacity at initial state, as follows:
S O H t = E S E S , t E S E S , t 0 × 100 %
As energy storage batteries undergo continuous charging-and-discharging cycles, internal aging occurs, resulting in increased internal resistance and decayed capacity. For a brand-new RE storage battery, its initial  S o H  is 1. When  S o H t  is lower than a certain value  δ  or the internal resistance of the battery increases to more than twice the initial resistance, the energy storage battery should be dismantled and recycled. Therefore, the final state of health for the battery is  δ , which is set to 0.8 in this paper [33,34,35]. Thus, the  S o H t  and internal resistance of energy storage batteries are subject to the following constraints:
S O H t δ Z t 2 Z s t a r t
where  Z t  is the internal resistance of the battery at time  t . The relationship between SoH and battery internal resistance can be further established using DP equivalent circuits, which facilitates the determination of whether the battery is still suitable for ES based on its internal resistance, as shown below:
Z t = Z s t a r t + S O H t 0 S O H t S O H t 0 S O H t N ( Z e n d Z s t a r t )
where  S O H t 0  and  S O H t N , respectively, represent the initial and final health status of the battery during its lifespan,  Z s t a r t  and  Z e n d  are the battery’s resistance at the beginning and end of the entire lifespan, respectively, and  t N  is the end time of the battery’s lifespan.
In addition, the relationship between the maximum power output  P t  of a battery at a certain moment and its SoH can be derived from DP equivalent circuits, as shown in Equation (6):
P t = Z s t a r t Z t P 0
where  P 0  refers to the maximum power output that the battery can produce at the initial state.

3.2. Energy Storage Battery Life Degradation Model

The life degradation of ES batteries is influenced by various external stress factors, such as temperature and operating time, and is also affected by the battery’s life status. Therefore, its degradation can be considered as a nonlinear process that is the result of the combined effect of external stress and time by establishing a nonlinear life degradation model that can be decomposed into multiple stress factor models.
The life degradation caused by calendar aging  L c a l , can be considered as a function of the average state of charge  S o c κ ¯ , battery average temperature  T c ¯ , and time  t .
L c a l = g t ( κ ¯ , t , T C ¯ )
Each charge and discharge cycle of the battery results in life degradation. The cumulative life degradation is obtained by adding up life degradation of each cycle.
L c y c = t = 1 N ω t g c ( κ t , ϑ t , T c )
where  L c y c , l o s s  refers to the life degradation caused by cycle aging;  ϑ t  represents the depth of discharge of the battery in the  t -th cycle; and  ω t  is a 0–1 variable that characterizes the operating state of the battery in the cycle t, with a value of 1 indicating that the battery is in a cyclic charging-and-discharging state and 0 indicating that the battery is not undergoing charging and discharging, during which the life degradation of the battery only includes the life degradation caused by calendar aging. The life degradation of the entire lifetime of the battery can be represented as the function  g d  of  κ , t , T c , ϑ :
g d ( κ , t , T C , ϑ ) = g t ( κ ¯ , t , T C ¯ ) + t = 1 N ω t g c ( κ t , ϑ t , T c )
If cycles are identical, in a single cycle, the average temperature and SOC equals the overall averages of the battery lifetime, thus  T c ¯ = T c , κ ¯ = κ . Equation (8) can be simplified as shown below:
g d ( κ , t , T C , ϑ , N ) = N g d ( κ , t , T C , ϑ , 1 ) = N g d , 1
where  g d κ , t , T c , ϑ , 1  is denoted as  g d , 1 , which represents the life degradation during a single cycle, and  N  is the number of charge and discharge cycles.
The life degradation caused by calendar aging and cycle aging can be expressed in a product form of multiple linear stress factor models as follows:
g d , 1 = [ G ( t ) + G ( ϑ ) ] G ( κ ) G ( T C )
(1) The temperature stress model:
G ( T C ) = e a 0 ( T C T r e f ) T r e f T C
(2) The state-of-charge stress model:
G ( κ ) = e a 1 ( κ κ r e f )
(3) The time stress model:
G ( t ) = a 2 t
(4) The depth-of-discharge stress model:
G ( ϑ ) = 1 a 3 ϑ a 4 + a 5 ϑ t = P t c h + P t d i s 2 E c , t
where  a 0  represents the temperature stress coefficient;  T r e f  refers the reference temperature in Kelvin (K);  a 1  is the SOC stress coefficient;  κ r e f  is the reference SOC, which can be generally taken as 0.4–0.5;  a 2  is the time stress coefficient, indicating that after excluding factors such as temperature and life dependence, the degradation rate has a linear relationship with time;  P c h t  and  P d i s t  represent the charging and discharging powers of the battery during the t-th cycle, respectively; and  a 3 a 4 , and  a 5  are stress coefficients about DOD.
According to the empirical formula [30], the life degradation of an energy storage battery can be calculated as follows:
L l o s s = 1 γ c e l l e υ c e l l g d ( 1 γ c e l l ) e g d
where  L l o s s  represents the life degradation of the battery over its entire life cycle (pu), and  γ c e l l  and  ν c e l l  are parameters related to the formation process of SEI film.

3.3. Dynamic Efficiency Model for Energy Storage Batteries

3.3.1. Segmented Linearization of Power for EES Batteries

At any given time, the operating power of the battery  P t  satisfies the following equation:
P c , t = P t c h + P t d i s
However, it is impossible for one battery to charge and discharge simultaneously at any given time, and one of  P t c h  or  P t d i s  must be zero. The dynamic behavior of the battery is simulated using the aforementioned DP equivalent circuit model, and the relationship between the battery SoH and internal resistance is calculated. The charge–discharge cycles of the battery will cause dynamic changes in its SoH and internal resistance, resulting in dynamic changes in the operational efficiency during different periods. To simplify the model, the charging and discharging power of the battery are segmented and linearized separately. If the charging power is divided into  M 1  segments, it satisfies:
P t c h = m = 1 M 1 P c m , t
P c m min ω c , m , t P c m , t P c m max ω c , m , t , m = 1 , 2 , , M 1
where  P c m m a x  and  P c m m i n  are the maximum and minimum of the charging power for the segment, respectively, and  ω c , m , t  is a 0–1 state variable that characterizes the charging state at time  t , where a value of 1 indicates that the charging power is within the  m th segment.
m = 1 M 1 ω c , m , t = 1
The above equation indicates that the battery charging power can only be within one power segment at any given moment. Similarly, for the discharging power, it is divided into  M 2  segments, which satisfies:
P t d i s = j = 1 M 2 P c j , t
P c j , t min π c , j , t P c j , t P c j , t max π c , j , t , j = 1 , 2 , , M 2
j = 1 M 2 π c , j , t = 1
where  P c j , t m a x  and  P c j , t m i n  are the maximum and minimum of the discharging power for the  j -th segment of the battery, respectively, and  π c , j , t  is a 0–1 state variable that characterizes the discharging power at  t , where a value of 1 indicates that the discharging power is within the  j -th segment.

3.3.2. Storage Capacity of EES Batteries

After the time  t , the incremental capacity of the battery is as follows:
Δ E c , t = [ m = 1 M 1 P c m , t η c m c h + 1 η c j d i s j = 1 M 2 P c j , t ] Δ t
Δ E c , t = E c , t 1 E c , t
E c min E c , t E c max
where  η c j c h  and  η c j d i s  refer to the charging and discharging efficiencies of the m-th segment, respectively, and  E c m i n  and  E c m a x  are the minimal and maximal battery capacity, respectively.

4. Shared Energy Storage Operation Model

In this section, we investigate the optimal strategy for the joint operation of RE units containing multiple wind turbines and SES, considering the dynamic degradation characteristics.

4.1. Objective Function

The objective function is to maximize profit, which comprises the revenue of the day-ahead electricity market and real-time electricity market, and the total cost of SES.
max t ϕ T ( R t D A + R t B A C t s u m )
where  R t D A  denotes the day-ahead market revenue at time  t R t B A  denotes the real-time market revenue at time  t , and  C t s u m  denotes the total cost of SES at time  t .
The day-ahead energy market (DEM) revenue  R t D A  and real-time energy market (REM) revenue  R t B A  can be expressed as follows:
R t D A = λ t D A P t D A
R t B A = λ t d o w n P t d o w n λ t u p P t u p
λ t d o w n = ϕ d o w n λ t D A , λ t u p = ϕ u p λ t D A
where  λ t D A  is the DEM price at time  t P t D A  is the total power in the DEM at time  t P t d o w n  and  P t u p  represent the positive and negative power imbalance at time  t  respectively;  λ t d o w n  and  λ t u p  are the settlement prices for the positive and negative imbalances of electricity quantities in the balancing market, respectively; and  ϕ d o w n  and  ϕ u p  are the penalty factors corresponding to positive and negative imbalances of electricity quantities, respectively.
The total cost of SES  C t s u m  is expressed as Equation (33), and  C t s u m  includes the investment cost of SES and its degradation cost, as follows:
C t a t = C t i n v L l o s s , t 24 × ( 1 40 % )
C t i n v = γ ( 1 + γ ) y ( 1 + γ ) y 1 × c P S E S P max S E S + c E S E S E S E S T × 365
C t s u m = C t i n v + C t a t
where  T  is all the dispatch cycle number of SES within one day, and  L l o s s , t  is the lifespan degradation rate of EES batteries during period  t . Typically, when the health status of a lithium-ion battery drops below 80%, the battery’s utilization rate cannot meet the ES requirements and it should be recycled.  C t i n v  is the SES investment cost,  γ  refers to the annual percentage rate of funds,  y  is the lifespan of the SES device,  c P S E S  and  c E S E S  are the unit cost prices of shared energy per unit power and unit capacity, respectively,  P m a x S E S  is the maximum power of the SES, and  E S E S  is the capacity of SES.
The above utilizes the concept of unitized cost, which converts ES replacement cost into cost per unit charge–discharge capacity, in order to obtain the ES degradation cost at each moment.

4.2. Constraints

In this paper, the wind turbine units and the collaborative entity of the SES are selected to participate in the day-ahead energy DEM. Therefore, the total power in the DEM is equal to the sum of the day-ahead power outputs from the wind turbines and the energy storage unit. Similarly, when they participate in the REM, the total power in the REM is equal to the sum of the real-time power outputs from the wind turbines and the energy storage unit, as follows:
P t D A = P w i n d , t D A + P S E S , t D A
P δ B A = P w i n d , δ B A + P S E S , δ B A
where  P w i n d , t D A  is the wind power of the DEM at time  t P S E S , t D A  is the ES power of the DEM at time  t P δ B A  is the total power in the REM at time  t P w i n d , δ B A  is the wind power of the REM at time  δ , and  P S E S , δ B A  is the ES power of the REM at time  δ . The participation of the energy storage unit in the DEM is determined by both its charging power and discharging power. It is the difference between the discharging power and the charging power. Since the energy storage unit can only be in either a charging or discharging state at a given time t, when it is in the discharging state, it generates positive revenue from participating in the DEM. On the other hand, when it is in the charging state, it incurs negative revenue from participating in the DEM. Therefore, the day-ahead power of the energy storage unit participating in the market is the difference between the discharging power and the charging power. The same principle applies to the power of the energy storage unit participating in REM.
P S E S , t D A = P d i s , t D A P c h , t D A
P S E S , δ B A = P d i s , δ B A P c h , δ B A
where  P c h , t D A  is charging power of the DEM at time  t P d i s , t D A  is the ES discharging power of the DEM at time  t P c h , t B A  is the ES charging power of the REM at time  t , and  P d i s , t B A  is the ES discharging power of the REM at time  t . All four of these variables take non-negative values.
Constraints on the system are as follows:
(1) the constraints of wind power output are
0 P w i n d , t D A P s u m , t D A
0 P w i n d , δ B A P s u m , t B A
where  P s u m , t D A  represents the day-ahead forecasted total power for multiple wind turbines at time  t , and  P s u m , t B A  represents the real-time forecasted total power for multiple wind turbines at time  t .
(2) Energy storage capacity and power constraints: Equation (40) represents the constraint on the ES capacity. Equation (41) represents the minimal and maximal of the charging and discharging powers. Equation (42) restricts the device from charging and discharging energy simultaneously. Equation (43) denotes the energy balance constraint of the ES; it means that the charging-and-discharging capacity during the 24 h regulation process must maintain balance with the initial energy level.
0 E S E S , t D A E S E S , 0 E S E S , δ B A E S E S
0 P c h , t D A μ t c h P max S E S 0 P d i s , t D A μ t d i s P max S E S , 0 P c h , δ B A μ t c h P max S E S 0 P d i s , δ B A μ t d i s P max S E S
μ t c h a r + μ t d i s 1
E S E S , 0 D A = E S E S , T D A , E S E S , 0 B A = E S E S , T B A
where  E S E S , t D A  and  E S E S , t B A  represent the day-ahead and REM storage capacities at different times,  P m a x S E S  represents the maximum operational power of the SES,  μ t c h  and  μ t d i s  are 0–1 variables that represent the operation status of the ES at time  t , and  E S E S , T D A  and  E S E S , T B A  represent the DEM and REM storage capacities at the last time  t  of the day.
Additionally, the energy iteration relationship of the ES unit in the DEM and REM is shown in Equations (44) and (45):
E S E S , t + 1 D A = E S E S , t D A + P c h , t D A η t S E S P d i s , t D A / η t S E S , E S E S , 0 D A = 60 % E S E S  
E S E S , δ + 1 B A = E S E S , δ B A + ( P c h , δ B A η t S E S P d i s , δ B A / η t S E S ) Δ t   , δ [ t , t + 1 ]   , E S E S , 0 B A = 60 % E S E S
where  η t S E S  represents the working efficiency of the ES at time  t .
Taking into account the dynamic degradation characteristics of EES devices and using SoH as a medium, the changes in the performance parameters of ES are incorporated into the above constraints to reflect the influence of the degradation of ES life on the operation and benefits. The analysis in Section 3 reveals a nonlinear dependence between ES device parameters and SoH. To facilitate the optimization calculation, this nonlinear relationship is first linearized.
By using the idea of piecewise model linearization, the linear relationship between battery internal resistance  Z t  and SoH can be fitted as follows:
Z t = α S O H t + β
Substituting Equation (46) into the expression for ES charging and discharging powers yields.
P t , max S E S = Z s t a r t α S O H t + β P 0 , max S E S
Similarly, the expression for different segments of ES capacity can be uniformly linearized.
E S E S , t = a S O H t + b
We can substitute the ES parameter expressions obtained from Equations (47) and (48) into the constraints for ES power and capacity and update them on an hourly basis to account for the dynamic degradation characteristics of the ES device.
(3) Power balance constraints:
P w i n d , δ B A + g S E S , t d S E S , t P w i n d , t D A = P t d o w n P t u p
0 P t u p M 3 ( 1 z t )
0 P t d o w n M 4 z t
where  g S E S , t  and  d S E S , t  represent the charging and discharging quantities respectively, of the ES system,  z t  is a binary variable indicating the power imbalance status, and  M 3  and  M 4  are sufficiently large positive numbers.
Equations (27)–(51) are used to establish the coupling relationship between the DEM and REM of the alliance which is composed of REBs and SES.

5. Cost Allocation Mechanism of Shared Energy Storage

To ensure equitable distribution of investment costs for SES, this paper introduces the concept of a “revenue increase rate” as a measure to quantify the demand level of a REB for SES. This metric evaluates the number of occupied ES resources by the REB and the potential revenue that can be obtained. The analysis in this paper considers the market revenue of a REB, including electricity value and system flexibility, in both day-ahead and real-time balancing markets, and compares them with the benefits obtained when the REB participates individually in the market. Finally, the costs of the SES are allocated to each REB based on comprehensive revenue-increase-rate metrics for REB.

5.1. Electricity Value in the Day-Ahead Market

Before allocating the SES costs, it is essential to calculate the revenue obtained by each alliance member from selling electricity in the day-ahead market. The calculation method of this revenue is obtained by multiplying the declared power with the day-ahead market clearance price. To better solve the cost allocation problem, this paper uses the Vickrey–Clarke–Groves (VCG) mechanism, which is a widely used incentive-compatible mechanism for allocating social welfare [36]. In addition, this mechanism can help define the substitute value of SES for other electricity users. As multiple renewable energy base–energy storage systems jointly quoting can only obtain the alliance’s overall quotation curve, this paper analyzes the demand for SES by different REBs through the substitute value method to obtain individual quotation curves for each entity. This method indirectly obtains the individual quotation curves of each entity by comparing the changes in the alliance’s overall quotation curve, thereby better solving the cost allocation problem, as in Equation (52).
R D A , i , t WPP = t Γ λ t D A ( P D A , t C P D A , i , t C ) , i , j , t
where  R D A , i , t W P P  represents the revenue obtained by a certain REB in the DEM,  P D A , t C  represents the optimal day-ahead declared power obtained by the optimization model, and  P D A , i , t C  represents the optimal declared power corresponding to removing a specific REB.

5.2. Flexibility Value in the Real-Time Balancing Market

The revenue earned by the alliance members’ flexibility during real-time operations is known as the flexibility value in the REM, which is obtained by multiplying the respective imbalanced electricity quantity with the corresponding settlement price. When comparing the individual deviation direction with the system’s overall deviation direction, if they are opposite, this indicates that the member has alleviated the extent of system deviation, reduced the system’s demand for flexibility, and increased overall revenue. Then, the member’s revenue is positive. If the directions are the same, it indicates that the member has intensified the degree of system deviation, further increased the system’s demand for flexibility, and decreased overall revenue, and the member’s revenue is negative. Similar to measuring the energy value of each member in the DEM, we can extract the flexibility value of a member in the real-time market and represent the revenue of REB members in the real-time balancing market through the deviation that appears in the alliance as a whole, as shown in Equation (53):
R B A , i , t W P P = t Γ s Ω δ s ( λ s , t + ( P s , t C + P s , i , t C + ) + λ s , t ( P s , t C P s , i , t C ) ) , s , i , t
where  δ s  is the possibility of the scenario,  R B A , i , t W P P  refers to the revenue obtained by the REB in the real-time balancing market,  P s , t C +  and  P s , t C  represent the most effective methods for making bids of positive and negative imbalance power of the alliance, respectively, obtained by solving the above optimization model, and  P s , i , t C +  and  P s , i , t C  represent the positive and negative imbalance power of the alliance, respectively, corresponding to removing a specific wind power merchant.
Similarly, by measuring the revenue obtained by a REB’s individual participation in the market from both the day-ahead and real-time dimensions and comparing them with the revenue obtained after forming the alliance, the revenue increment of each REB in the alliance can be obtained, as shown in Equation (54).
Δ R i , t W P P = R D A , i , t W P P + R B A , i , t W P P R i , t , D W P P , i , t
where  R i , t W P P  represents the revenue increase in a certain REB in the alliance, and  R i , t , D W P P  represents the revenue obtained by this REB’s individual participation in the market.
Therefore, the revenue increase rate of each REB in the alliance’s joint bidding is the ratio of the total revenue increase in this member in the DEM and REM and the total revenue increase in all members in the alliance, as shown in Equation (55).
τ i WPP = t Γ T i , t W P P i M t Γ T i , t W P P , i , t
The main revenue improvement rate characterizes the proportion of the revenue that alliance members can obtain in the DEM and REM from two dimensions: the value of electricity energy and the value of flexibility. The coupling connection between the DEM and REM is established by the concept of imbalance power. Through the determination of penalty prices, a REB can be guided to overproduce or underproduce a certain amount of power in the DEM. SES can exert a controlling function over smoothing the power imbalance that arises as a result, thus achieving the goal of maximizing overall revenue. On this basis, the investment and depreciation costs of SES can be allocated according to the aforementioned revenue improvement rate, as shown in Equation (56).
C i W P P = C S E S τ i W P P , C S E S = C i n v + C a t
where  C i W P P  represents the SES cost that must be allocated to a certain REB, and  C S E S  represents the overall cost of SES.

6. Case Study

6.1. Data Description

In this case study, the alliance consists of 10 wind turbines and 1 shared energy storage, and the operational parameters of the SES are shown in Table 1. To model the wind power output uncertainty, this paper adjusted the real electricity generated by a wind power plant in a certain northwest region proportionally as the wind power forecast value, and used Monte Carlo sampling to generate multiple wind power output scenarios for each sub-wind-power plant based on the statistical error of the forecast value. Then, this paper used the scenario reduction method to limit the number of scenarios to 10. The market prices were obtained from publicly available data of the PJM electricity market, and the price penalty factors  φ d o w n  and  φ u p  in REM were taken as 0.8 and 1.2, respectively.

6.2. Results and Discussion

Based on the existing REB, the reasonable allocation of EES battery capacity and power is critical to SES system planning. If the ES capacity allocated to wind turbines in the REB is too small, it will be difficult to effectively absorb wind power. If the ES capacity is too large, the investment and operation costs will be too high, which could significantly affect the financial advantages of SES. This paper studies the effect of SES capacity allocation on alliance revenue. Figure 3 demonstrates that alliance members experience an increase in market revenue as the energy storage capacity rises, reaching a peak at a certain point when the capacity is relatively low. However, surpassing the optimal energy storage capacity linked to maximum profit leads to a subsequent decline in the members’ profitability. This decline can be attributed to excessive energy storage capacity, which introduces redundancy in energy storage resources. The resulting high investment and operational costs associated with this surplus capacity contribute to diminished profits for alliance members. In this case study, for most wind turbines, the ES capacity ratio corresponding to the maximum revenue is mostly between 14% and 21%.
Additionally, Figure 4 shows a significant increase in revenue for wind turbines 7–10, indicating that these four wind turbines need to bear a high SES investment cost. To balance the economic profits of the alliance and ES investment costs, the most suitable SES capacity ratio is within the 17–20% interval, which means that the SES capacity allocation for the REB is most suitable within the range of 90–110 MW. This paper chooses 100 MW as the optimal SES capacity configuration for the REB, and studies the optimized operation and cost allocation of the 100 MW.
The scheduling and operation status of SES with or without considering the cost of dynamic degradation of ES are presented in Figure 5.
In Figure 5, M1 represents the SoC of SES when dynamic attenuation characteristics are not taken into consideration, and M2 represents the SoC of SES when dynamic attenuation characteristics are taken into consideration. And dark blue represents the initial SoC of the ES, green represents an increase in the value of the SoC, and red represents a decrease in SoC. By comparing the SOC of SES with and without considering the dynamic attenuation, it can be observed that when there is a significant difference between the real-time output of the wind turbine and the previously declared power, the SOC of SES changes extensively. This indicates that the REM power of the ES is also substantial, and the storage device can adjust the overall clear power through its charging-and-discharging behavior to maintain the power balance. Consequently, the storage device can minimize the effects of unpredictability in wind power output on system operation, improving the overall alliance revenue. Moreover, compared to the scenario without considering dynamic attenuation, when dynamic attenuation is considered, the SOC change frequency and amplitude of SES are more conservative. This results in a reduced number of charging-and-discharging cycles and a reduced frequency of deep charging or discharging, leading to a smoother change in energy capacity. This prolongs the service life of SES. When dynamic attenuation is not considered, the ES device tends to increase the revenue of various entities in the energy market through frequent charging-and-discharging behavior to maximize overall revenue. However, when dynamic attenuation is considered, the utilization rate of the storage device is significantly reduced to achieve higher total alliance revenue, leading to a lower clear power in the real-time balance market and a lowered frequency of charging-and-discharging behavior.
By analyzing the cross-sections of different stages of SES, it is shown in Figure 6 that when the ES capacity drops below 20%, the optimal scheduling requirement under the initial state has deviated. This will reduce its ability to improve the anti-peak properties of wind power and reduce the imbalance settlement cost of wind power. This further indicates the necessity of considering the dynamic degradation of ES to avoid excessive use of SES.
If fixed decay cost for payment of SES is applied without considering its dynamic characteristic changes, and if ES state parameters are not updated during its usage, and if the charging and discharging costs remain constant and do not change with the changes in charging and discharging capacities, then the health status of the ES cannot be adequately represented, and the overuse of ES cannot be avoided in the sharing mode. This paper proposes that updating the characteristic parameters of ES in a timely manner according to its operating conditions and accounting for the decay cost of ES during different usage stages based on charging and discharging quantities can more reasonably improve the system benefits on the basis of reducing the loss of ES life.
Based on the revenue obtained by wind turbines and SES forming alliances and wind turbines participating in the market individually, the revenue increase brought by forming alliances can be derived. The results are shown in Table 2. Comparing the final revenue situation, it can be seen that after multiple wind turbines share ES, their revenue has increased, but the increase proportion is different, mainly due to the different prediction accuracies of each wind turbine. Wind turbine 9 achieved a 28.61% increase in revenue compared to participating in the market individually, while wind turbine 3, which has the least revenue increase, has also achieved 1.01 times the revenue when participating in the market individually after constructing SES. It is evident that the model proposed in this paper, which involves multiple wind turbines jointly sharing ES to participate in market operation, can take into account the interests of all parties and improve the overall revenue.
Comparing the different profits of wind power with the same installed capacity in Figure 7, it can be observed that the distinct profitability of wind power producers with the same capacity are due to different prediction errors. The larger the deviation between the real and reported power data of a wind turbine, the higher the corresponding imbalance costs it incurs, which results in lower actual profits of the RE station than expected. Meanwhile, the profit of a single wind turbine, when forming alliances with other wind turbines and ES, may not increase significantly even if its profitability is high, mainly because the wind turbine itself is already highly matched with the load, and the complementary effects between multiple wind turbines and the regulating function of ES do not significantly reduce their output deviation.
According to the proportion of revenue improvement from each wind turbine to the total revenue increase, the investment and degradation costs of SES are allocated, and the higher the revenue increase rate of a wind turbine, the more SES cost it needs to bear. This can ensure enthusiasm for cooperation of all alliance members and the stability of the alliance.
As shown in Figure 8, by comparing the day-ahead and real-time revenues of ten wind farms, it can be seen that the capacity and prediction error of wind turbines both affect their share of investment in SES. In an RE field, wind turbines with larger errors between actual capacity and output and reported values need to bear higher initial investment costs of SES.
The day-ahead revenues of wind farm 3 and wind farm 4 are basically the same, but the investment expense of ES required varies greatly. This is mainly because wind farm 3 has better matching with the load, which can better meet the load demand in each period with its own output characteristics, and therefore has less demand for peak-shaving and filling of ES and flexibility value, resulting in a smaller proportion of corresponding shared investment. The real-time revenue of wind farm 4 and wind farm 7 is basically the same, but the cost of SES is different, indicating that wind turbines with different capacities still need to bear a larger proportion of initial investment costs of ES even if their prediction accuracy is similar.
The impact of wind turbine output prediction accuracy on the cost allocation of an SES alliance is analyzed below, and the results are presented in Figure 9.
As seen in Figure 8 and Figure 9, it can be observed that wind turbines 7, 8, 9, and 10 have higher improvement rates in revenue and higher SES costs. As prediction accuracy improves, the SES cost of each wind turbine unit, especially those with higher revenue increase rates, decreases to varying degrees. This is because the improvement in prediction accuracy reduces the deviation between the pre-bid power and real-time output of each unit, leading to decreased demand for ES capacity and subsequently lowering the SES investment cost. Moreover, the improvement in prediction accuracy reduces the frequency and power of charging and discharging, resulting in a lower degradation cost due to the ES cycle. Therefore, each member of the alliance will also see a reduction in their corresponding SES costs. Additionally, due to the different prediction accuracy of each unit, their demand for ES when participating in the spot market is also different, leading to varying changes in the cost sharing. For turbine 9, which has the highest improvement rate in revenue, when its prediction accuracy improves by 5%, the shared cost can be reduced by about 6%, which is conducive to incentivizing alliance members to actively participate in the spot market and enhancing their market competitiveness.
As shown in Figure 10, the capacity demand of SES in each wind turbine unit in the REB also changes when the electricity price penalty coefficient in the REM of the alliance changes. Specifically, when the overgeneration price penalty coefficient  ϕ d o w n  decreases or the undergeneration price penalty coefficient  ϕ u p  increases, the optimal SES allocation capacity in the REB will gradually increase. This is because the change in the electricity price penalty coefficient will increase the capacity demand of SES of each wind turbine unit, which will increase the investment expense of SES, and the charging and discharging powers will also increase, resulting in more frequent charging-and-discharging behaviors, and the decay cost will also increase, leading to a continuous increase in the SES cost borne by each unit. However, since the capacity demand for ES of each turbine is different when the electricity price penalty coefficient changes, the increment of their ES allocation cost is also different.
The output prediction accuracy of each unit is set as shown in Table 3. Combined with Table 3 and Figure 10, for unit 7, 8, and 9, when the electricity price penalty coefficient changes, their increment of ES allocation cost is relatively large. This is mainly because their output prediction accuracy is low, and the day-ahead forecast error is large, which will face higher imbalance penalty fees in the REM. To improve their economic benefits, they will increase the demand for SES to compensate for the fluctuation between their awarded electricity volume and real-time power output, thus reducing the imbalance settlement cost.
For units with higher prediction accuracy, when the electricity price penalty coefficient changes, their increment of ES allocation cost increases more conservatively. When  ϕ d o w n  decreases from 0.9 to 0.8, the ES allocation cost for unit 9 increases by USD 1095, which is about 10 times the increment of the ES allocation cost for unit 4. In addition, for wind turbine units with similar installed capacity, such as units 3, 5, and 10, their increments of ES allocation cost are different due to different prediction accuracies. Obviously, for unit 10 with higher prediction accuracy, the increment in ES demand is smaller, and the ES allocation cost increases more conservatively. For unit 3 with lower prediction accuracy, its increment of ES allocation cost is 1.11 times higher than that of unit 10. In fact, according to the cost allocation mechanism proposed in this article, wind power producers must make a trade-off between implementing higher-cost yet more effective prediction technologies and bearing increased shared energy storage investment costs to maximize their own utility.

7. Conclusions

This paper provides a detailed modeling of the degradation of shared energy storage lifespan, and analyzes the impact of dynamic degradation characteristics on the operational strategies and capacity allocation schemes of shared energy storage in renewable energy bases. It establishes an optimization model for the optimal operation of shared energy storage in renewable energy bases, taking into account the dynamic degradation characteristics. Furthermore, a cost allocation mechanism is designed to address the diversity in shared energy storage demands. The following results have been confirmed:
(1)
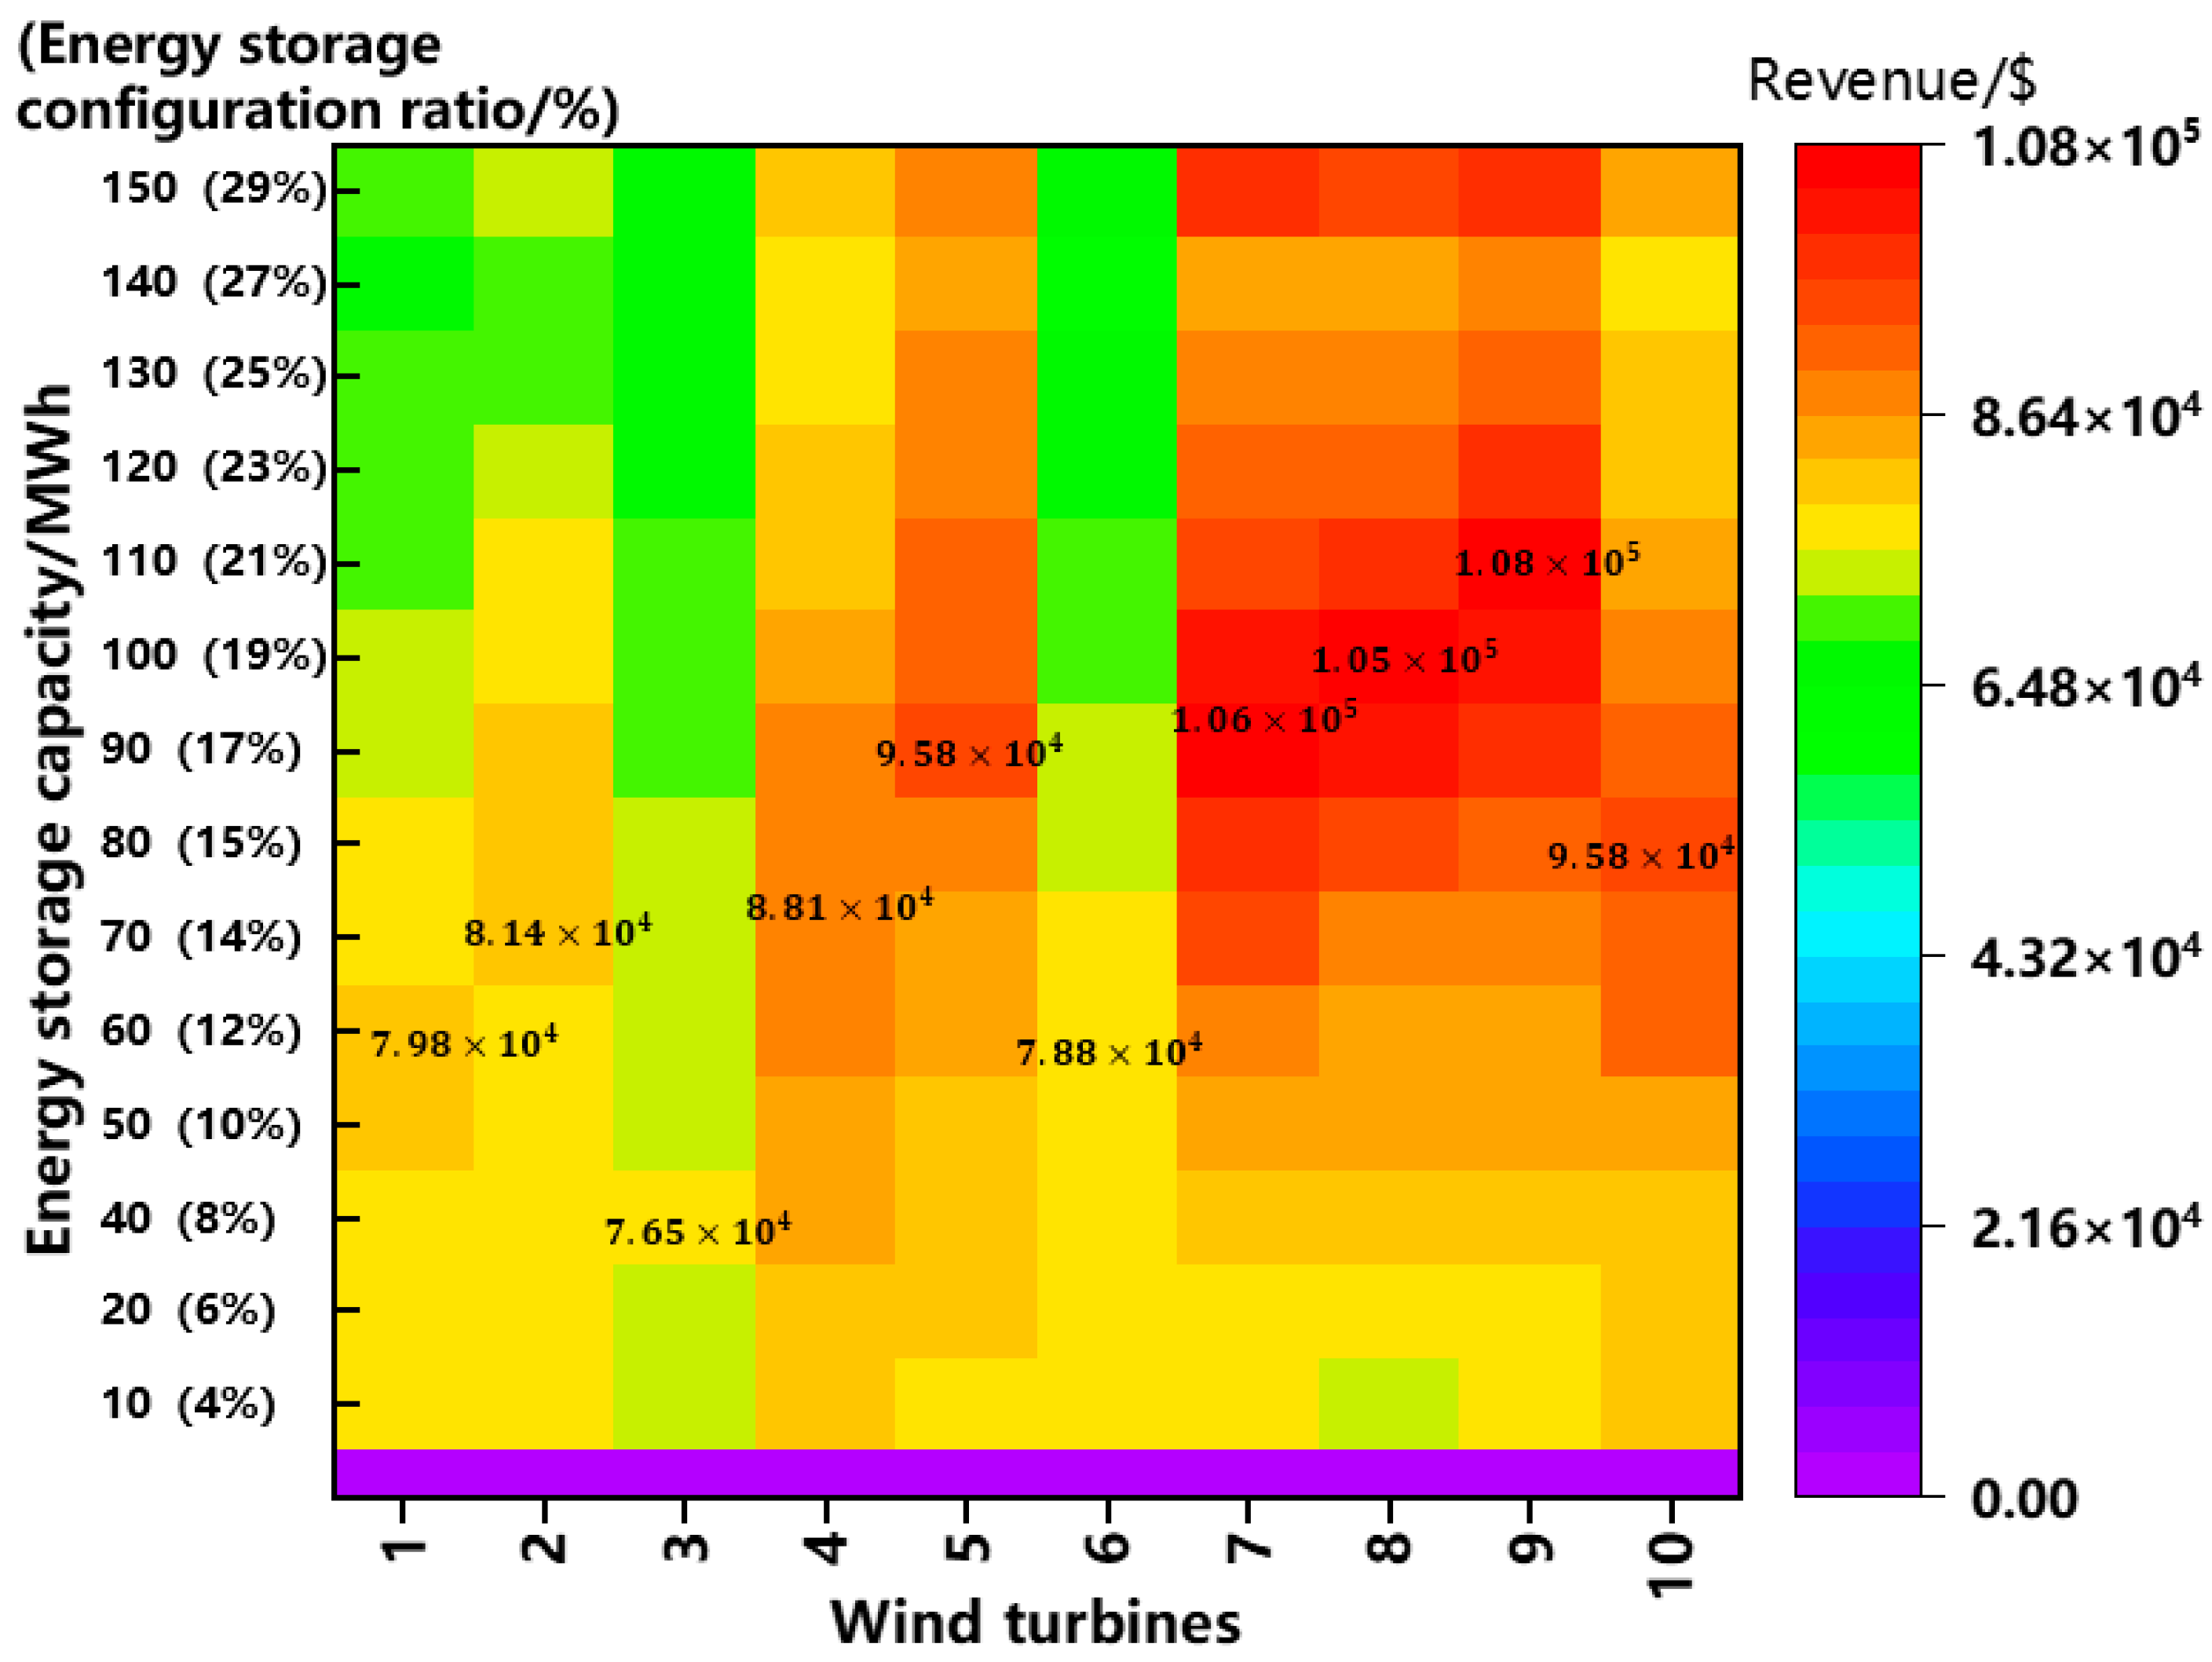
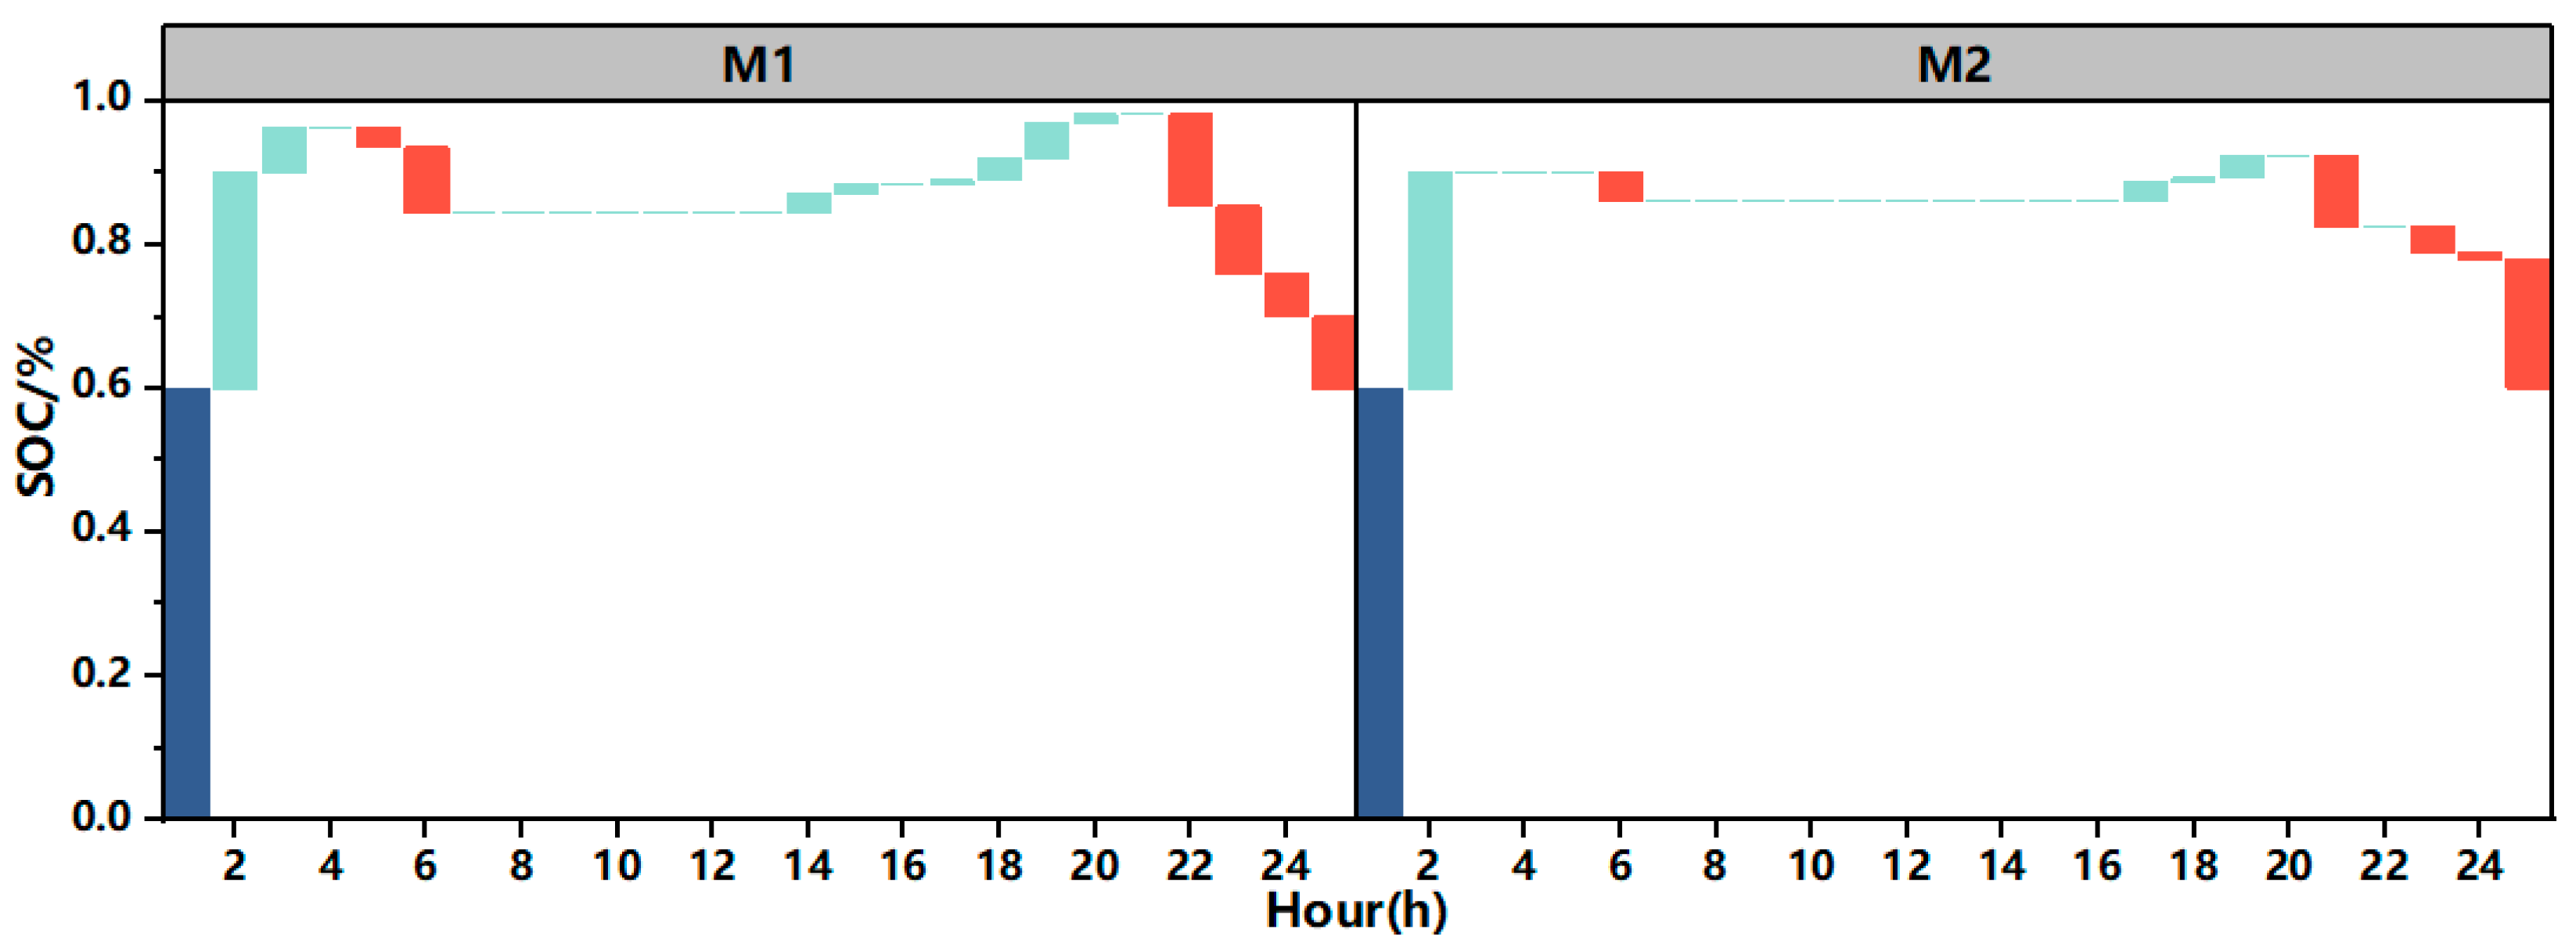
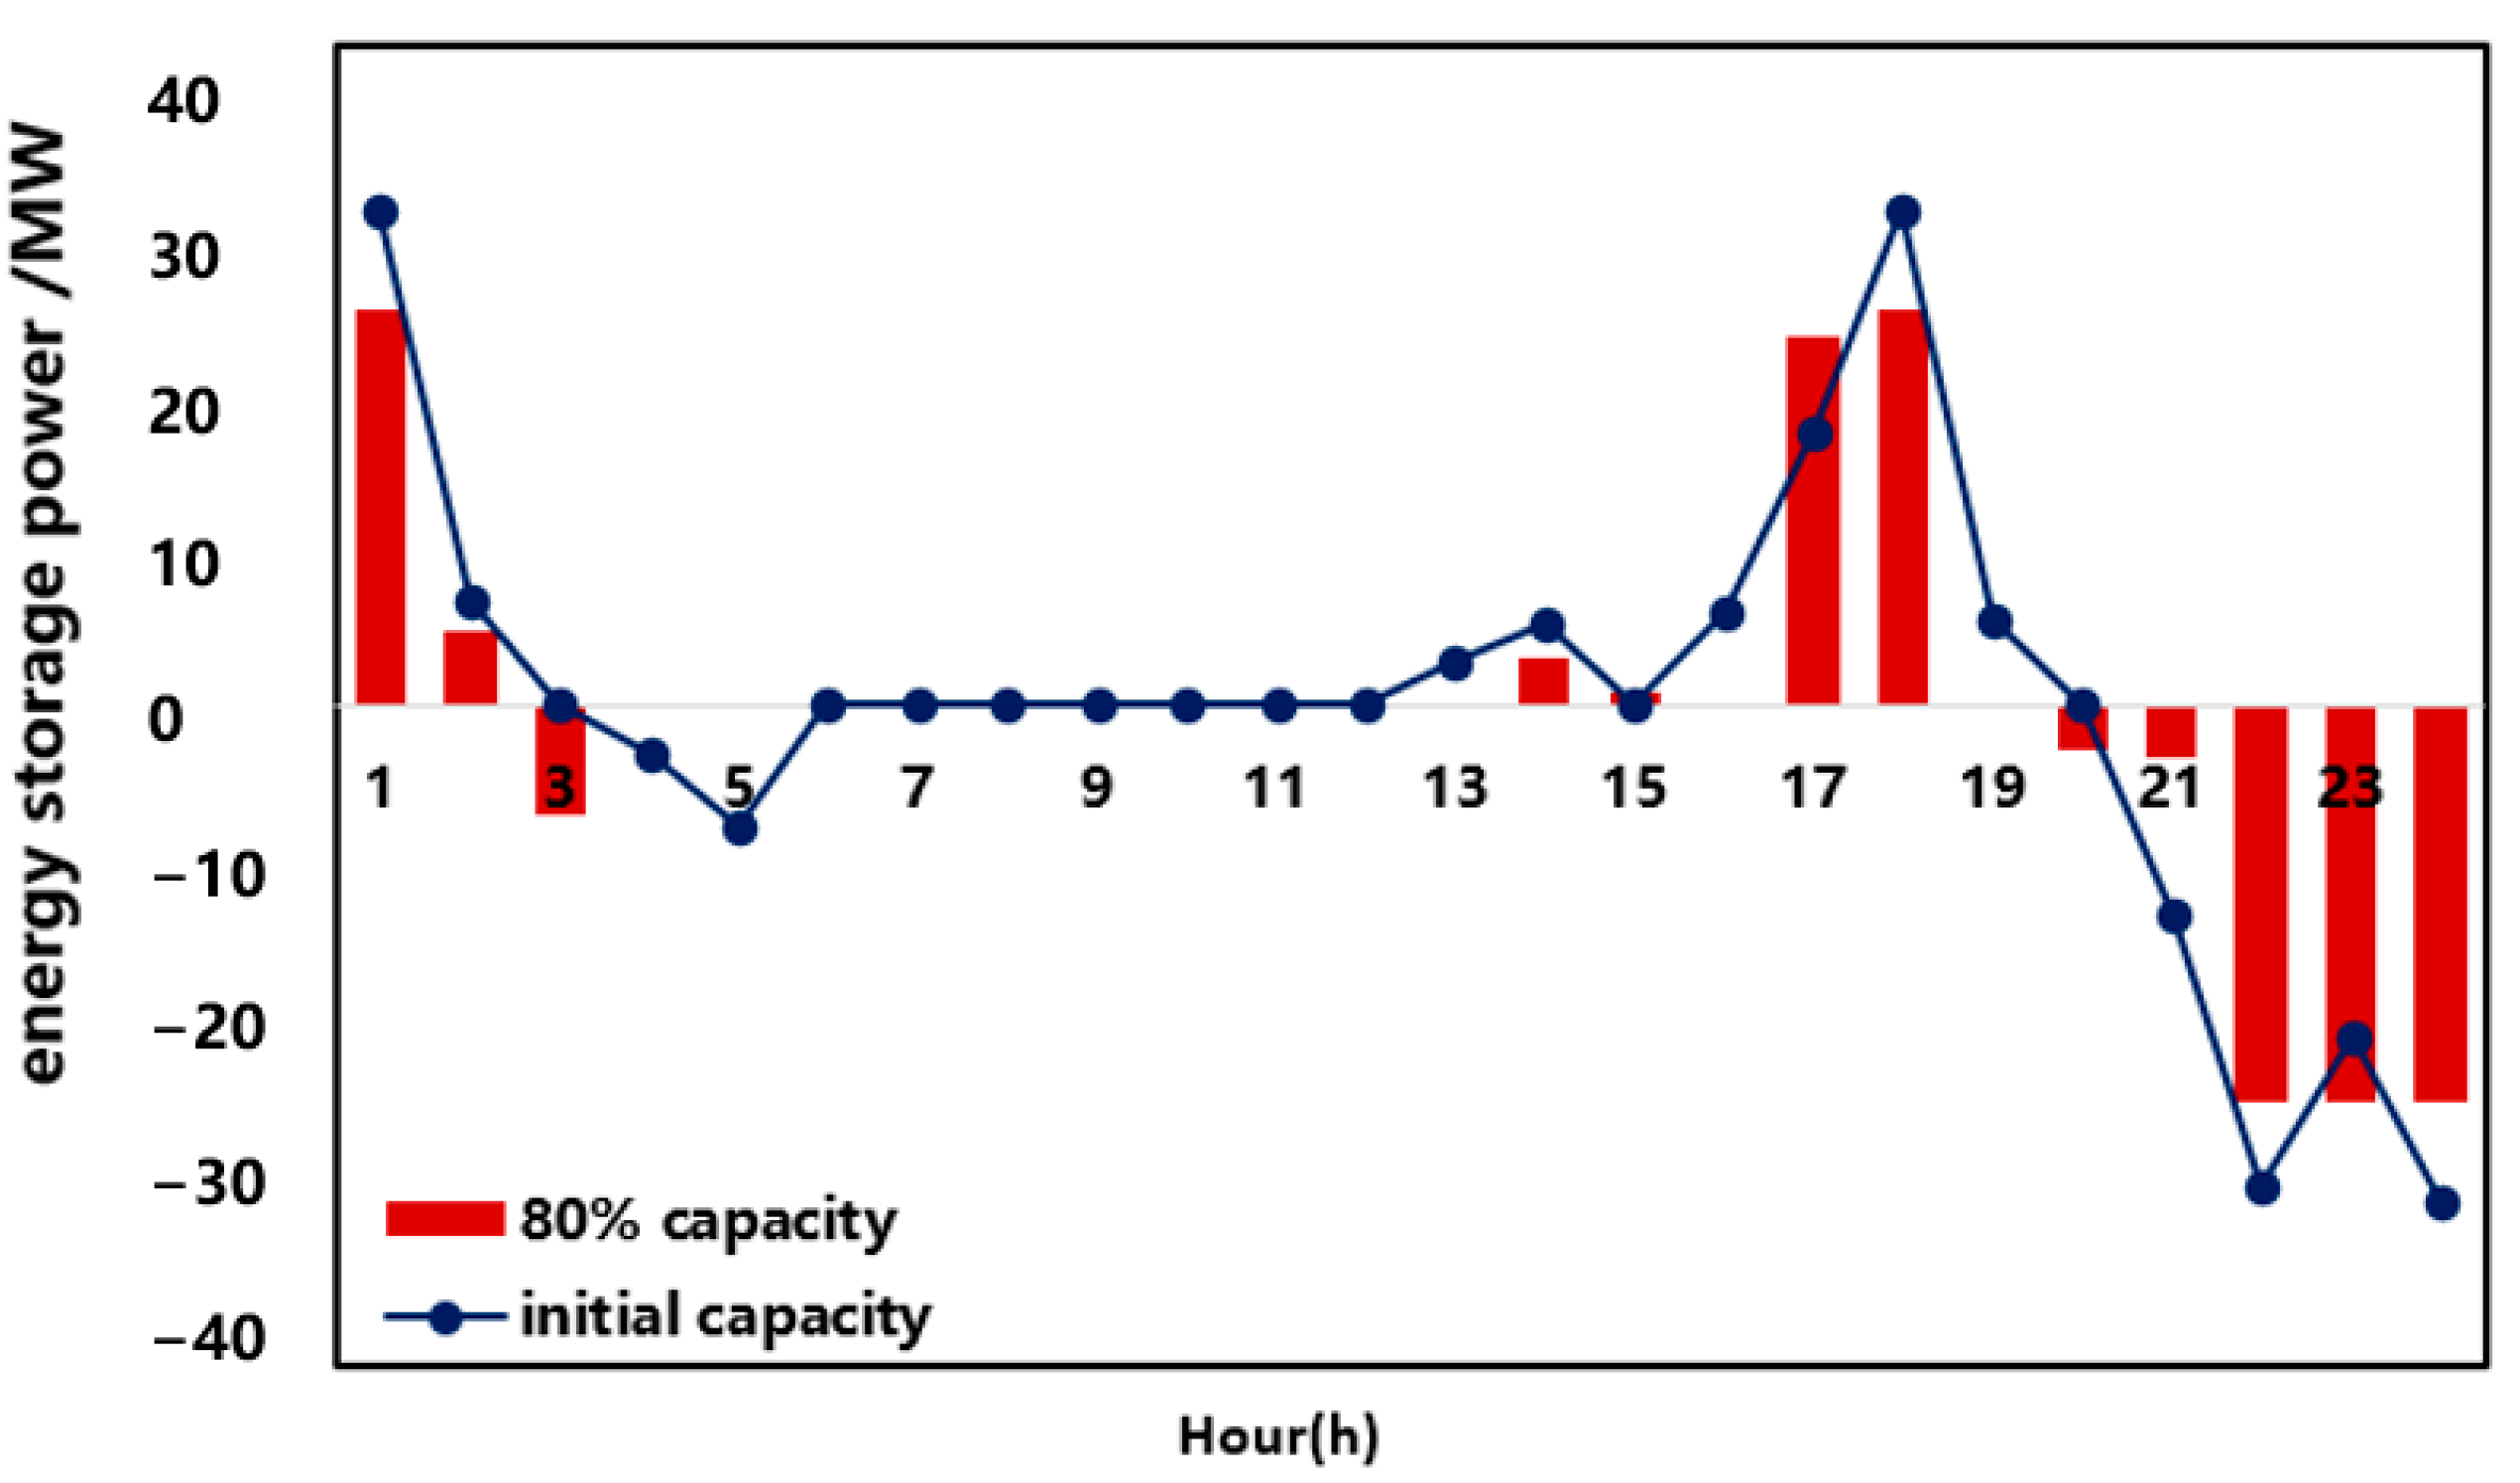
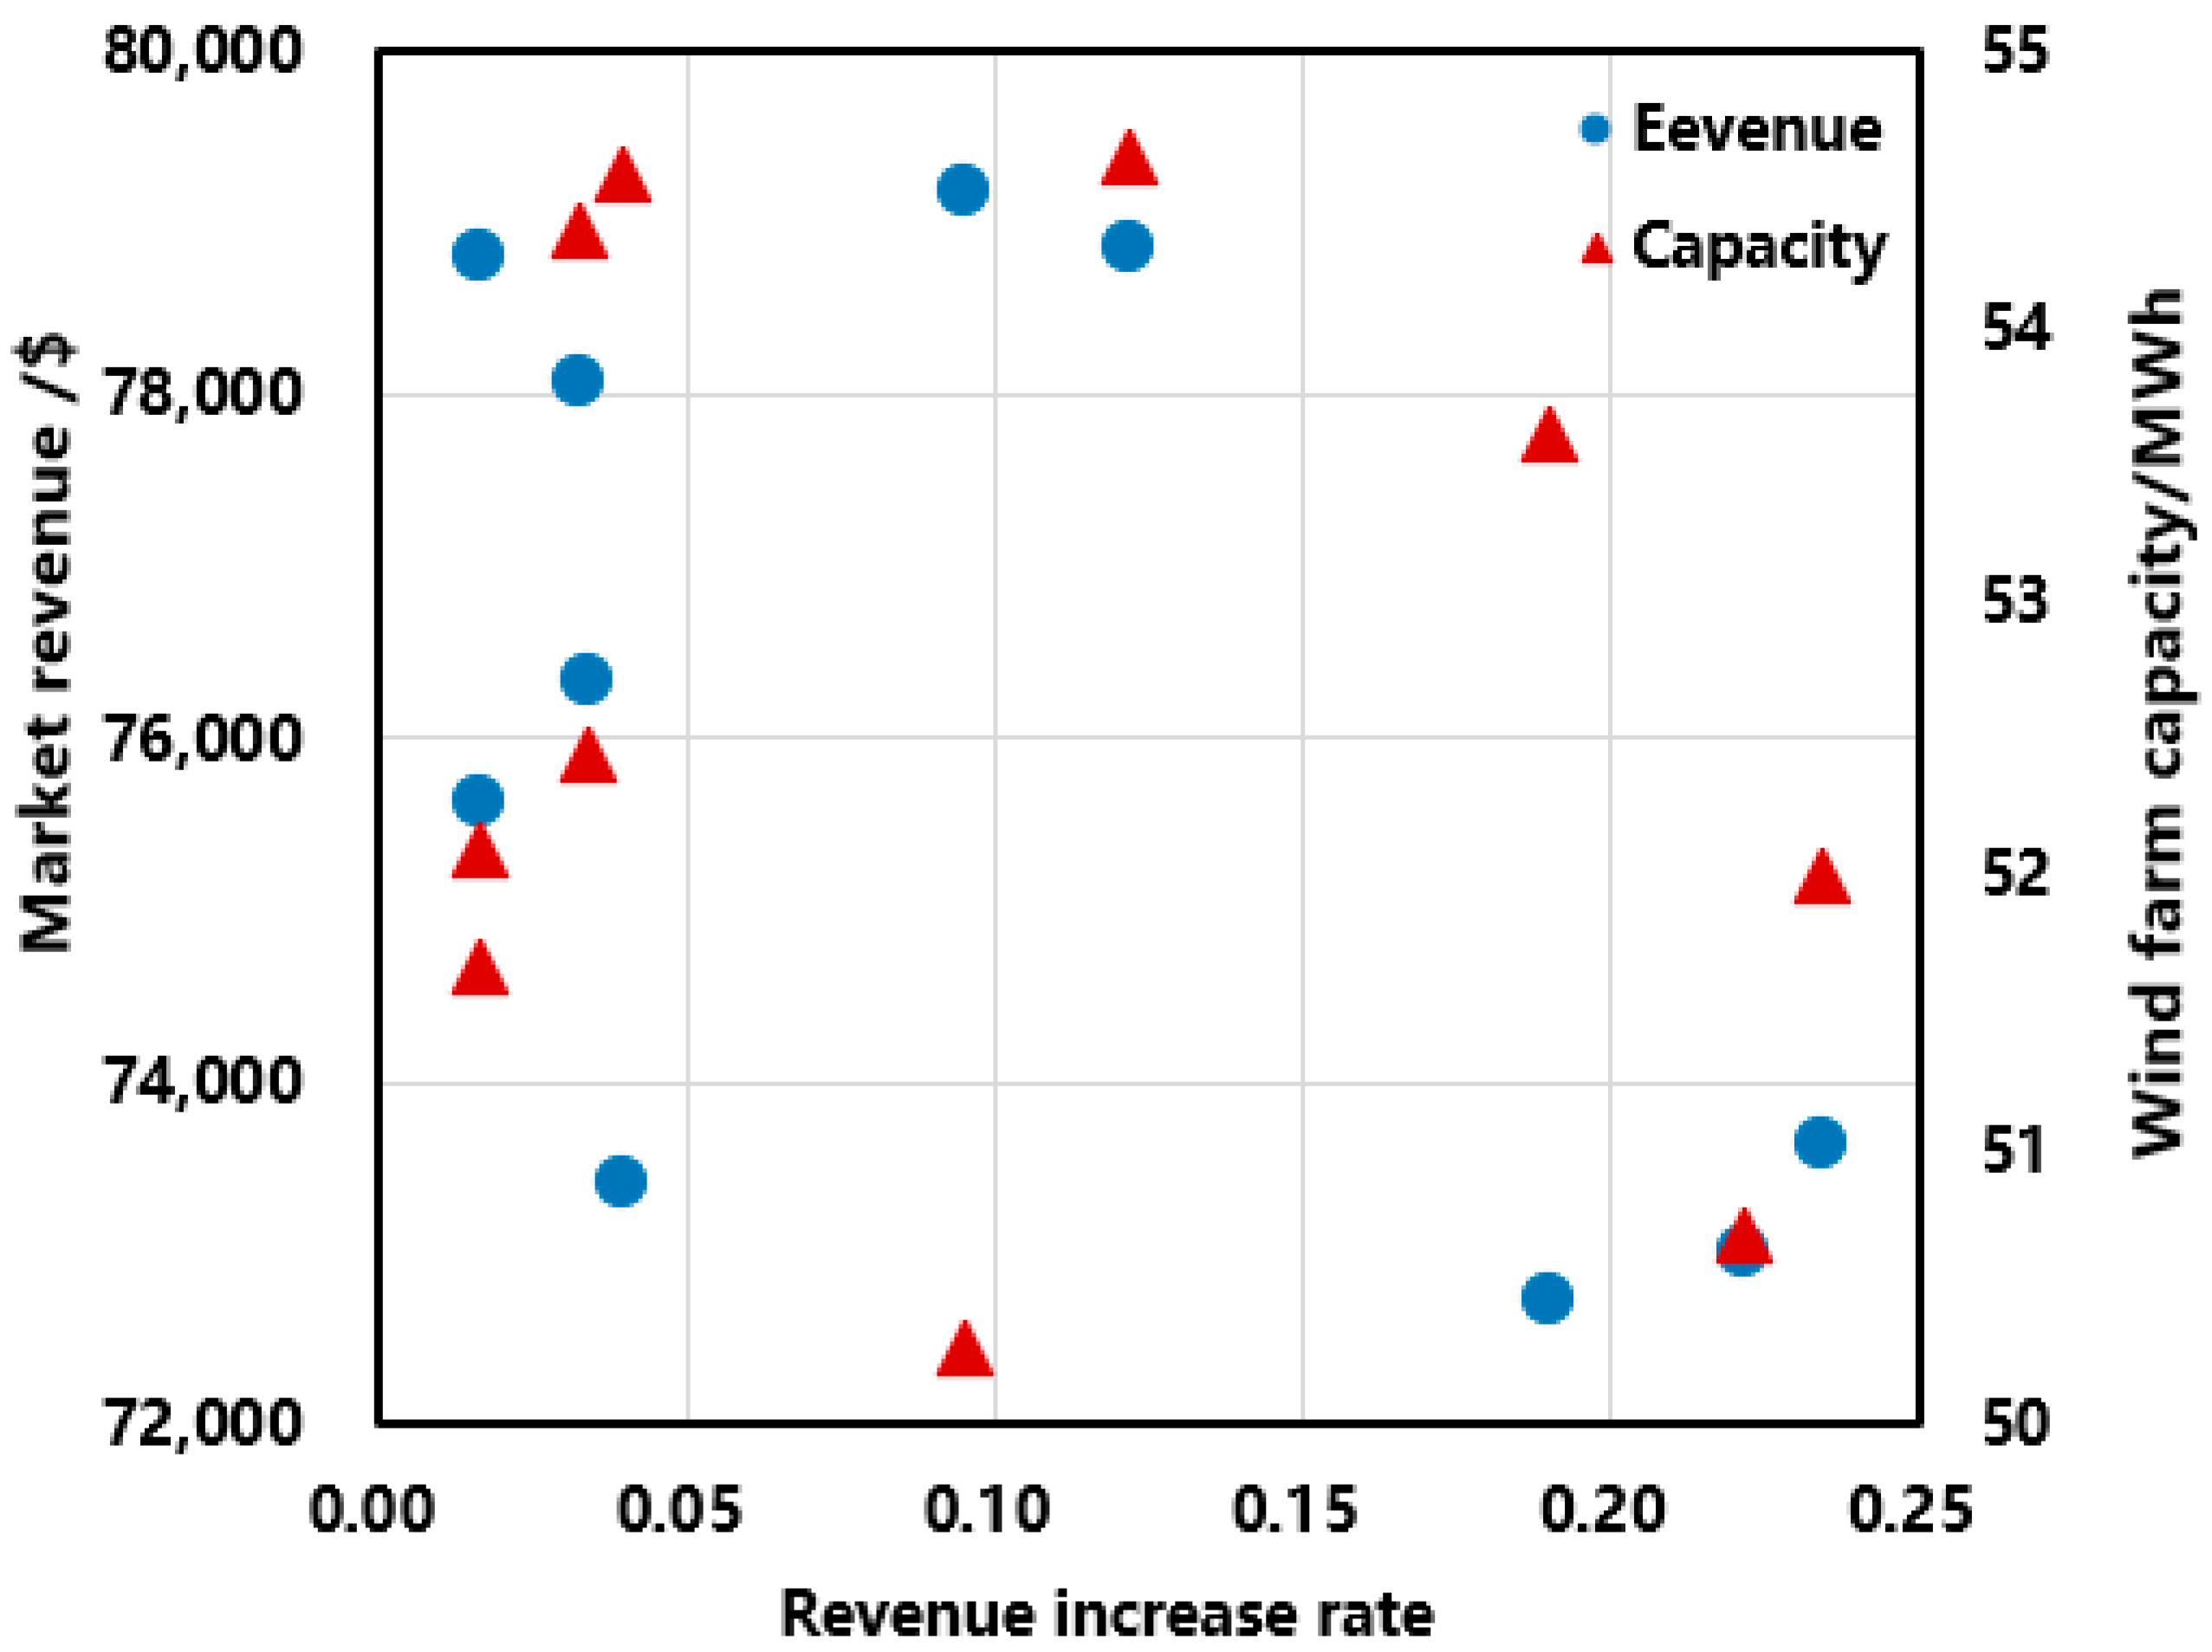
The most suitable capacity ratio for SES in a REB is in the range of 17% to 20%, which can balance the economic benefits of alliances and ES investment costs well. When wind turbines form an alliance with SES, their profits increase compared to when they participate in the market alone. Considering the dynamic decay of ES, the utilization rate of ES is considerably reduced to increase the overall profits of the alliance, and the charging-and-discharging frequency and quantity in the REM are also reduced.
(2)
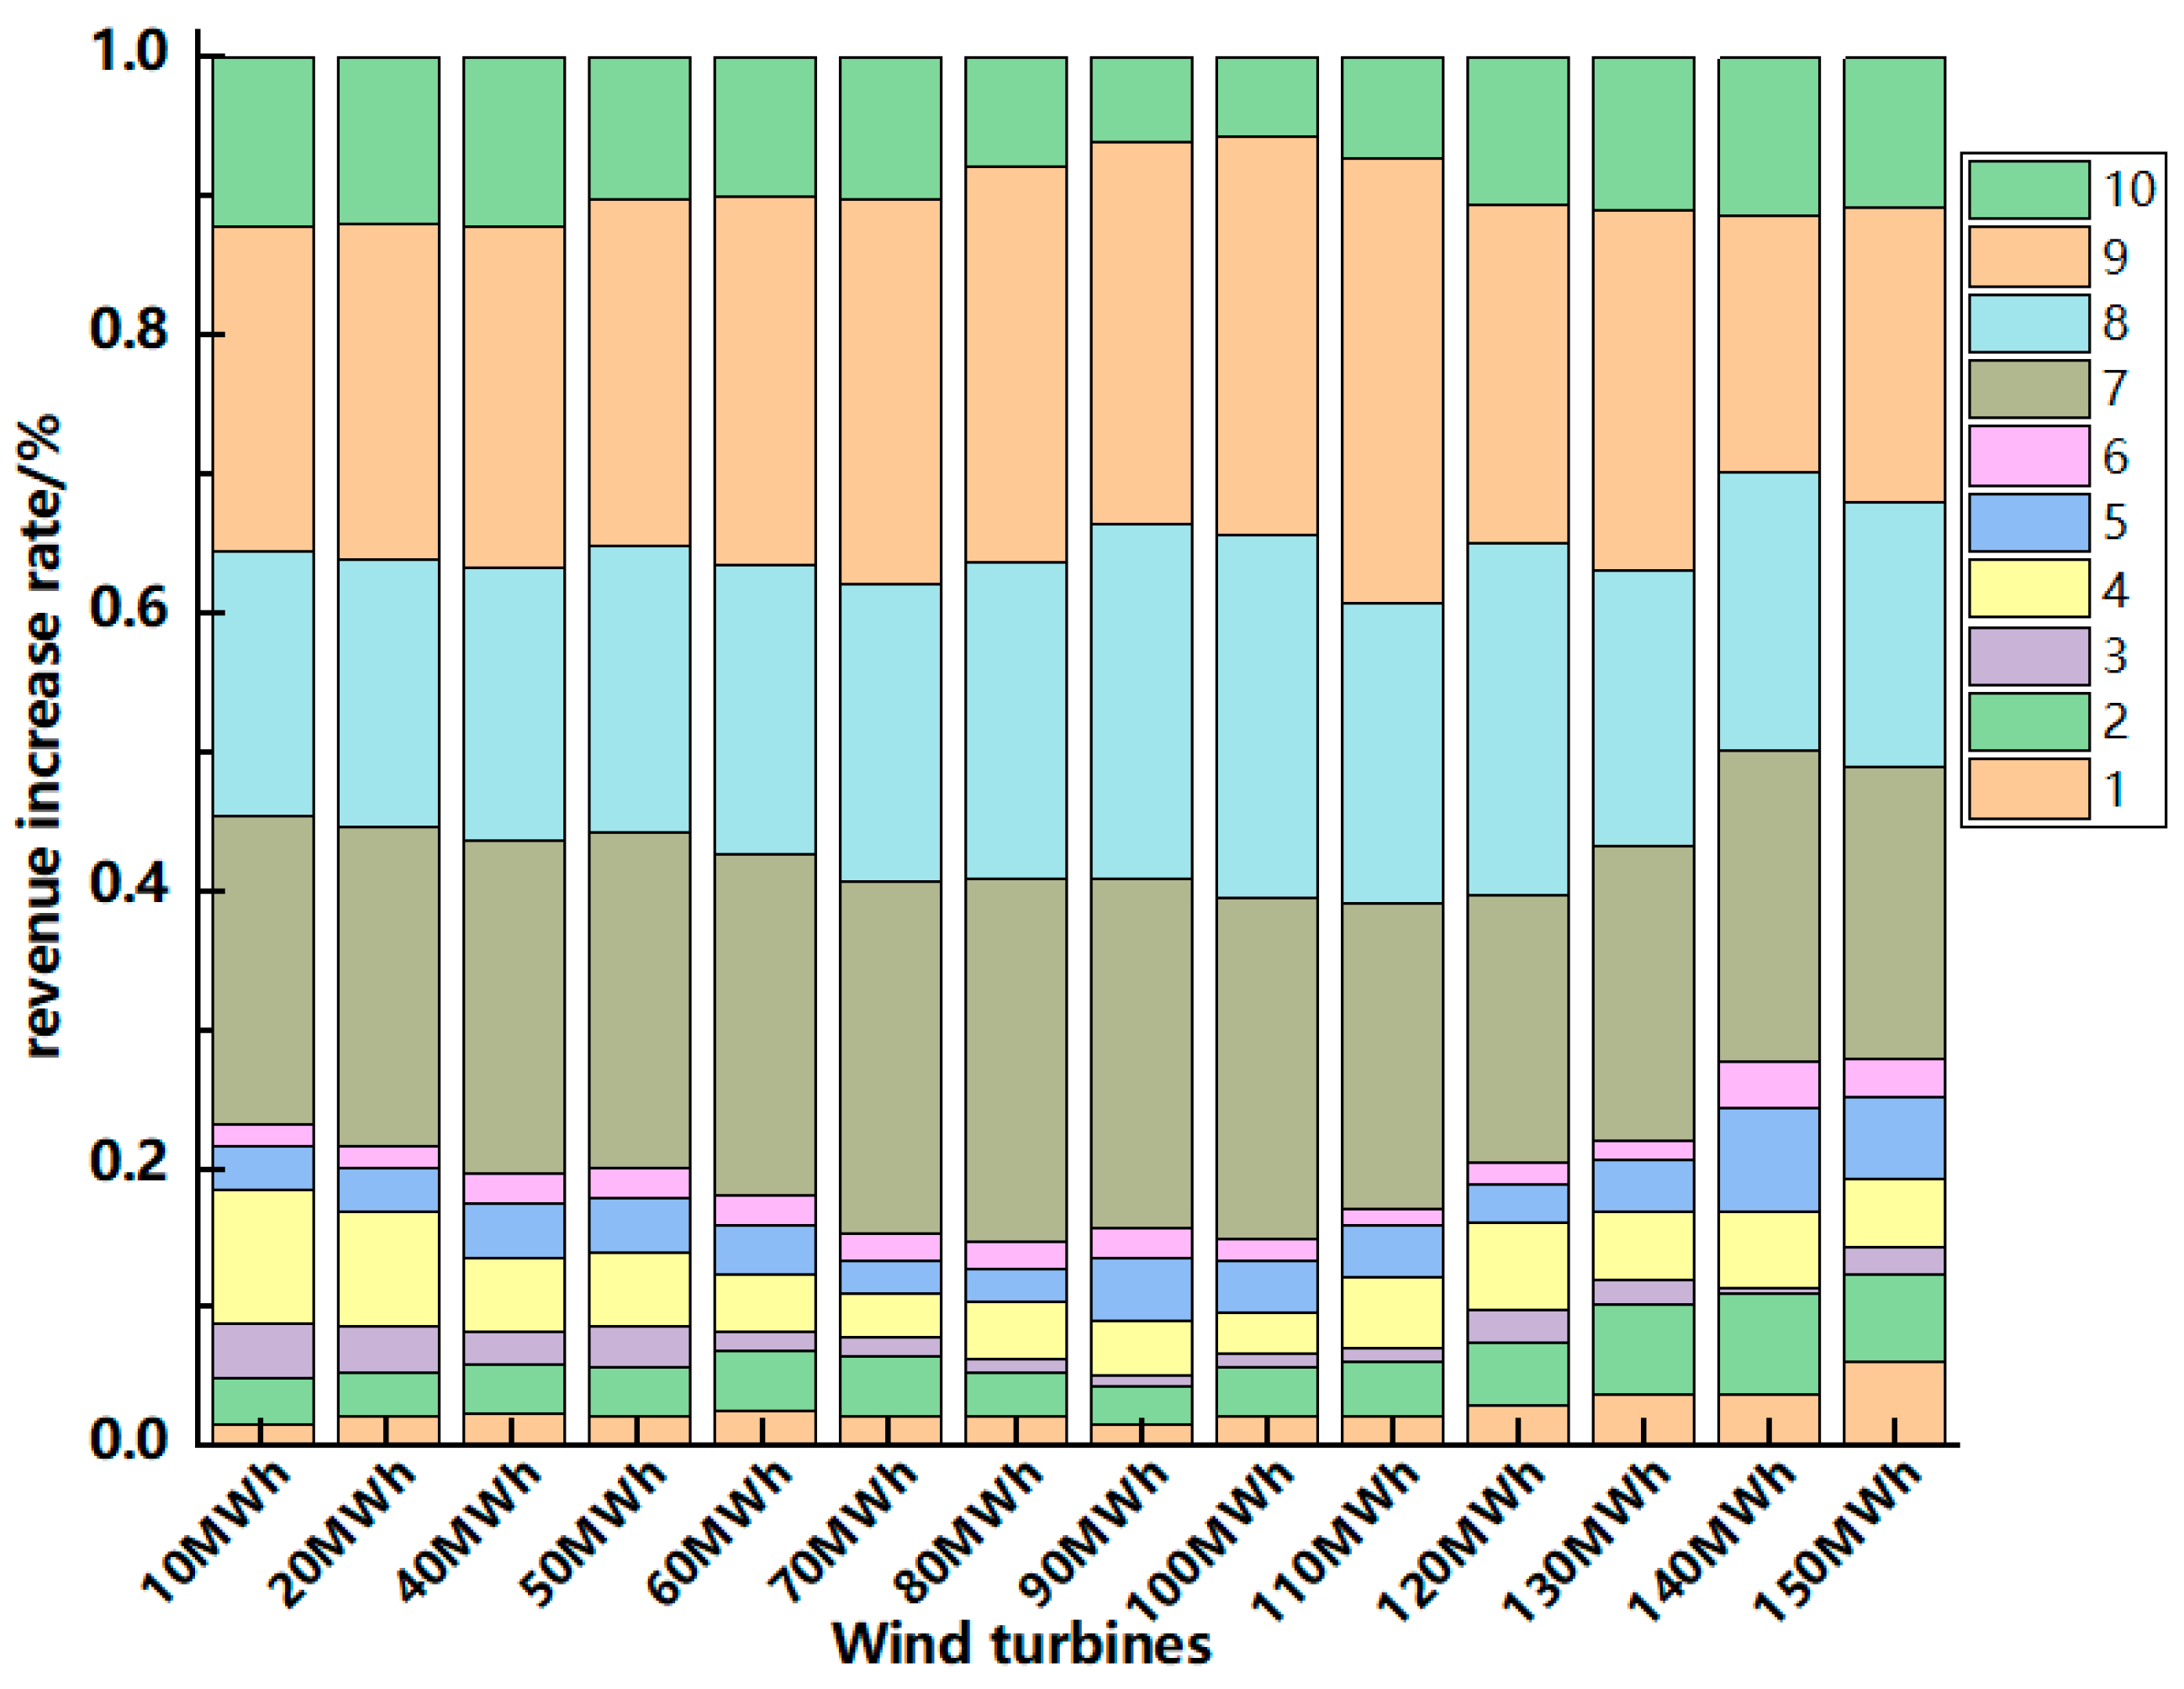
The capacity and prediction errors of wind turbines will affect their share of SES costs. When the prediction accuracy is similar, wind turbines with larger installed capacities need to bear a higher proportion of ES costs, and as the prediction accuracy improves, the SES costs borne by each wind turbine decrease to varying degrees.
(3)
The penalty factor of the REM price in the alliance also affects the optimal SES capacity configuration and the SES costs of each wind turbine in the REB. When the penalty factor changes, the capacity demand for SES in each wind turbine in the REB increases, and the SES costs increase. Moreover, wind turbines with lower output prediction accuracy and similar installed capacity have larger increases in SES costs.
In conclusion, the SES optimization model for RE stations, taking into account dynamic decay of EES, is more objective and reasonable. The calculation of profits for different units in the REB has guidance significance for designing SES cost allocation mechanisms. The proposed model is also applicable to photovoltaic power stations. However, there are still some limitations in this paper that can be improved in the future. On the one hand, this paper does not consider network constraints and power flow constraints. In-depth research can be conducted on the capacity configuration of energy storage in renewable energy bases, taking into account power supply security, reliability, and power quality. On the other hand, this study primarily focuses on multiple renewable energy bases and a single shared energy storage system. Future research can investigate the capacity allocation problem for multiple shared energy storage stations.

Author Contributions

Conceptualization and investigation, C.S.; conceptualization and formal analysis, B.Z.; resources and methodology, B.W.; data curation and software, W.L.; writing—original draft preparation, Y.Y.; supervision, formal analysis and writing—review & editing, Z.W. All authors have read and agreed to the published version of the manuscript.

Funding

This research was funded by the State Grid Gansu Electric Power Company Science and Technology Project “Research on Energy Storage Participation in Marketization Trading Mechanism Based on New Power Systems” (Grant number: 52272222000H).

Data Availability Statement

Datasets are available upon reasonable request.

Acknowledgments

The authors are grateful to the editor and anonymous reviewers for their work.

Conflicts of Interest

The authors declare no conflict of interest.

References

  1. Wu, Z.; Zhou, M.; Zhang, Z.; Zhao, H.; Wang, J.; Xu, J.; Li, G. An incentive profit-sharing mechanism for welfare transfer in balancing market integration. Renew. Sustain. Energy Rev. 2022, 168, 112762. [Google Scholar] [CrossRef]
  2. IRENA. Global Energy Transformation: A Roadmap to 2050, 2019th ed.; International Renewable Energy Agency: Abu Dhabi, United Arab Emirates, 2019. [Google Scholar]
  3. Wu, Z.; Chen, L.; Wang, J.; Zhou, M.; Li, G.; Xia, Q. Incentivizing the Spatiotemporal Flexibility of Data Centers Toward Power System Coordination. IEEE Trans. Netw. Sci. Eng. 2023, 10, 1766–1778. [Google Scholar] [CrossRef]
  4. Wu, Z.; Wang, J.; Zhong, H.; Gao, F.; Pu, T.; Tan, C.-W.; Chen, X.; Li, G.; Zhao, H.; Zhou, M.; et al. Sharing Economy in Local Energy Markets. J. Mod. Power Syst. Clean Energy 2022, 11, 714–726. [Google Scholar] [CrossRef]
  5. Chen, Y.; Yang, Y.; Xu, X. Towards transactive energy: An analysis of information-related practical issues. Energy Convers. Econ. 2022, 3, 112–121. [Google Scholar] [CrossRef]
  6. Malka, L.; Daci, A.; Kuriqi, A.; Bartocci, P.; Rrapaj, E. Energy Storage Benefits Assessment Using Multiple-Choice Criteria: The Case of Drini River Cascade, Albania. Energies 2022, 15, 4032. [Google Scholar] [CrossRef]
  7. Wu, Z.; Wang, J.; Zhou, M.; Xia, Q.; Tan, C.-W.; Li, G. Incentivizing Frequency Provision of Power-to-Hydrogen toward Grid Resiliency Enhancement. IEEE Trans. Ind. Inform. 2022, 1–10. [Google Scholar] [CrossRef]
  8. Liu, D.; Cao, J.; Liu, M. Joint Optimization of Energy Storage Sharing and Demand Response in Microgrid Considering Multiple Uncertainties. Energies 2022, 15, 3067. [Google Scholar] [CrossRef]
  9. Yao, M.; Molzahn, D.K.; Mathieu, J.L. An Optimal Power-Flow Approach to Improve Power System Voltage Stability Using Demand Response. IEEE Trans. Control Netw. Syst. 2019, 6, 1015–1025. [Google Scholar] [CrossRef]
  10. Chen, L.; Wang, J.; Wu, Z.; Li, G.; Zhou, M.; Li, P.; Zhang, Y. Communication Reliability-Restricted Energy Sharing Strategy in Active Distribution Networks. Appl. Energy 2021, 282, 116238. [Google Scholar] [CrossRef]
  11. Atawi, I.E.; Al-Shetwi, A.Q.; Magableh, A.M.; Albalawi, O.H. Recent Advances in Hybrid Energy Storage System Integrated Renewable Power Generation: Configuration, Control, Applications, and Future Directions. Batteries 2023, 9, 29. [Google Scholar] [CrossRef]
  12. Parag, Y.; Sovacool, B.K. Electricity market design for the prosumer era. Nat. Energy 2016, 1, 16032. [Google Scholar] [CrossRef]
  13. Sousa, T.; Soares, T.; Pinson, P.; Moret, F.; Baroche, T.; Sorin, E. Peer-to-peer and community-based markets: A comprehensive review. Renew. Sustain. Energy Rev. 2019, 104, 367–378. [Google Scholar] [CrossRef] [Green Version]
  14. Zhu, K.; Victoria, M.; Andresen, G.B.; Greiner, M. Impact of climatic, technical and economic uncertainties on the optimal design of a coupled fossil-free electricity, heating and cooling system in Europe. Appl. Energy 2020, 262, 114500. [Google Scholar] [CrossRef] [Green Version]
  15. Zhang, C.; Wu, J.; Long, C.; Cheng, M. Review of existing peer-to-peer energy trading projects. Energy Procedia 2017, 105, 2563–2568. [Google Scholar] [CrossRef]
  16. Chomać-Pierzecka, E.; Sobczak, A.; Soboń, D. Wind Energy Market in Poland in the Background of the Baltic Sea Bordering Countries in the Era of the COVID-19 Pandemic. Energies 2022, 15, 2470. [Google Scholar] [CrossRef]
  17. Jiang, Y.; Zheng, C. Two-stage Operation Optimization for Grid-connected Wind Farm Cluster with Shared Energy Storage. Power Syst. Technol. 2022, 46, 3426–3439. [Google Scholar]
  18. Scarabaggio, P.; Carli, R.; Dotoli, M. Noncooperative Equilibrium-Seeking in Distributed Energy Systems Under AC Power Flow Nonlinear Constraints. IEEE Trans. Control Netw. Syst. 2022, 9, 1731–1742. [Google Scholar] [CrossRef]
  19. Lai, S.; Qiu, J.; Tao, Y. Credit-Based Pricing and Planning Strategies for Hydrogen and Electricity Energy Storage Sharing. IEEE Trans. Sustain. Energy 2022, 13, 67–80. [Google Scholar] [CrossRef]
  20. Awnalisa, W.; Soongeol, K. Analysis on impact of shared energy storage in residential community: Individual versus shared energy storage. Appl. Energy 2021, 282, 116172. [Google Scholar]
  21. Karunakaran, V.; Uma, G. Optimal power flow control of hybrid renewable energy system with energy storage: A WOANN strategy. J. Renew. Sustain. Energy 2019, 11, 015501. [Google Scholar]
  22. Nicola, M.; Paolo, S.; Raffaele, C.; Dotoli, M. Control frameworks for transactive energy storage services in energy communities. Control Eng. Pract. 2023, 130, 105364. [Google Scholar]
  23. Niu, J.; Tian, Z.; Lu, Y.; Zhao, H. Flexible dispatch of a building energy system using building thermal storage and battery energy storage. Appl. Energy 2019, 243, 274–287. [Google Scholar] [CrossRef]
  24. Zafar, R.; Ravishankar, J.; Fletcher, J.E.; Pota, H.R. Multi-Timescale Model Predictive Control of Battery Energy Storage System Using Conic Relaxation in Smart Distribution Grids. IEEE Trans. Power Syst. 2018, 33, 7152–7161. [Google Scholar] [CrossRef]
  25. Wu, J.; Lu, Z.; Qiao, Y.; Yang, H. Wind-Storage Power Station Operation Optimization Considering Dynamic Efficiency Characteristics of Energy Storage Charging and Discharging. Autom. Electr. Power Syst. 2018, 42, 41–47+101. [Google Scholar]
  26. Sakti, A.; Gallagher, K.G.; Sepulveda, N.; Uckun, C.; Vergara, C.; de Sisternes, F.J.; Dees, D.W.; Botterud, A. Enhanced representations of lithium-ion batteries in power systems models and their effect on the valuation of energy arbitrage applications. J. Power Sources 2017, 342, 279–291. [Google Scholar] [CrossRef]
  27. Musallam, M.; Johnson, C.M. An Efficient Implementation of the Rainflow Counting Algorithm for Life Consumption Estimation. IEEE Trans. Reliab. 2012, 61, 978–986. [Google Scholar] [CrossRef]
  28. You, H.W.; Bae, J.I.; Cho, S.J.; Lee, J.M.; Kim, S.-H. Analysis of equivalent circuit models in lithium-ion batteries. AIP Adv. 2018, 8, 125101. [Google Scholar] [CrossRef] [Green Version]
  29. Roscher, M.A.; Assfalg, J.; Bohlen, O.S. Detection of Utilizable Capacity Deterioration in Battery Systems. IEEE Trans. Veh. Technol. 2011, 60, 98–103. [Google Scholar] [CrossRef]
  30. Xu, B.; Oudalov, A.; Ulbig, A.; Andersson, G.; Kirschen, D.S. Modeling of Lithium-Ion Battery Degradation for Cell Life Assessment. IEEE Trans. Smart Grid 2018, 9, 1131–1140. [Google Scholar] [CrossRef]
  31. Förstl, M.; Azuatalam, D.; Chapman, A.; Verbič, G.; Jossen, A.; Hesse, H. Assessment of residential battery storage systems and operation strategies considering battery aging. Int. J. Energy Res. 2020, 44, 718–731. [Google Scholar] [CrossRef]
  32. Bašić, M.; Vukadinović, D.; Višnjić, V.; Rakić, I. Dynamic Equivalent Circuit Models of Lead-Acid Batteries—A Performance Comparison. IFAC-PapersOnLine 2022, 55, 189–194. [Google Scholar] [CrossRef]
  33. Lin, C.; Tang, A.; Wang, W. A Review of SOH Estimation Methods in Lithium-ion Batteries for Electric Vehicle Applications. Energy Procedia 2015, 75, 1920–1925. [Google Scholar] [CrossRef] [Green Version]
  34. USABC. Electric Vehicle Battery Test Procedures Manual; Revision 2; Idaho National Engineering Laboratory: Idaho Falls, ID, USA, 1996. [Google Scholar]
  35. Groenewald, J.; Grandjean, T.; Marco, J. Accelerated energy capacity measurement of lithium-ion cells to support future circular economy strategies for electric vehicles. Renew. Sustain. Energy Rev. 2017, 69, 98–111. [Google Scholar] [CrossRef] [Green Version]
  36. Sessa, P.G.; Walton, N.; Kamgarpour, M. Exploring the Vickrey-Clarke-Groves Mechanism for Electricity Markets. IFAC-PapersOnLine 2017, 50, 189–194. [Google Scholar] [CrossRef]
Figure 1. Operation framework for energy storage sharing in a renewable energy base.
Energies 16 05356 g001
Figure 2. DP equivalent circuit.
Energies 16 05356 g002
Figure 3. Revenue of alliance members.
Energies 16 05356 g003
Figure 4. The revenue increase rate of alliance members.
Energies 16 05356 g004
Figure 5. The SOC of energy storage.
Energies 16 05356 g005
Figure 6. Operation of energy storage before and after degradation.
Energies 16 05356 g006
Figure 7. Revenue increase rate of each wind farm.
Energies 16 05356 g007
Figure 8. Revenue increase rate of different market members.
Energies 16 05356 g008
Figure 9. The allocation of ES costs for alliance members under different prediction accuracies.
Energies 16 05356 g009
Figure 10. The allocation of ES costs for alliance members under different penalty coefficients.
Energies 16 05356 g010
Table 1. Model parameters.
ParameterValueParameterValue
T r e f 20 °C μ r e f 0.5
a 0 0.0693   a 1 1.04
a 2   4.14 × 10 10 / s   a 3   1.40 × 10 5
a 4 −0.501   a 5   1.23 × 10 5
γ c e l l 0.0575   ν c e l l 121
E S E S 100 MW·h   P m a x S E S 30 MW
S O H 0 100%   c P S E S 300 USD/kW
c E S E S 1200 USD/kWh   γ 8%
Table 2. Revenue increase rate of each wind turbine.
Wind Turbine Number12345
Revenue increase rate2.24%3.47%1.00%2.99%3.81%
Wind turbine number678910
Revenue increase rate1.51%24.44%26.22%28.61%5.72%
Table 3. Prediction accuracy of wind turbine.
Wind Turbine12345
Prediction accuracy15%10.5%6%20%13%
Wind turbine678910
Prediction accuracy15%5%8%8.3%17%
Disclaimer/Publisher’s Note: The statements, opinions and data contained in all publications are solely those of the individual author(s) and contributor(s) and not of MDPI and/or the editor(s). MDPI and/or the editor(s) disclaim responsibility for any injury to people or property resulting from any ideas, methods, instructions or products referred to in the content.

