Abstract
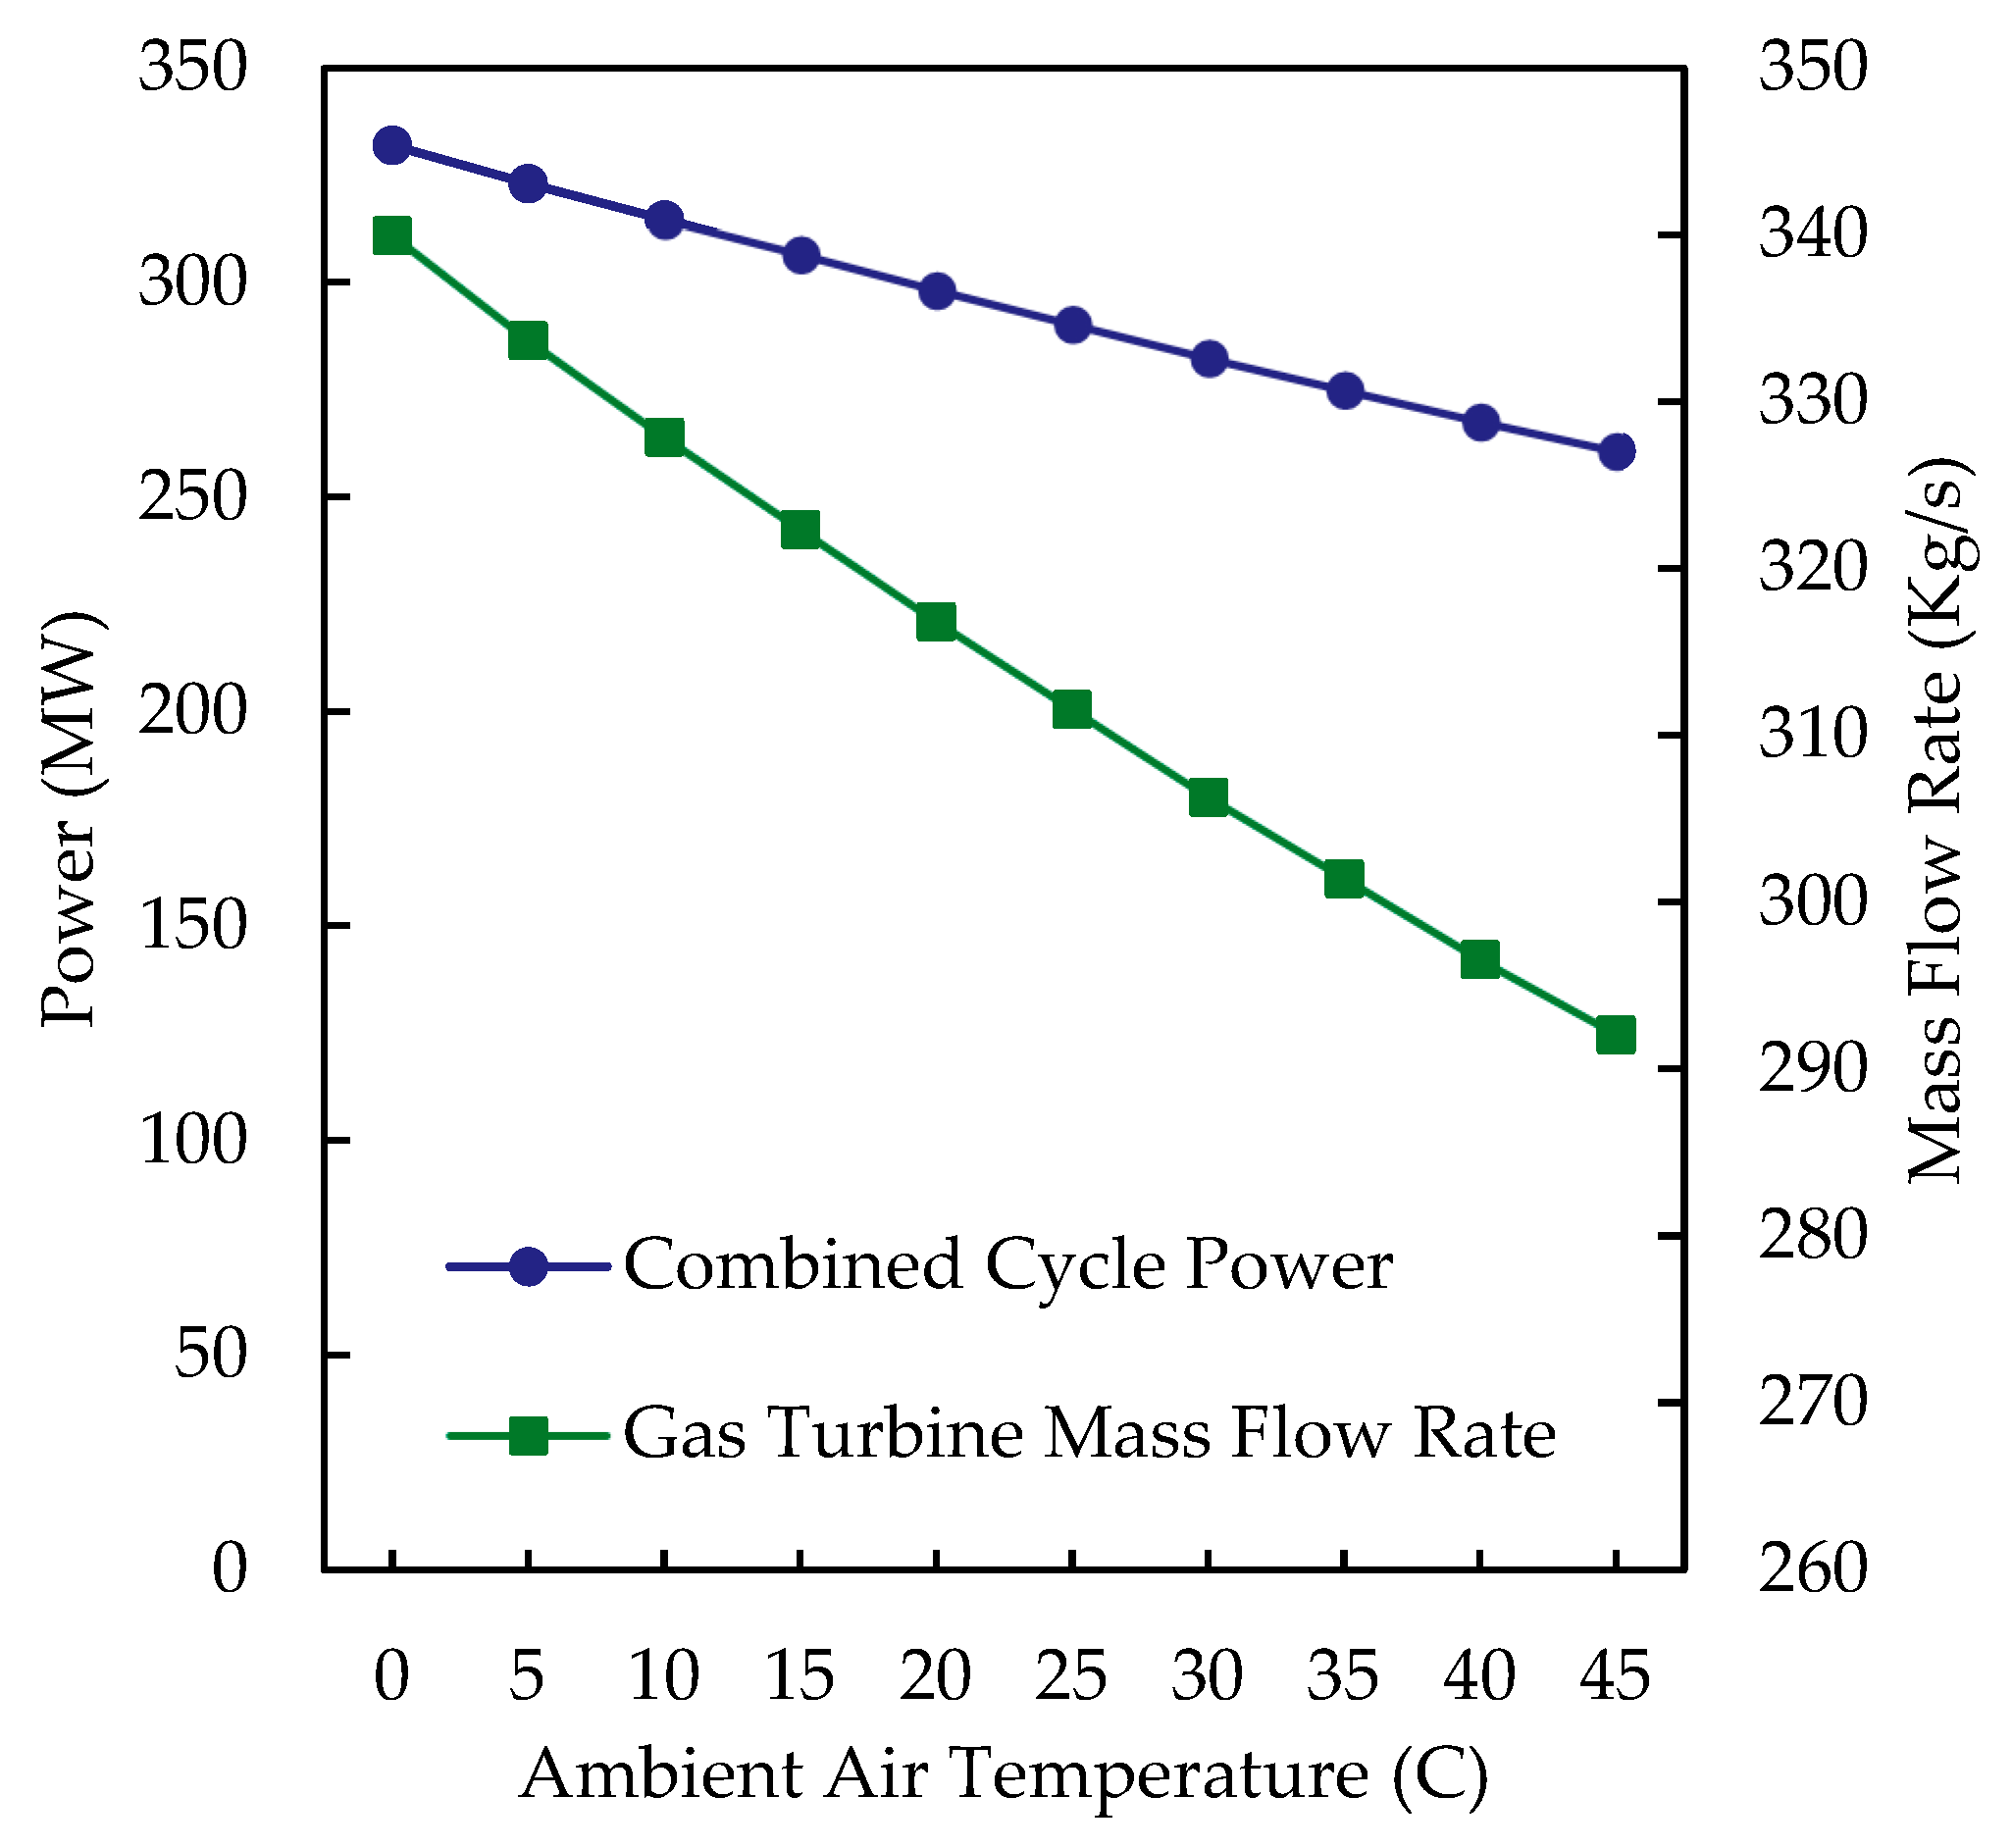
In this study, the thermodynamic behavior of a combined cycle power plant with integrated solar-driven inlet air cooling was simulated for Tehran, Phoenix, and Houston during warm-hot seasons. A considerable reduction in the output power was realized during hot ambient conditions due to the lower density of the air and lower mass flow rate to the turbines. The output power decreases from 306.6 to 260.8 MW as ambient temperature increases from 15 to 45 °C. This research focuses on utilizing solar cooling systems to achieve low inlet air temperature to generate high-electricity yields. Four different types of solar collectors and two different absorption chiller units were selected and simulated for each city to achieve the required goal. It was identified that integrating a solar inlet air cooling (SIAC) system can avert the reduction in output power with no impact on efficiency. The humid climatic condition in Houston and the low electricity cost in Tehran posed some challenges in designing a feasible SIAC system. However, by optimizing the solar collectors and cooling capacities, an optimal solution for utilizing inlet air cooling in humid climates is presented. In terms of overall impact, the evacuated flat plate collector (EFPC) coupled with a double-effect absorption chiller displayed the best economic performance among the four variants under study. In Phoenix, this combination can maintain output power during hot days with a DPR of 2.96 years.
1. Introduction
In the field of thermodynamics, it is known that cycles typically perform optimally at their design point. However, in practical applications, they may experience off-design conditions. Two significant factors that can cause off-design behavior are part-load operation and variations in ambient air temperature.
Steam cycle power plants are particularly vulnerable to part-load operation, leading to lower energy efficiency [1,2,3]. Research has indicated that the control valves in steam turbines contribute to this issue, and optimization strategies have been proposed to address it [2]. Conversely, gas turbines and combined cycle power plants maintain relatively constant efficiencies even at loads as low as 80–85% [4].
When it comes to the effect of ambient air temperature, the performance of steam cycle power plants mainly depends on the condenser pressure. In steam cycles equipped with air-cooled condensers, increase in ambient temperature may lead to increase in condenser pressure which causes reduction in power and energy efficiency of the cycle. However, maintaining a constant condenser pressure can stabilize the output power and energy efficiency of the steam cycle despite changes in ambient air temperature [5,6]. In contrast, in GTs and CCPPs, increase in the air temperature is known as a critical challenge. Increasing ambient air temperature leads to a decrease in the density of the air. Therefore, compressor’s specific work increases, and mass flow rate of the air decreases. Hence, GT and CCPP will generate lower power in warmer temperatures [7,8,9,10]. This reduction in output power coincides with the high electrical energy consumption of air conditioning systems in the hot regions, which imposes a heavy load on the electrical grid. However, increasing the ambient air temperature leads to an increase in combined cycle efficiency [11,12].
In the literature, researchers have investigated inlet air cooling for GTs and CCPPs by application of fog inlet cooling, evaporative cooling, overspray, desiccant cooling, Maisotsenko cooler, NH3-water absorption chiller (AC), LiBr–water AC, and compression chiller [13,14,15,16]. Inlet air cooling systems can augment the electrical power output of the GT with lower capital costs, lead to faster installation, and they are more environmentally friendly than constructing additional power units [17]. The fog inlet cooling and overspray are two techniques that can considerably reduce compressor work and increase the output power of the GT with low investment costs and simple design. However, these techniques lead to higher fuel consumption than the conventional operation of the power plant. Also, the effectiveness of inlet fogging decreases with an increase in ambient temperature and relative humidity [13]. Dawoud et al. [14] compared the performance of the evaporative cooler, fogging cooler, absorption chillers (ACs), and compression chillers for GT inlet air cooling at two different locations in Oman. The highest output power in both the plants was observed with NH3–water AC and vapor compression chiller (equally) throughout the year, followed by LiBr–water AC. Additionally, the authors concluded that fogging cooling is more effective than evaporative cooling by 11.4%.
Modern compression chillers can reach a COP greater than six [18], and these machines can be implemented for inlet air cooling of GTs and CCPPs. However, this system has a high-power consumption that leads to lower efficiency [19]. Alhazmy and Najjar analyzed the effect of inlet air cooling of a GT via vapor compression chiller. It is identified in humid climates, that the power consumption of the compression chillers increases, which leads to a considerable drop in the net output power and efficiency of the GT [20].
In addition to compression chillers, AC can be employed for inlet air cooling of GTs CCPPs. AC produces the cooling effect with less mechanical or electrical power consumption, but they require an external heat source for desorbing the refrigerant from the generator to initiate the cycle. Waste heat, natural gas, hot vapor, or solar energy may supply this external heat. The ACs can be built in multiple stages, namely single-effect, double-effect, and triple-effect. ACs with higher stages have a higher coefficient of performance but require a higher generator temperature. Single-effect absorption chillers (SEACs) require a driving temperature between 80 and 100 °C and can reach a COP in the range of 0.7–0.8. While the coefficient of performance in double and triple-effect absorption chillers can be within the range of 1.22–1.42 and 1.62–1.90, the required driving temperature for them may be up to 180 °C and 240 °C, respectively [21,22].
The biggest challenge of utilizing AC for the inlet air cooling process is supplying the required heat for the operation of the chiller. In gas turbine power plants, the solution to this challenge is quite straightforward. The high-temperature exhaust gases from the GT outlet can be utilized to drive the absorption cooling system [23]. Otherwise, high-grade thermal energy available in the hot exhaust gases will be wasted. Researchers have analyzed the impact of AC as an inlet air cooler for GT and reported improvement in both output power and efficiency [24]. However, the solution is complicated for CCPPs. In these plants, hot exhaust gases from the GT are used to produce high-grade steam in the heat recovery steam generator (HRSG). For supplying the required heat, some scenarios, such as extraction of produced vapor from the steam cycle, utilizing the gases leaving the HRSG, and extraction of gases from HRSG, have been proposed by researchers [25,26,27,28]. However, all these scenarios have specific disadvantages and limitations. The extraction of vapor from the steam cycle decreases the power production of the bottoming steam cycle [29]. Khaledi et al. [27] concluded that by supplying the required heat from the steam cycle, both the net power and efficiency of the CCPP decrease. Also, gases leaving the HRSG have a temperature near the dew point and further cooling of gases leads to acid formation and corrosion. Finally, the extraction of gases from HRSG decreases the mass flow rate of vapor production. It has been reported that the output power of the CCPP increases, but the efficiency decreases with this method [25].
In conclusion, for effective cooling of the inlet air in CCPPs, an external heat source is necessary to drive ACs to avoid all the above-listed issues. Supplying this external heat with fossil fuel-driven processes will lead to an increase in fuel consumption and higher environmental pollution. Unfortunately, inlet air cooling using solar-driven ACs has rarely been studied in the literature. Abdel Rahman and Mokheimer [30] investigated the inlet air cooling of a CCPP using an AC unit driven by the parabolic trough collector and an absorption chiller. It is reported that the capital cost of a solar-driven AC is higher than conventional AC but cheaper than building additional power units to compensate for the reduced power during hot summer days. Popov [31] studied two distinct solar-assisted inlet cooling systems to assist CCPPs. Popov compared the performance of a photovoltaic (PV) driven mechanical chiller with ACs driven by the linear Fresnel collector for inlet air cooling of a CCPP. The author reported a similar efficiency for both systems, but economically PV-driven compression chiller requires higher capital costs than its thermal equivalent.
In this research, a comprehensive study on solar inlet air cooling technology for a CCPP is conducted considering both technical and economic aspects. To the best of authors’ knowledge, a similar study has not been conducted yet. The performance of a CCPP equipped with SEAC and DEAC inlet air cooling is simulated with different types of solar collectors, including upcoming EFPC, which was less discussed in the literature.
2. System Description
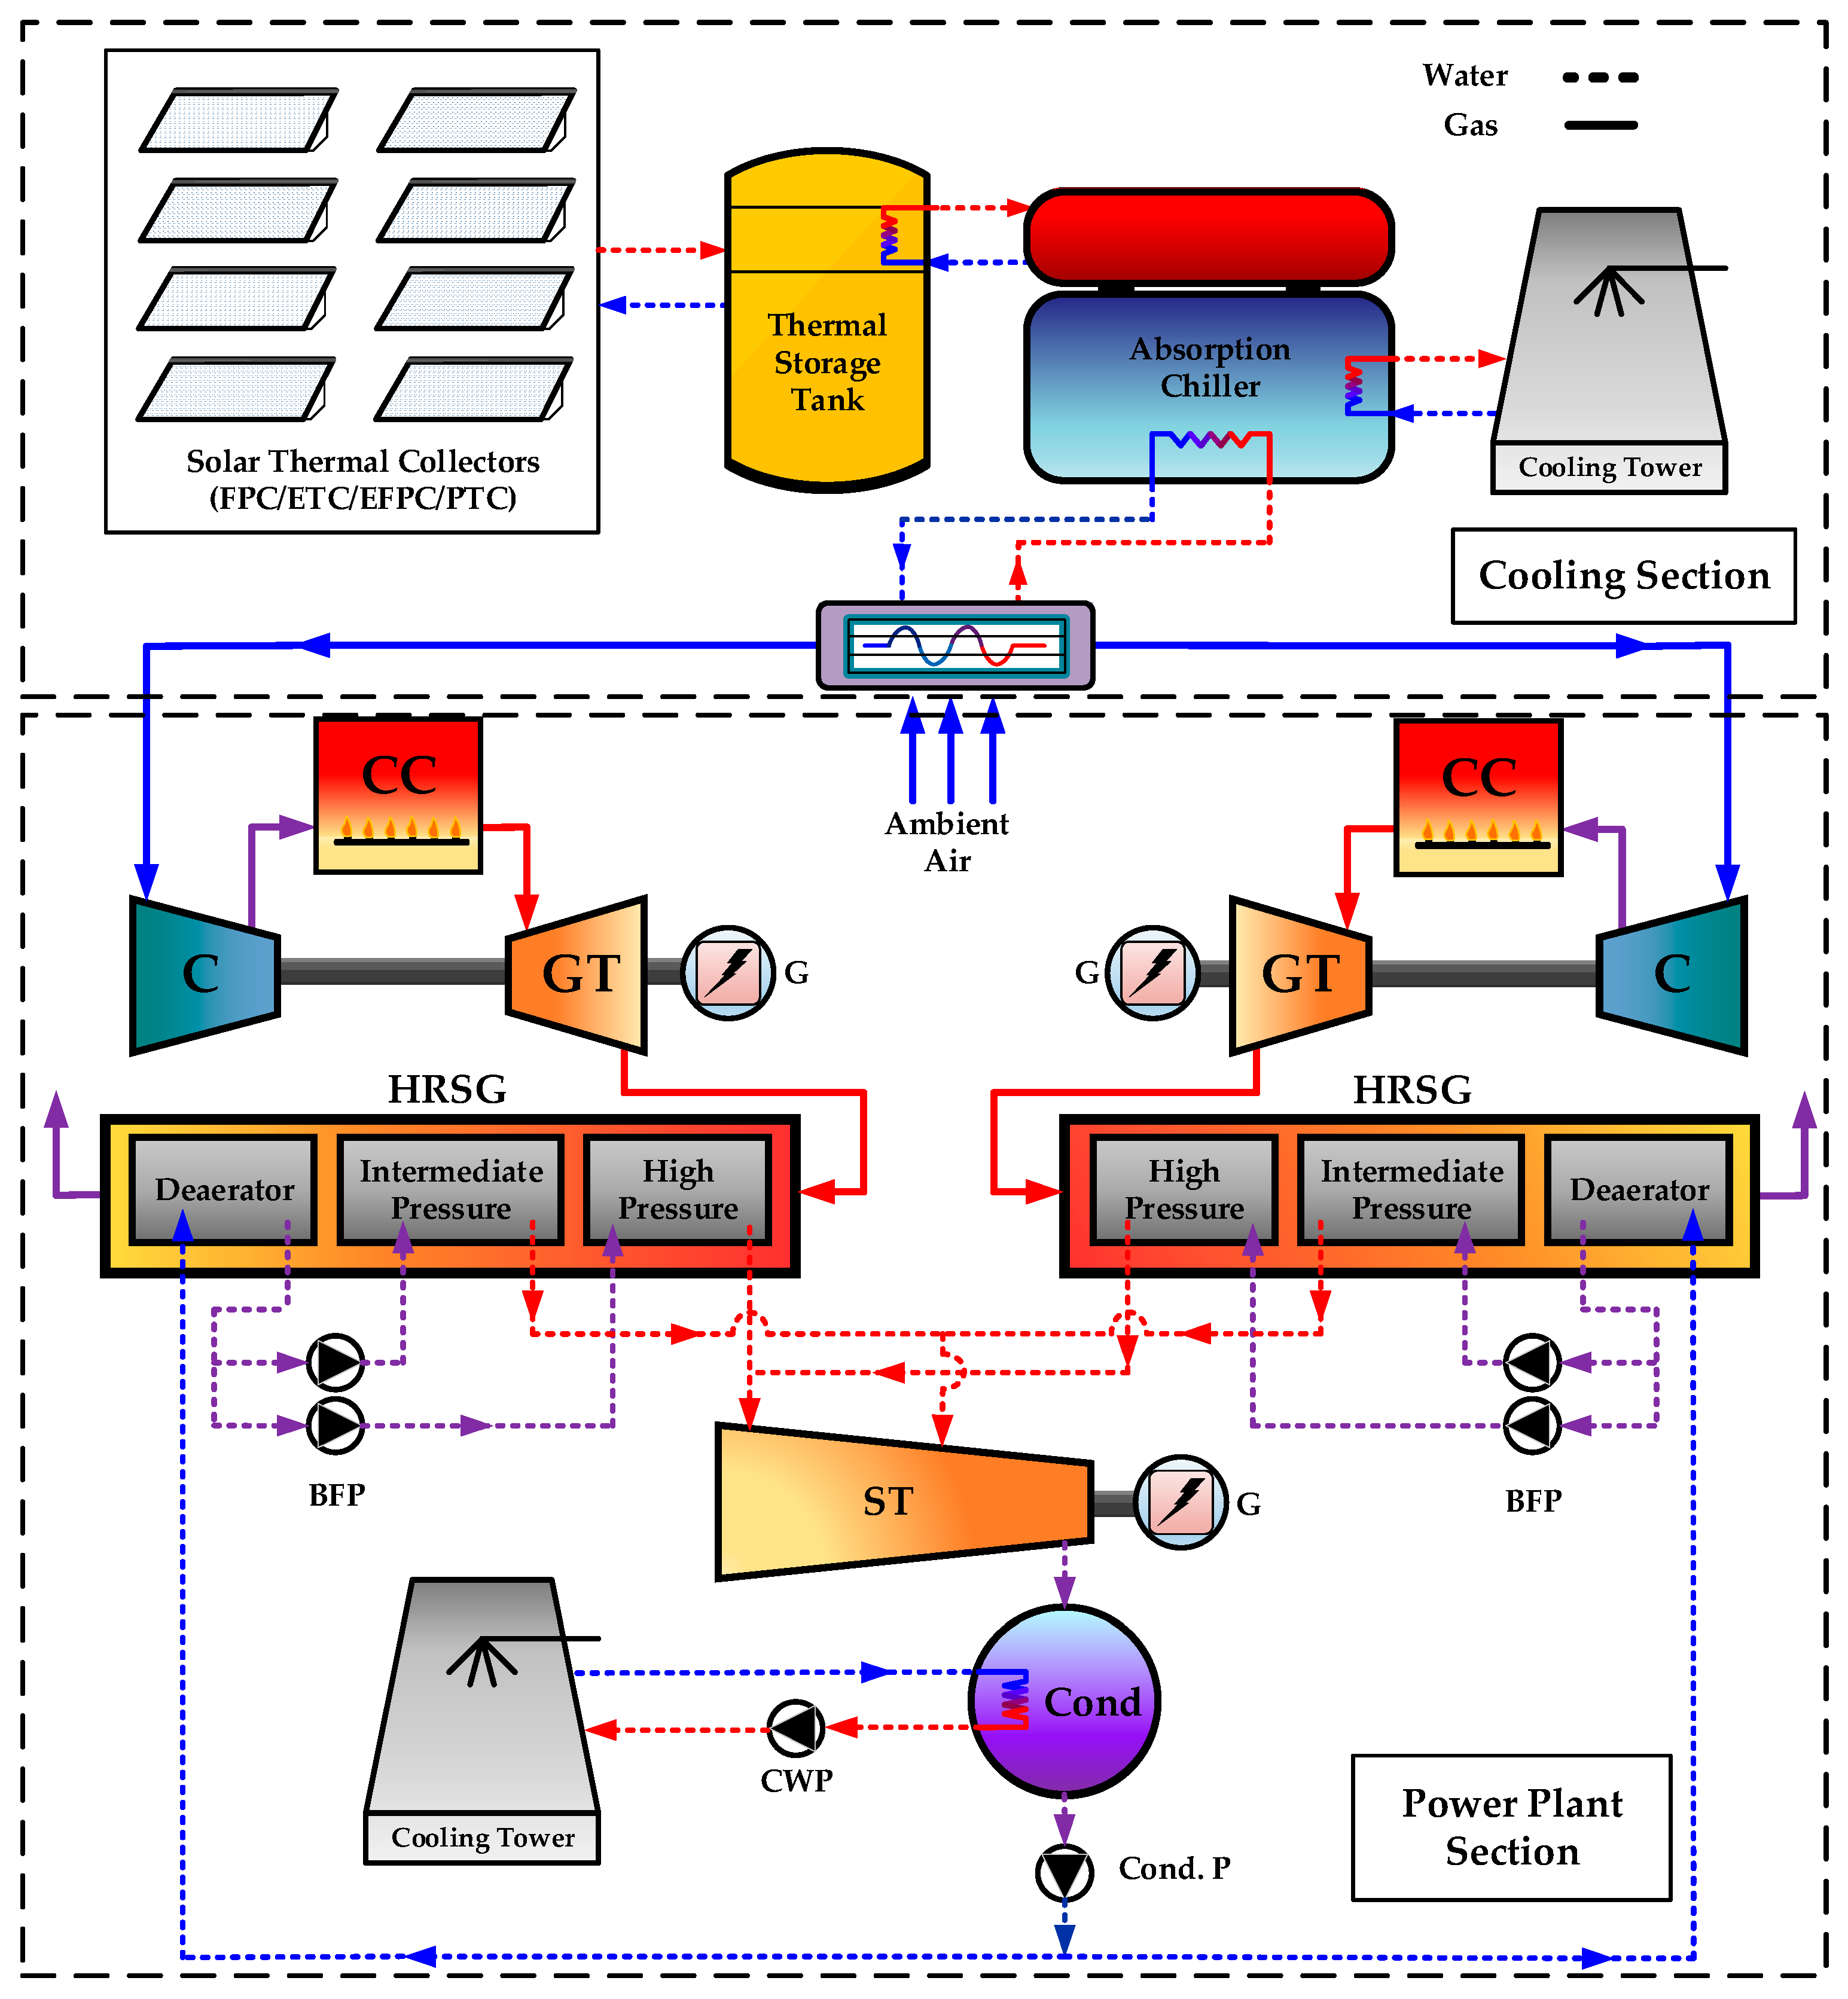
In this paper, transient performance of Montazer–Ghaem CCPP is analyzed with different inlet cooling configurations. This power plant is located in Karaj, Iran. The schematic sketch of the power plant is shown in Figure 1. Each steam cycle is powered by exhaust gases from two GT units, and each GT is connected to a horizontal HRSG. Ambient air is pressurized in the compressor and supplied into the combustion chamber. Compressor work depends on the inlet air temperature. The combustion chamber is fueled with natural gas to generate high-temperature gases and drive the GT. Exhaust gases enter the HRSG at a temperature between 530 and 560 °C and leave at 107 °C. High pressure and intermediate pressure vapor are produced in the HSRG to drive the steam cycle as shown in Figure 1. The steam turbine is equipped with a direct contact condenser that rejects heat to the environment through a dry cooling tower.
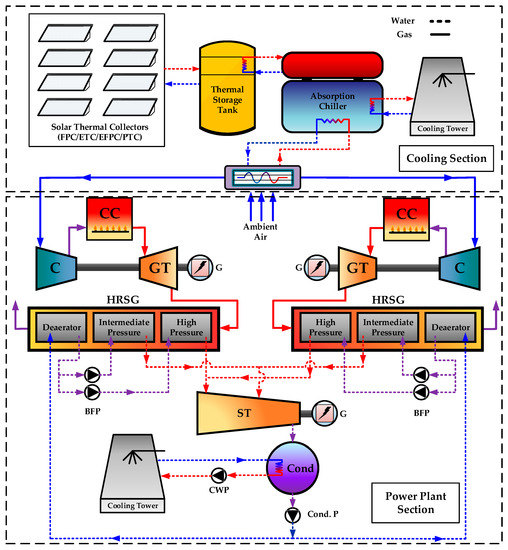
Figure 1.
Schematic diagram of Montazer–Ghaem combined cycle power plant.
To cool the air entering the GT, this study examines four different solar-powered cooling systems. The efficiency of the power plant with various solar inlet cooling methods is being evaluated using weather data from three different cities: Tehran, Phoenix, and Houston. Tehran and Phoenix have similar hot and dry climates, but have different electricity costs, which play a crucial role in the financial feasibility of the project. Houston, on the other hand, has a hot and humid climate, which can increase the costs and cooling demands of the system. Designing inlet air cooling systems in humid climates is difficult due to the latent heat caused by moisture in the air [20,28]. A thorough study has been conducted to find a solar-powered inlet air cooling solution for combined-cycle power plants that can operate in humid conditions. Figure 1 (Cooling Section) illustrates the implementation of the solar inlet air cooling system for the combined-cycle power plant.
This study investigates the utilization of SEAC and DEAC for solar inlet air cooling. DEAC offers a higher COP and improved cooling performance but requires higher generator temperatures. Concentrating solar power, known for its enhanced performance and efficiency at elevated temperatures, is often employed to achieve higher temperatures [32,33]. Also, EFPC, a non-concentrator collector, has demonstrated satisfactory performance at temperatures up to 180 degrees Celsius. Consequently, PTC and EFPC are considered potential power sources for DEAC. FPC and ETC are also studied to drive SEAC.
No auxiliary heater is utilized in these systems, but a heat storage tank is included in each system to compensate for solar power fluctuations. The cooling systems are simulated in TRNSYS, considering varying temperatures and humidity levels in the three cities. Finally, the performance of each system is compared across different locations, considering economic and technical aspects.
3. System Modeling
3.1. Combined Cycle Power Plant
To evaluate the performance of power plant at different operating conditions, first law of thermodynamics is written for different equipment of the plant as follows:
Temperature and pressure of the air at compressor outlet and required work for the compressor can be calculated using below equations.
In which, T1 is the compressor inlet temperature, ηc is the compressor isentropic efficiency, rc is the pressure ratio of compressor, k is the specific heat ratio of air, is mass flow rate of air and h1 and h2 are specific enthalpy of air at inlet and outlet of compressor, respectively.
By considering control volume around the combustion chamber, one can write Equation (5) as follows:
where, is combustion chamber efficiency, LHV is lower heating value of the fuel and is mass flow rate of gases leaving the combustion chamber.
GT outlet temperature and its power production are calculated using Equations (7) and (8).
where, T3 is the TIT, is isentropic efficiency of GT, kg is specific heat ratio of gas and h3 and h4 are specific enthalpy of gas at inlet and outlet of GT, respectively. Specific enthalpy of gas can be calculated considering mass fraction of its components and specific enthalpy of each component at given temperature and pressure.
The net power production by GT can be obtained is given as in Equation (10).
Writing Equation (11) for HRSG gives an equation for thermal efficiency of HRSG.
where, h5 specific enthalpy of gases leaving the HRSG, is mass flow rate of water and and are mass flow rate of intermediate and high-pressure water, respectively.
By considering mechanical and thermal efficiencies of steam turbine, power production of the bottoming cycle can be calculated as bellows:
As a result, the net power production and energy and exergy efficiencies of the combined cycle are determined using Equations (13)–(15).
where, φ is the exergy coefficient of the fuel which is considered as 1.04 for natural gas, as proposed by Kotas [34].
3.2. Solar Collectors
Solar collectors are used to convert sun’s radiant energy to heat. The useful heat which can be removed from the collector, is given by:
where, is the mass flow rate inside the collector, and are the temperature of inlet and outlet flow of the collector, respectively, is collector area, I is solar irradiance and is the collector efficiency.
- Flat plate and evacuated tube collectors.
The efficiency of FPC and ETC is given:
where, is the average temperature of the fluid inside the collector, is zero loss efficiency of the collector at normal incidence angle for the solar radiation and and are first and second order heat loss coefficients, respectively. Table 1 shows the values for the coefficients for different types of solar collectors.
- Evacuated flat plate collectors.
Efficiency of the EFPC can be calculated as [35]:
and are the incident angle modifier for beam and diffuse radiation, respectively. is the coefficient for wind speed dependence of heat losses, coefficient is representative for long-wave radiation dependence of heat loss, coefficient is the effective thermal capacity of the collector and coefficient is responsible for heat loss due to wind speed in zero loss efficiency. These coefficients can be found in Table 1.
- Parabolic trough collectors.
The useful heat gain by a parabolic trough collector can be calculated as follows [36,37,38]:
is the solar beam irradiance and is the collector concentration ratio. IAM is calculated based on Equation (4) in reference [36].

Table 1.
Technical characteristics of different solar thermal collectors.
Table 1.
Technical characteristics of different solar thermal collectors.
| Title 1 | FPC [36] | ETC [36,38] | EFPC [38] | PTC [36] | Unit |
|---|---|---|---|---|---|
| 0.791 | 0.687 | 0.765 | 0.68 | - | |
| 3.94 | 1.505 | 0.508 | 0.4 | ||
| 0.0122 | 0.011 | 0.0070 | 0.0015 | ||
| - | - | - | - | ||
| - | - | - | - | - | |
| - | - | 7.505 | - | ||
| - | - | - | - |
3.3. Cooling System
TRNSYS’s SEAC and DEAC components utilize catalog data obtained from a TESS library file. Chiller performance can be interpolated within the data range but not extrapolated. The default TRNSYS file has a SEAC hot water temperature range of 108.9 to 116.1 °C and a DEAC hot water temperature range of 121.0 to 175.5 °C. According to the literature [39] and our simulation experiences, using this file for cooling capacities and temperatures out of these ranges results in significant errors. Thus, a new data file was developed using experimental data from the two chillers manufactured by BROAD U.S.A. Inc., Hackensack, NJ, USA [40].
In this study, SEAC and DEAC are simulated to produce chilled water. The mass and energy balance equations for chillers are given [41]:
where, is the mass flow rate, x is mass concentration of LiBr in the solution and h is the enthalpy of the fluid. Heat losses in Equation (21) are not considered.
The COP is known as the ratio of heat removal in the evaporator to the require heat in the generator:
3.4. Solar Cooling Performance Index
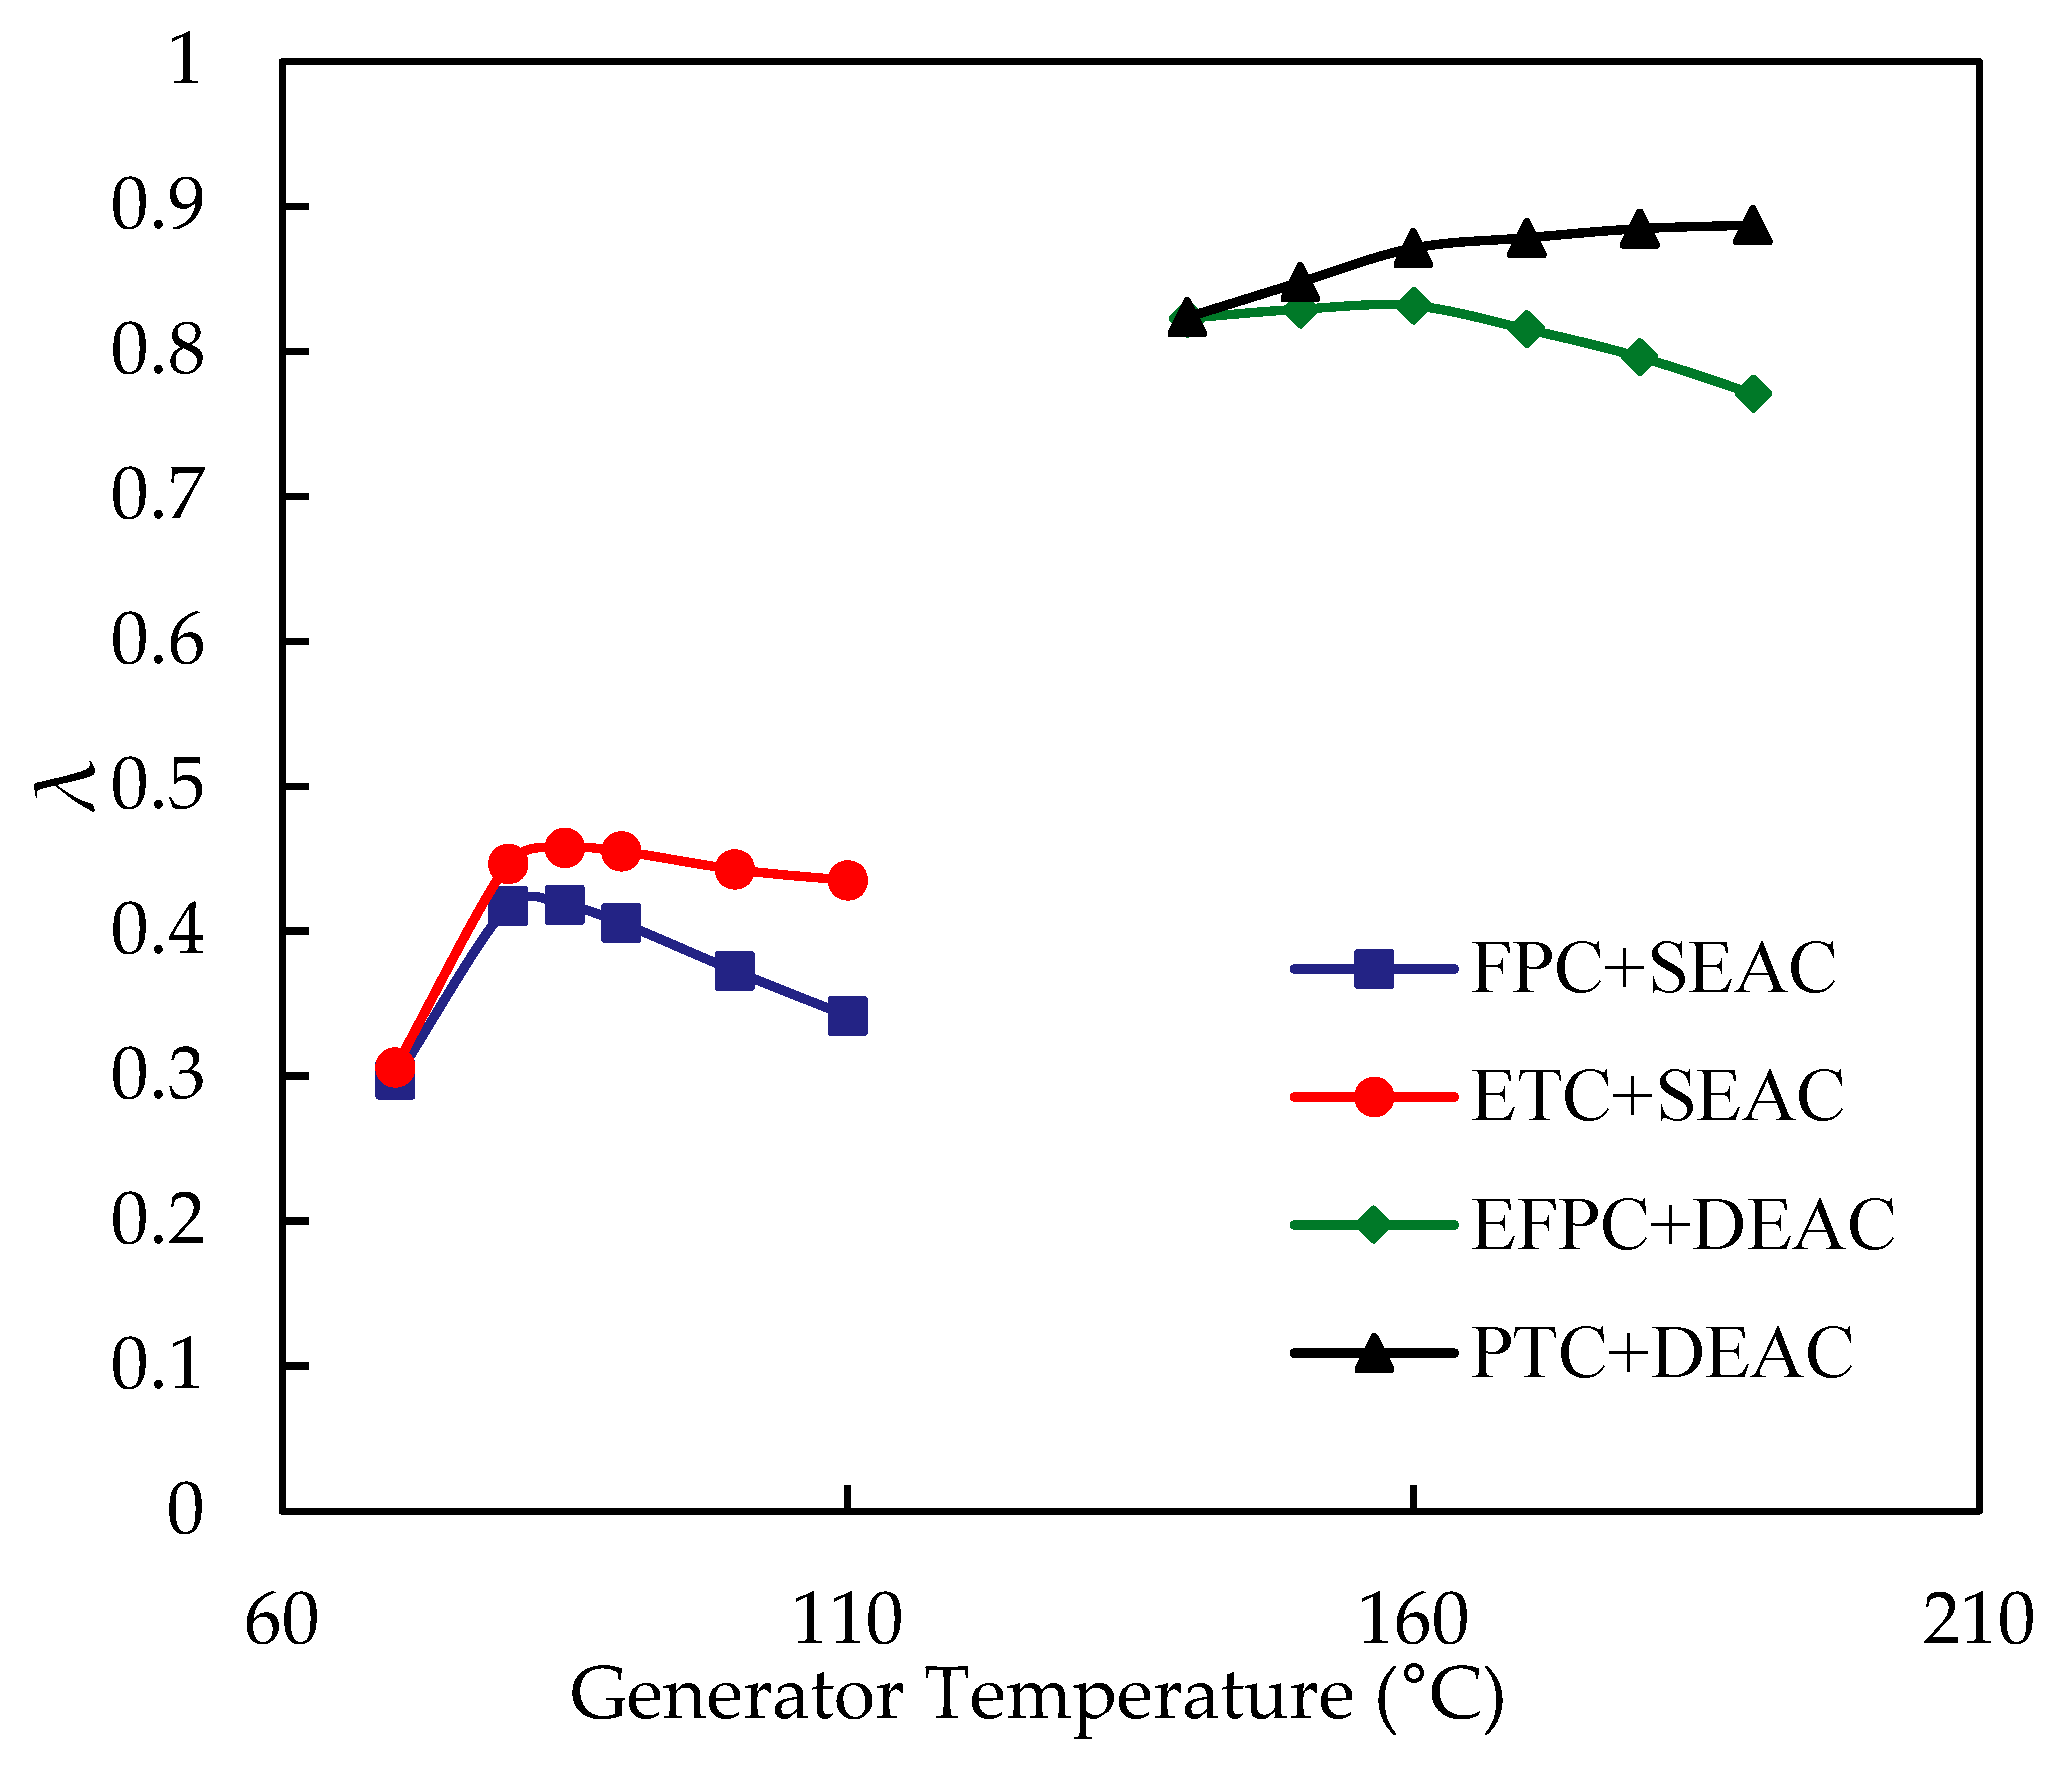
The COP of absorption chillers improves with rising generator temperature [22], but solar collector thermal efficiency decreases with increasing water temperature. In solar-powered absorption cooling systems, it is crucial to determine the optimal generator temperature to enhance performance and reduce collector costs. A solar cooling performance index, which is the product of solar collector efficiency and the COP of the absorption chiller, is defined to identify the optimal generator temperature for each cooling system.
Figure 2 illustrates the change in λ with varying generator temperatures. Optimal generator temperatures for the cooling systems driven by FPC, ETC, EFPC, and PTC are 85 °C, 85 °C, 160 °C, and 190 °C, respectively. The systems are designed to operate near these optimal temperatures for improved efficiency.
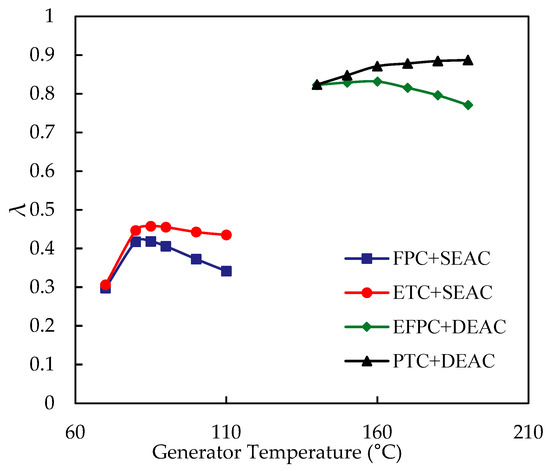
Figure 2.
Variations in λ with generator temperature for different solar cooling systems.
3.5. Economic Analysis
Solar-powered systems offer significant sustainability benefits, but their economic feasibility must be analyzed. This paper uses discounted payback period (DPR) as an economic indicator. DPR measures the time required for the electricity generation revenue to recoup the initial investment in the solar cooling system and considers the time value of money. The DPR calculation follows Equation 32 in reference [23].
The costs of the systems’ equipment and economic assumptions are listed in Table 2.

Table 2.
Components’ costs.
4. Results
4.1. Validation
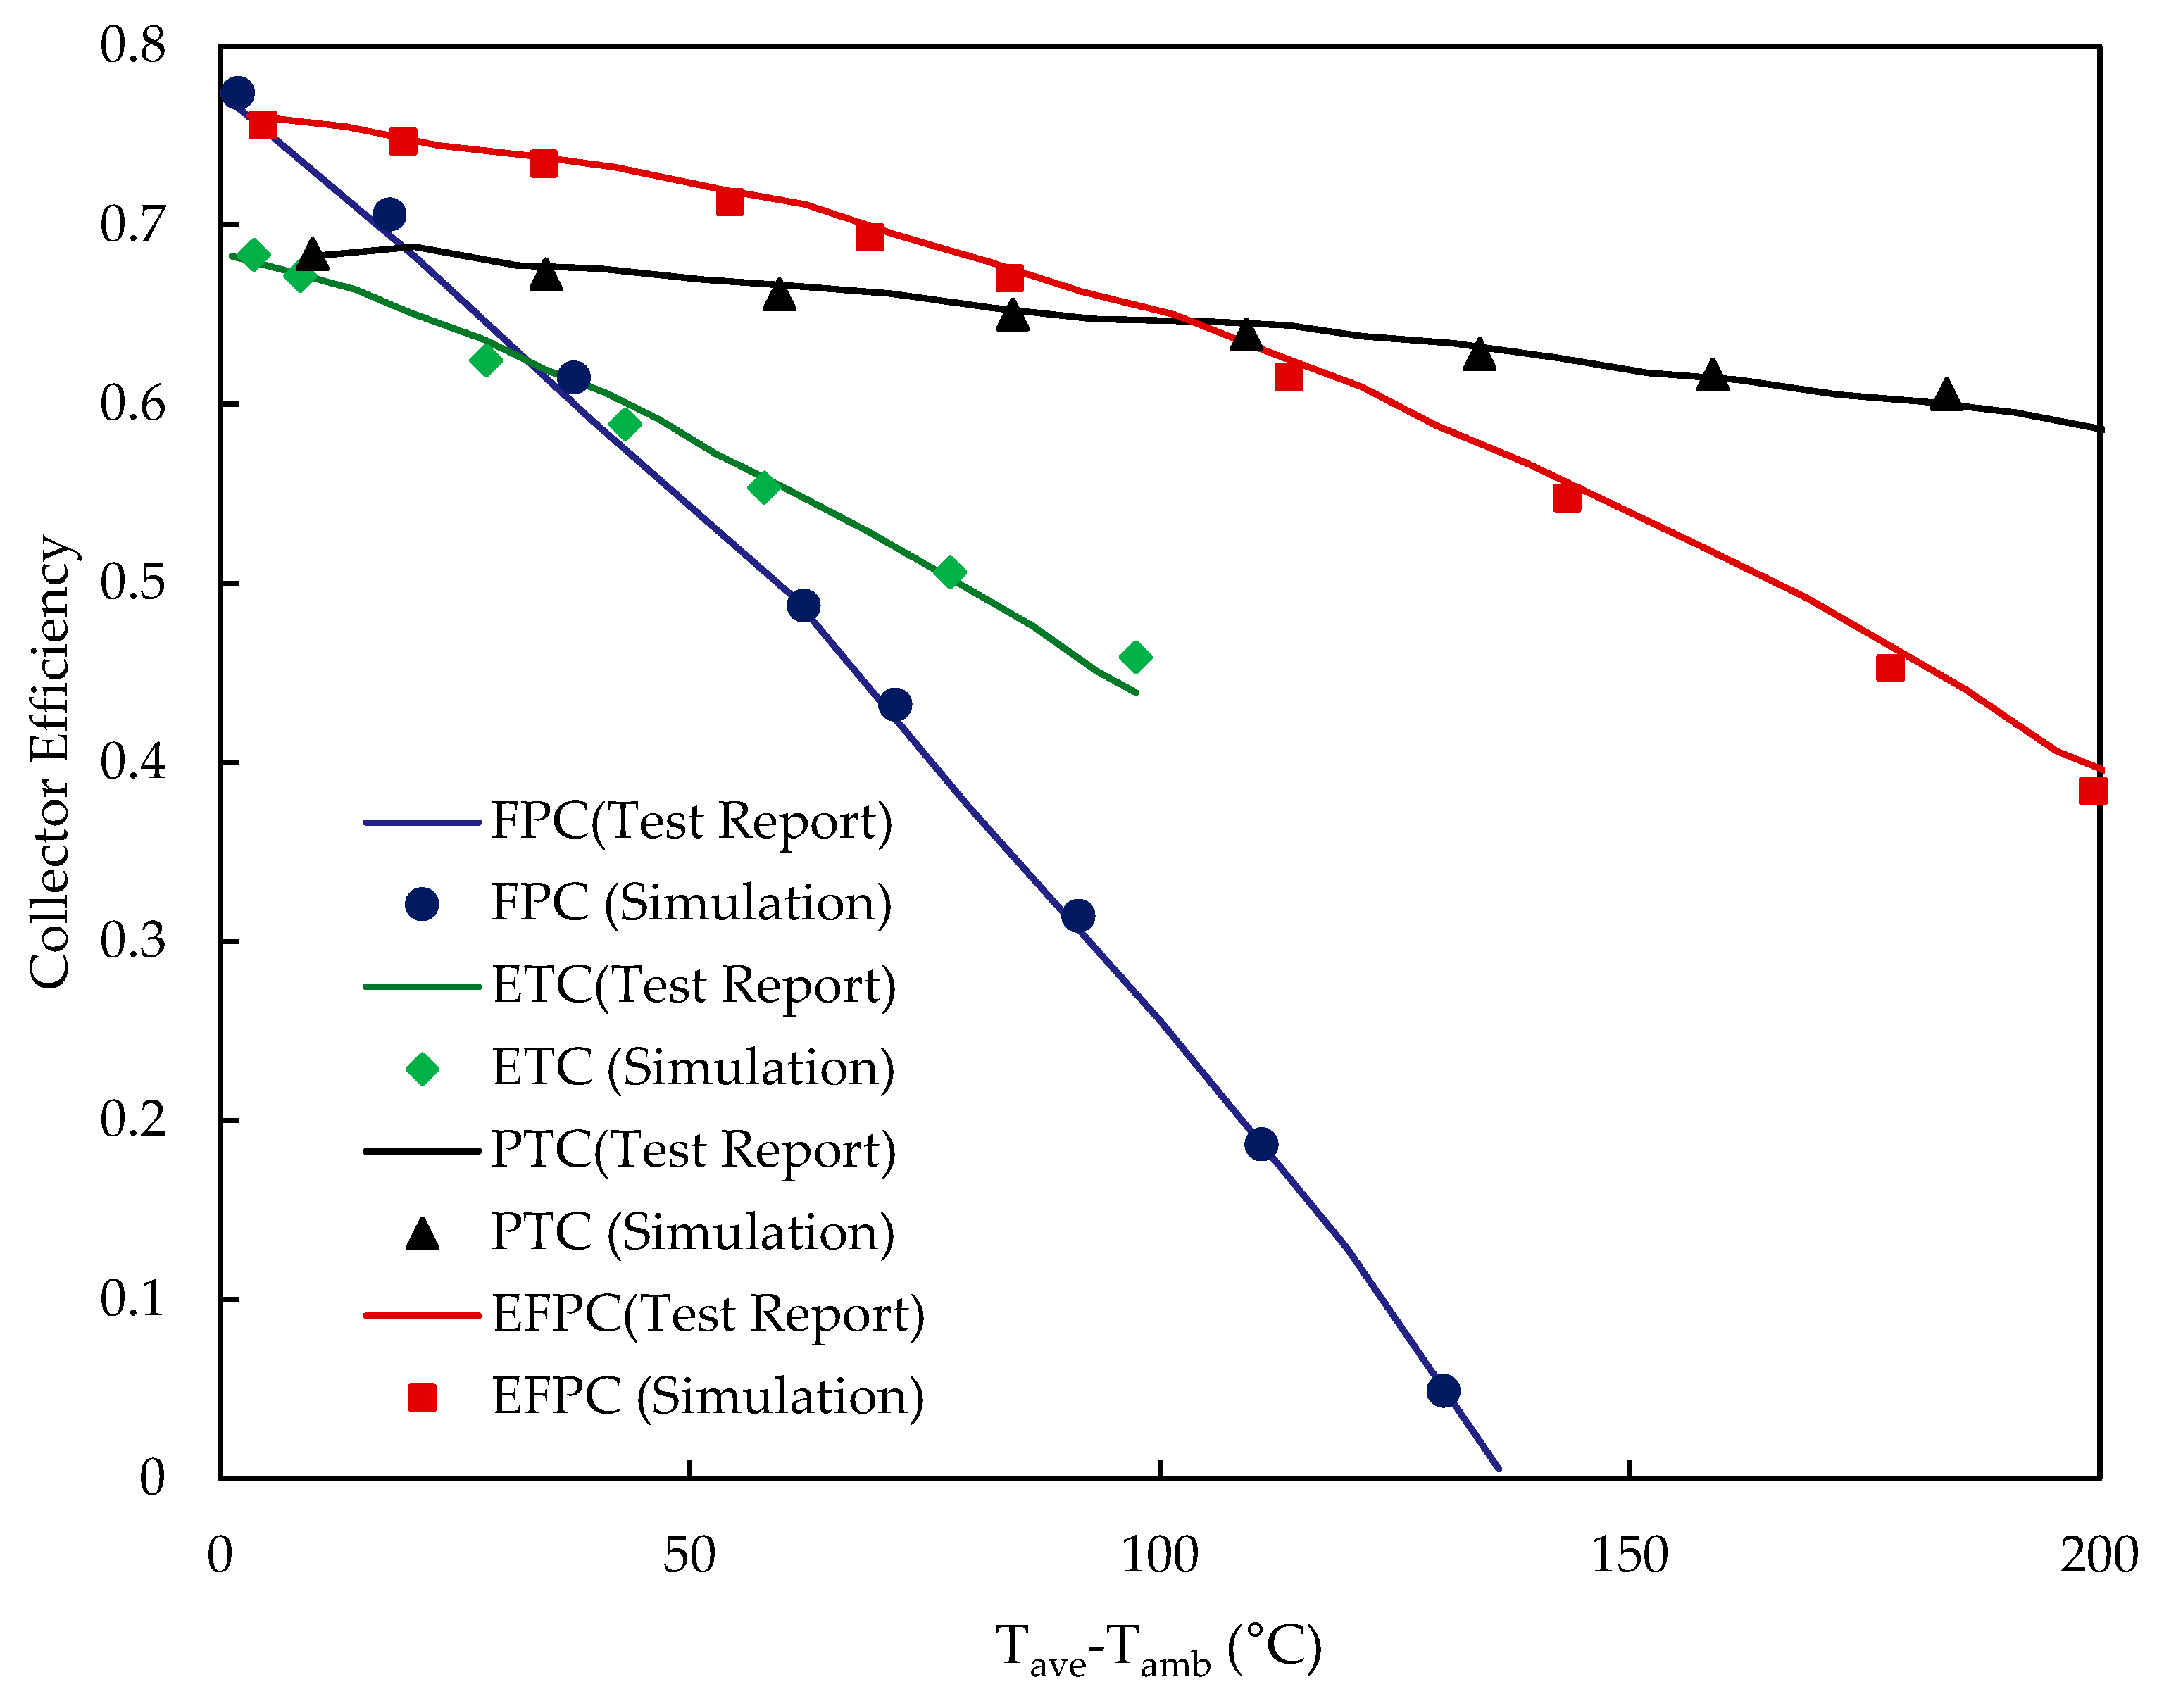
The simulation results of the absorption chillers and the collectors are validated against data reported in the literature [36]. Thermal efficiencies of the selected solar collectors at different fluid temperatures are evaluated using TRNSYS 18. The simulation results show a close fit with the literature with a maximum error of 4.1%, when compared with reference data, as shown in Figure 3.
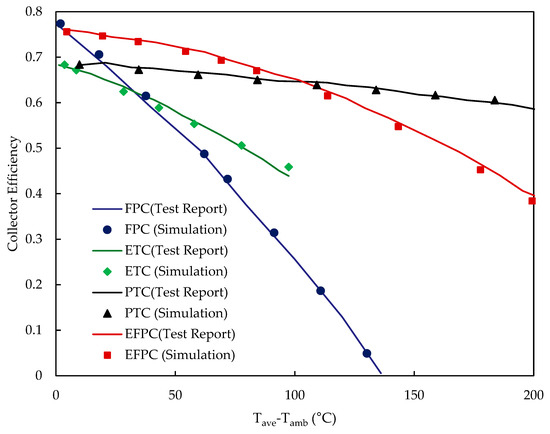
Figure 3.
Validation of solar thermal collectors by comparing their efficiencies with reference sources [32,36].
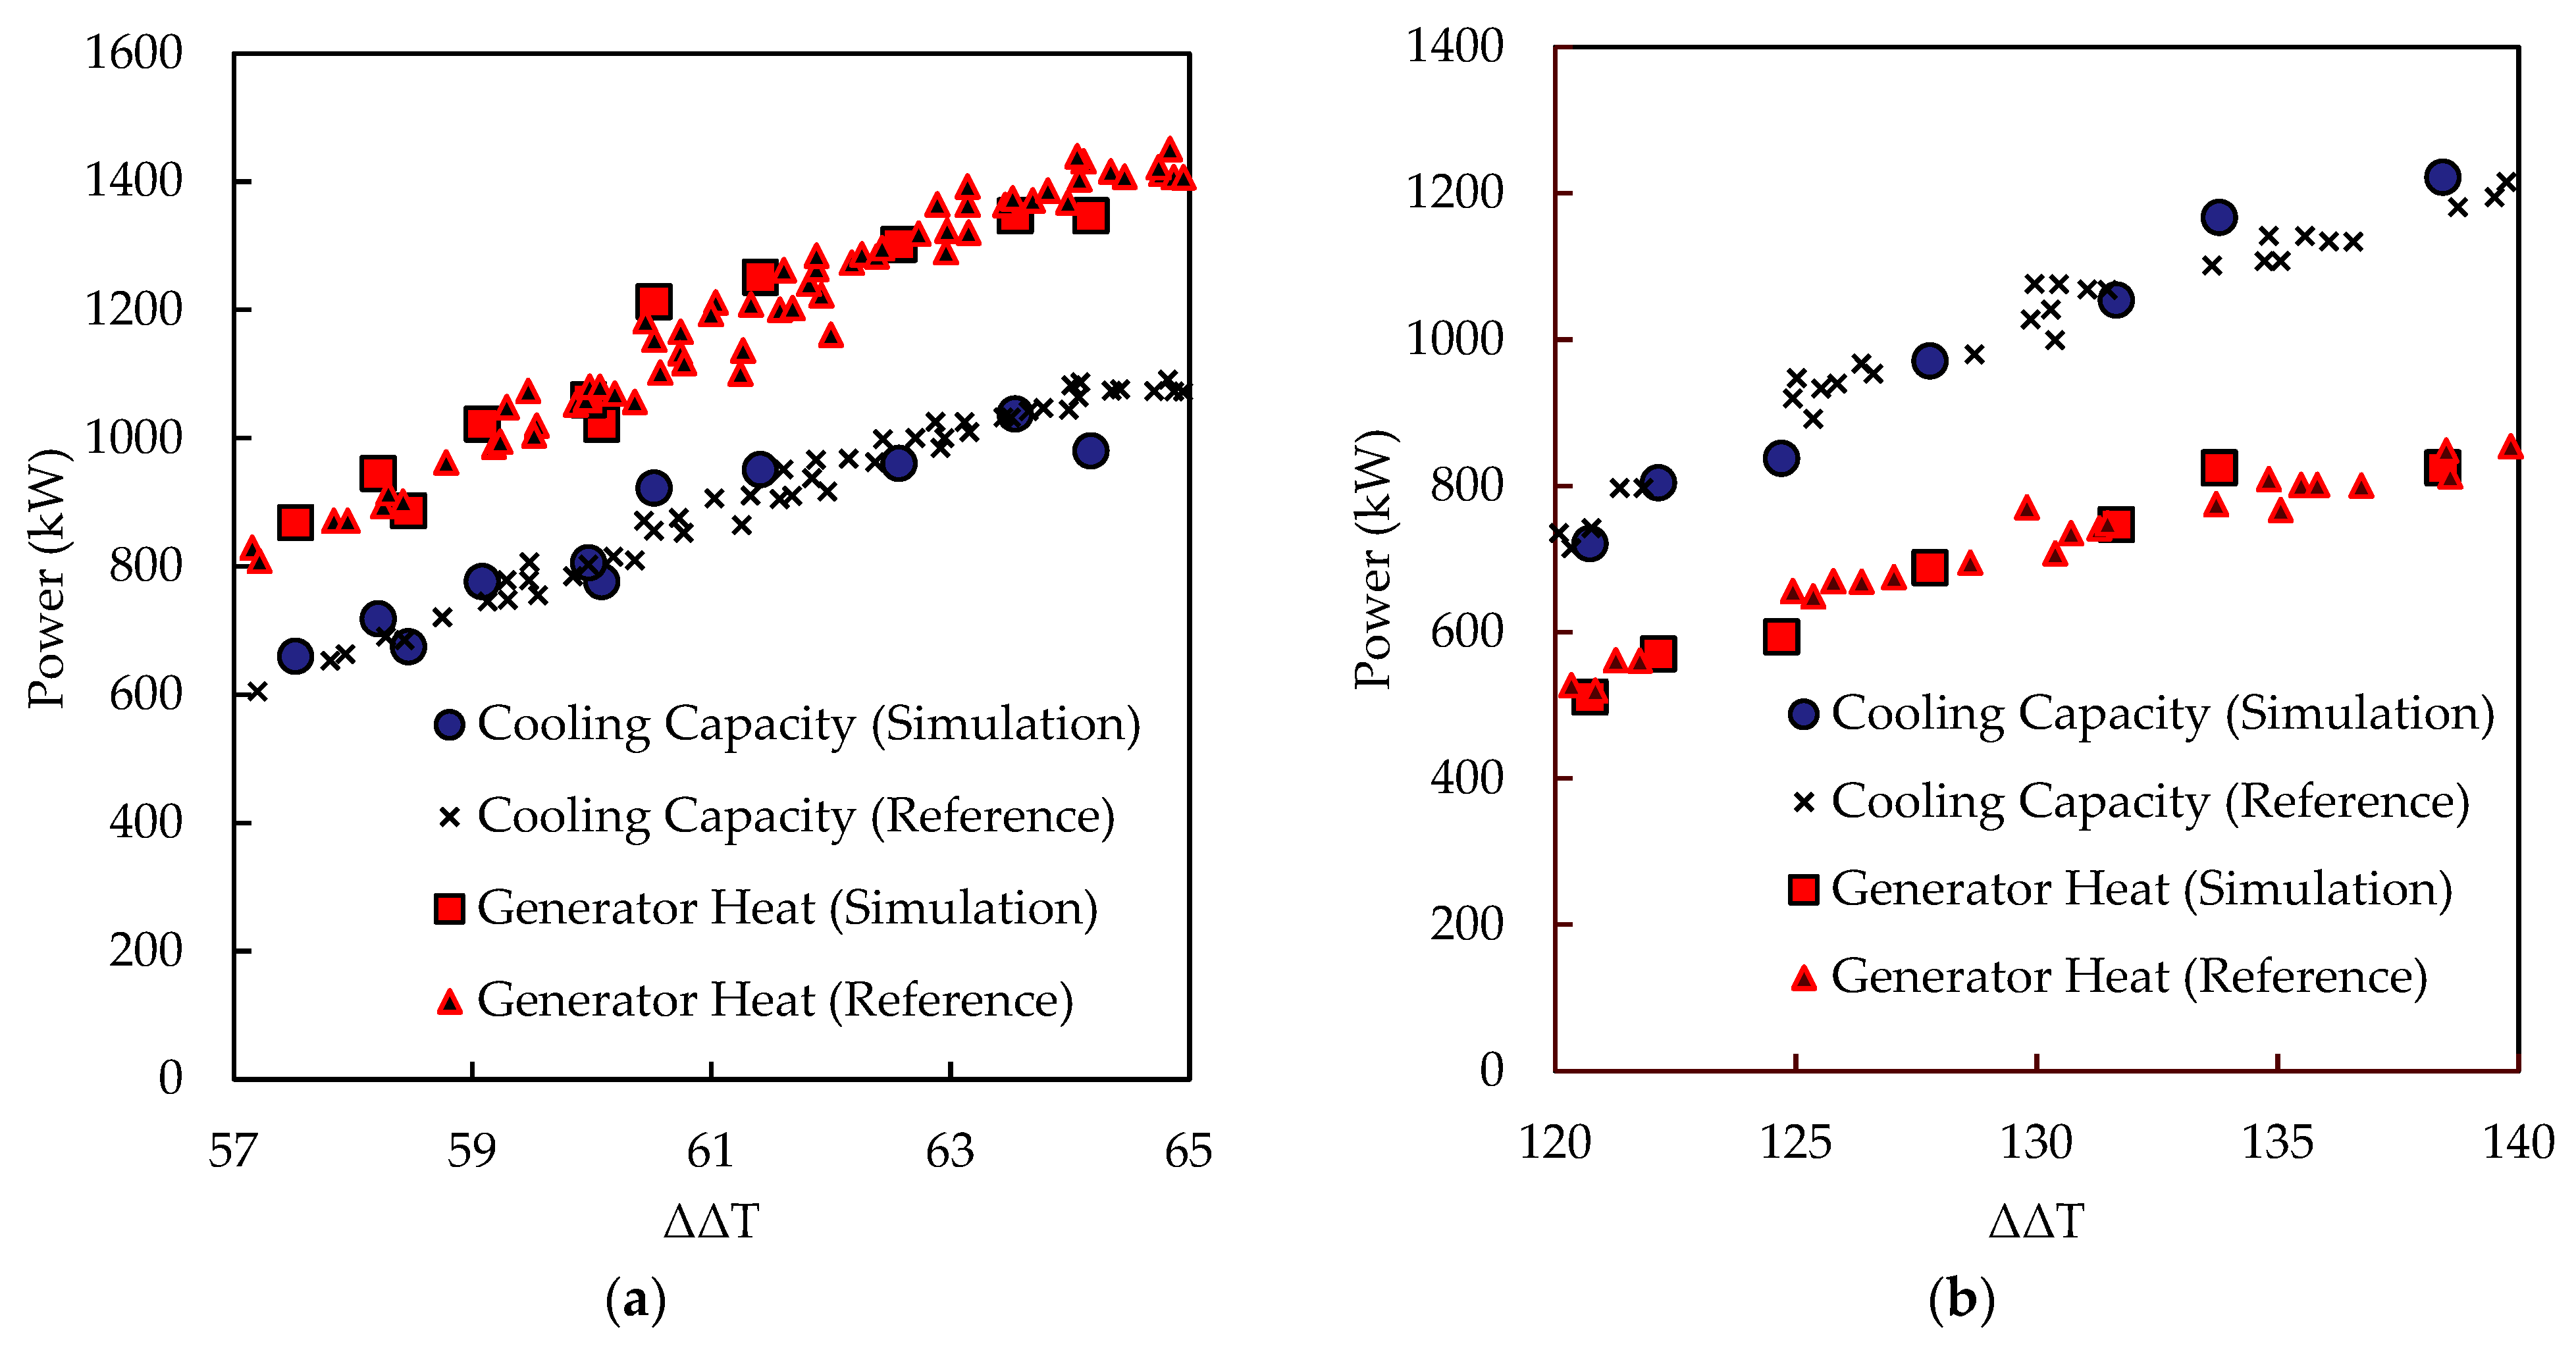
As mentioned in Section 3.2, the TRNSYS component files for SEAC and DEAC are created using information from BROAD U.S.A. Inc. This information was obtained from two chillers from BROAD of different sizes. To make sure the simulation results using these components are accurate, data sets were compared to the literature [38]. They show how the cooling capacity and heat generation change based on a temperature difference (ΔΔT′) that is affected by the average temperature of the fluids in the chiller (generator, absorber–condenser, and evaporator). ΔΔT′ combines the operating temperature of the generator, evaporator, and cooling water into one value, which is explained further in the literature [36]. The simulation results are in good agreement with the reference data, with the biggest errors being 7.8% for SEAC and 6.0% for DEAC, as shown in Figure 4.
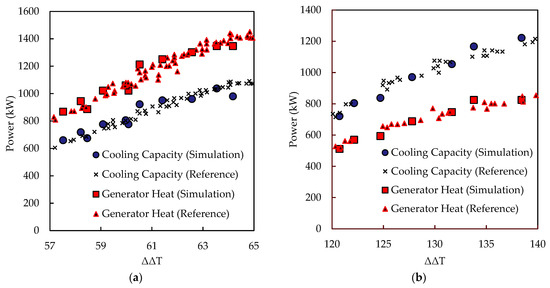
Figure 4.
Validation of (a) SEAC; and (b) DEAC; by comparing the cooling capacity and the driving heat of the present work and the reference [38].
4.2. The Effect of Ambient Temperature on Performance of the Power Plant
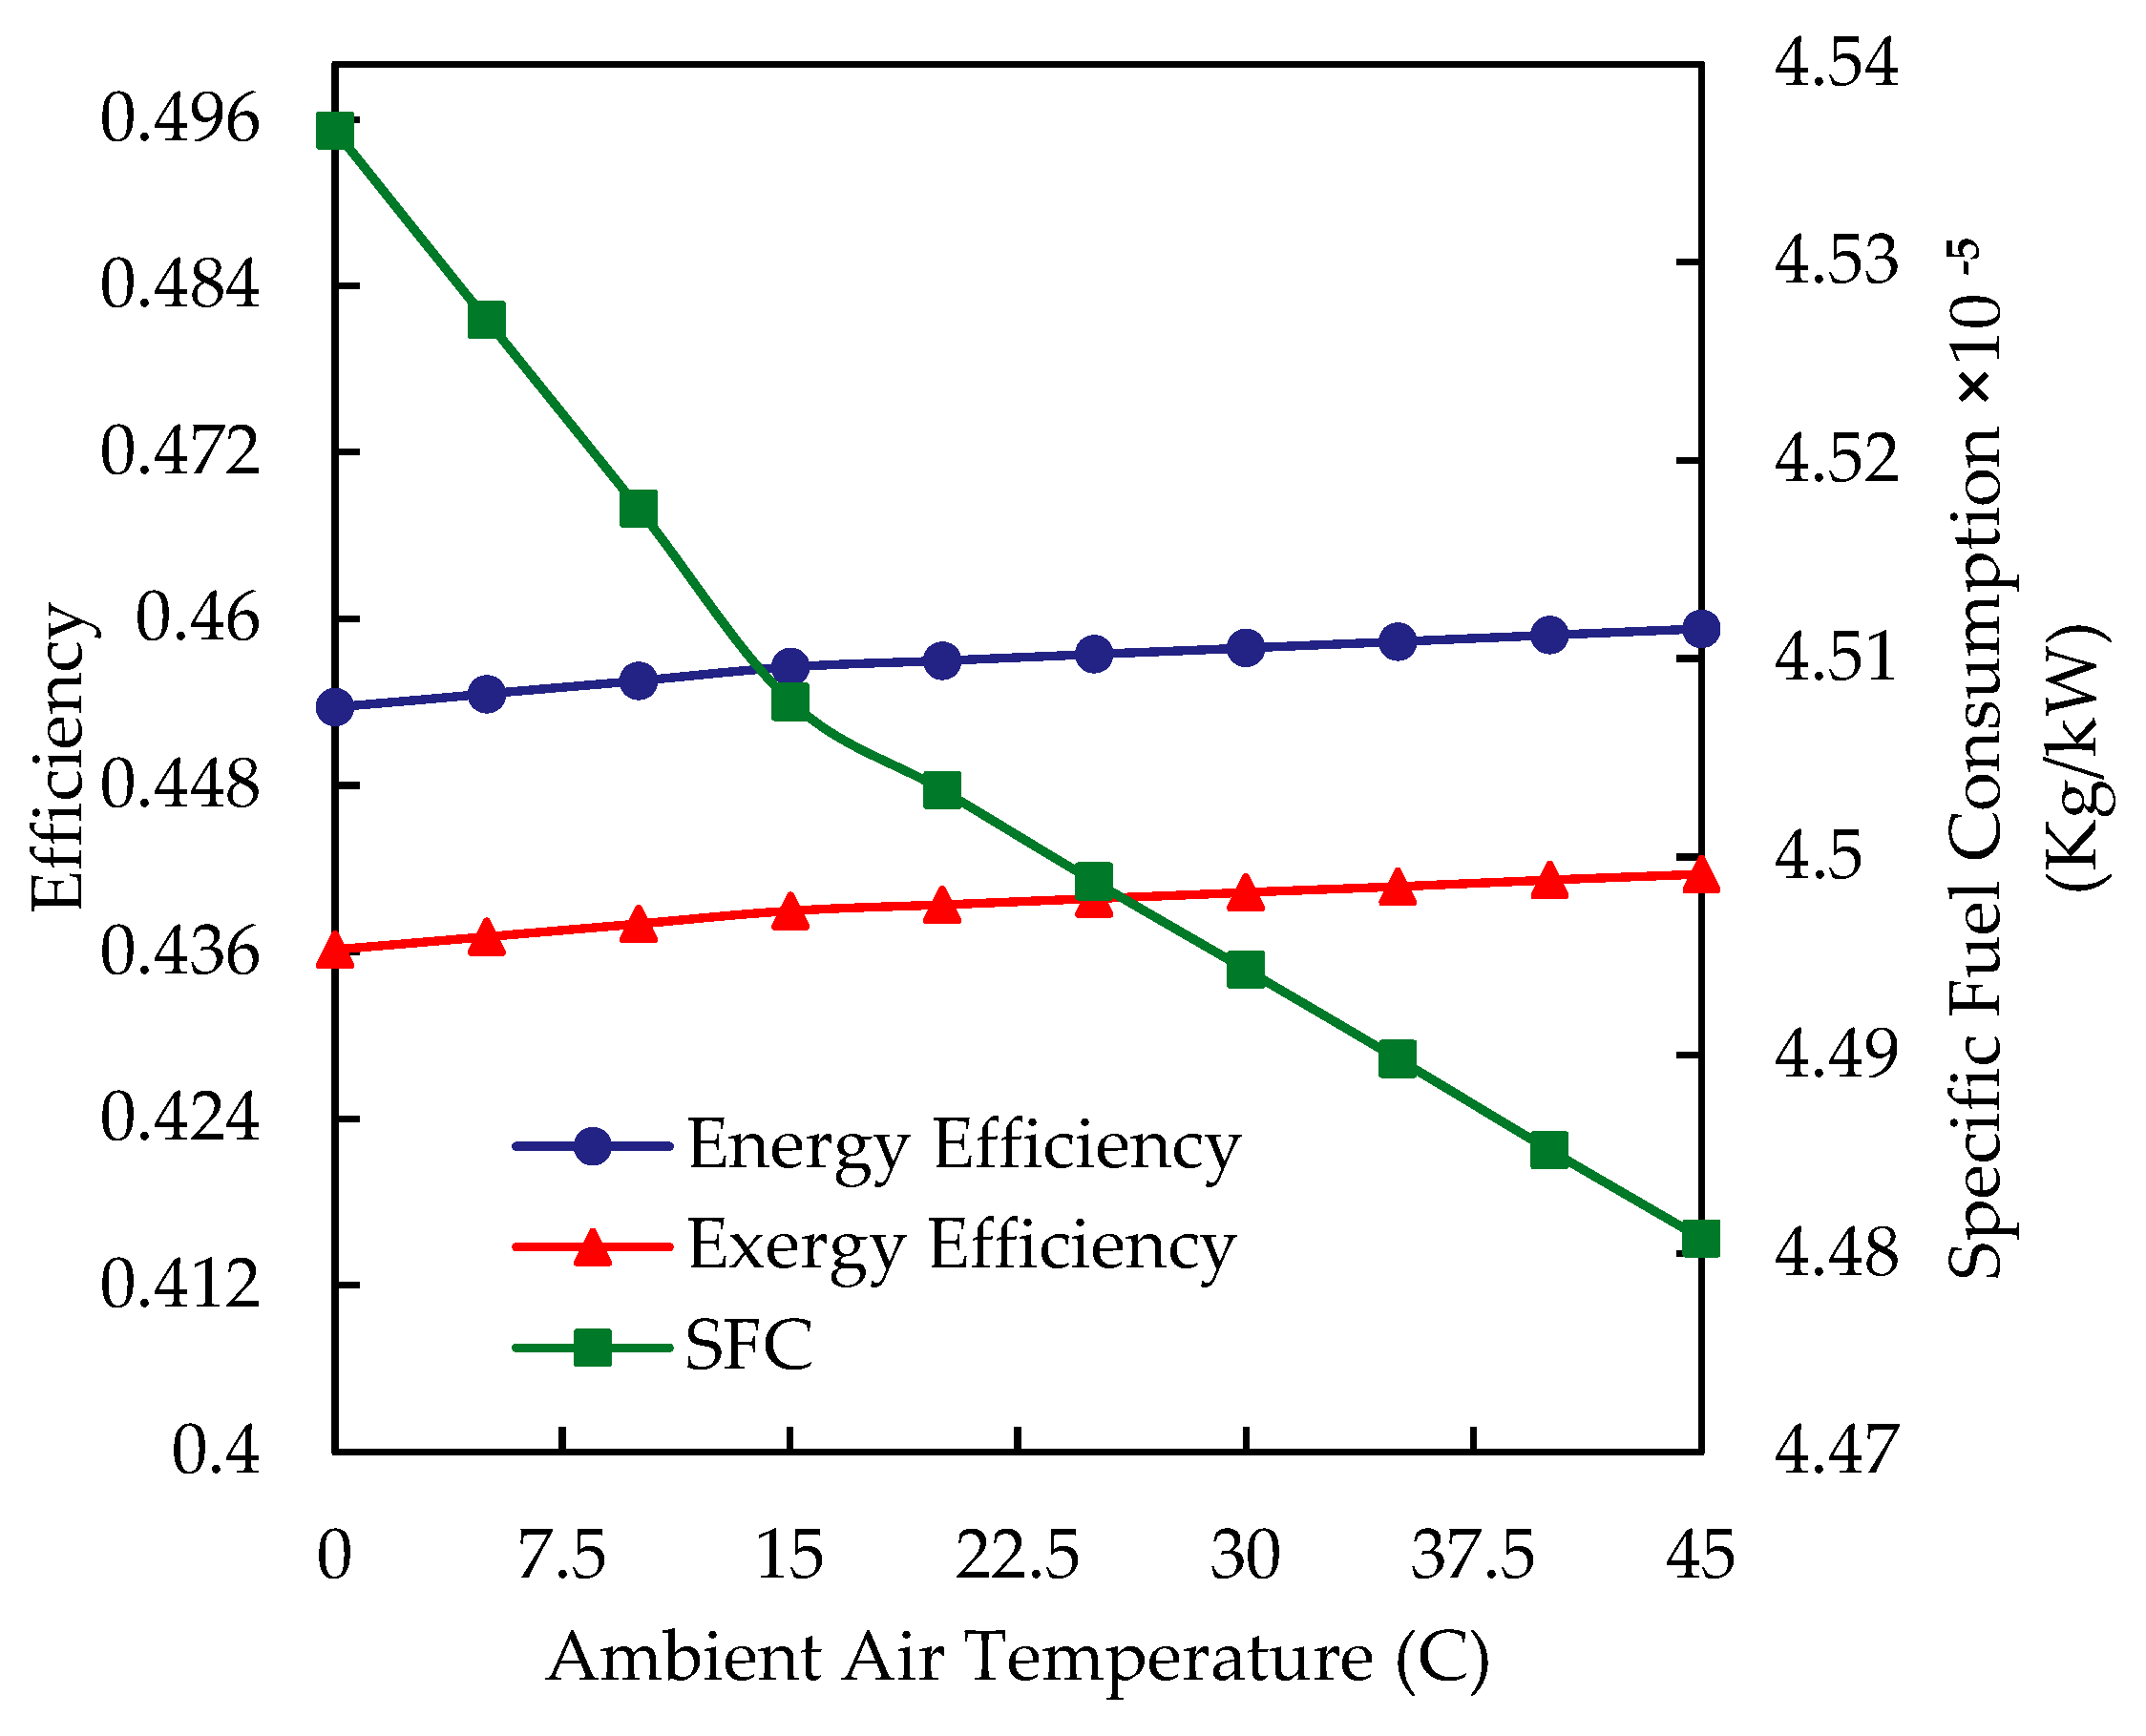
The performance of a CCPP decreases with the increase in the ambient temperature as the density of the air decreases at higher temperatures, which leads to a lower mass flow rate in GT and higher specific work required by the compressor. The effect of ambient temperature on the net power and air mass flow rate is shown in Figure 5. This data are derived from Montazer–Ghaem CCPP performance over a year. The net power reduces by 15% with an increase in ambient temperature from 15 to 45 °C. Figure 6 shows the variations in efficiency and specific fuel consumption with ambient air temperature. At a higher ambient temperature, energy and exergy efficiencies slightly increase, while specific fuel consumption slightly decreases. These are because of the lower heat loss in the HRSG. But eventually, the significant reduction in power with temperature makes the improvement in efficiency negligible. A similar trend was found by Pattanayak et al. [46] as they investigated LNG cold energy utilization for inlet air cooling of a combined cycle power plant. At an ambient temperature of 15 °C, the authors reported the output power and cycle efficiency as 426.33 MW and 58.38%, and at 35 they reported 377.32 MW and 58.75%, respectively.
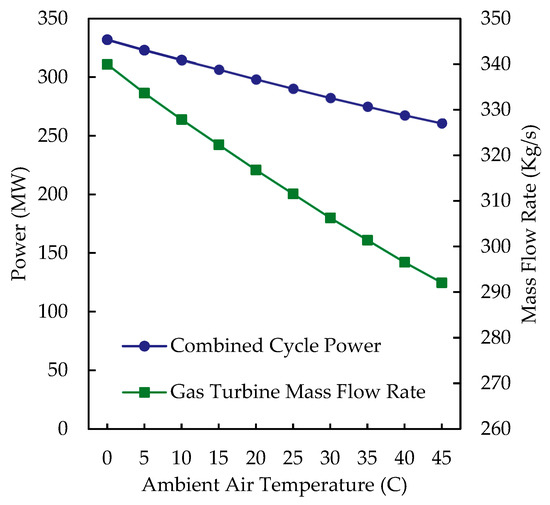
Figure 5.
Variations in the combined cycle net power and gas turbine mass flow rate with ambient air temperature.
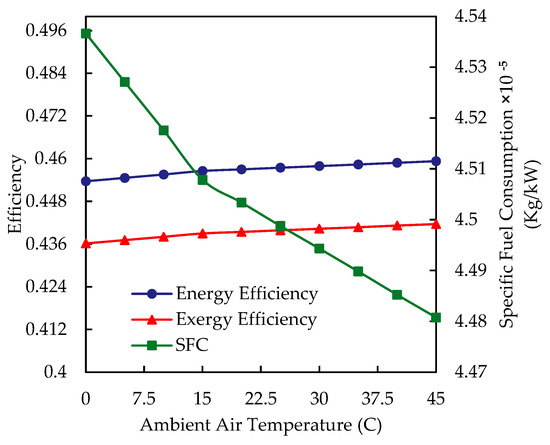
Figure 6.
Variations in SFC and energy and exergy efficiencies with ambient air temperature.
4.3. The Effect of Cooling Systems Utilization on Performance of the Power Plant
In this study, four different solar-driven cooling systems were simulated to evaluate the performance of the SIAC and compare their effectiveness in three different locations. The cooling systems are designed to operate in Tehran, Phoenix, and Houston between the period 21 March and 21 October. In the first evaluation, the cooling systems for each city are designed to decrease the air temperature from 35 to 15 °C. This design strategy led to different cooling capacities and collector areas for each city, but the total additional electricity gain was comparable.
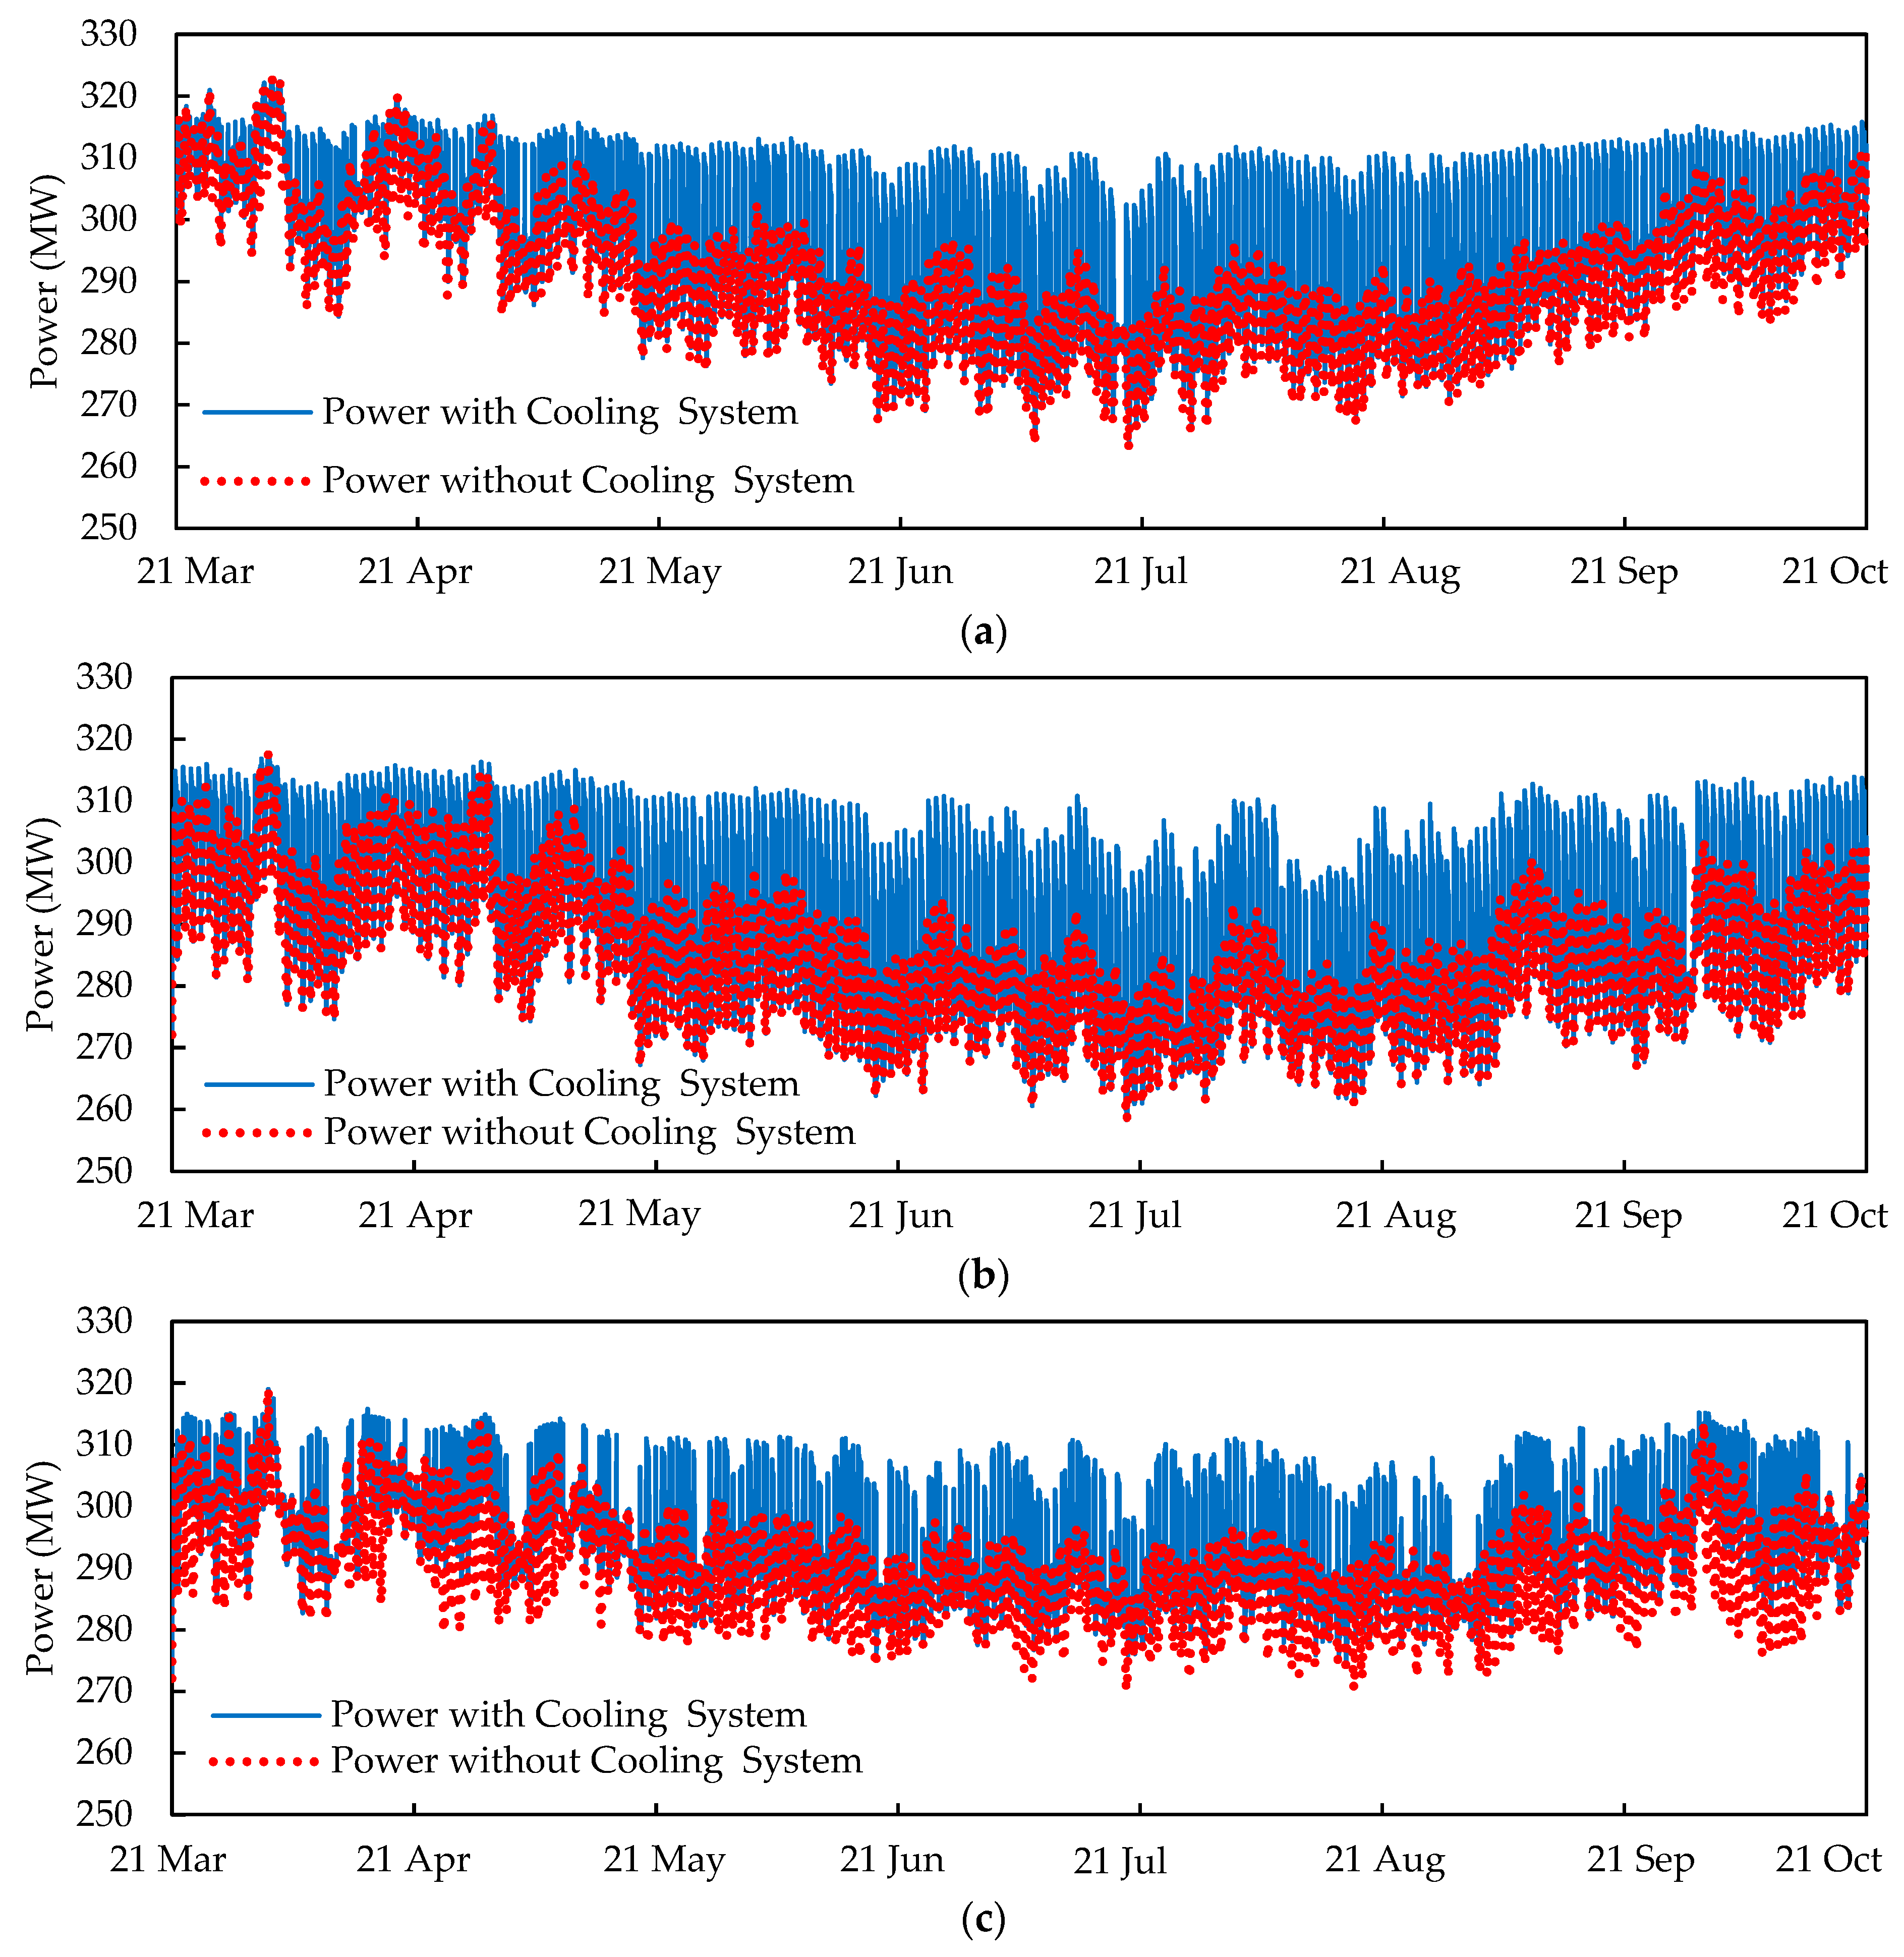
The weather conditions in Tehran and Phoenix were found to be similar, leading to the selection of absorption chillers with a total capacity of 13.2 MW for these two locations. In contrast, the cooling capacity for Houston was considered 22.2 MW due to the hot-humid climatic conditions. The output power of the power plant with and without the utilization of a solar cooling system is shown in Figure 7. The results demonstrate the effectiveness of the solar cooling systems in boosting the output power of the combined cycle during hot days. The inlet cooling system prevents power reduction during hot days as it stabilizes compressor inlet temperature despite the increase in ambient temperature. The highest increment recorded in output power was 34.5 MW for Phoenix. The extra electricity production is between 34,000 and 36,000 MWh for all cases.
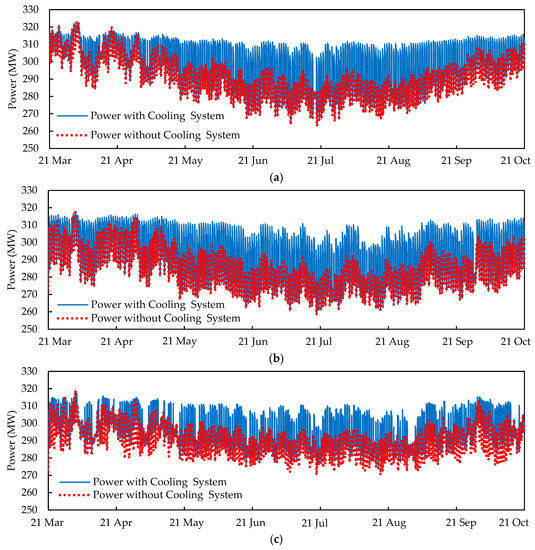
Figure 7.
Variations in plant output power with and without using the inlet cooling system in (a) Tehran; (b) Phoenix; and (c) Houston throughout a year.
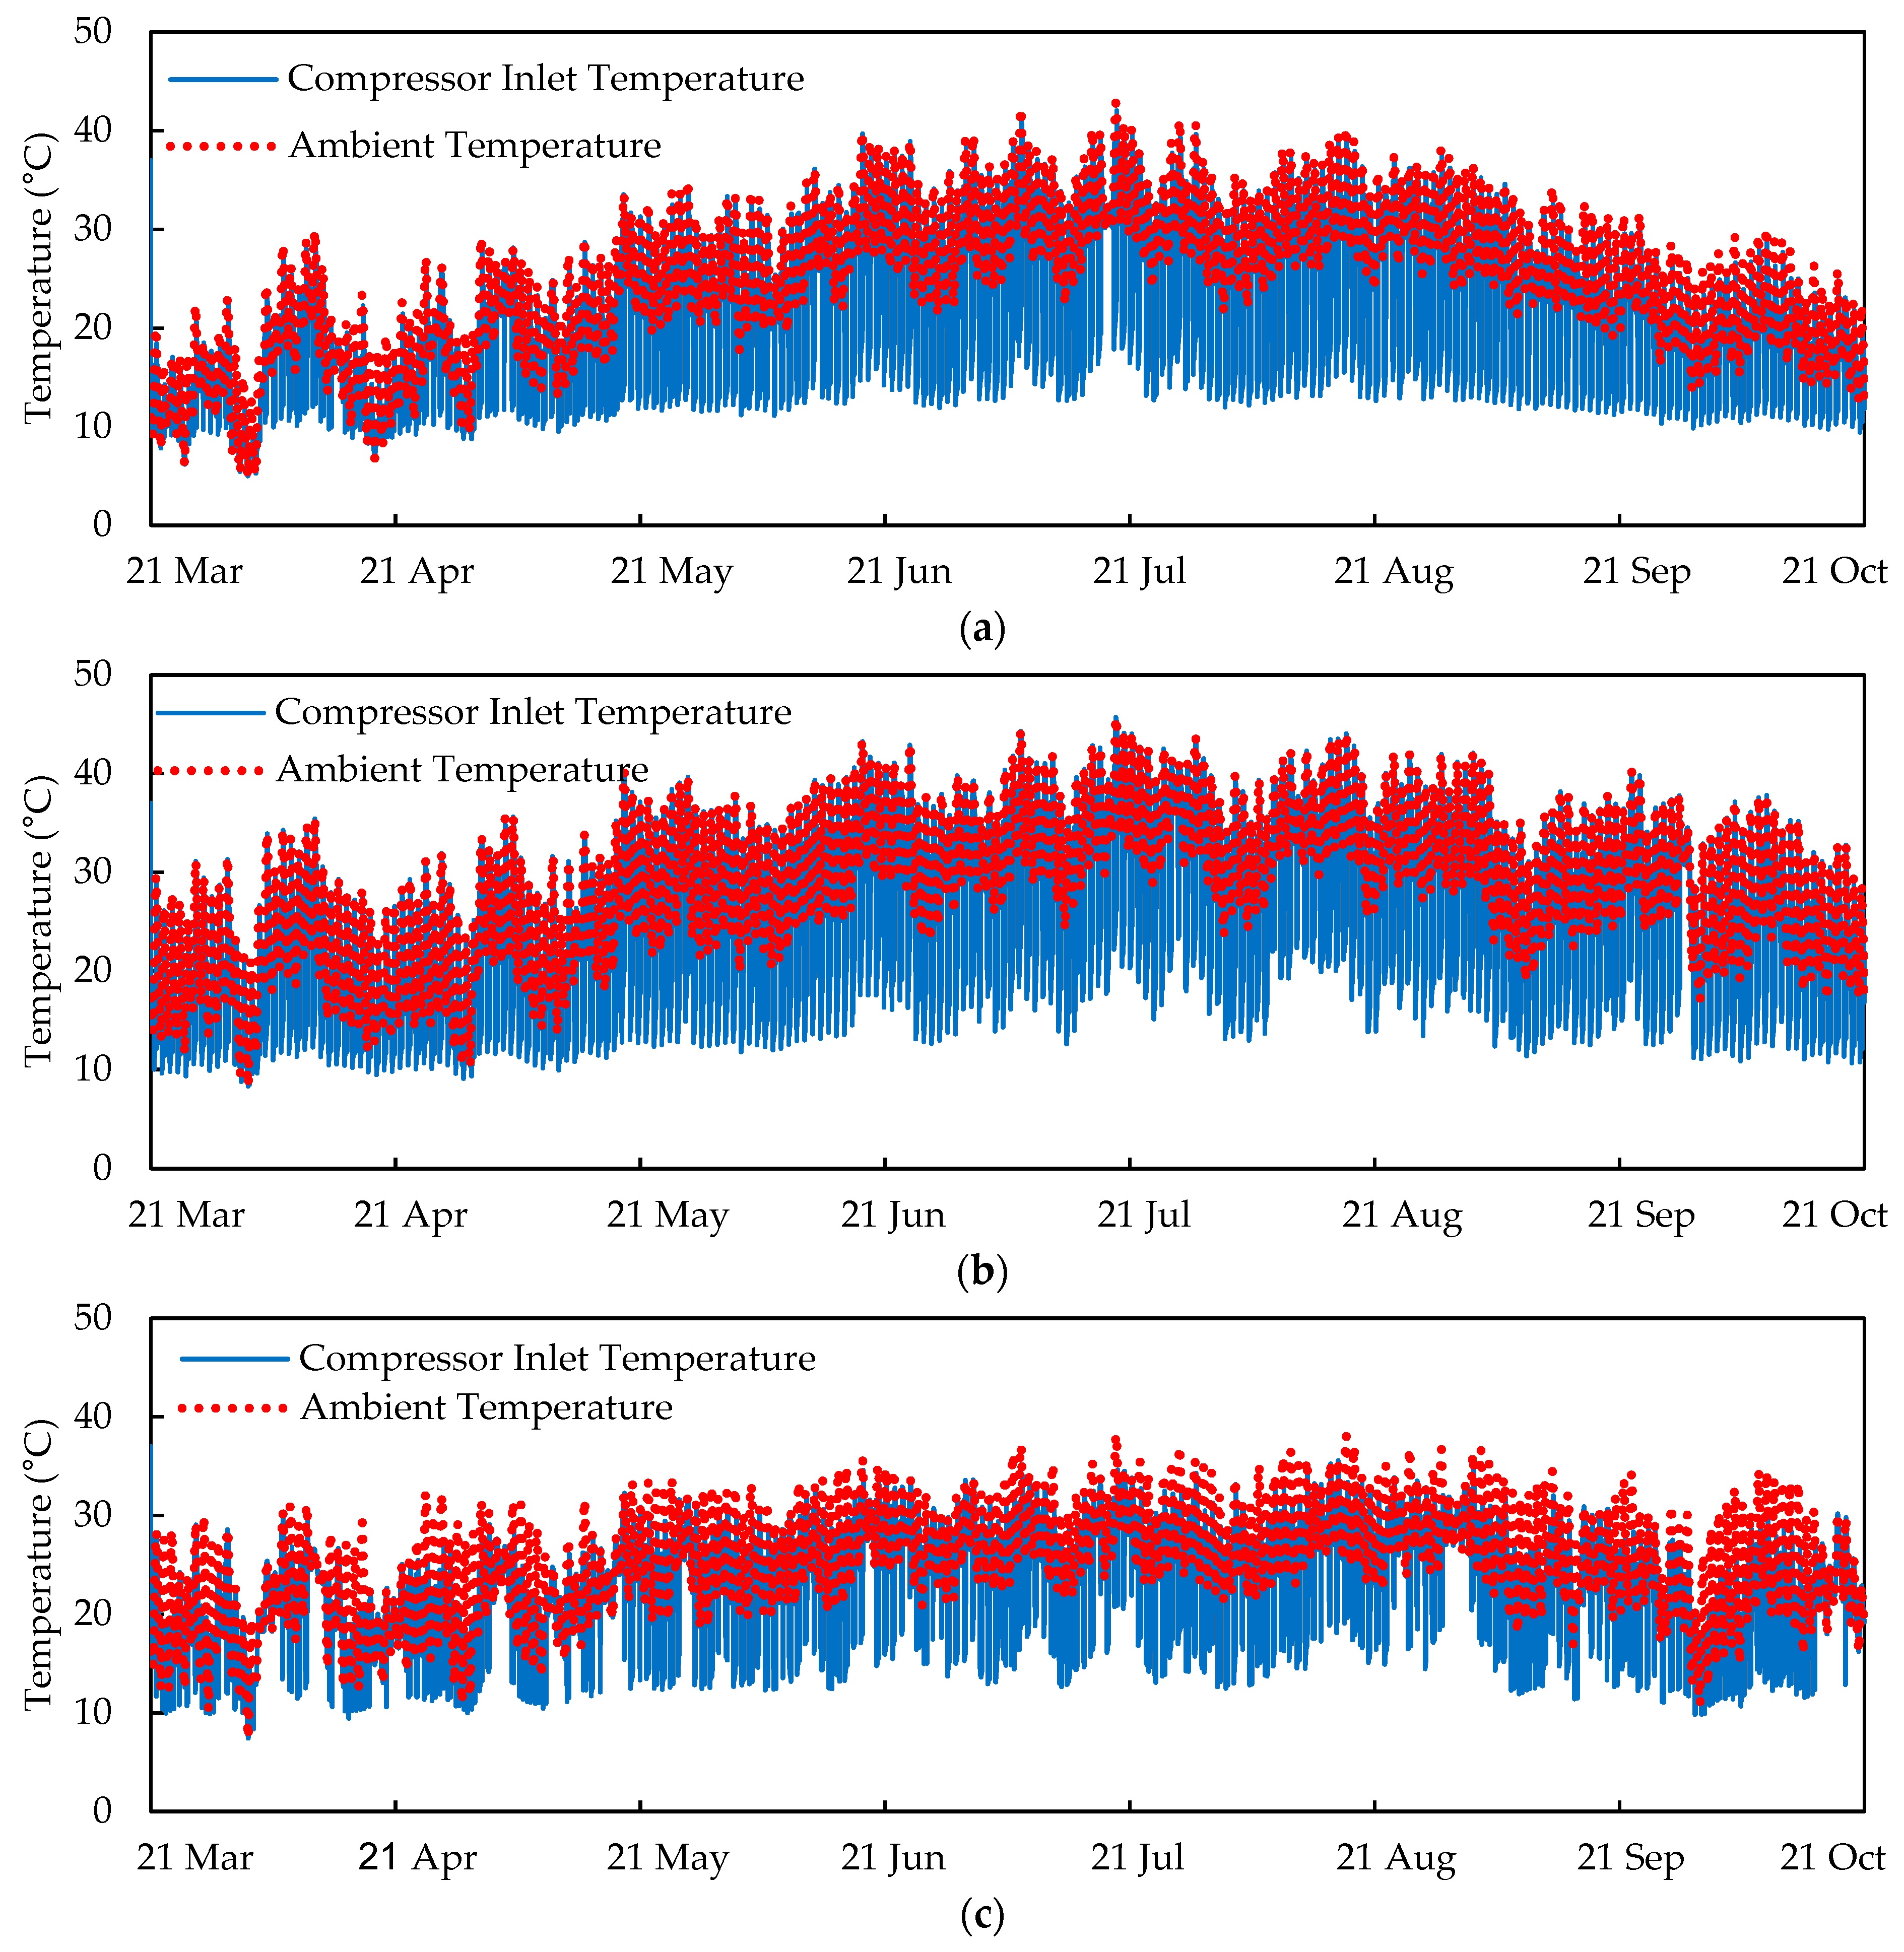
Figure 8 illustrates the impact of the proposed solar cooing system on the compressor inlet temperature for the three selected cities. As seen in the figure, with the transient changes in the system and the multiplicity of the involved variables, the designed cooling system can reduce the air temperature from 35 to 15 °C. In comparison, Houston suffers greatly even with higher cooling capacity due to its humid weather, which leads to higher energy consumption for moisture removal.
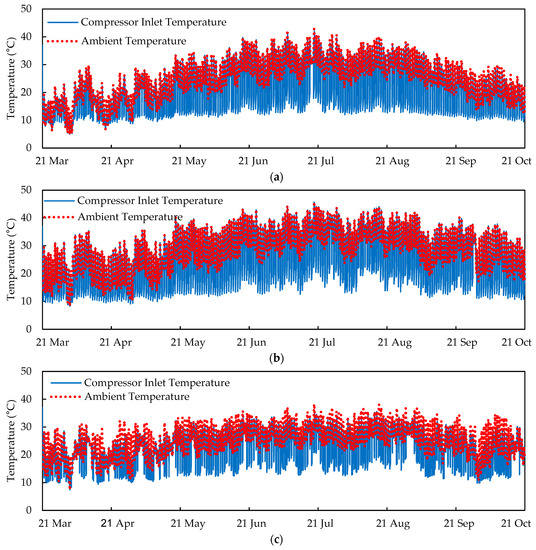
Figure 8.
Variations in ambient temperature and compressor inlet air temperature (a) Tehran; (b) Phoenix; and (c) Houston throughout a year.
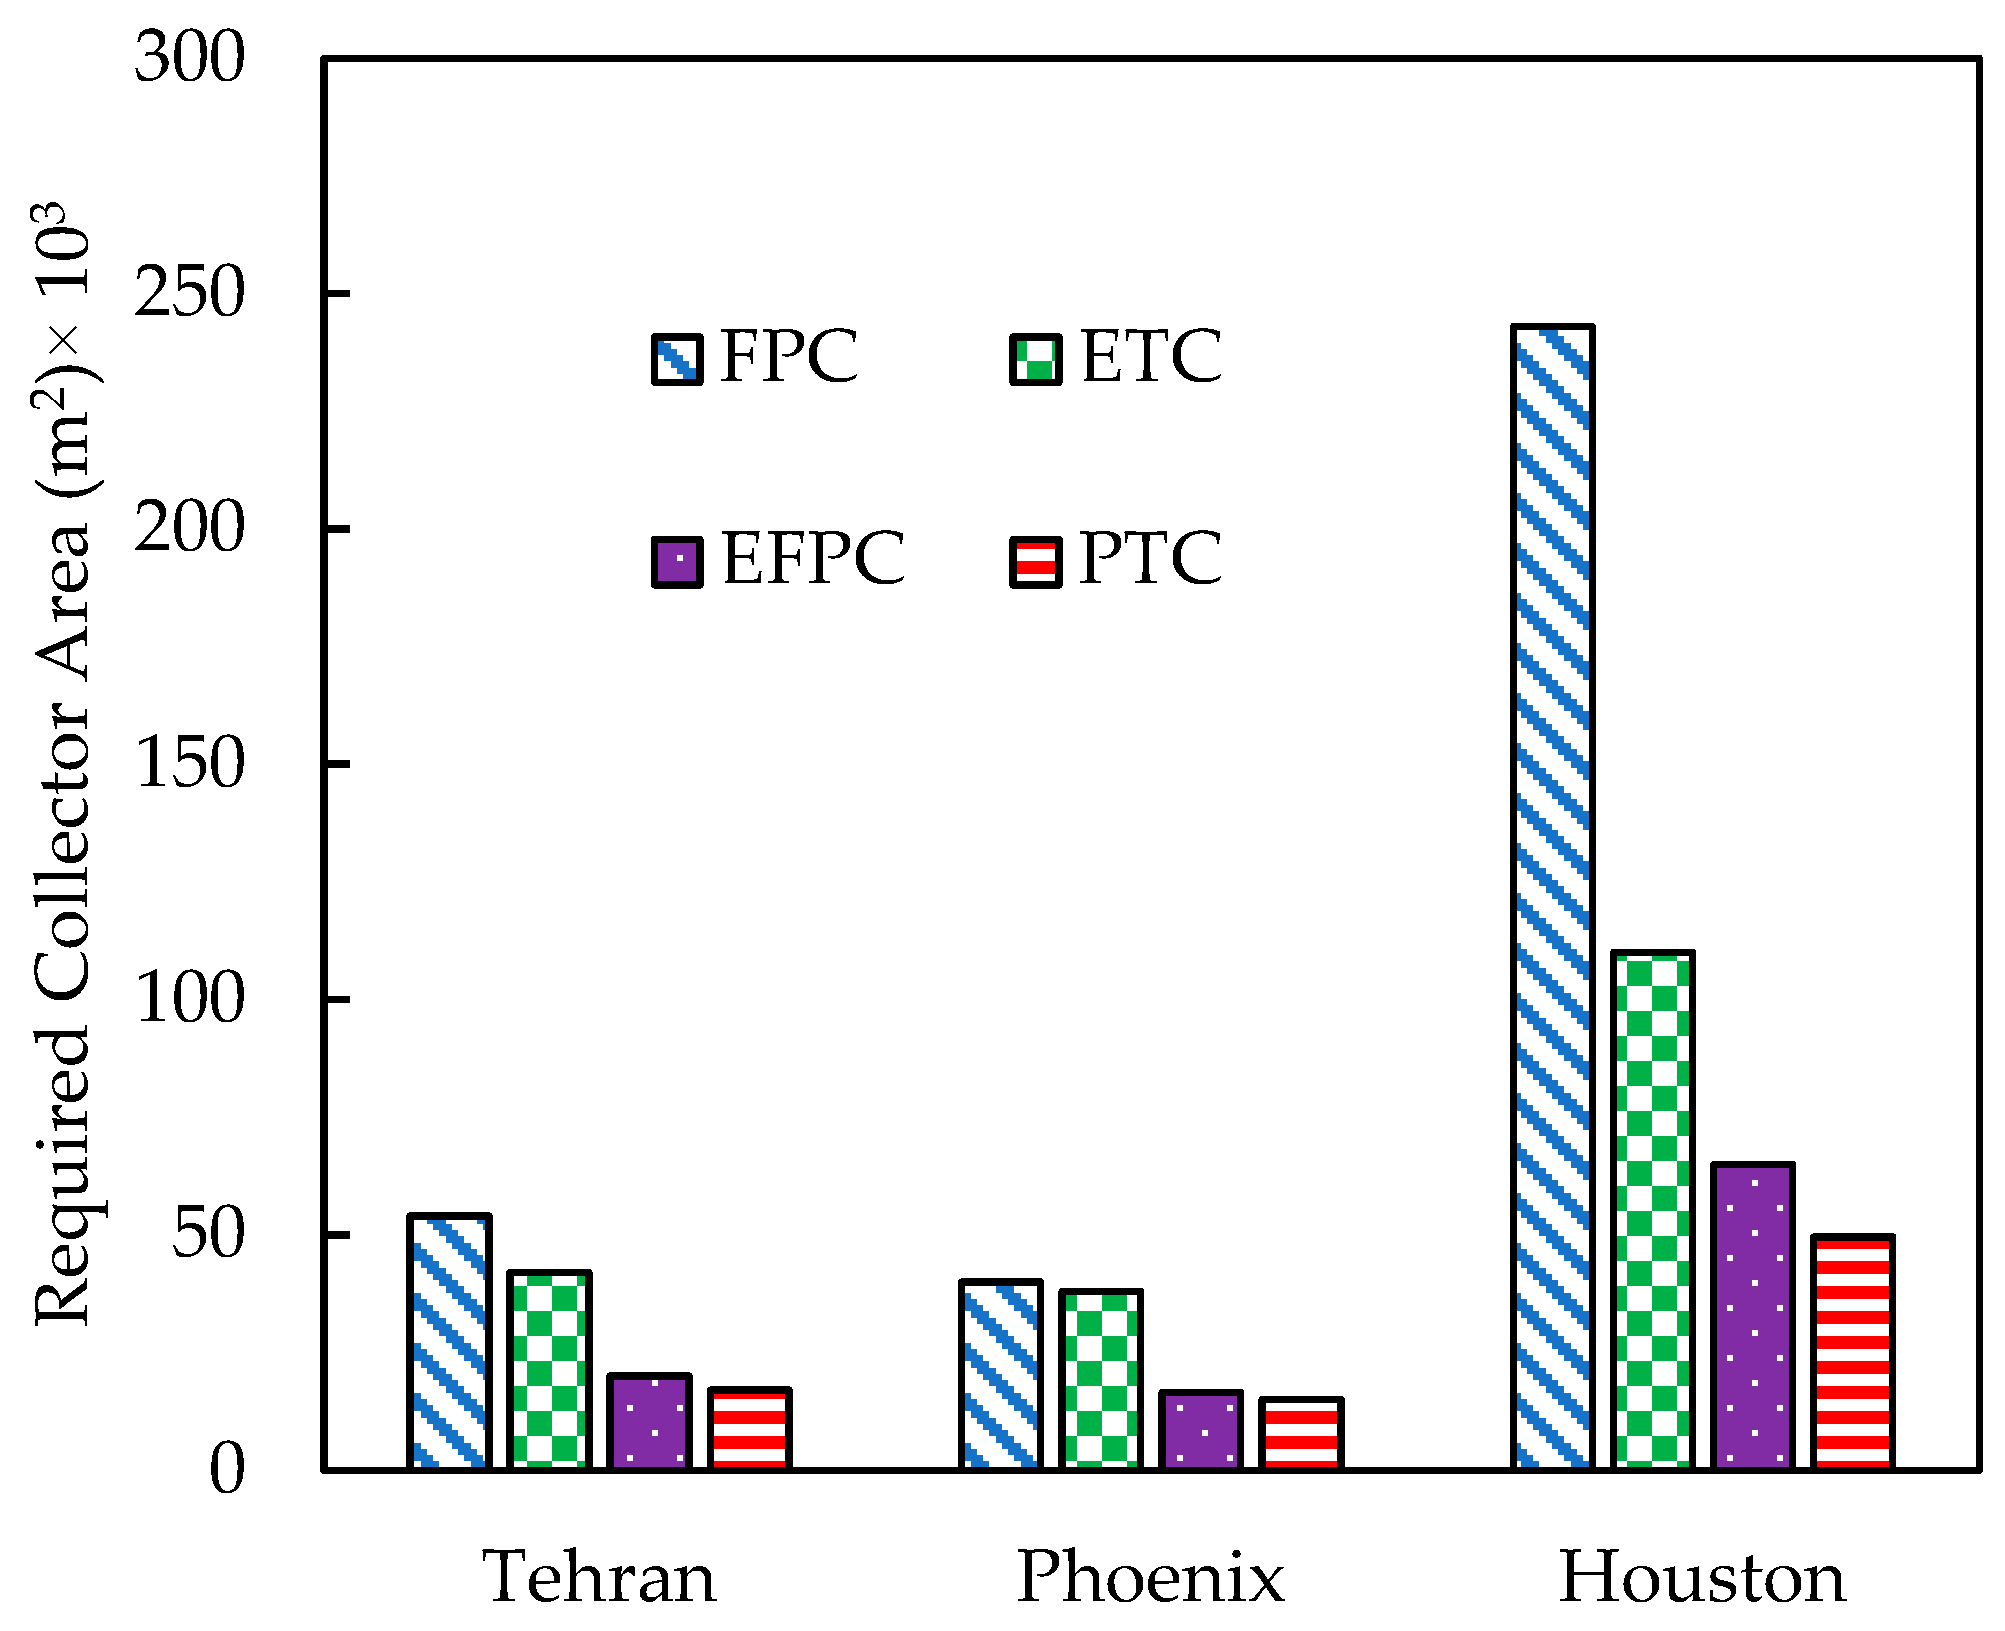
The required collector area for each cooling system for the three cities is presented in Figure 9. Among the three locations analyzed, Phoenix required the minimum area of the solar collector due to its high solar irradiance. Tehran followed closely, whereas, solar collector requirements skyrocketed in Houston due to its humid climatic condition. In Houston, FPC showed a disappointing performance because of the high circulation time of the water in the cooling system and the high heat loss in this collector.
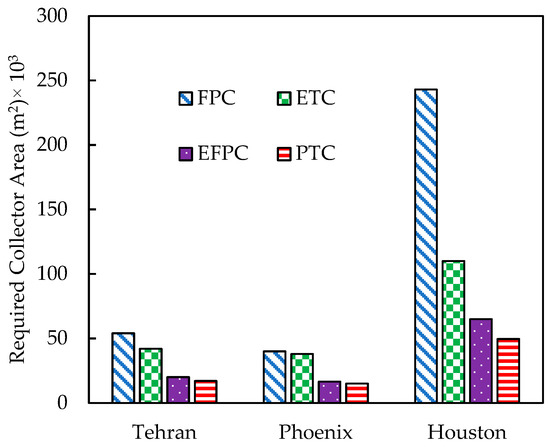
Figure 9.
Required collector area for each cooling system in Tehran, Phoenix, and Houston.
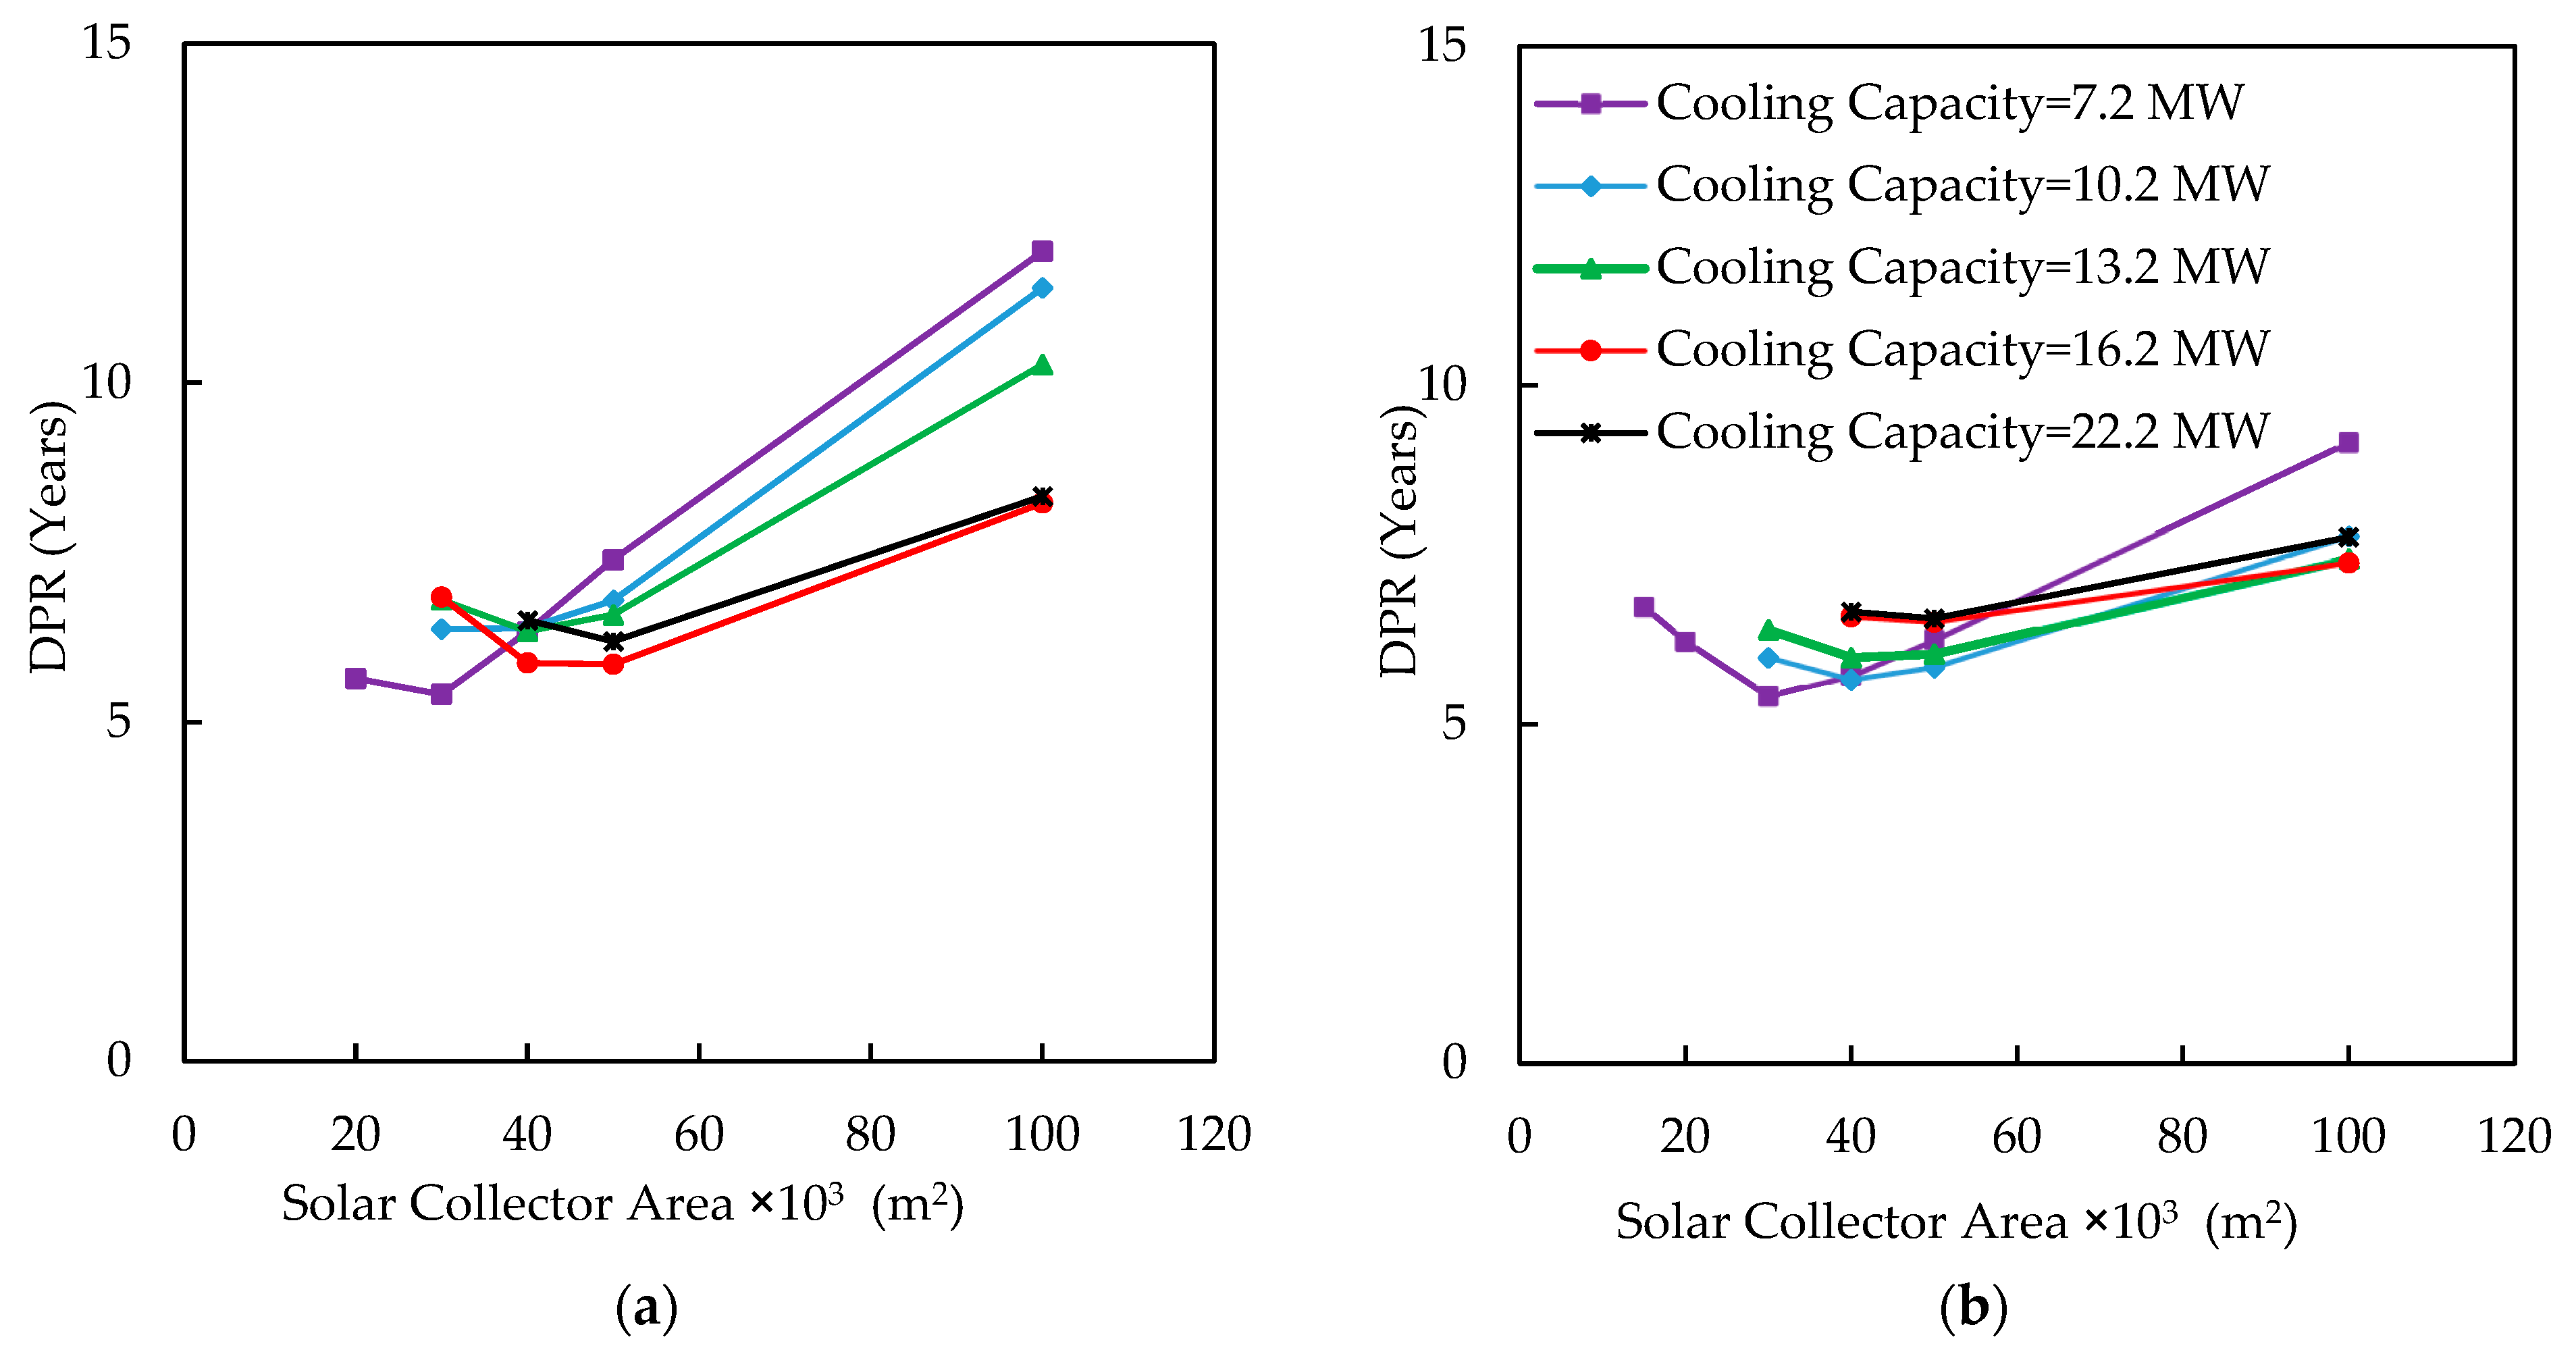
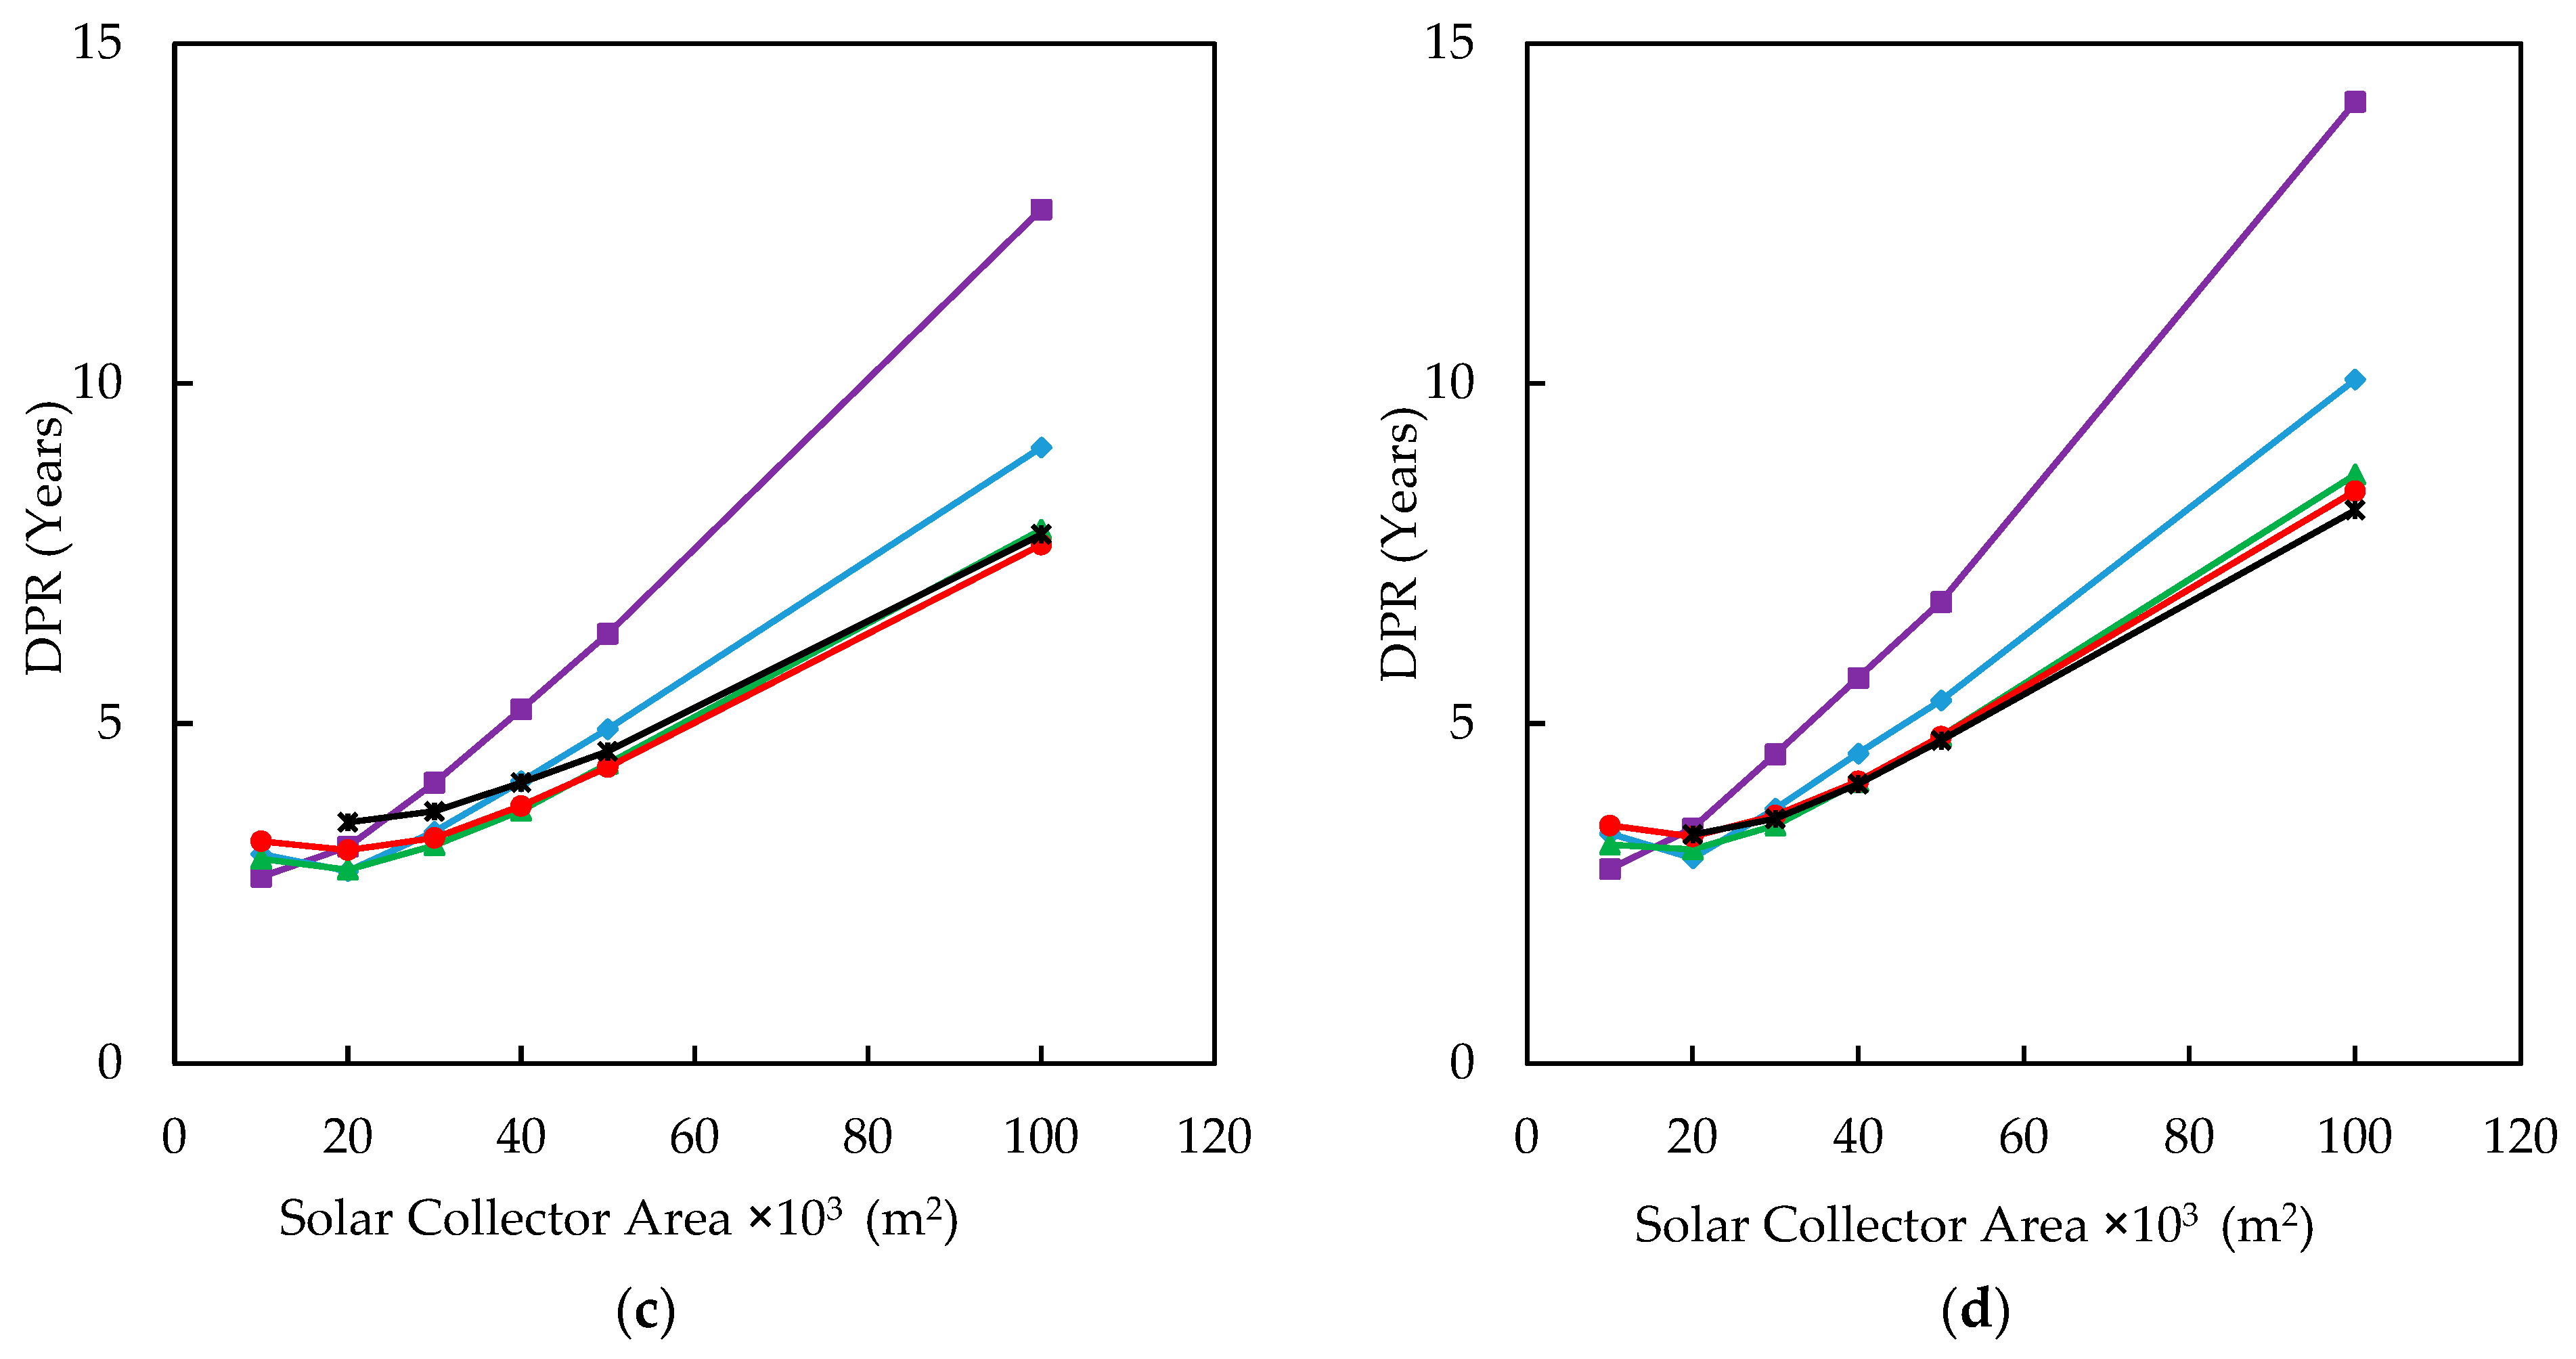
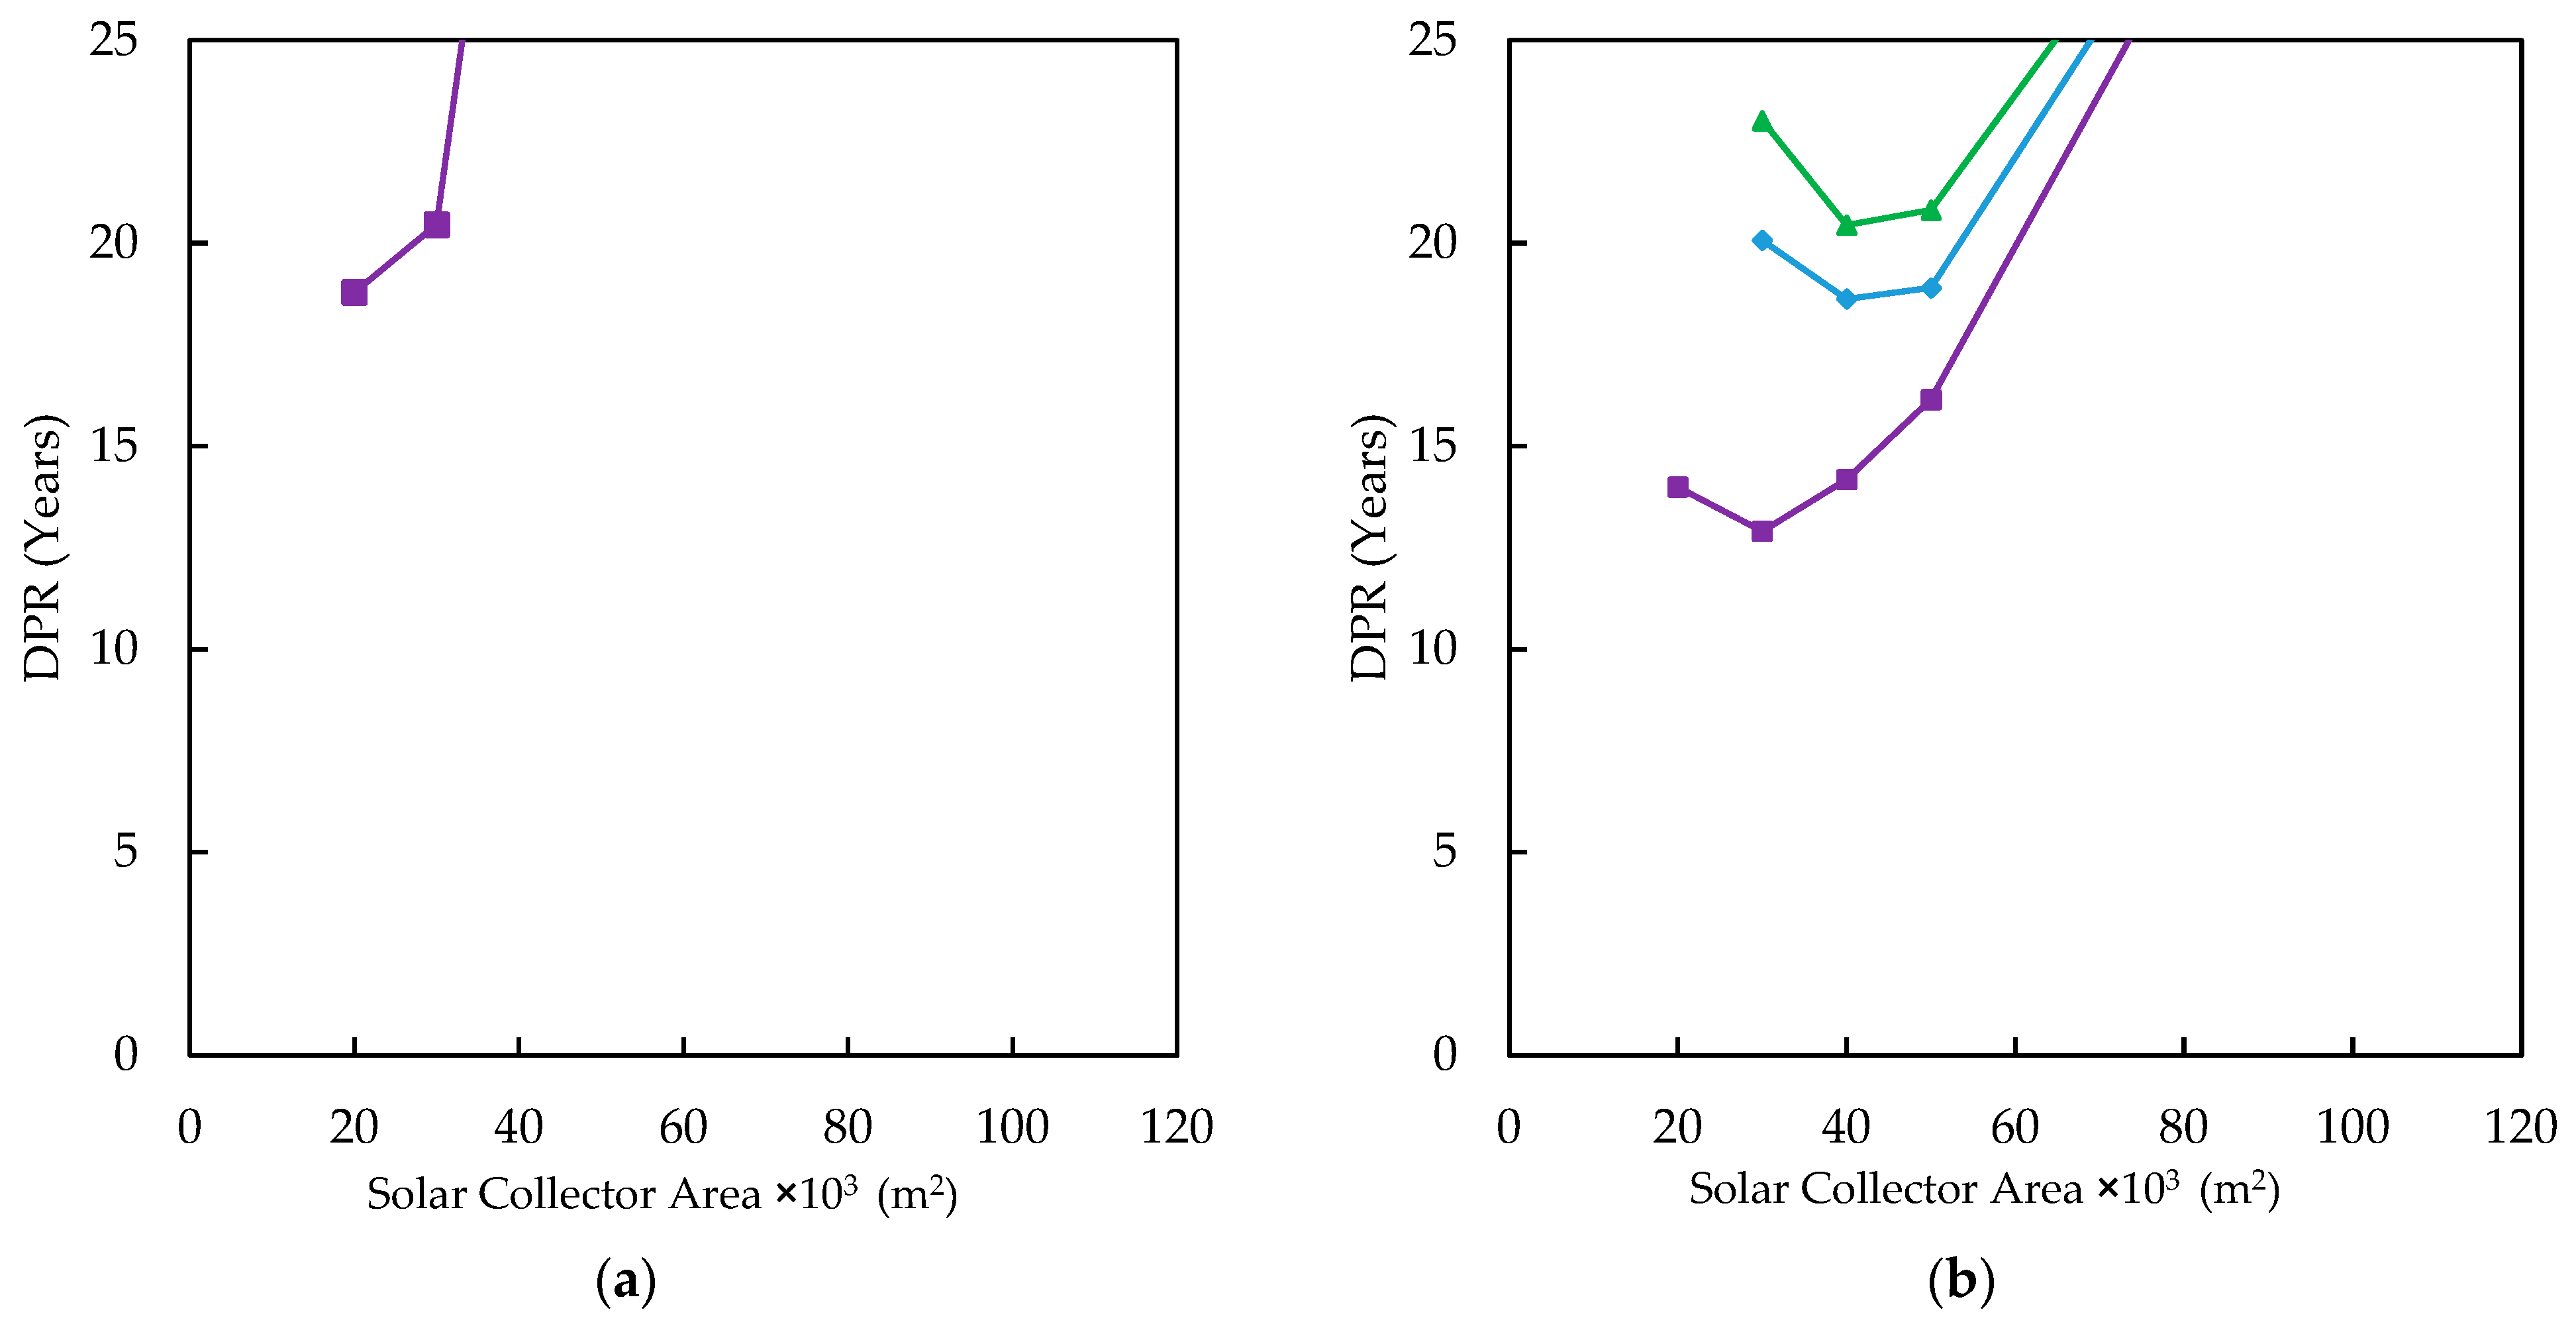
DPR is calculated to determine the feasibility of each system based on the type and size of the solar collectors, absorption chillers, and additional electricity production. In Phoenix, DPR for FPC, ETC, EFPC, and PTC is 6.37, 6.25, 2.96, and 3.23 years, respectively. The assumed economic parameters are listed in Table 2. However, in Houston and Tehran, the economic feasibility of the system is debatable. In Tehran, economic feasibility is affected primarily due to the low cost of electricity compared to the other two U.S. cities, which leads to lower revenue for the investment. In Tehran, DPR for EFPC and PTC is 19.83 and 22.88 years, respectively, whereas DPR with FPC and ETC is longer than the operational lifetime of the entire system. In Houston, the electricity cost is three times that of Tehran. However, due to the large required solar collector area in Houston, similar values for DPR have been reached. FPC and ETC systems are not feasible in this location as the DPR is longer than the lifetime of the project. The DPR for EFPC and PTC is 18.62 and 16.13 years, respectively.
4.4. The Effect of Different Cooling Capacity and Collector Area on Extra Energy Production
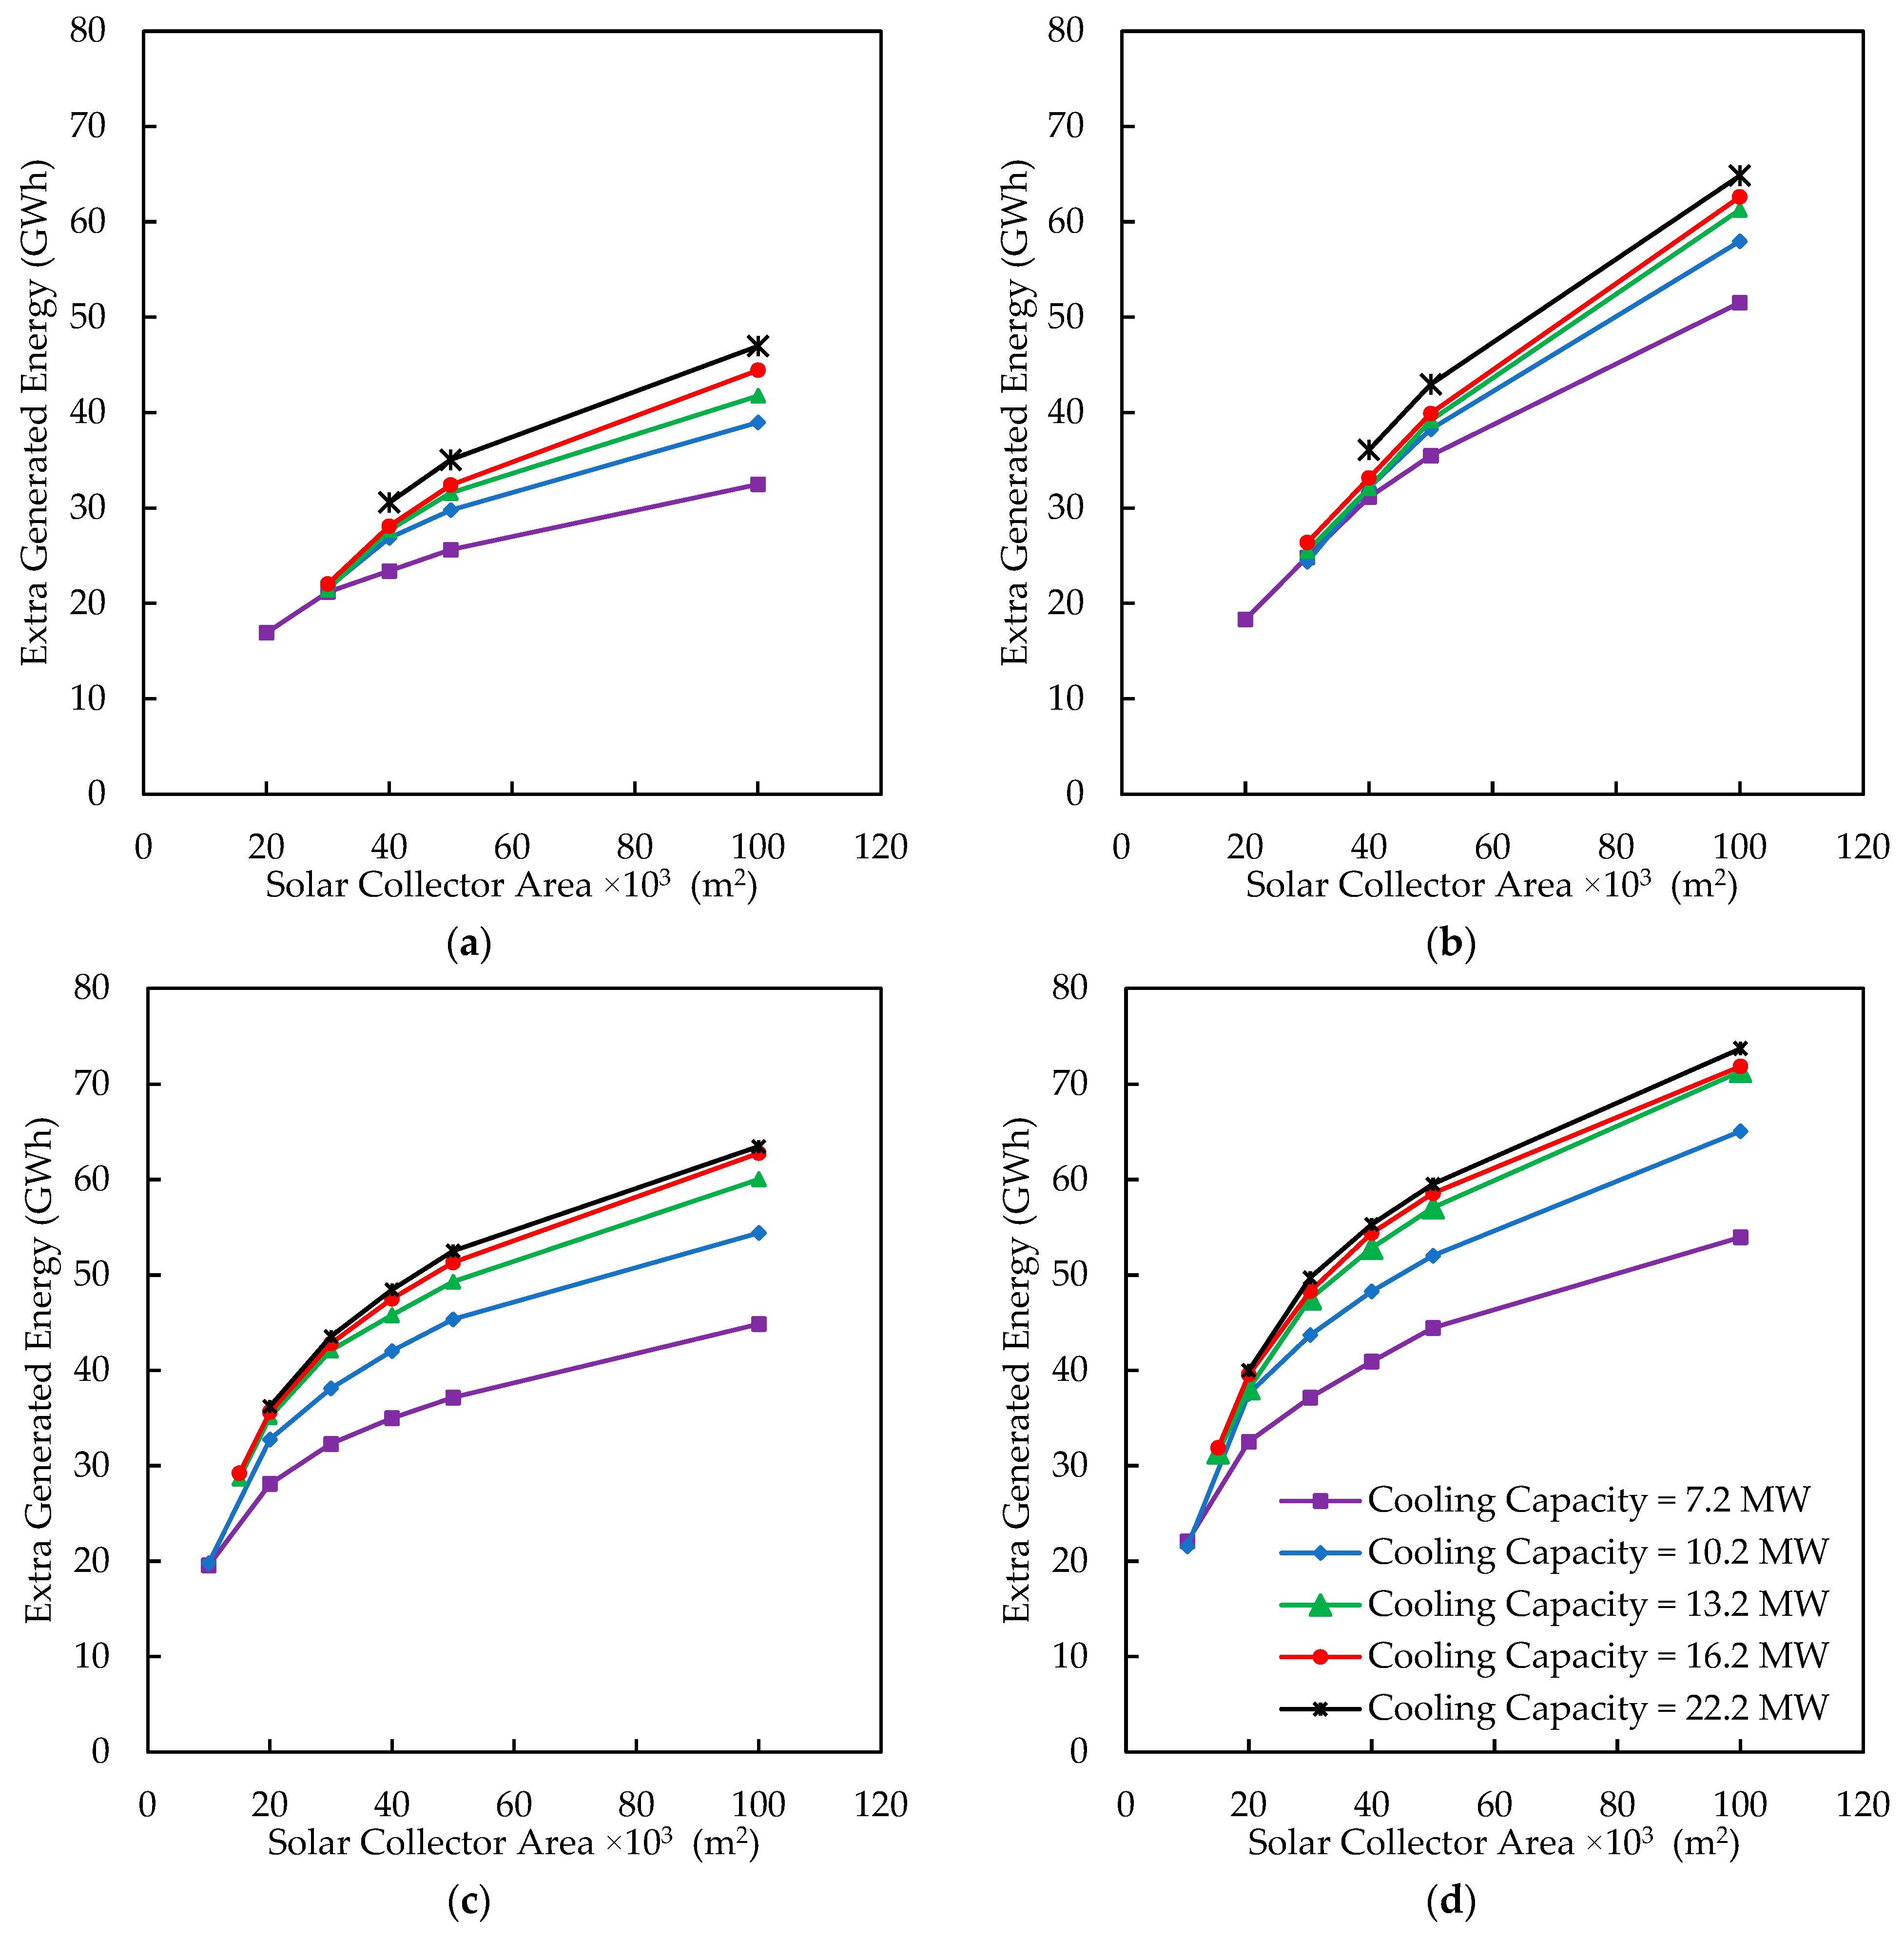
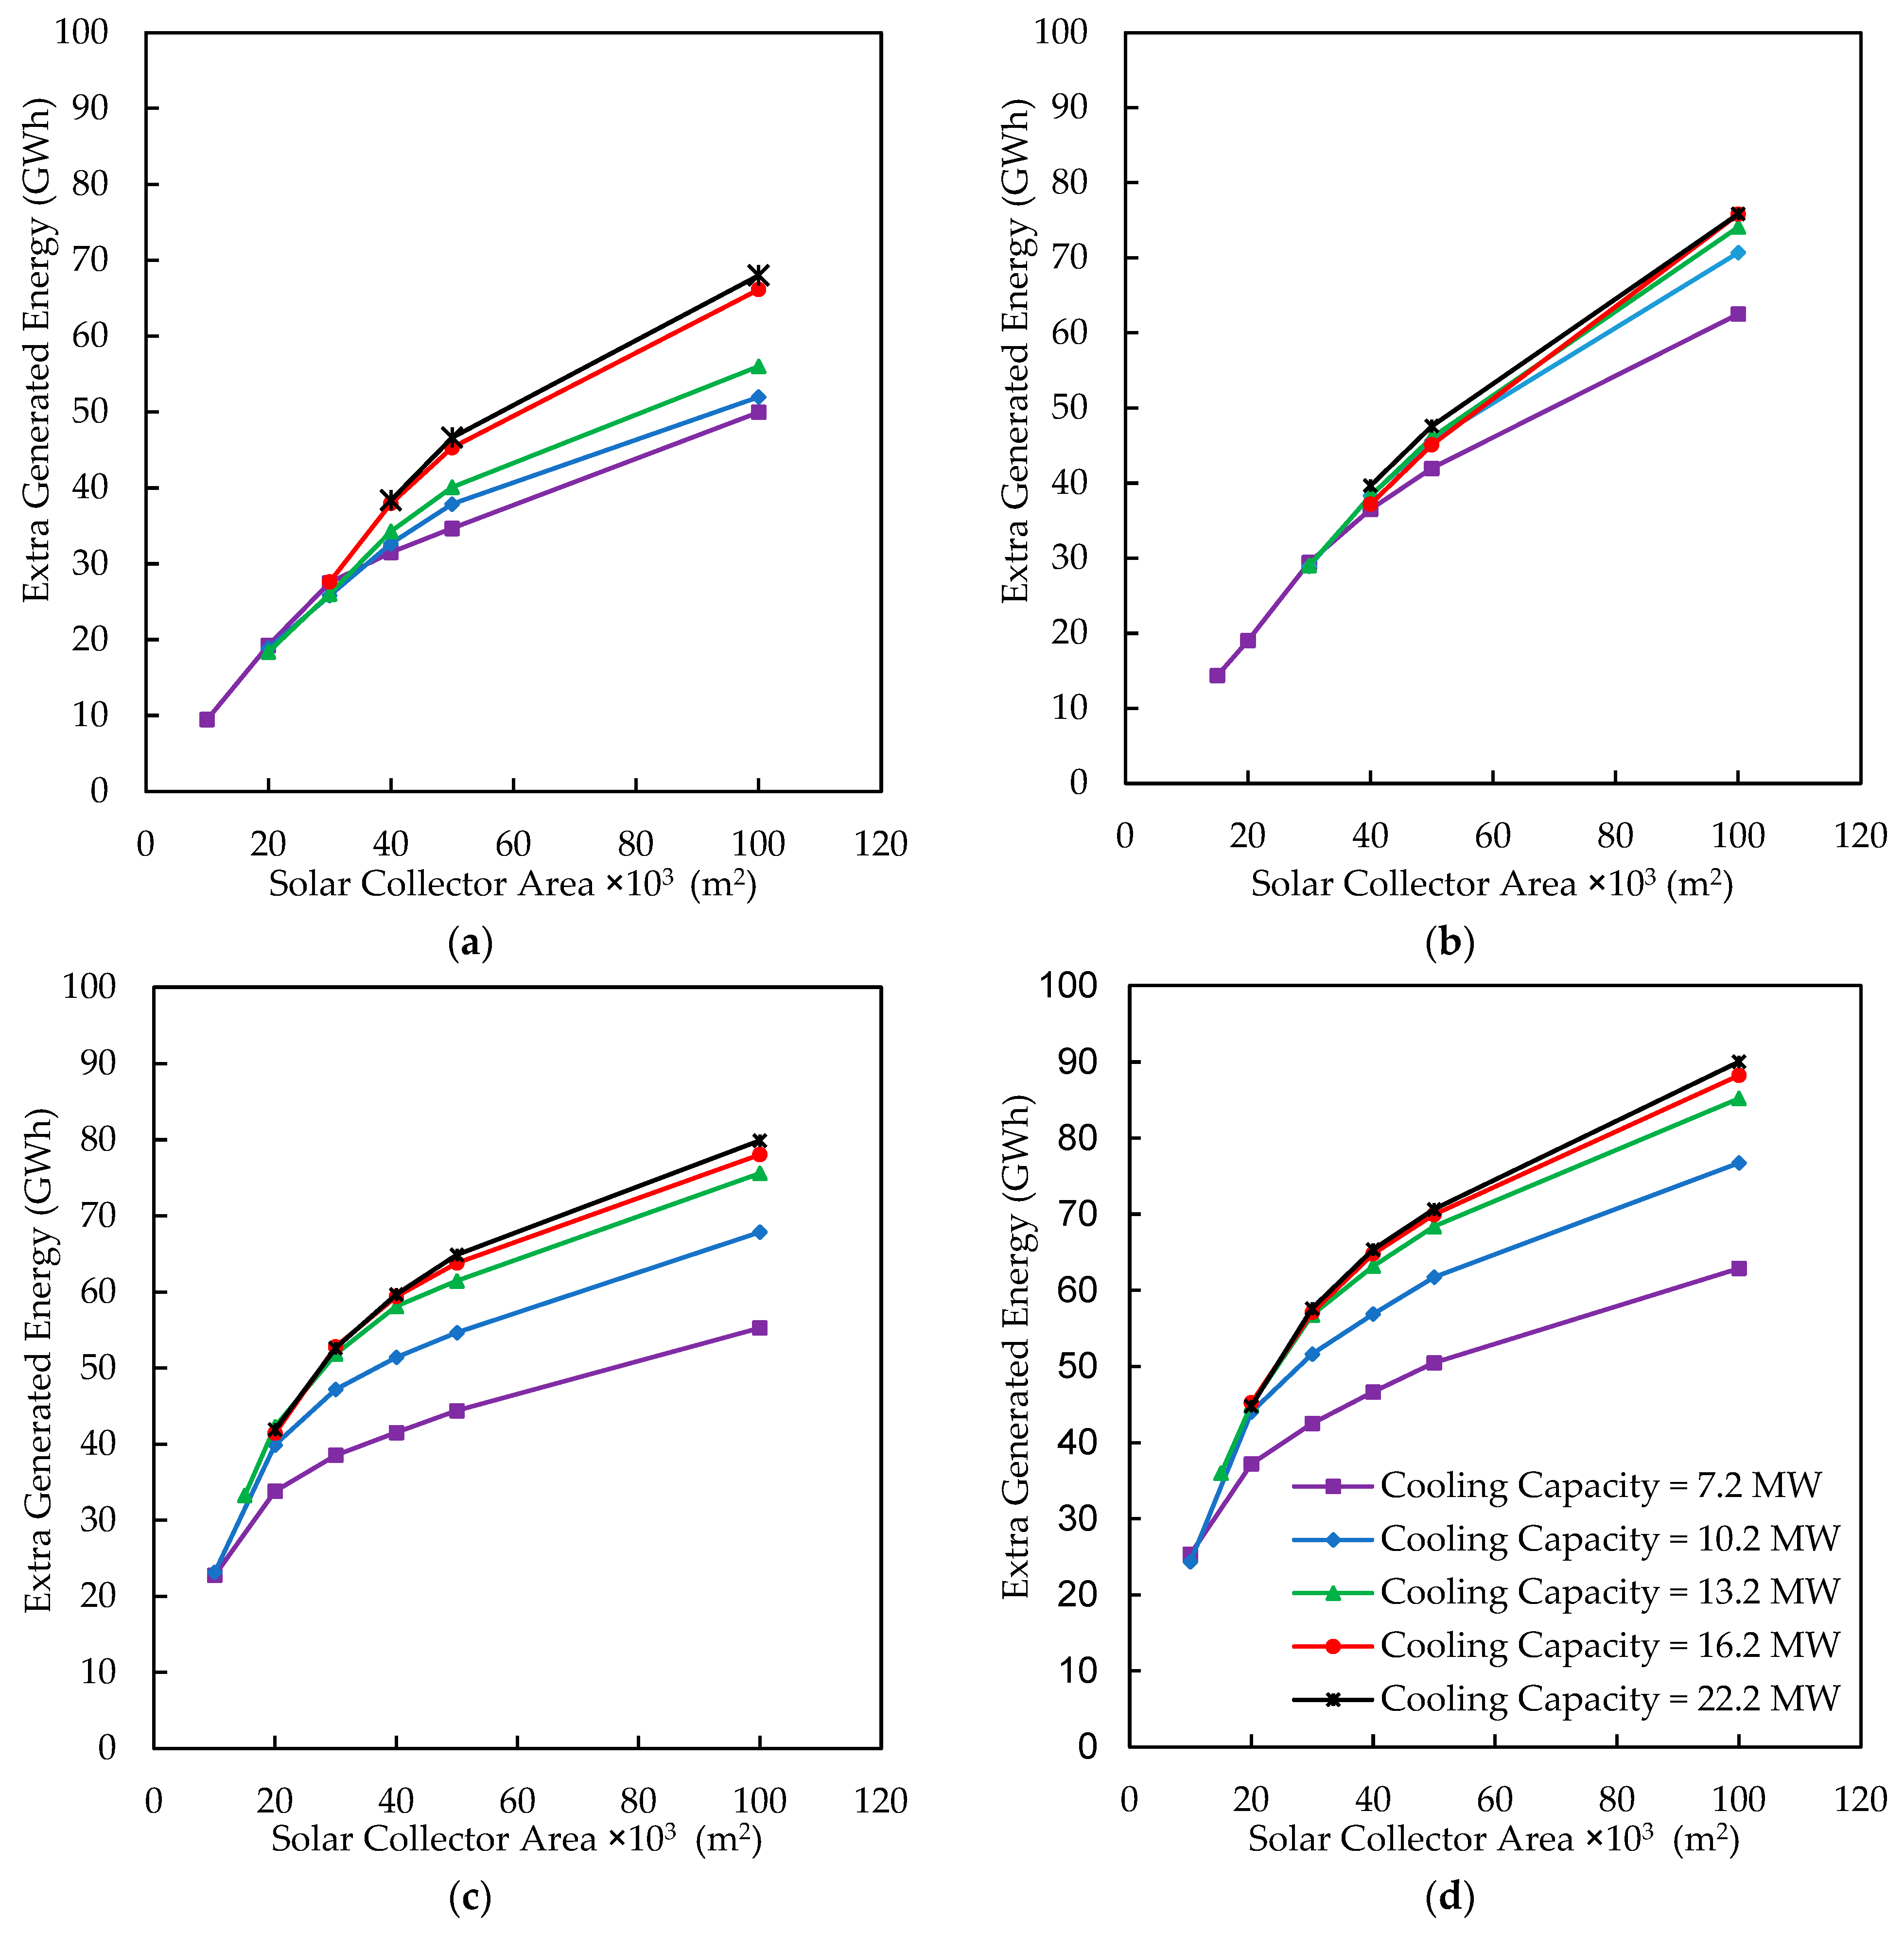
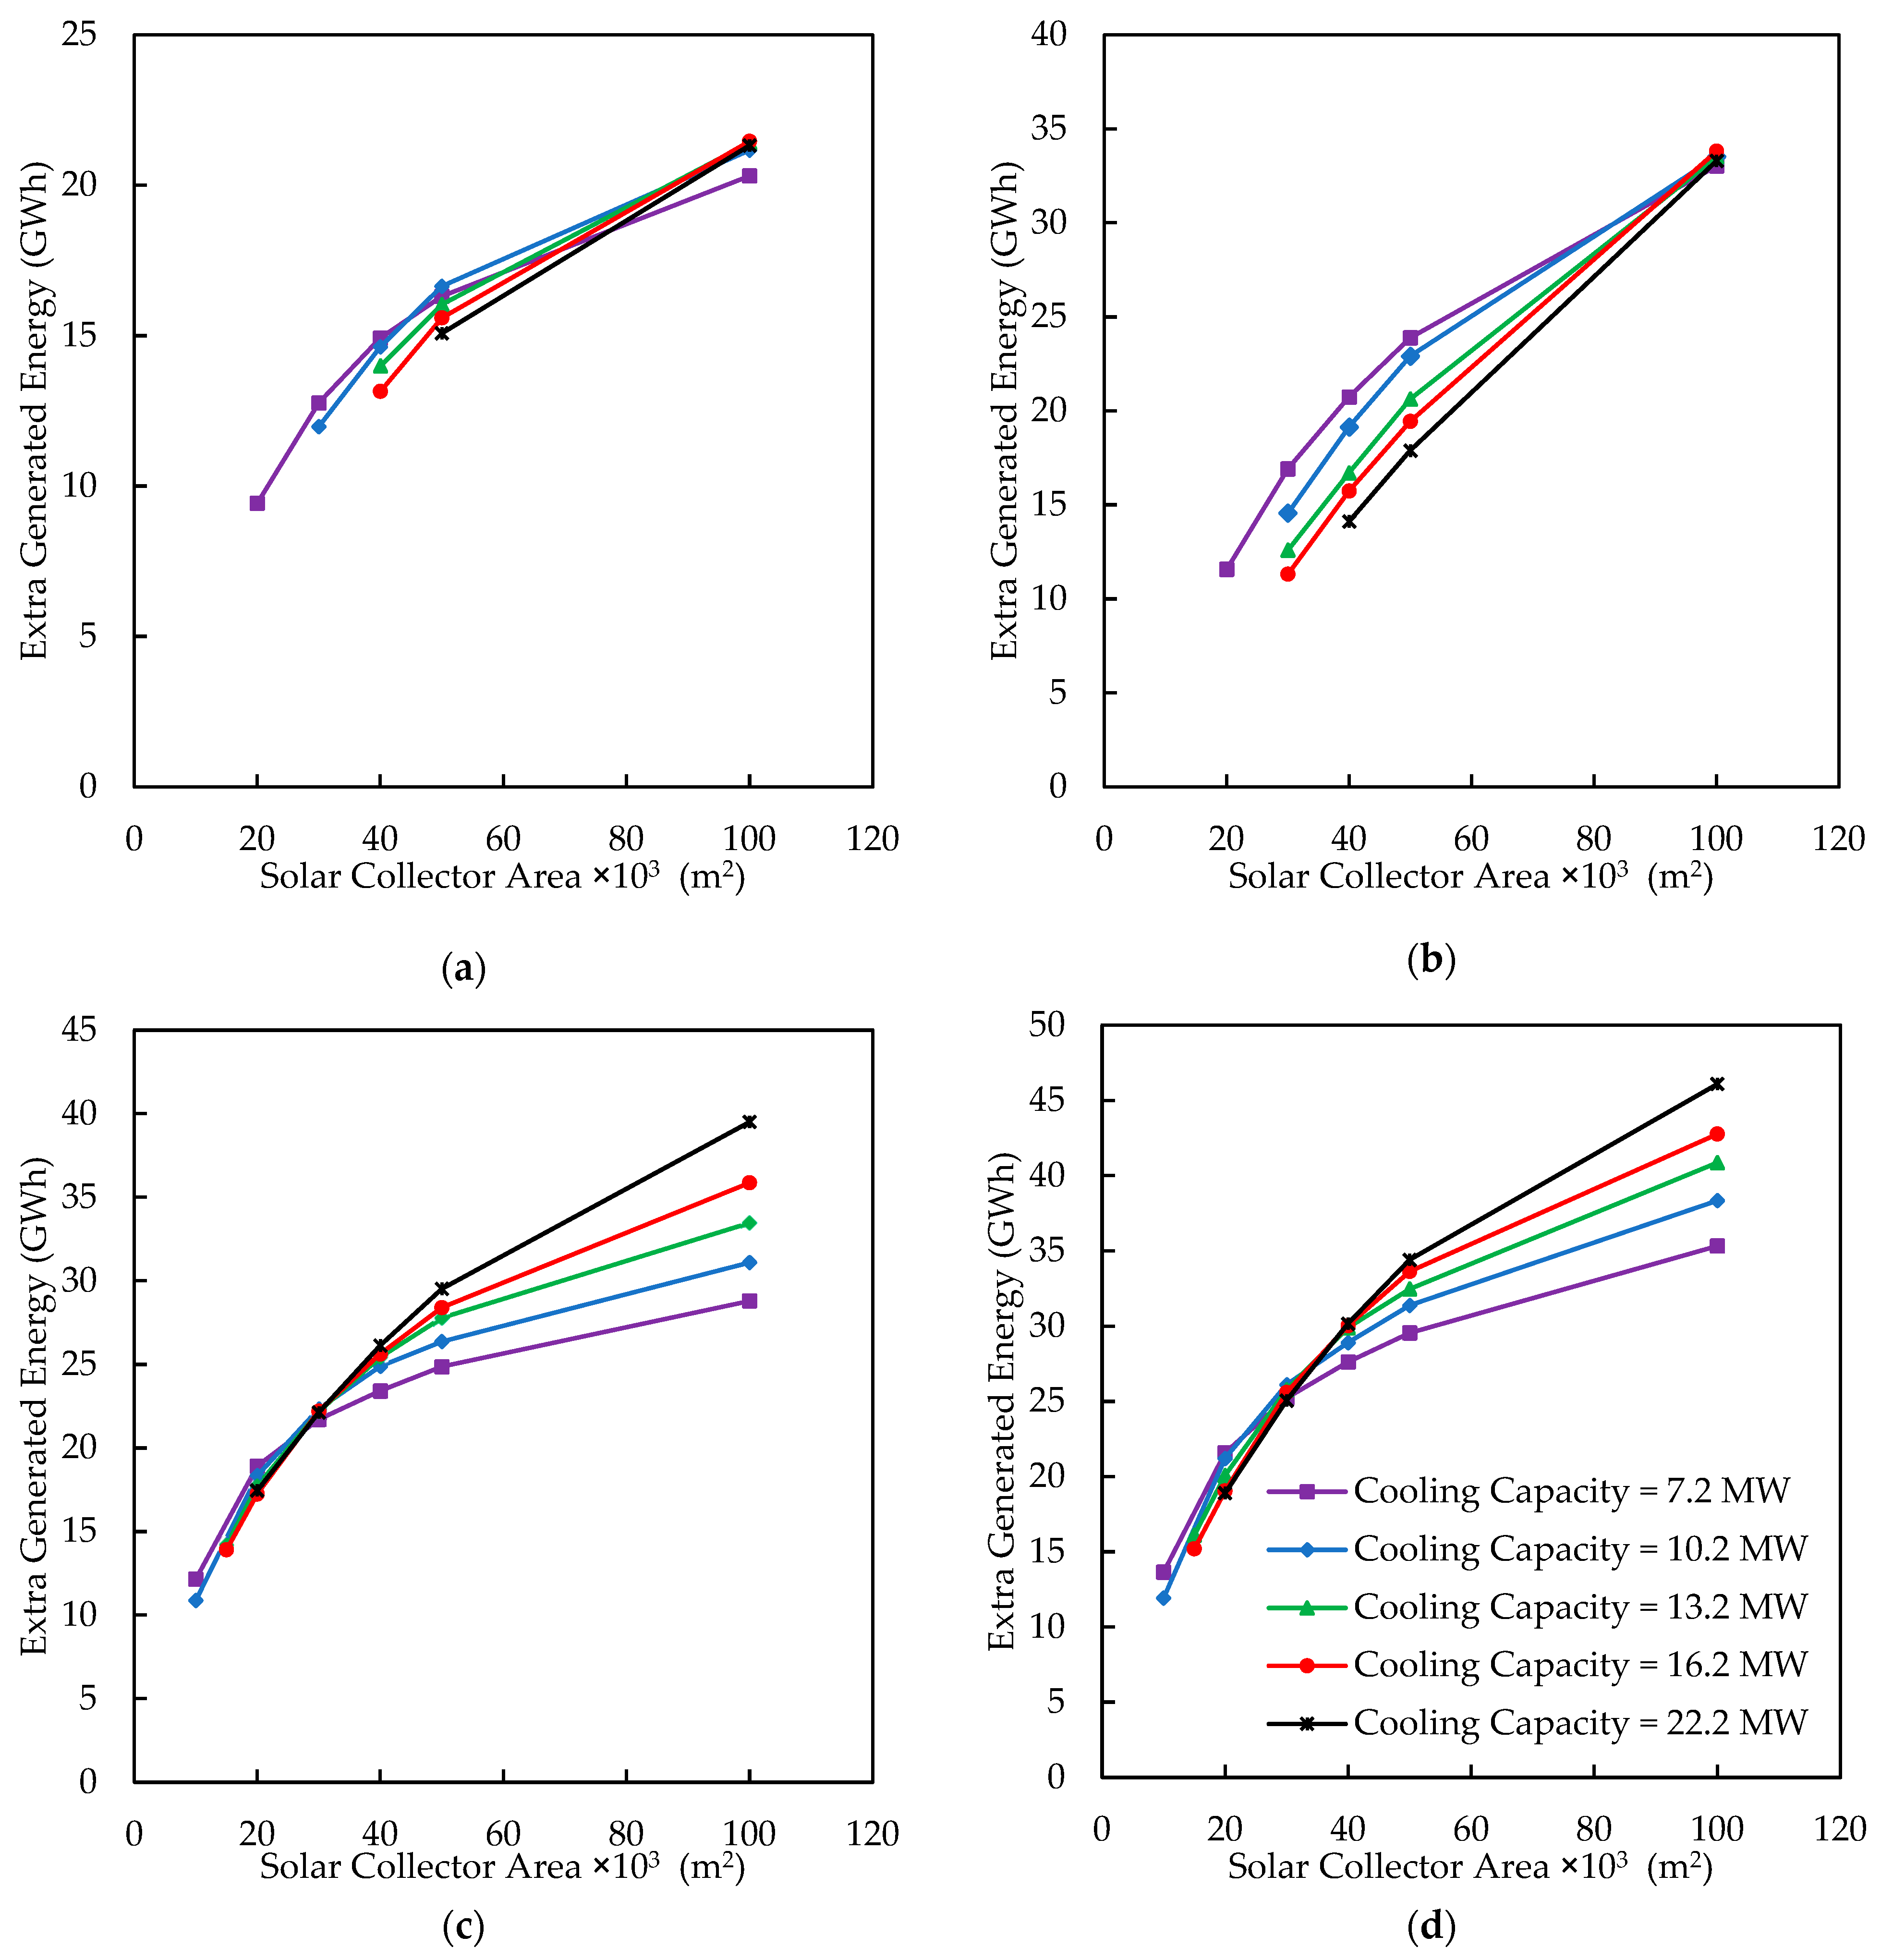
In this section, the solar cooling system has been simulated using various cooling capacities and collector areas to assess the impact of these parameters on additional energy production and economic viability. The inlet temperature was determined by the collector area and cooling capacity, disregarding the previous design condition of 15 °C. The results aid in choosing the most economical system for a given location. Figure 10, Figure 11 and Figure 12 display the extra electricity generated by each cooling system in Tehran, Phoenix, and Houston, respectively. Solar inlet air cooling systems can improve the output power at all locations. This external source of heat supplies the heat for AC without burning extra fuel and decreasing cycle efficiency. Internal heat sources investigated by other researchers, such as extraction from the steam turbine and HRSG, may affect the bottoming steam cycle performance and cycle efficiency [25].
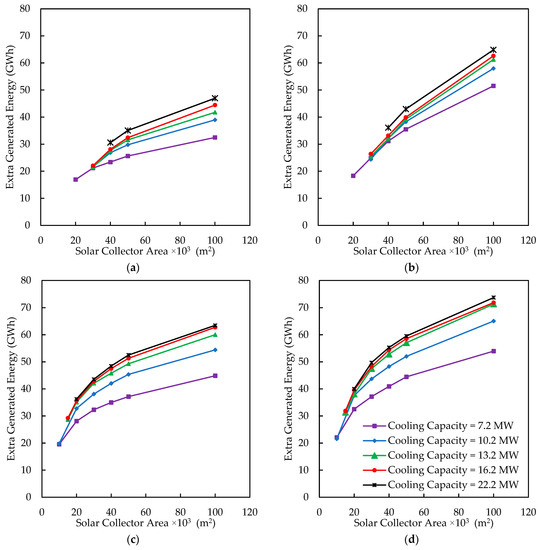
Figure 10.
Extra energy generated by application of solar cooling system with different collector areas and different cooling capacities in Tehran (a) FPC; (b) ETC; (c) EFPC; and (d) PTC.
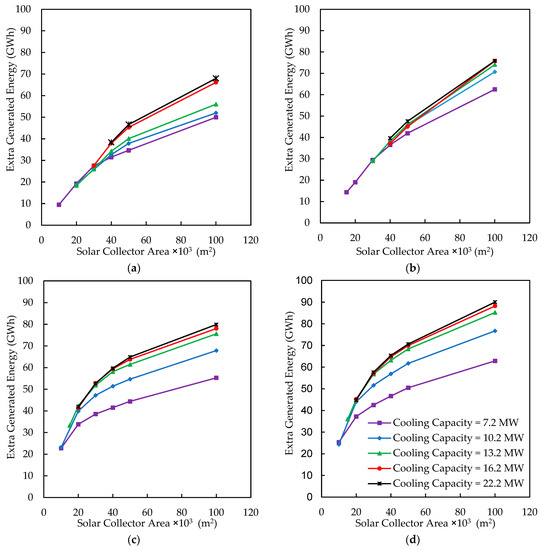
Figure 11.
Extra energy generated by application of solar cooling system with different collector areas and different cooling capacities in Phoenix (a) FPC; (b) ETC; (c) EFPC; and (d) PTC.
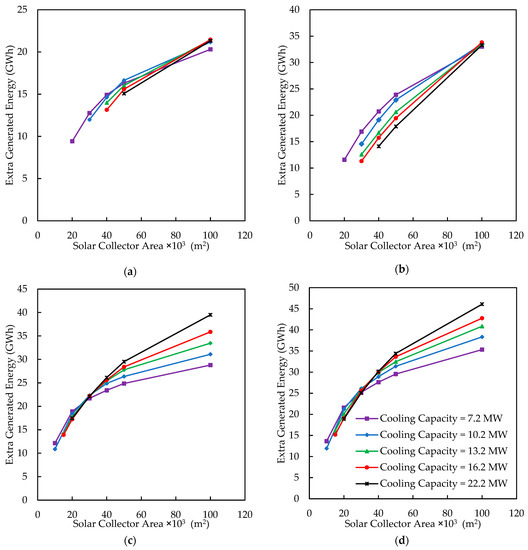
Figure 12.
Extra energy generated by application of solar cooling system with different collector areas and different cooling capacities in Houston (a) FPC; (b) ETC; (c) EFPC; and (d) PTC.
Larger collector areas and cooling capacities result in greater extra energy production. However, at smaller collector areas, different cooling capacities produce similar amounts of extra energy. For a fixed collector area, lower capacity chillers can operate longer as they require less heat. For instance, with a 30,000 m2 FPC area in Tehran, the 7.2 MW cooling system operates 1343 h and produces 21,195 MWh of extra energy for 7 months, while the 13.2 MW system operates 1010 h and generates 21,459 MWh of extra energy. However, by increasing the collector area, the cooling effect of lower capacity chillers starts to saturate.
In Phoenix, the EFPC and PTC systems equipped with 13.2 MW DEAC and 15,000 m2 of solar collector can produce 33,287 MWh and 35,973 MWh of extra energy, respectively. While for comparable extra energy production, SEAC systems require 40,000 m2 FPC or ETC. This fact highlights the importance of in designing solar cooling systems. Higher COP in DEACs and higher thermal efficiency of EFPC and PTC elevates the performance of these systems compared to SEACs. However, in designing solar cooling systems, the generator temperature is a determining factor in the overall performance of the system. In this paper, the generator temperature was regulated to track the maximum value of (see Figure 2).
4.5. Economic Analysis for Various Inlet Air Cooling Systems
In this section, the economic results for solar cooling systems in Tehran, Phoenix, and Houston are presented. Discouraging economic results were obtained in Tehran due to its low electricity prices. SEACs with FPC and ETC are not feasible as their DPR is beyond the lifetime of the project. Only with double-effect chillers driven by EFPC or PTC, those configurations with small collector area and low cooling capacity have a DPR below 25 years. The systems with 7.2 MW double-effect chiller driven by 10,000 m2 EFPC and 10,000 m2 PTC attain the lowest DPR at 17.57 and 18.4 years, respectively. It is also notable that these cooling systems can only partially compensate for the power drop during hot days. They can increase the energy production of the power plant by 19,565 and 22,067 MWh, respectively.
Of the three cities considered in this study, exceptional economic results were obtained in Phoenix due to its favorable weather conditions for solar thermal installations and high cost of electricity. As depicted in Figure 13, attractive DPR periods between 5 and 10 years are achieved via several configurations with SEAC driven by FPC and ETC. For full energy restoration, 50,000 m2 of FPC with cooling capacity of 16.2 MW, can produce 45,302 MWh extra energy with a DPR of 5.85 years. Similarly, 50,000 m2 of ETC with a cooling capacity of 10.2 MW generates 45,642 MWh extra energy with a DPR of 5.83 years. EFPC and PTC systems equipped with 20,000 m2 collector area boost the produced energy by 42,290 MWh and 44,014 MWh with DPRs of 2.85 and 3.02 years, respectively. In all these four cooling systems, the most economic configurations can partially compensate for the power drop in summers. Therefore, besides economic results, the energy demands on the location of the power plant should also be considered.
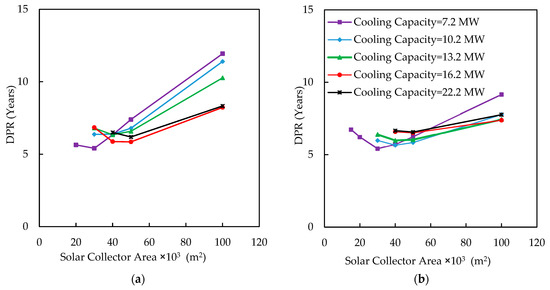
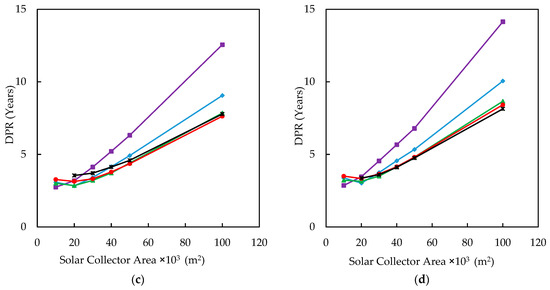
Figure 13.
DPR for different chiller sizes and different solar thermal collector area in Phoenix (a) FPC; (b) ETC; (c) EFPC; and (d) PTC.
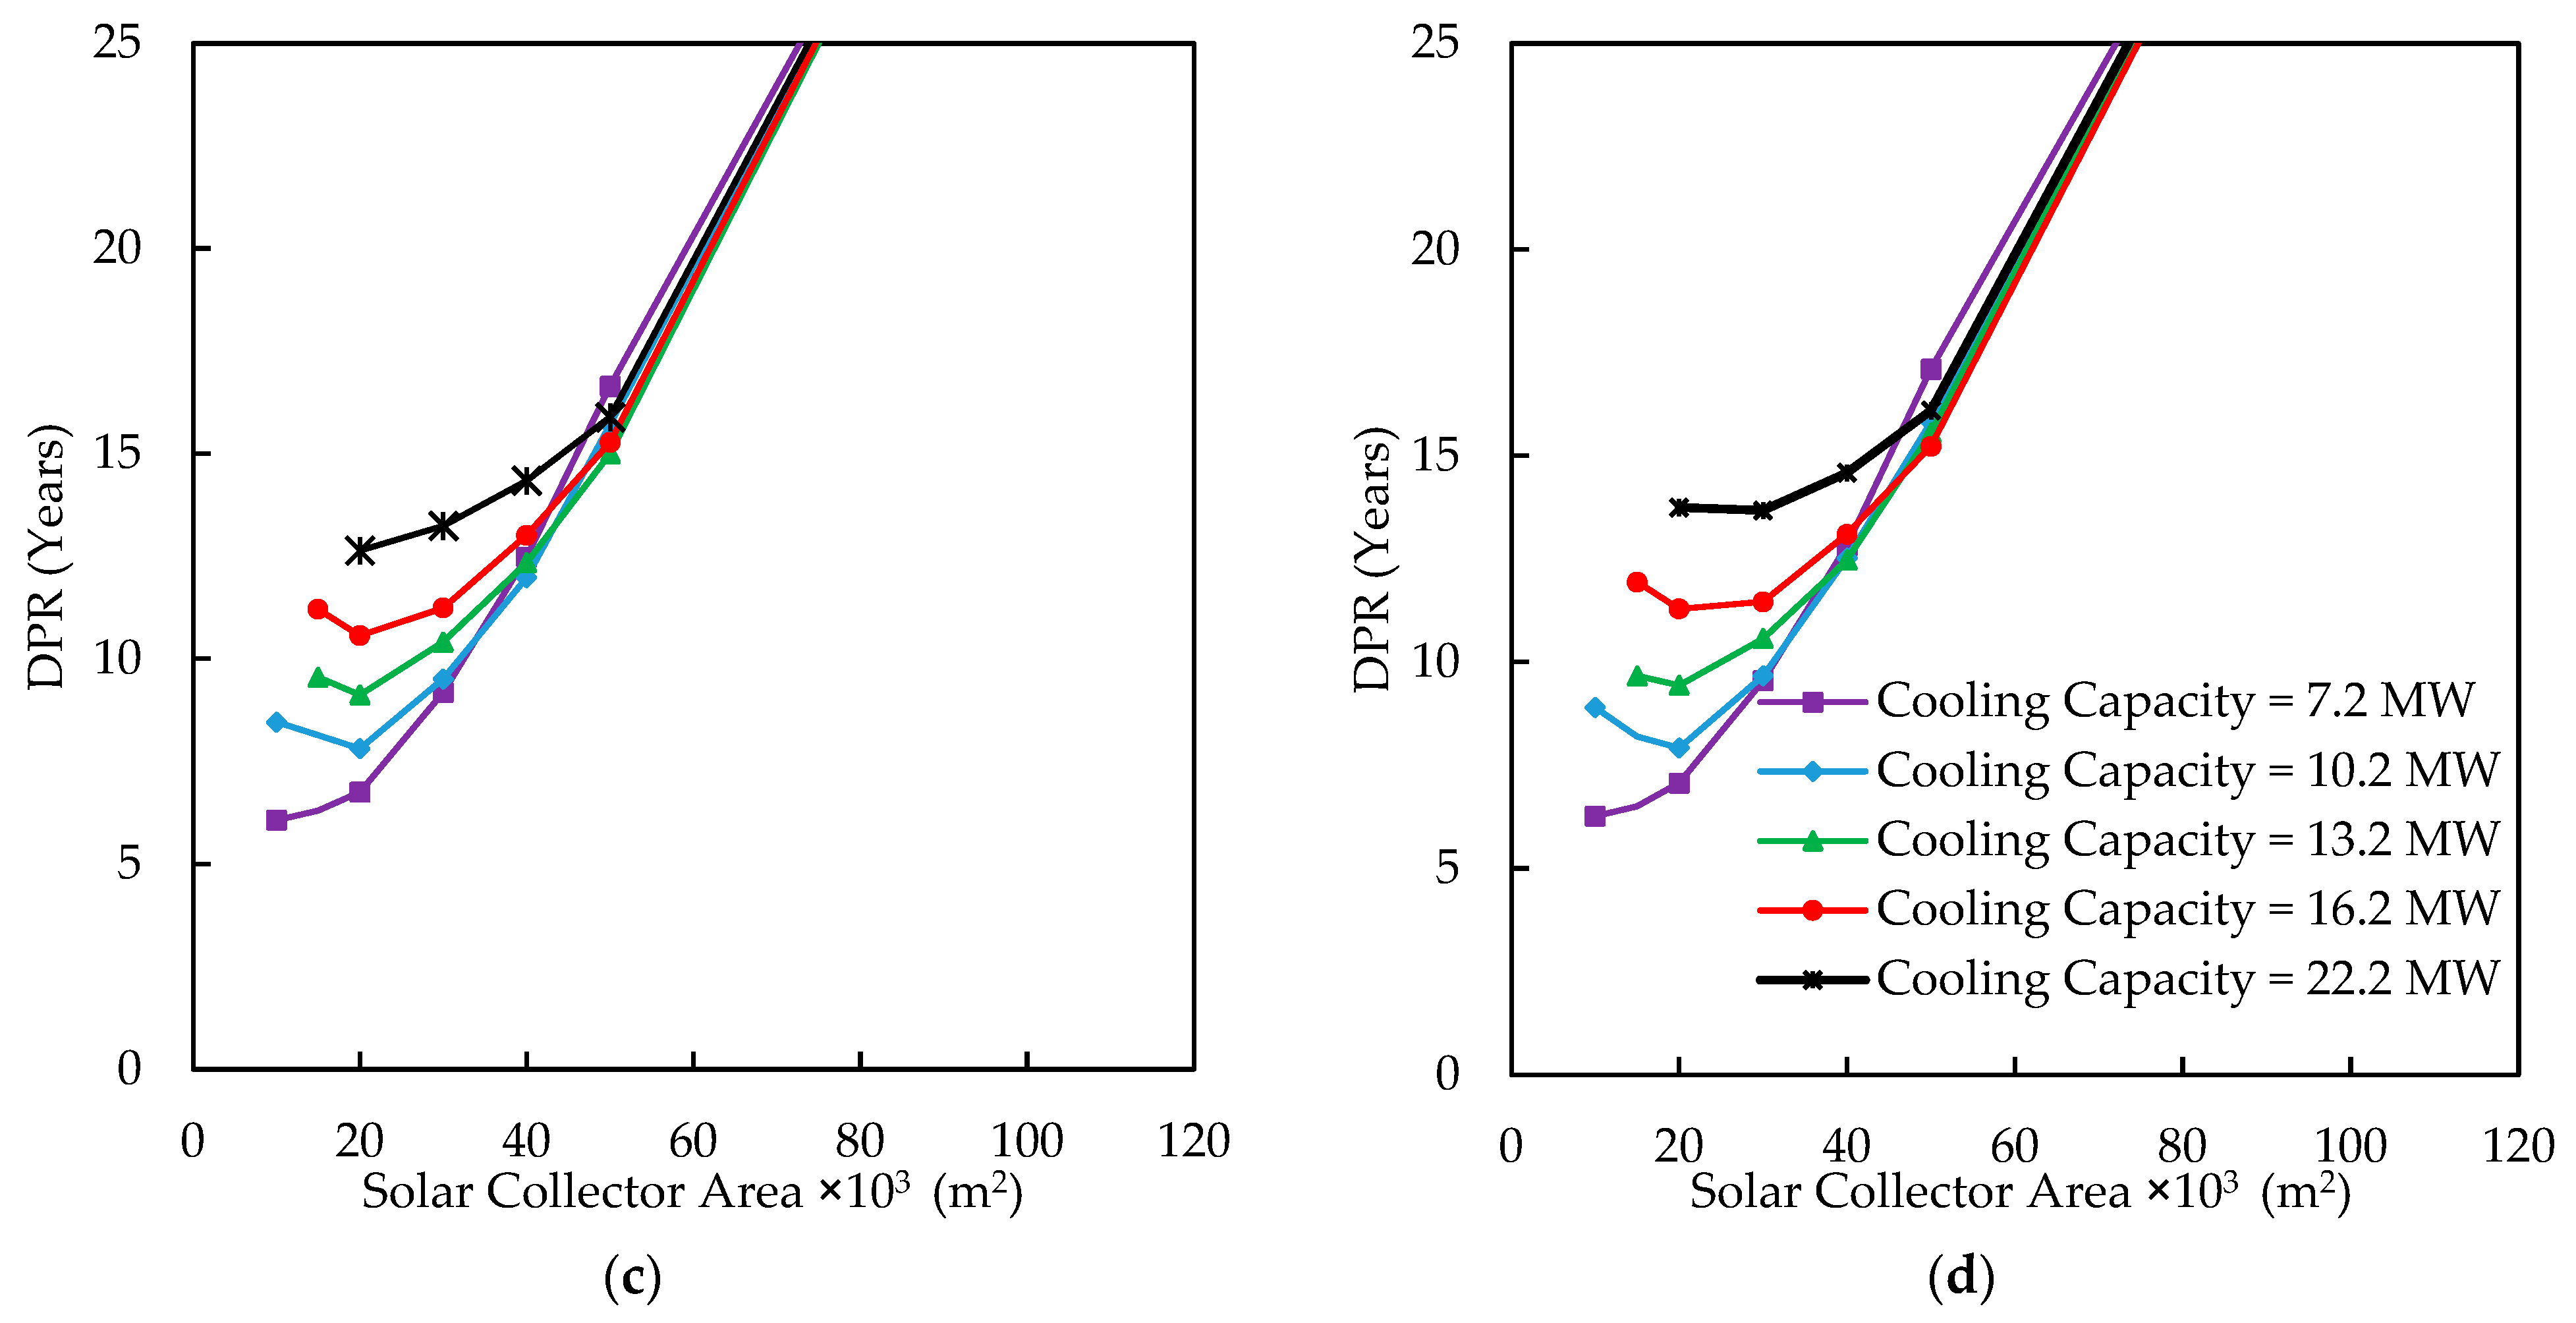
In Houston, the system is less economical than in Phoenix, but it is still feasible with the usage of EFPC and PTC collectors. Figure 14 shows that single-effect cooling systems utilizing FPC and ETC have a longer DPR of 15 and 13 years, respectively, making them a less appealing choice in Houston. EFPC with a cooling capacity of 7.2 MW and 10,000 m2 of collector area is the most economical system, as the system can produce 12,160 MWh at a DPR of 6.07 years. The configuration with a 40,000 m2 EFPC collector and 10.2 MW DEAC can produce 24,884 MWh extra energy with a DPR of 11.98 years. Any further increase in the size of the system leads to a drastic increase in the DPR. Finally, the PTC with 7.2 MW cooling capacity and 10,000 m2 can produce 13,655 MWh extra energy with a DPR of 6.27 years. It is evident from the analysis that EFPC with low cooling and collector capacities will be beneficial for the operation in a hot-humid location like Houston.
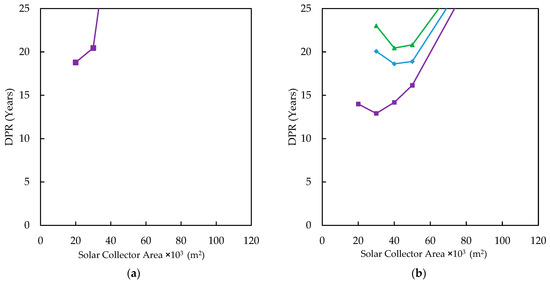
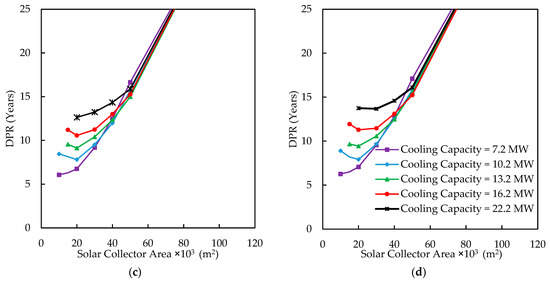
Figure 14.
DPR for different chiller sizes and different solar thermal collector area in Houston (a) FPC; (b) ETC; (c) EFPC; and (d) PTC.
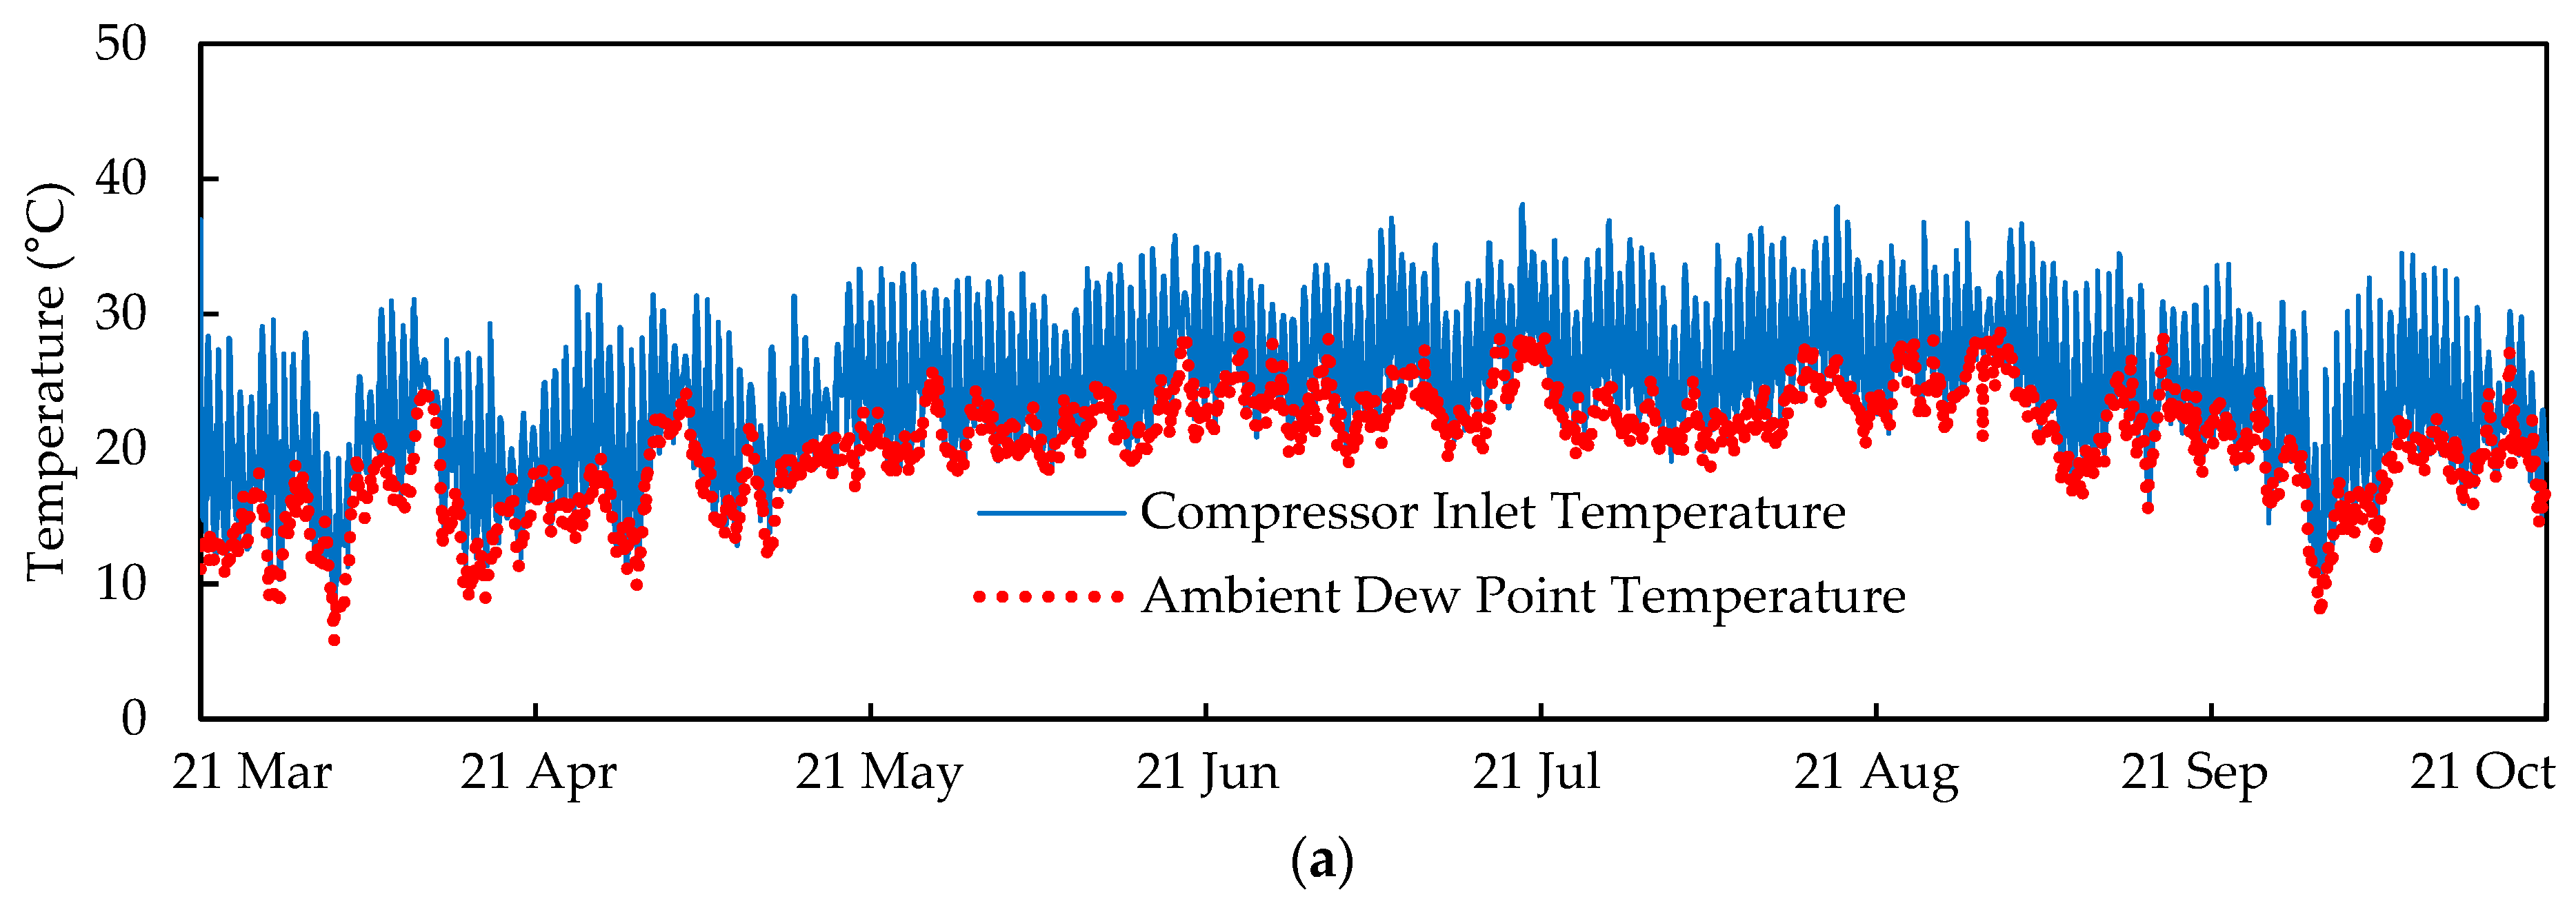
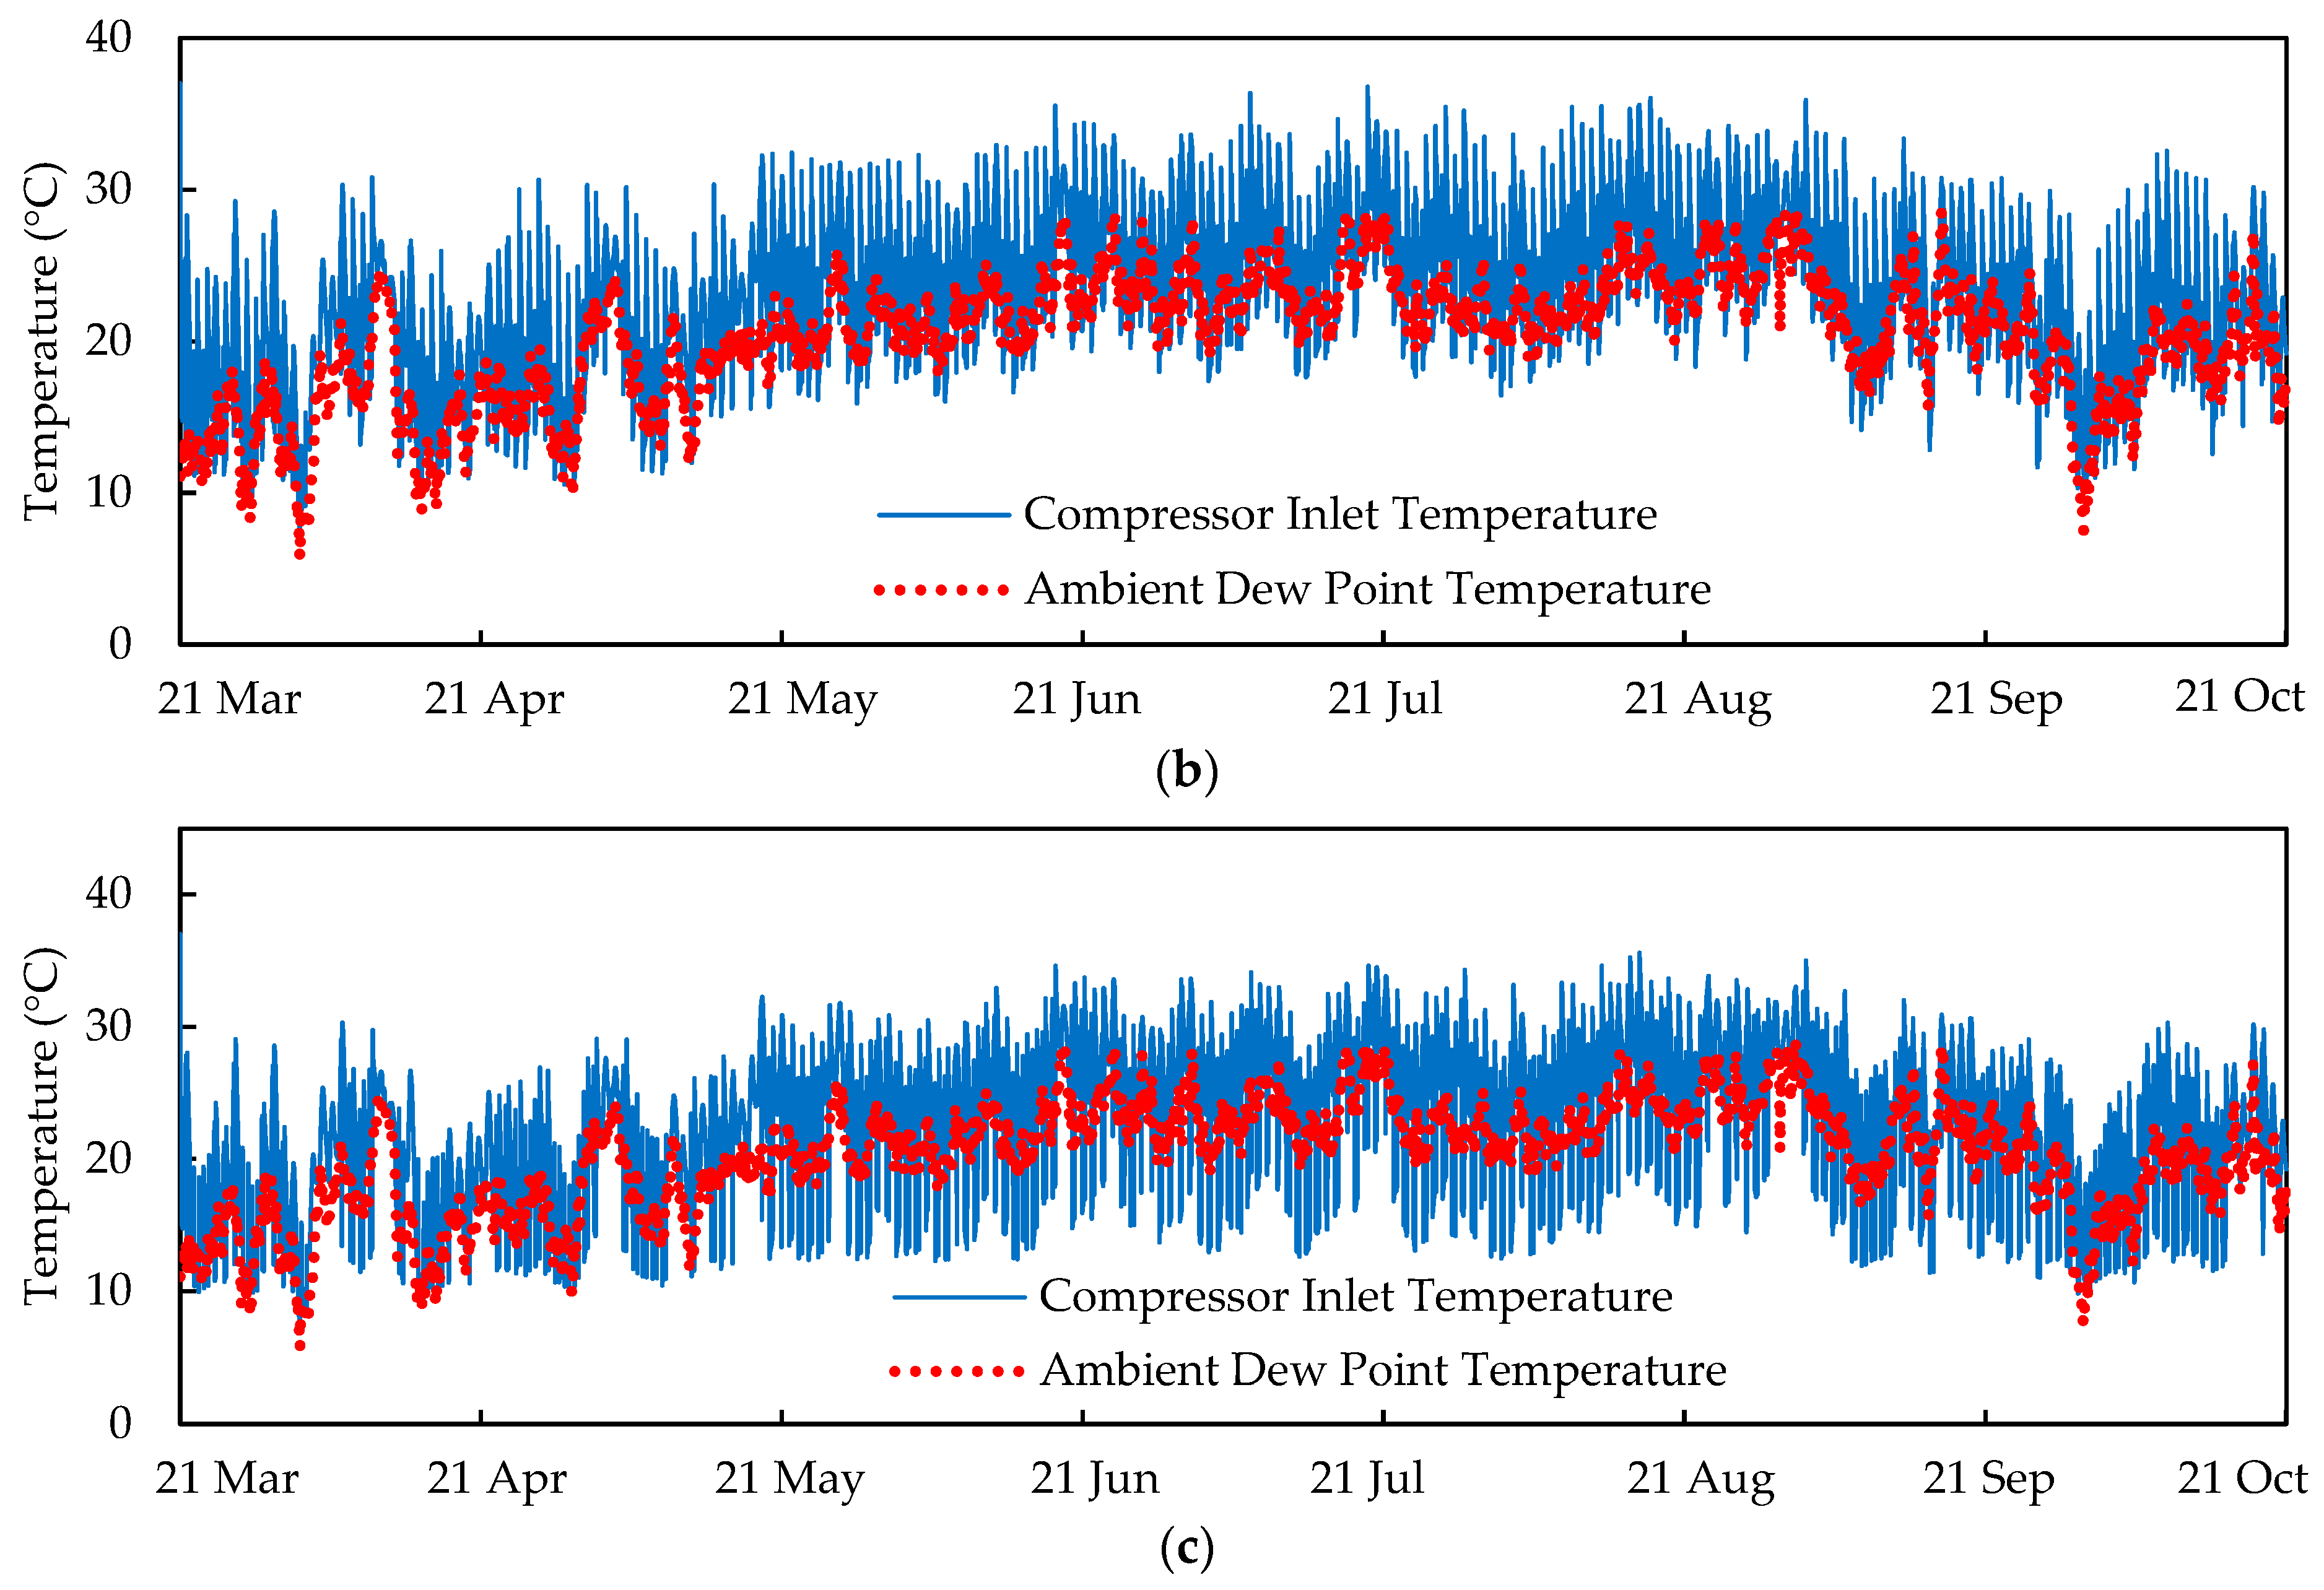
Due to the high level of humidity in Houston, special attention has been given to this city. The dew point temperature in Houston varies between 22 and 27 °C during the testing months. Reducing the air temperature below the dew point requires condensation of the moisture, which imposes a heavy load on the absorption chiller.
Three DEAC driven by EFPC with varying sizes were analyzed. These systems included 7.2 MW with a collector area of 10,000 m2, 13.2 MW with a collector area of 40,000 m2, and 22.2 MW with a collector area of 100,000 m2. Figure 15 illustrates the compressor inlet temperature for each system. The 7.2 MW system was able to cool the temperature near the dew point. This design strategy prevents the cooling system from condensing moisture and entering the latent heat zone. However, in the 22.2 MW system, the temperature was cooled well below the dew point. This latent heat removal significantly increases the total EFPC collector requirement by 10-fold (100,000 m2), resulting in a drastic increase in capital cost, making the system uneconomical.
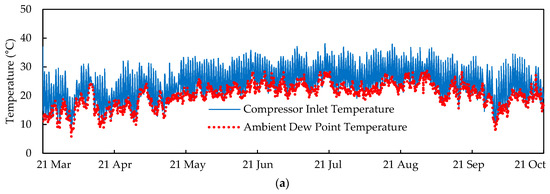
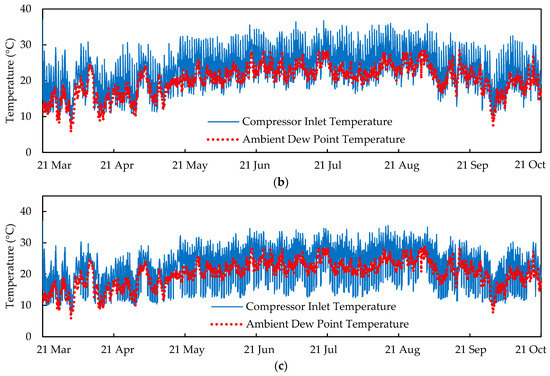
Figure 15.
Variations in compressor inlet temperature and dew point temperature over a year in Houston; (a) collector area of 10,000 m2 and chiller cooling capacity of 7.2 MW; (b) collector area of 40,000 m2 and chiller cooling capacity of 13.2 MW; (c) collector area of 100,000 m2 and chiller cooling capacity of 22.2 MW.
In conclusion, in humid areas, it is not economically viable to cool the air below the dew point using solar cooling systems due to the high capital costs associated with the increased collector requirements.
5. Conclusions
A comprehensive simulation was conducted to design a solar inlet air cooling (SIAC) system for combined cycle power plants (CCPPs) in the cities of Tehran, Phoenix, and Houston. Results indicate that SIAC systems have the potential to increase output power and generate an additional 10,000–60,000 MWh of energy during hot days. However, economic feasibility is a crucial factor in the implementation of this technology. Major findings of the work are presented below:
- For a feasible solution to the issue, a detailed simulation is required considering the type and size of the solar collectors, type and cooling capacity of the chiller, climate conditions, and electricity cost. DPR varies from 2.86 years to more than 20 years based on these parameters.
- Lower cooling capacity systems with smaller collector areas have a shorter DPR, but they may partially recover the reduced power during hot days. For instance, in Houston, 40,000 m2 of the EFPC with 16.2 MW of cooling capacity generates 25,627 MWh extra energy with a DPR of 13 years. With half the size of the collector and 7.2 MW cooling capacity, the DPR reduces to 6.75 years while generating only 18,916 MWh. Therefore, power demands must also be taken into consideration alongside economic considerations.
- Double-effect systems coupled with EFPC and PTC demonstrated the highest performance among all systems. The best economic results were obtained with EFPC in different locations. Coupling EFPC with double-effect systems appears to be a promising option for solar cooling systems.
- In Phoenix, all types of solar cooling systems were found to be economically feasible, with many configurations having a DPR of fewer than 10 years that can recover all the reduced power. In the best configurations, single-effect systems can recover the output power with a DPR of between 6 and 7 years, while the DPR for double-effect systems can fall between 3 and 4 years in case of an optimum design for system.
- In Houston, high humidity negatively impacted the feasibility of SIAC systems. It was concluded that for humid locations like Houston, the solar cooling system should be designed to cool the hot air down to the dew point temperature to avoid a large latent heat load. Although this method cannot completely recover the reduced power, further cooling of the air leads to a steep increase in the collector requirement, which makes the system uneconomical.
- In Tehran, due to the low electricity prices, it was not possible to find an economically viable system to recover the reduced power. However, a DPR of fewer than 20 years was possible with a low collector area and a small cooling capacity.
- Solar inlet air cooling system showed a high potential for increasing the output power of the combined cycle during hot days. However, because of the high capital costs of solar thermal systems and absorption chillers, the feasibility of the system is sensitive to many parameters, such as electricity price, humidity, and solar irradiance. Accordingly, finding a feasible design in some locations may be a challenge.
Author Contributions
Conceptualization, B.R. and A.A.; methodology, B.R. and A.A.; software, A.A. and B.R.; validation, A.A.; formal analysis, B.R. and A.A.; investigation, B.R. and A.A.; resources, B.R. and A.A.; data curation, B.R. and A.A.; writing—original draft preparation, B.R. and A.A.; writing—review and editing, B.R., A.A. and G.M.; visualization, A.A. and B.R.; supervision, G.M.; project administration, G.M.; funding acquisition, G.M. All authors have read and agreed to the published version of the manuscript.
Funding
This research received no external funding.
Data Availability Statement
Not applicable.
Conflicts of Interest
The authors declare no conflict of interest.
Nomenclature
| Antonyms | h | specific enthalpy, kJ/kg | |
| AC | Absorption Chiller | I | Solar Irradiance, W/m2 |
| C | Compressor | IAM | Incident Angle Modifier |
| BFP | Boiler Feed Pump | k | pressure ratio of compressor |
| CWP | Circulating Water Pump | P | Pressure, Pa |
| CC | Combustion Chamber | mass flow rate, kg/s | |
| CCP | Combined Cycle Power Plant | rc | Pressure ratio of compressor |
| Cond | Condenser | T | Temperature, K |
| COP | Coefficient of Performance | u | Wind speed, m/s |
| CPC | Compound Parabolic Collector | Power, kW | |
| DEAC | Double-Effect Absorption Chiller | x | mass concentration of LiBr in the absorption chiller solution |
| DNI | Direct Normal Irradiance | y | mass fraction |
| DPR | Discounted Payback Return | Greek Letters | |
| EFPC | Evacuated Flat Plate Collector | α | absorptance |
| ETC | Evacuated Tube Collector | η | efficiency |
| FPC | Flat Plate Collector | τ | transmittance |
| G | Generator | φ | exergy coefficient of the fuel |
| GT | Gas Turbine | Stefan–Boltzmann constant, kW/m2K4 | |
| HRSG | Heat Recovery Steam Generator | Subscripts and superscripts | |
| HP | High Pressure | a | air |
| IP | Intermediate Pressure | amb | ambient |
| LHV | Low Heating Value, kJ/kg | ave | average |
| PTC | Parabolic Trough Collectors | col | collector |
| SEAC | Single-Effect Absorption Chiller | com | compressor |
| SFC | Specific Fuel Consumption | e | exit |
| SIAC | Solar Inlet Air Cooling | en | energy |
| ST | Stream Turbine | ex | exergy |
| TIT | Gas Turbine Inlet Temperature | f | fuel |
| Symbols | g | gas | |
| a0 | zero loss efficiency of the collector at normal incidence angle | me | mechanical |
| a1 | first order heat loss coefficient, kW/m2K | ||
| a2 | second order heat loss coefficient | ||
| A | area, m2 | ||
| CRCS | collector concentration ratio | ||
| EL | emissivity | ||
References
- Ameri, M.; Ahmadi, P.; Hamidi, A. Energy, exergy and exergoeconomic analysis of a steam power plant: A case study. Int. J. Energy Res. 2009, 33, 499–512. [Google Scholar] [CrossRef]
- Roshanzadeh, B.; Ahmadi-Danesh-Ashtiani, H. Exergy analysis and optimisation study of eliminating negative effects of electrical load variations in steam power plants. Int. J. Exergy 2018, 27, 21. [Google Scholar] [CrossRef]
- Regulagadda, P.; Dincer, I.; Naterer, G.F. Exergy analysis of a thermal power plant with measured boiler and turbine losses. Appl. Therm. Eng. 2010, 30, 970–976. [Google Scholar] [CrossRef]
- Kehlhofer, R.; Rukes, B.; Hannemann, F.; Stirnimann, F. Combined-Cycle Gas & Steam Turbine Power Plants; PennWell Books, LLC: Tulsa, OK, USA, 2009. [Google Scholar]
- Kopac, M.; Hilalci, A. Effect of ambient temperature on the efficiency of the regenerative and reheat Çatalaǧzi{dotless} power plant in Turkey. Appl. Therm. Eng. 2007, 27, 1377–1385. [Google Scholar] [CrossRef]
- Aljundi, I.H. Energy and exergy analysis of a steam power plant in Jordan. Appl. Therm. Eng. 2009, 29, 324–328. [Google Scholar] [CrossRef]
- Liu, Z.; Karimi, I.A.; He, T. A novel inlet air cooling system based on liquefied natural gas cold energy utilization for improving power plant performance. Energy Convers. Manag. 2019, 187, 41–52. [Google Scholar] [CrossRef]
- Arrieta, F.R.P.; Lora, E.E.S. Influence of ambient temperature on combined-cycle power-plant performance. Appl. Energy 2005, 80, 261–272. [Google Scholar] [CrossRef]
- Şen, G.; Nil, M.; Mamur, H.; Doğan, H.; Karamolla, M.; Karaçor, M.; Kuyucuoğlu, F.; Yörükeren, N.; Bhuiyan, M.R.A. The effect of ambient temperature on electric power generation in natural gas combined cycle power plant—A case study. Energy Rep. 2018, 4, 682–690. [Google Scholar] [CrossRef]
- Ünver, Ü.; Kiliç, M. Influence of environmental temperature on exergetic parameters of a combined cycle power plant. Int. J. Exergy 2017, 22, 73. [Google Scholar] [CrossRef]
- Wang, S.; Liu, Z.; Cordtz, R.; Imran, M.; Fu, Z. Performance prediction of the combined cycle power plant with inlet air heating under part load conditions. Energy Convers. Manag. 2019, 200, 112063. [Google Scholar] [CrossRef]
- Liu, Z.; Karimi, I.A. Simulation and optimization of a combined cycle gas turbine power plant for part-load operation. Chem. Eng. Res. Des. 2018, 131, 29–40. [Google Scholar] [CrossRef]
- Mostafa, M.; Eldrainy, Y.A.; EL-Kassaby, M.M. A comprehensive study of simple and recuperative gas turbine cycles with inlet fogging and overspray. Therm. Sci. Eng. Prog. 2018, 8, 318–326. [Google Scholar] [CrossRef]
- Dawoud, B.; Zurigat, Y.H.; Bortmany, J. Thermodynamic assessment of power requirements and impact of different gas-turbine inlet air cooling techniques at two different locations in Oman. Appl. Therm. Eng. 2005, 25, 1579–1598. [Google Scholar] [CrossRef]
- Saghafifar, M.; Gadalla, M. Innovative inlet air cooling technology for gas turbine power plants using integrated solid desiccant and Maisotsenko cooler. Energy 2015, 87, 663–677. [Google Scholar] [CrossRef]
- Naeim, K.A.; Hegazi, A.A.; Awad, M.M.; El-Emam, S.H. Inlet air fogging strategy using natural gas fuel cooling potential for gas turbine power plants. Case Stud. Therm. Eng. 2022, 37, 102235. [Google Scholar] [CrossRef]
- Abdul-Wahab, S.A.; Zurigat, Y.H.; Bortmany, J.N. Gas turbine emissions and environmental impact of efficiency boosting techniques. Int. J. Environ. Pollut. 2005, 23, 273. [Google Scholar] [CrossRef]
- Kwon, H.M.; Kim, T.S.; Sohn, J.L.; Kang, D.W. Performance improvement of gas turbine combined cycle power plant by dual cooling of the inlet air and turbine coolant using an absorption chiller. Energy 2018, 163, 1050–1061. [Google Scholar] [CrossRef]
- Alhazmy, M.M.; Jassim, R.K.; Zaki, G.M. Performance enhancement of gas turbines by inlet air-cooling in hot and humid climates. Int. J. Energy Res. 2006, 30, 777–797. [Google Scholar] [CrossRef]
- Alhazmy, M.M.; Najjar, Y.S.H. Augmentation of gas turbine performance using air coolers. Appl. Therm. Eng. 2004, 24, 415–429. [Google Scholar] [CrossRef]
- Shirazi, A.; Taylor, R.A.; Morrison, G.L.; White, S.D. Solar-powered absorption chillers: A comprehensive and critical review. Energy Convers. Manag. 2018, 171, 59–81. [Google Scholar] [CrossRef]
- Gomri, R. Investigation of the potential of application of single effect and multiple effect absorption cooling systems. Energy Convers. Manag. 2010, 51, 1629–1636. [Google Scholar] [CrossRef]
- Mohan, G.; Dahal, S.; Kumar, U.; Martin, A.; Kayal, H. Development of natural gas fired combined cycle plant for tri-generation of power, cooling and clean water using waste heat recovery: Techno-economic analysis. Energies 2014, 7, 6358–6381. [Google Scholar] [CrossRef]
- El-Shazly, A.A.; Elhelw, M.; Sorour, M.M.; El-Maghlany, W.M. Gas turbine performance enhancement via utilizing different integrated turbine inlet cooling techniques. Alex. Eng. J. 2016, 55, 1903–1914. [Google Scholar] [CrossRef]
- Mohapatra, A.K.; Sanjay, O. Analysis of parameters affecting the performance of gas turbines and combined cycle plants with vapor absorption inlet air cooling. Int. J. Energy Res. 2014, 38, 223–240. [Google Scholar] [CrossRef]
- Paudel, A.; Bandhauer, T. Techno-economic analysis of waste heat recovery systems for wet-cooled combined cycle power plants. Appl. Therm. Eng. 2018, 143, 746–758. [Google Scholar] [CrossRef]
- Khaledi, H.; Zomorodian, R.; Ghofrani, M.B. Effect of inlet air cooling by absorption chiller on gas turbine and combined cycle performance. ASME Int. Mech. Eng. Congr. Expo. 2005, 42118, 507–515. [Google Scholar]
- Mohapatra, A.K.; Sanjay, O. Thermodynamic assessment of impact of inlet air cooling techniques on gas turbine and combined cycle performance. Energy 2014, 68, 191–203. [Google Scholar] [CrossRef]
- Boonnasa, S.; Namprakai, P.; Muangnapoh, T. Performance improvement of the combined cycle power plant by intake air cooling using an absorption chiller. Energy 2006, 31, 2036–2046. [Google Scholar] [CrossRef]
- Abdel Rahman, A.A.; Mokheimer, E.M.A. Boosting Gas Turbine Combined Cycles in Hot Regions Using Inlet Air Cooling including Solar Energy. Energy Procedia 2017, 142, 1509–1515. [Google Scholar] [CrossRef]
- Popov, D. Innovative solar augmentation of gas turbine combined cycle plants. Appl. Therm. Eng. 2014, 64, 40–50. [Google Scholar] [CrossRef]
- Siddiqui, M.E.; Almitani, K.H. Energy and exergy assessment of S-CO2 brayton cycle coupled with a solar tower system. Processes 2020, 8, 1264. [Google Scholar] [CrossRef]
- Almatrafi, E.; Khaliq, A.; Kumar, R.; Bamasag, A.; Siddiqui, M.E. Proposal and Investigation of a New Tower Solar Collector-Based Trigeneration Energy System. Sustainability 2023, 15, 7474. [Google Scholar] [CrossRef]
- Kotas, T.J. The Exergy Method of Thermal Plant Analysis; Elsevier: Amsterdam, The Netherlands, 2013. [Google Scholar]
- Buonomano, A.; Calise, F.; D’accadia, M.D.; Ferruzzi, G.; Frascogna, S.; Palombo, A.; Russo, R.; Scarpellino, M. Experimental analysis and dynamic simulation of a novel high-temperature solar cooling system. Energy Convers. Manag. 2016, 109, 19–39. [Google Scholar] [CrossRef]
- Cabrera, F.J.; Fernández-García, A.; Silva, R.M.P.; Pérez-García, M. Use of parabolic trough solar collectors for solar refrigeration and air-conditioning applications. Renew. Sustain. Energy Rev. 2013, 20, 103–118. [Google Scholar] [CrossRef]
- Duffie, J.A.; Beckman, W.A. Solar Engineering of Thermal Processes, 4th ed.; Wiley and Sons: Hoboken, NJ, USA, 2013. [Google Scholar] [CrossRef]
- Shirazi, A.; Taylor, R.A.; White, S.D.; Morrison, G.L. A systematic parametric study and feasibility assessment of solar-assisted single-effect, double-effect, and triple-effect absorption chillers for heating and cooling applications. Energy Convers. Manag. 2016, 114, 258–277. [Google Scholar] [CrossRef]
- Altun, A.F.; Kilic, M. Economic feasibility analysis with the parametric dynamic simulation of a single effect solar absorption cooling system for various climatic regions in Turkey. Renew. Energy 2020, 152, 75–93. [Google Scholar] [CrossRef]
- BROAD U.S.A n.d. Available online: https://www.broadusa.net/en/ (accessed on 9 January 2020).
- Gebreslassie, B.H.; Medrano, M.; Boer, D. Exergy analysis of multi-effect water-LiBr absorption systems: From half to triple effect. Renew. Energy 2010, 35, 1773–1782. [Google Scholar] [CrossRef]
- Tsoutsos, T.; Aloumpi, E.; Gkouskos, Z.; Karagiorgas, M. Design of a solar absorption cooling system in a Greek hospital. Energy Build. 2010, 42, 265–272. [Google Scholar] [CrossRef]
- Uday Kumar, N.T.; Mohan, G.; Martin, A. Performance analysis of solar cogeneration system with different integration strategies for potable water and domestic hot water production. Appl. Energy 2016, 170, 466–475. [Google Scholar] [CrossRef]
- Mohan, G.; Kumar, U.; Pokhrel, M.K.; Martin, A. A novel solar thermal polygeneration system for sustainable production of cooling, clean water and domestic hot water in United Arab Emirates: Dynamic simulation and economic evaluation. Appl. Energy 2016, 167, 173–188. [Google Scholar] [CrossRef]
- Bellos, E.; Tzivanidis, C. Energetic and financial analysis of solar cooling systems with single effect absorption chiller in various climates. Appl. Therm. Eng. 2017, 126, 809–821. [Google Scholar] [CrossRef]
- Pattanayak, L.; Padhi, B.N. Thermodynamic simulation and economic analysis of combined cycle with inlet air cooling and fuel pre-heating: Performance enhancement and emission reduction. Energy Convers. Manag. 2022, 267, 115884. [Google Scholar] [CrossRef]
Disclaimer/Publisher’s Note: The statements, opinions and data contained in all publications are solely those of the individual author(s) and contributor(s) and not of MDPI and/or the editor(s). MDPI and/or the editor(s) disclaim responsibility for any injury to people or property resulting from any ideas, methods, instructions or products referred to in the content. |
© 2023 by the authors. Licensee MDPI, Basel, Switzerland. This article is an open access article distributed under the terms and conditions of the Creative Commons Attribution (CC BY) license (https://creativecommons.org/licenses/by/4.0/).

