Article

Passive Flow Control Application Using Single and Double Vortex Generator on S809 Wind Turbine Airfoil

by
Mustafa Özden
1,2,
Mustafa Serdar Genç
1,3,4 and
Kemal Koca
1,5,*
1
Wind Engineering and Aerodynamic Research Laboratory, Department of Energy Systems Engineering, Erciyes University, 38039 Kayseri, Turkey
2
Scientific Research Projects Unit, Erciyes University, 38039 Kayseri, Turkey
3
Energy Conversion Research and Application Center, Erciyes University, 38039 Kayseri, Turkey
4
MSG Teknoloji Ltd., Şti, Erciyes Teknopark Tekno-1 Binası, 61/20, 38039 Kayseri, Turkey
5
Department of Mechanical Engineering, Abdullah Gül University, 38080 Kayseri, Turkey
*
Author to whom correspondence should be addressed.
Energies 2023, 16(14), 5339; https://doi.org/10.3390/en16145339
Submission received: 15 March 2023 / Revised: 2 July 2023 / Accepted: 7 July 2023 / Published: 12 July 2023
(This article belongs to the Special Issue Advances in Renewable Energy Research and Applications)

Abstract

:
The current study is aimed at investigating the influences of vortex generator (VG) applications mounted to the suction and pressure surfaces of the S809 wind turbine airfoil at low Reynolds number flow conditions. Both single and double VG applications were investigated to provide technological advancement in wind turbine blades by optimizing their exact positions on the surface of the airfoil. The results of the smoke-wire experiment for the uncontrolled case reveal that a laminar separation bubble formed near the trailing edge of the suction surface, and it was moved towards the leading edge as expected when the angle of attack was increased, resulting in bubble burst and leading-edge flow separation at α = 12°. The u/U, laminar kinetic energy and total fluctuation energy contours obtained from the numerical study clearly show that both the single and double VG applications produced small eddies, and those eddies in the double VG case led the flow to be reattached at the trailing edge of the suction surface and to gain more momentum by energizing. This situation was clearly supported by the results of aerodynamic force; the double VG application caused the lift coefficient to increase, resulting in an enhancement of the aerodynamic performance. A novel finding is that the VG at the pressure surface caused the flow at the wake region to gain more energy and momentum, resulting in a reattached and steadier flow condition.

1. Introduction

Due to the consuming of fossil energy resources such as natural gas, coal and petroleum alternatives, as well as global warming, sustainable progress in the energy sector has significantly grown in the past decades. Regarding the low carbon economy, it has started to become more crucial, especially among developed countries.
In recent years, wind energy has improved its reputation, and it has started to spearhead electricity production among renewables [1,2]. Regarding the increase in aerodynamic performance and the extraction of more power from wind energy [3], aerodynamic investigators have performed numerous studies so far [4]. They aimed to mitigate and suppress a few flow phenomena such as boundary layer separation, unsteady flow characteristics and laminar separation bubbles (LSB) formed over wind turbine blades [5] operating at low Reynolds number regimes [6,7,8,9]. Their experimental or numerical results indicate that these phenomena both negatively affected the aerodynamic performance of wind turbine blades and caused disturbing noise and vibration [10,11,12]. Therefore, a strong interest was developed among aerodynamic researchers in terms of flow control techniques [13,14,15,16,17,18,19,20,21,22,23,24,25].
As mentioned in the flow control study presented by Genç et al. [25], flow control techniques generally have two sub-branches, including laminar flow and turbulence manipulation. Also, turbulence manipulation methods can be divided into two essential branches, which are passive and active control techniques. Active control methods have not been as widely performed because both of their installation processes are more time-consuming and their experimental rigs are relatively expensive compared to passive control methods.
Among passive control techniques, vortex generators (VGs), which are the most famous in terms of the production of turbulence manipulation, have been extensively used in different applications such as all flight vehicles [26], solar chimneys [27], etc. The essential mission of VGs is to energize the flow in the boundary layer by transmitting momentum from the main flow, resulting in the boundary layer separation being hindered [28,29,30]. The pioneering study was studied by Taylor [31], and many aerodynamic engineers have so far studied the application of VGs in their studies, as shown in Table 1. Unlike the studies on VGs that are summarized in Table 1, this study aims to investigate the VGs mounted on both the suction surface and pressure surface of the S809 airfoil as a novelty. A detailed investigation of the function of VGs was conducted into the two main structures as follows: (i) the wind tunnel research, including the smoke-wire visualization and force measurement tests, as well as a comprehensive numerical simulation, were performed to observe the flow on both the suction and pressure surfaces of the uncontrolled S809 airfoil at different Reynolds numbers and angles of attack; (ii) after the suitable positions of VGs were found, the detailed numerical simulation was fulfilled for the controlled S809 airfoil.

2. Investigation Methods

As mentioned earlier, the investigation methods of this study consist of both experimental investigations in the wind tunnel and detailed numerical simulations. These techniques are explained in detail in the sub-chapters of this paper.

2.1. Experimental Arrangements

2.1.1. Test Model and Wind Tunnel

A series of experiments were conducted in the low-speed suction-type wind tunnel belonging to the Wind Engineering and Aerodynamic Research Group (WEAR) at Erciyes University. The characteristic features of the wind tunnel were as follows: a 50 cm × 50 cm test chamber surrounded with Plexiglas material for visualization experiments; a low turbulence intensity of 0.3% at maximum free-stream velocity (~40 m/s), which was convenient to investigate flow characteristics forming, especially at low Reynolds number regimes [24,47,48]. Detailed technical specifications for the wind tunnel are illustrated in Table 2. As a test model, the S809 airfoil was utilized since it was frequently preferred for horizontal axis wind turbines (HAWTs) such as NREL Phase VI and other applications, which ensured that the most comprehensive data were obtained [49]. The test model was manufactured using a 3D printer. After manufacturing, all surfaces of the airfoil were cleaned using sandpaper, and its surfaces were then painted with a rapid-drying acrylic spray to provide a very polished surface. The Plexiglas was utilized at each tip of the airfoil in order to prevent the tip vortices effects. Its chord and span lengths were 200 mm and 200 mm, respectively. The air density is 1 kg/m3 in our laboratory. The blockage ratio of the model at α = 12° was under 7%, and there were no blockage corrections needed in the experimental results [48].
Related to the dimensions of the VG, they are illustrated as a sketched image in Figure 1. The height of the VG is symbolized by h, and its length is L. In this study, the height of the VG was determined to be 0.5 mm, and the length was determined to be 4 mm.
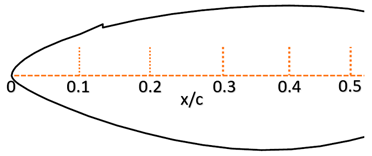
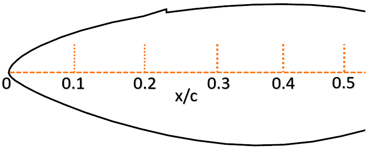
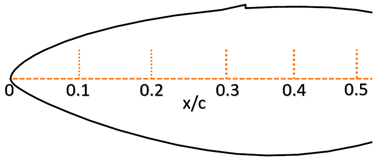
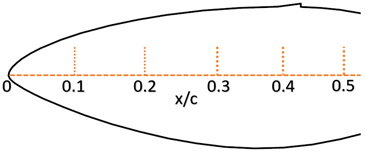
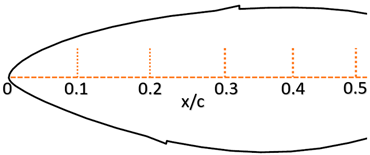
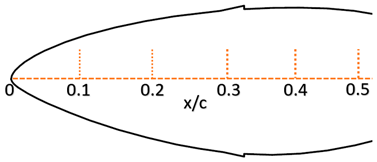
To obtain a better understanding of the position of the VGs, they were sketched and tabulated, as shown in Table 3. Furthermore, each configuration of the VGs is named from Case 1 to Case 8 hereinafter. It was clearly pointed out that a single application of VGs on the suction surfaces was determined between Case 1 and Case 5 [50], while a double application of VGs on both the suction and pressure surfaces was assigned between Case 6 and Case 8 according to their position chordwise.

2.1.2. The Smoke-Wire Test

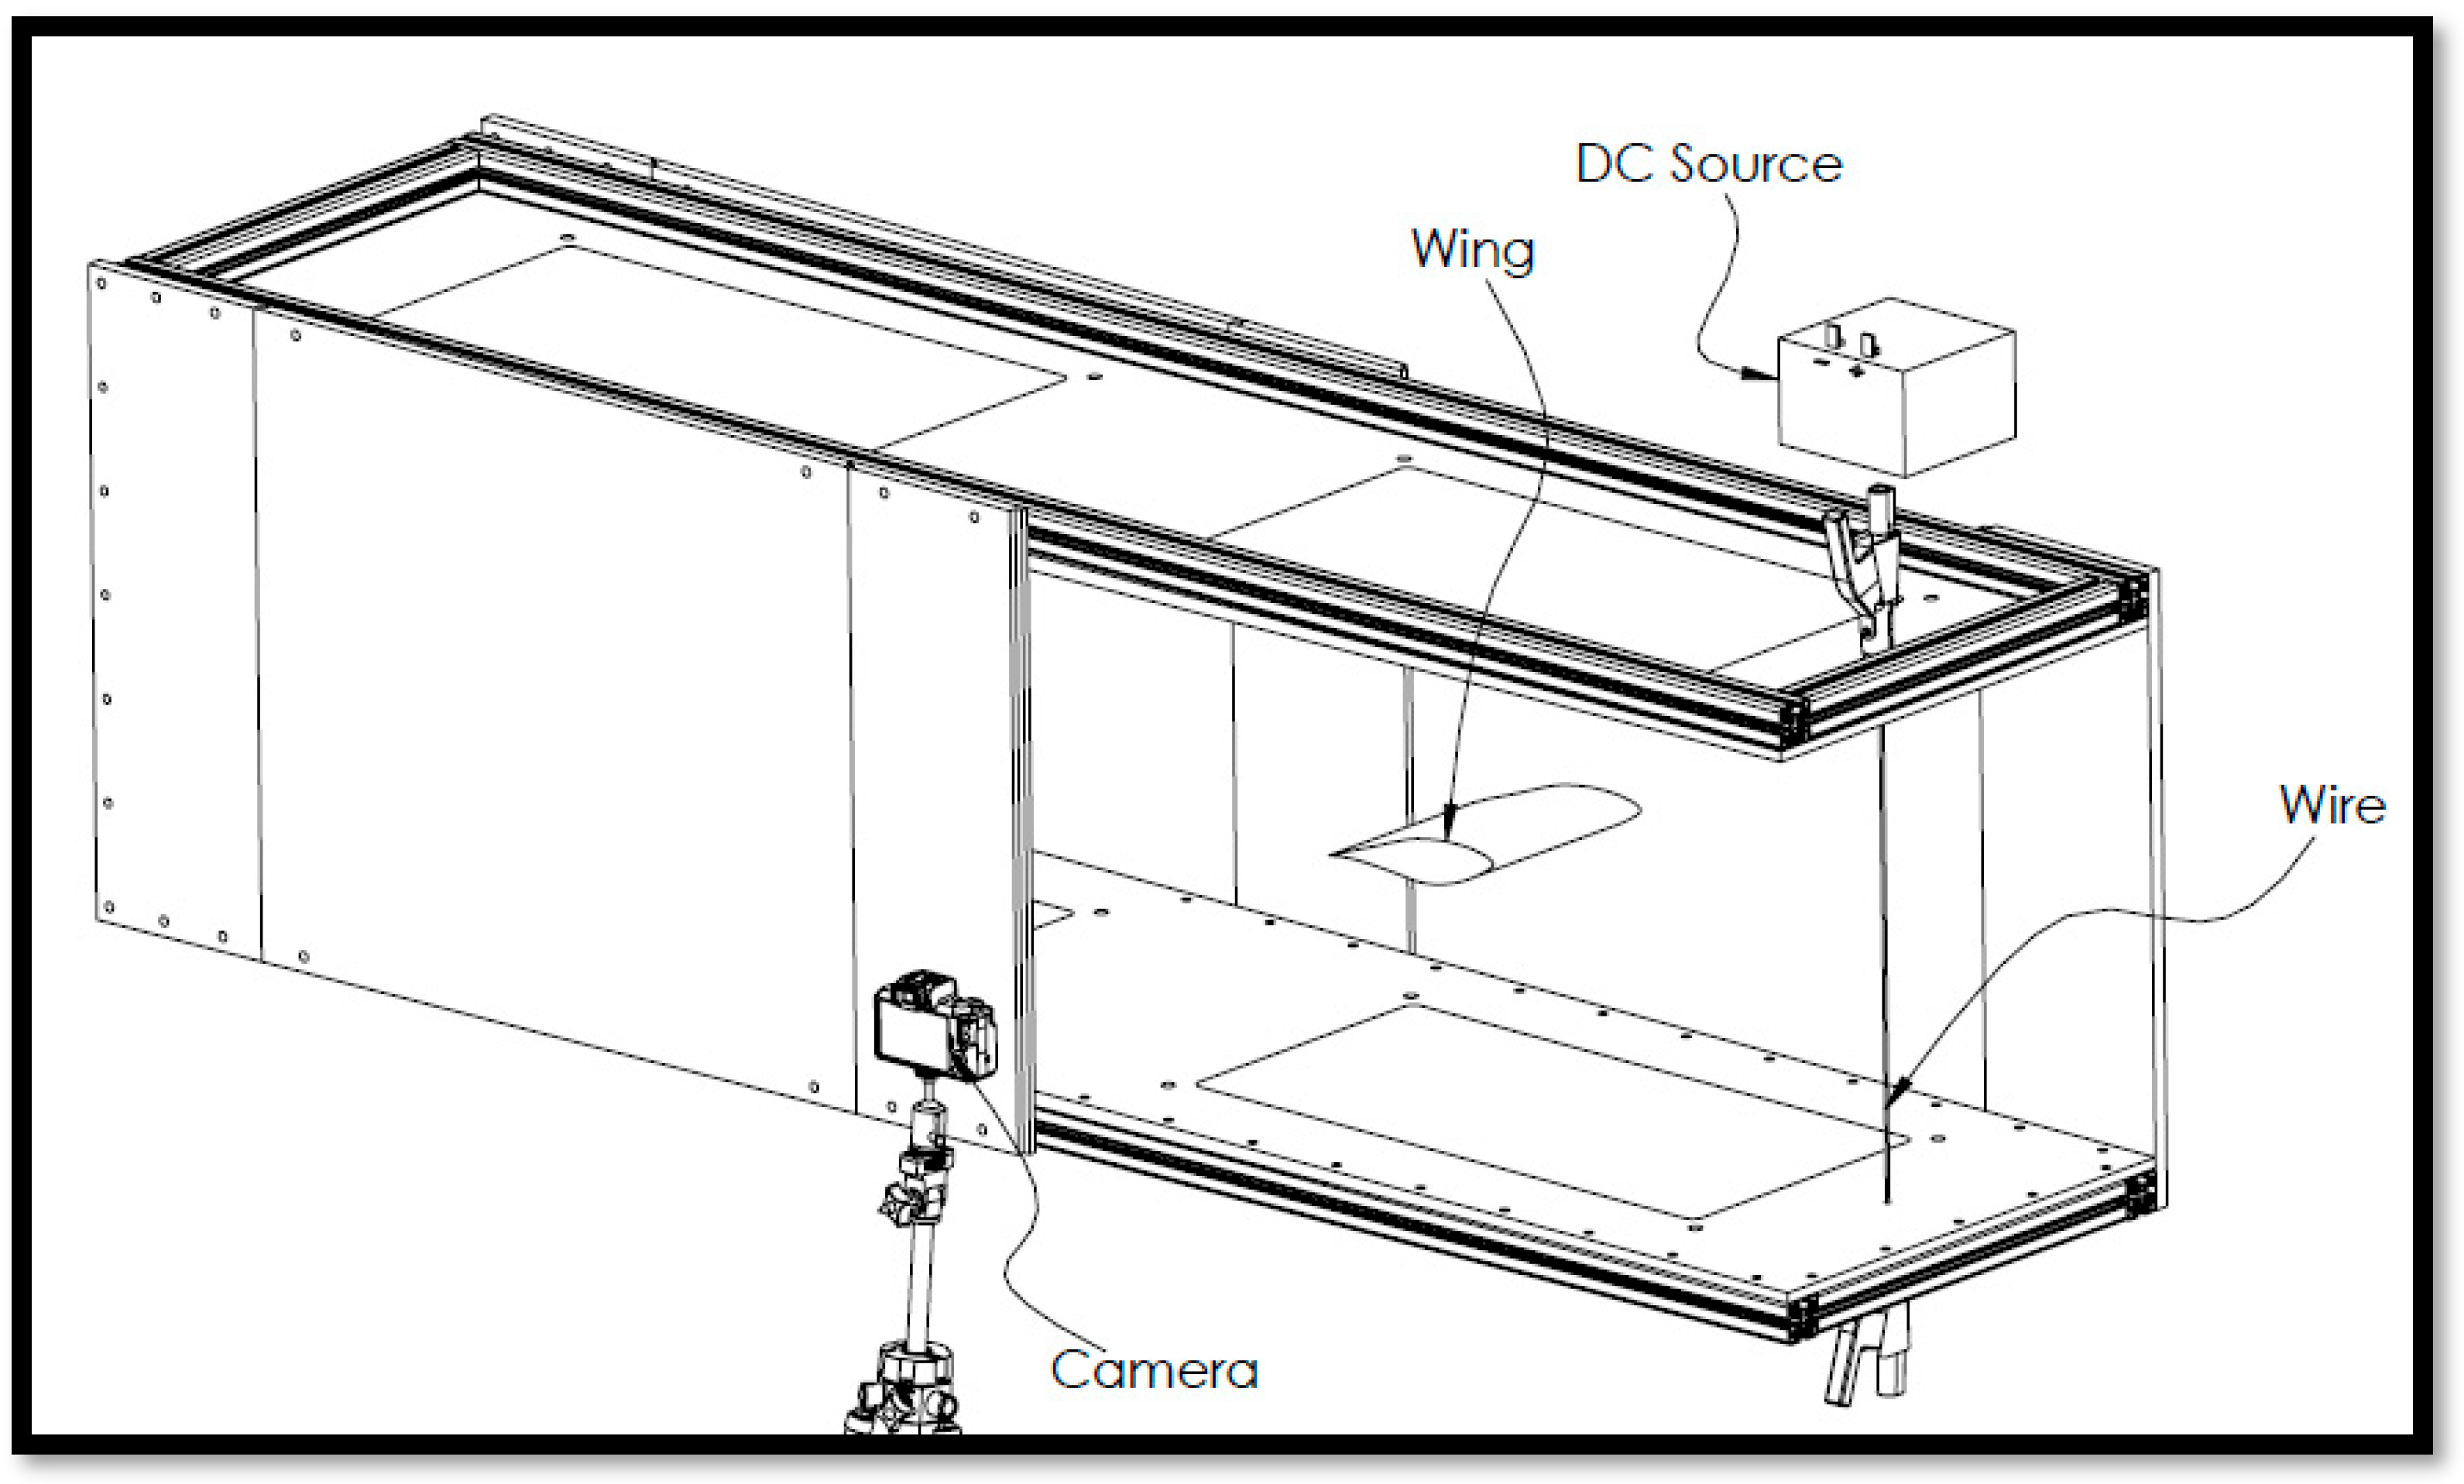
To visualize the flow phenomena on each surface of both the uncontrolled and the controlled S809 airfoils, the smoke-wire experiment was performed at different Reynolds numbers and angles of attack. The method was relatively easier than other flow visualization techniques. The equipment of the method included the following: (i) a thin copper wire in conjunction with its thickness of 0.03 mm, allowing us to form the suitable smoke sheets chordwise; (ii) an electric resistance heating system with a hand adjustment used for heating the wire and burning the oil droplets; (iii) oil; (iv) halogens to brighten and observe the flow phenomena in the test chamber; and (v) a compact camera with its tripod to record the flow phenomena during the tests. As seen in Figure 2, the thin copper wire was vertically positioned at 1.5c in front of the S809 airfoil. The draining process of the oil was manually performed on the wire. We waited for a while after the draining process so that homogeneous distribution was ensured along the wire. The electrically resistive heating was operated to burn a homogeneous oil droplet. The smoke sheets that formed in the test chamber after burning the wire were brightened by using halogens. A compact camera recorded videos of the smoke sheets. These videos were then divided into 1000 frames to obtain instantaneous images of the smoke sheets. Then, high-resolution instantaneous images were selected.

2.1.3. Hotwire Experiment

The velocity profile at the wake region ensures good results in terms of the flow phenomena that form over the suction surface thanks to the shedding of the vortices. In this respect, the hotwire measurement was conducted, as seen in Figure 3. A one-dimensional (55P16 type) hotwire probe was employed during the test in the wake of the S809 airfoil. The chord length of the model airfoil was 200 mm. It was positioned 0.5c away from the trailing edge, and it was run along the vertical axis (axis-y) at the wake region. In relation to the probe motion along the vertical axis, a traverse system that was able to move at both axis x and axis y was utilized. It was placed under the test chamber, and support rods were linked with the traverse system. Those support rods were used for the probe connection, as illustrated in the closed view. In relation to the technical specification of the hotwire measurement, the probe was run vertically at the wake region, and it gathered the data at 23 points with an interval of 5 mm (total measurement was carried out along 110 mm). Furthermore, it was run for 10 s at 2 kHz, resulting in 20,000 data samples obtained for each point. In terms of better accuracy, a probe calibration was carried out before every test using the reference velocity probe.

2.2. Numerical Method

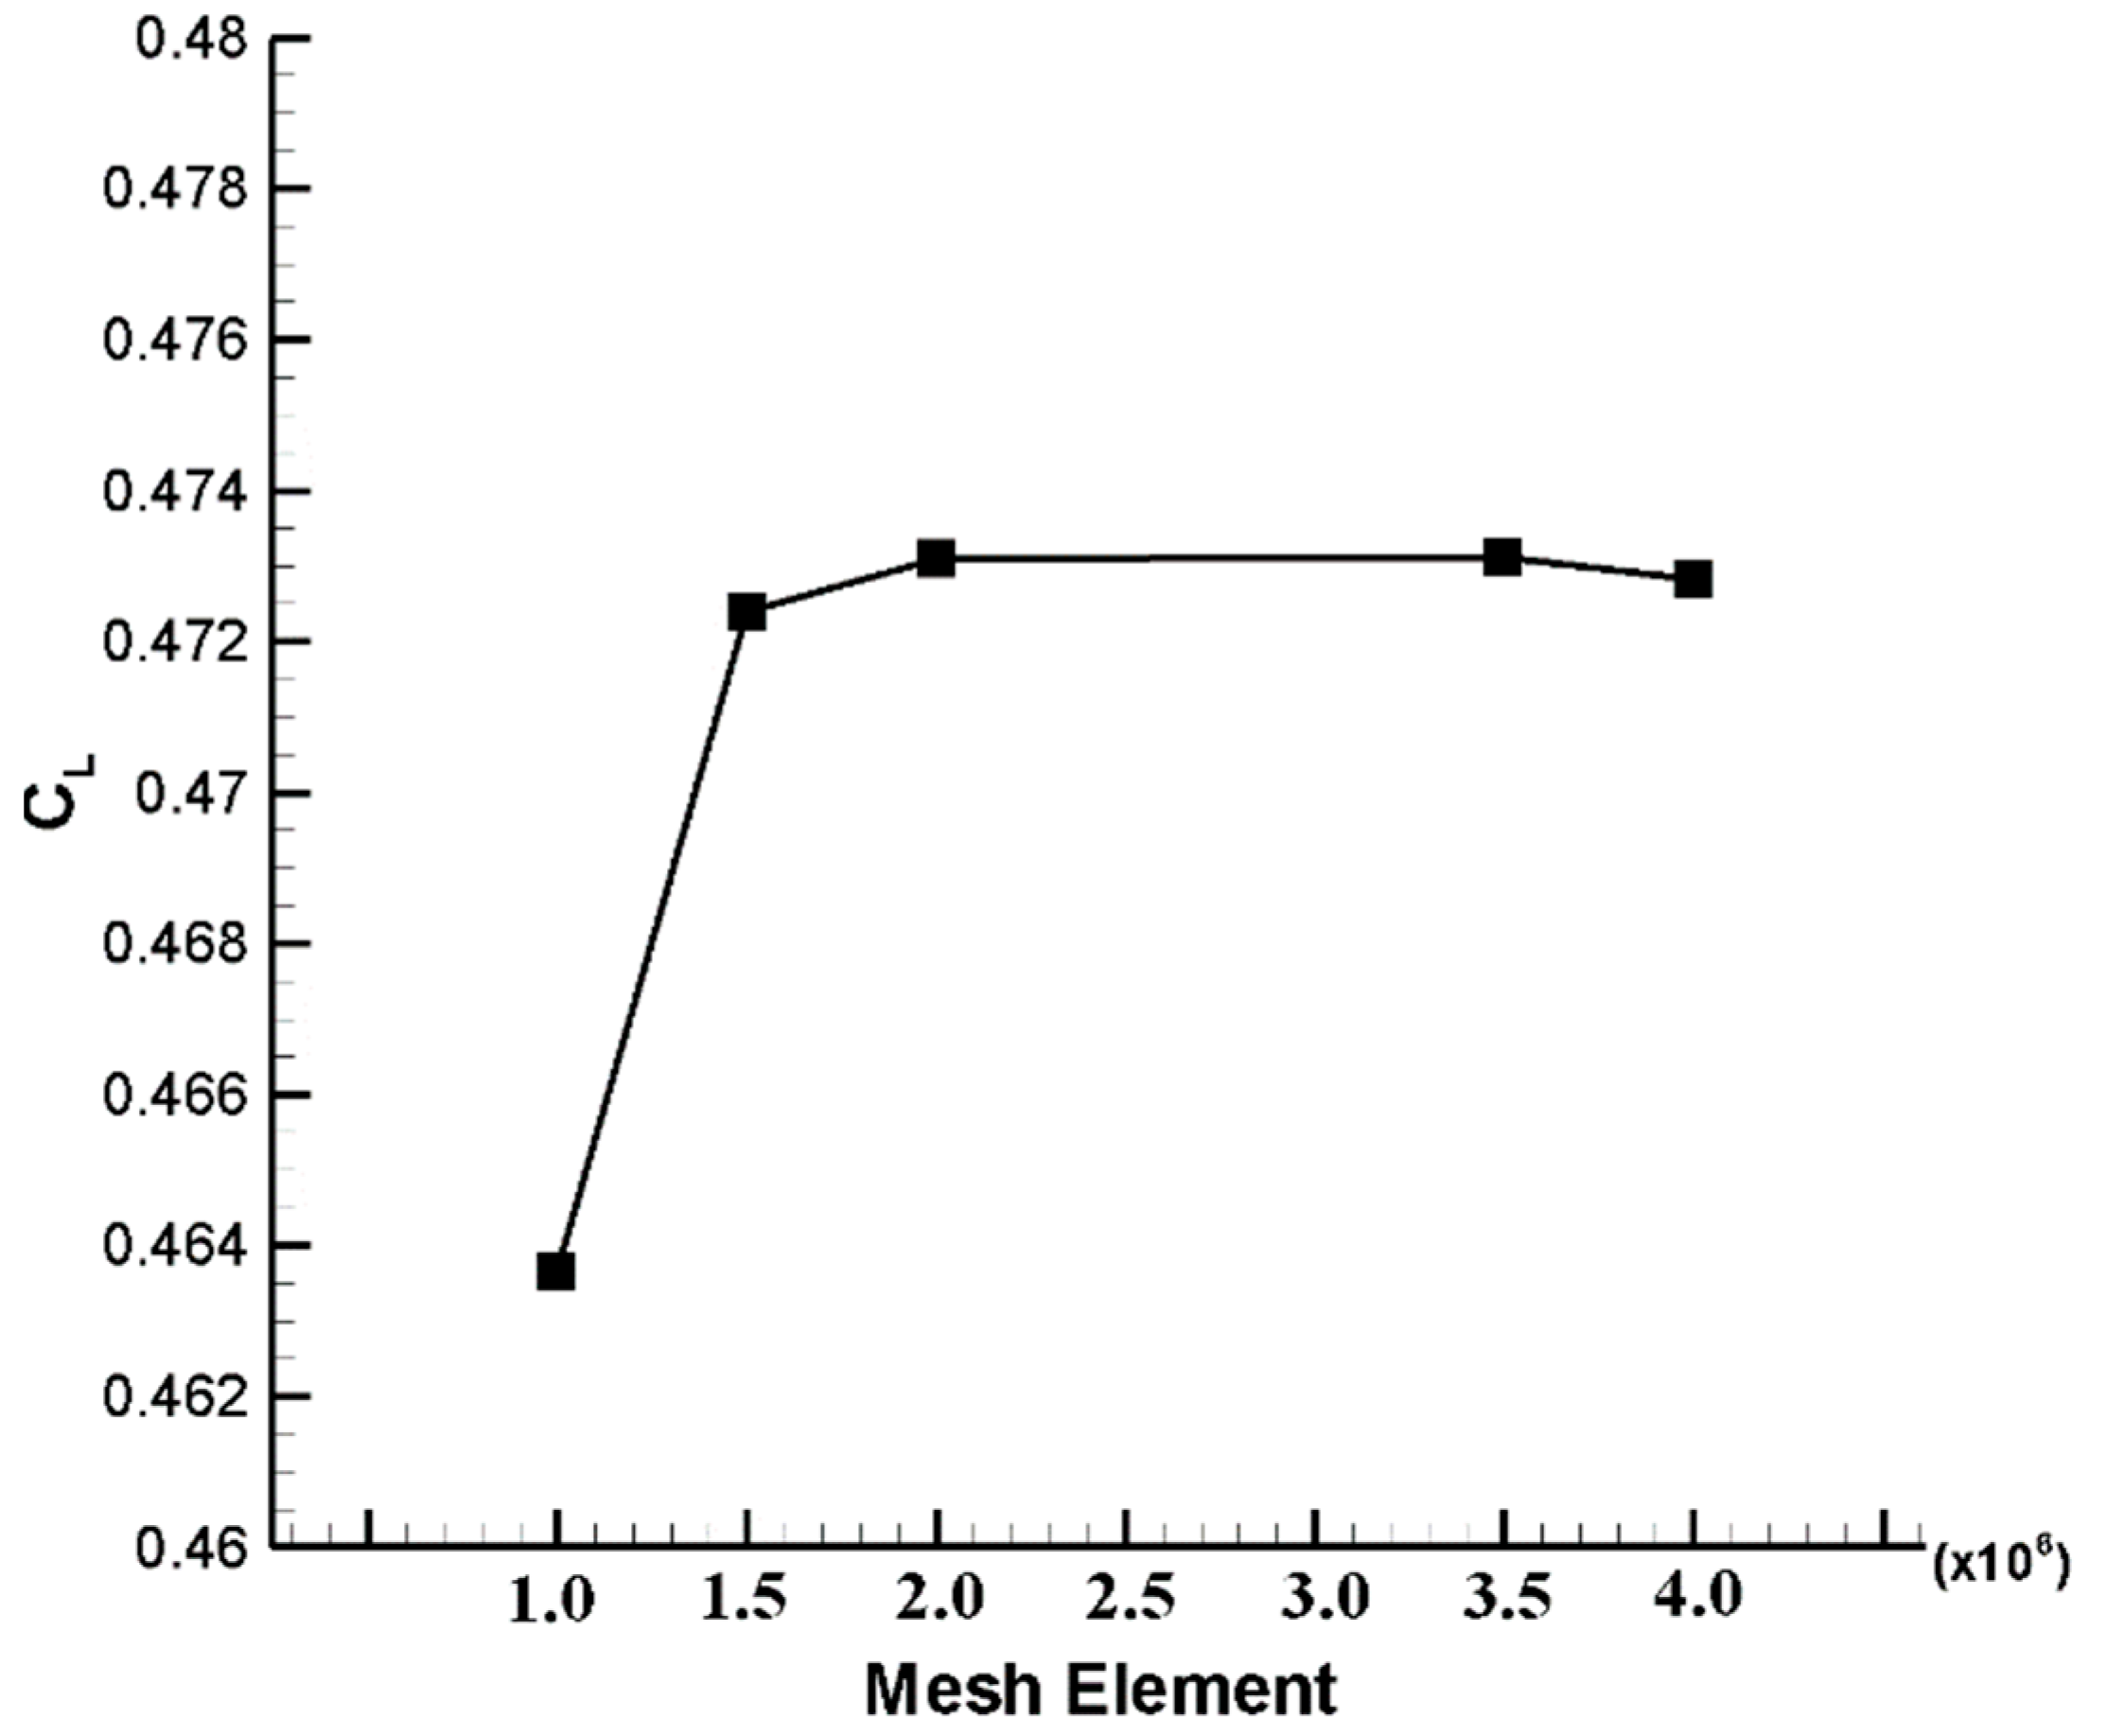
Apart from the experimental investigation, a numerical simulation was performed to determine the convenient position of VGs over the surfaces of the airfoil. RANS (Reynolds-Averaged Navier–Stokes) equations were solved using ANSYS-Fluent software to obtain the effects of VGs on the flow of the S809 airfoil. As seen in Figure 4, the domains of both the uncontrolled and the controlled S809 airfoil were formed by meshing. Regarding the mesh generation, two-dimensional (2D) cell types were used, resulting in a C-type structured quadrilateral mesh. To obtain a convenient and reliable number of nodes from mesh generation, the mesh independency study was fulfilled, as illustrated in Figure 5. It was then decided that the number of nodes of the mesh structures was about 1.5 × 10⁶. Furthermore, the value of y+ was about 1, allowing for the user to obtain more accurate results on the boundary layer of the airfoil. Regarding the residuals, the convergence criteria were preferred as 10−5. The SIMPLEC solution algorithm was chosen, and the second-order upwind method was performed to obtain spatial discretization.
Regarding the detailed information on the C-type mesh as performed in the previous study [51], it consisted of inlet, outlet and far-field domains. The velocity inlet was applied to the inlet domain, while the pressure outlet was recognized in the outlet domain. Similarly to the authors’ previous study [52], the airfoil was located 10c away from the far-field, and the velocity inlet was 20c away from the pressure outlet. The non-slip condition for the walls was assigned for the airfoil and VGs. For the 2D simulation, the transition k-kL- ω model was performed. The k-kL- ω model was a three-equation eddy-viscosity type, which includes transport equations for the turbulent kinetic energy ( k T ), laminar kinetic energy ( k L ), and the inverse turbulent time scale ( ω ). Moreover, the total fluctuation kinetic energy is the total of the turbulent kinetic energy ( k T ) and laminar kinetic energy ( k L ).

3. Results and Discussion

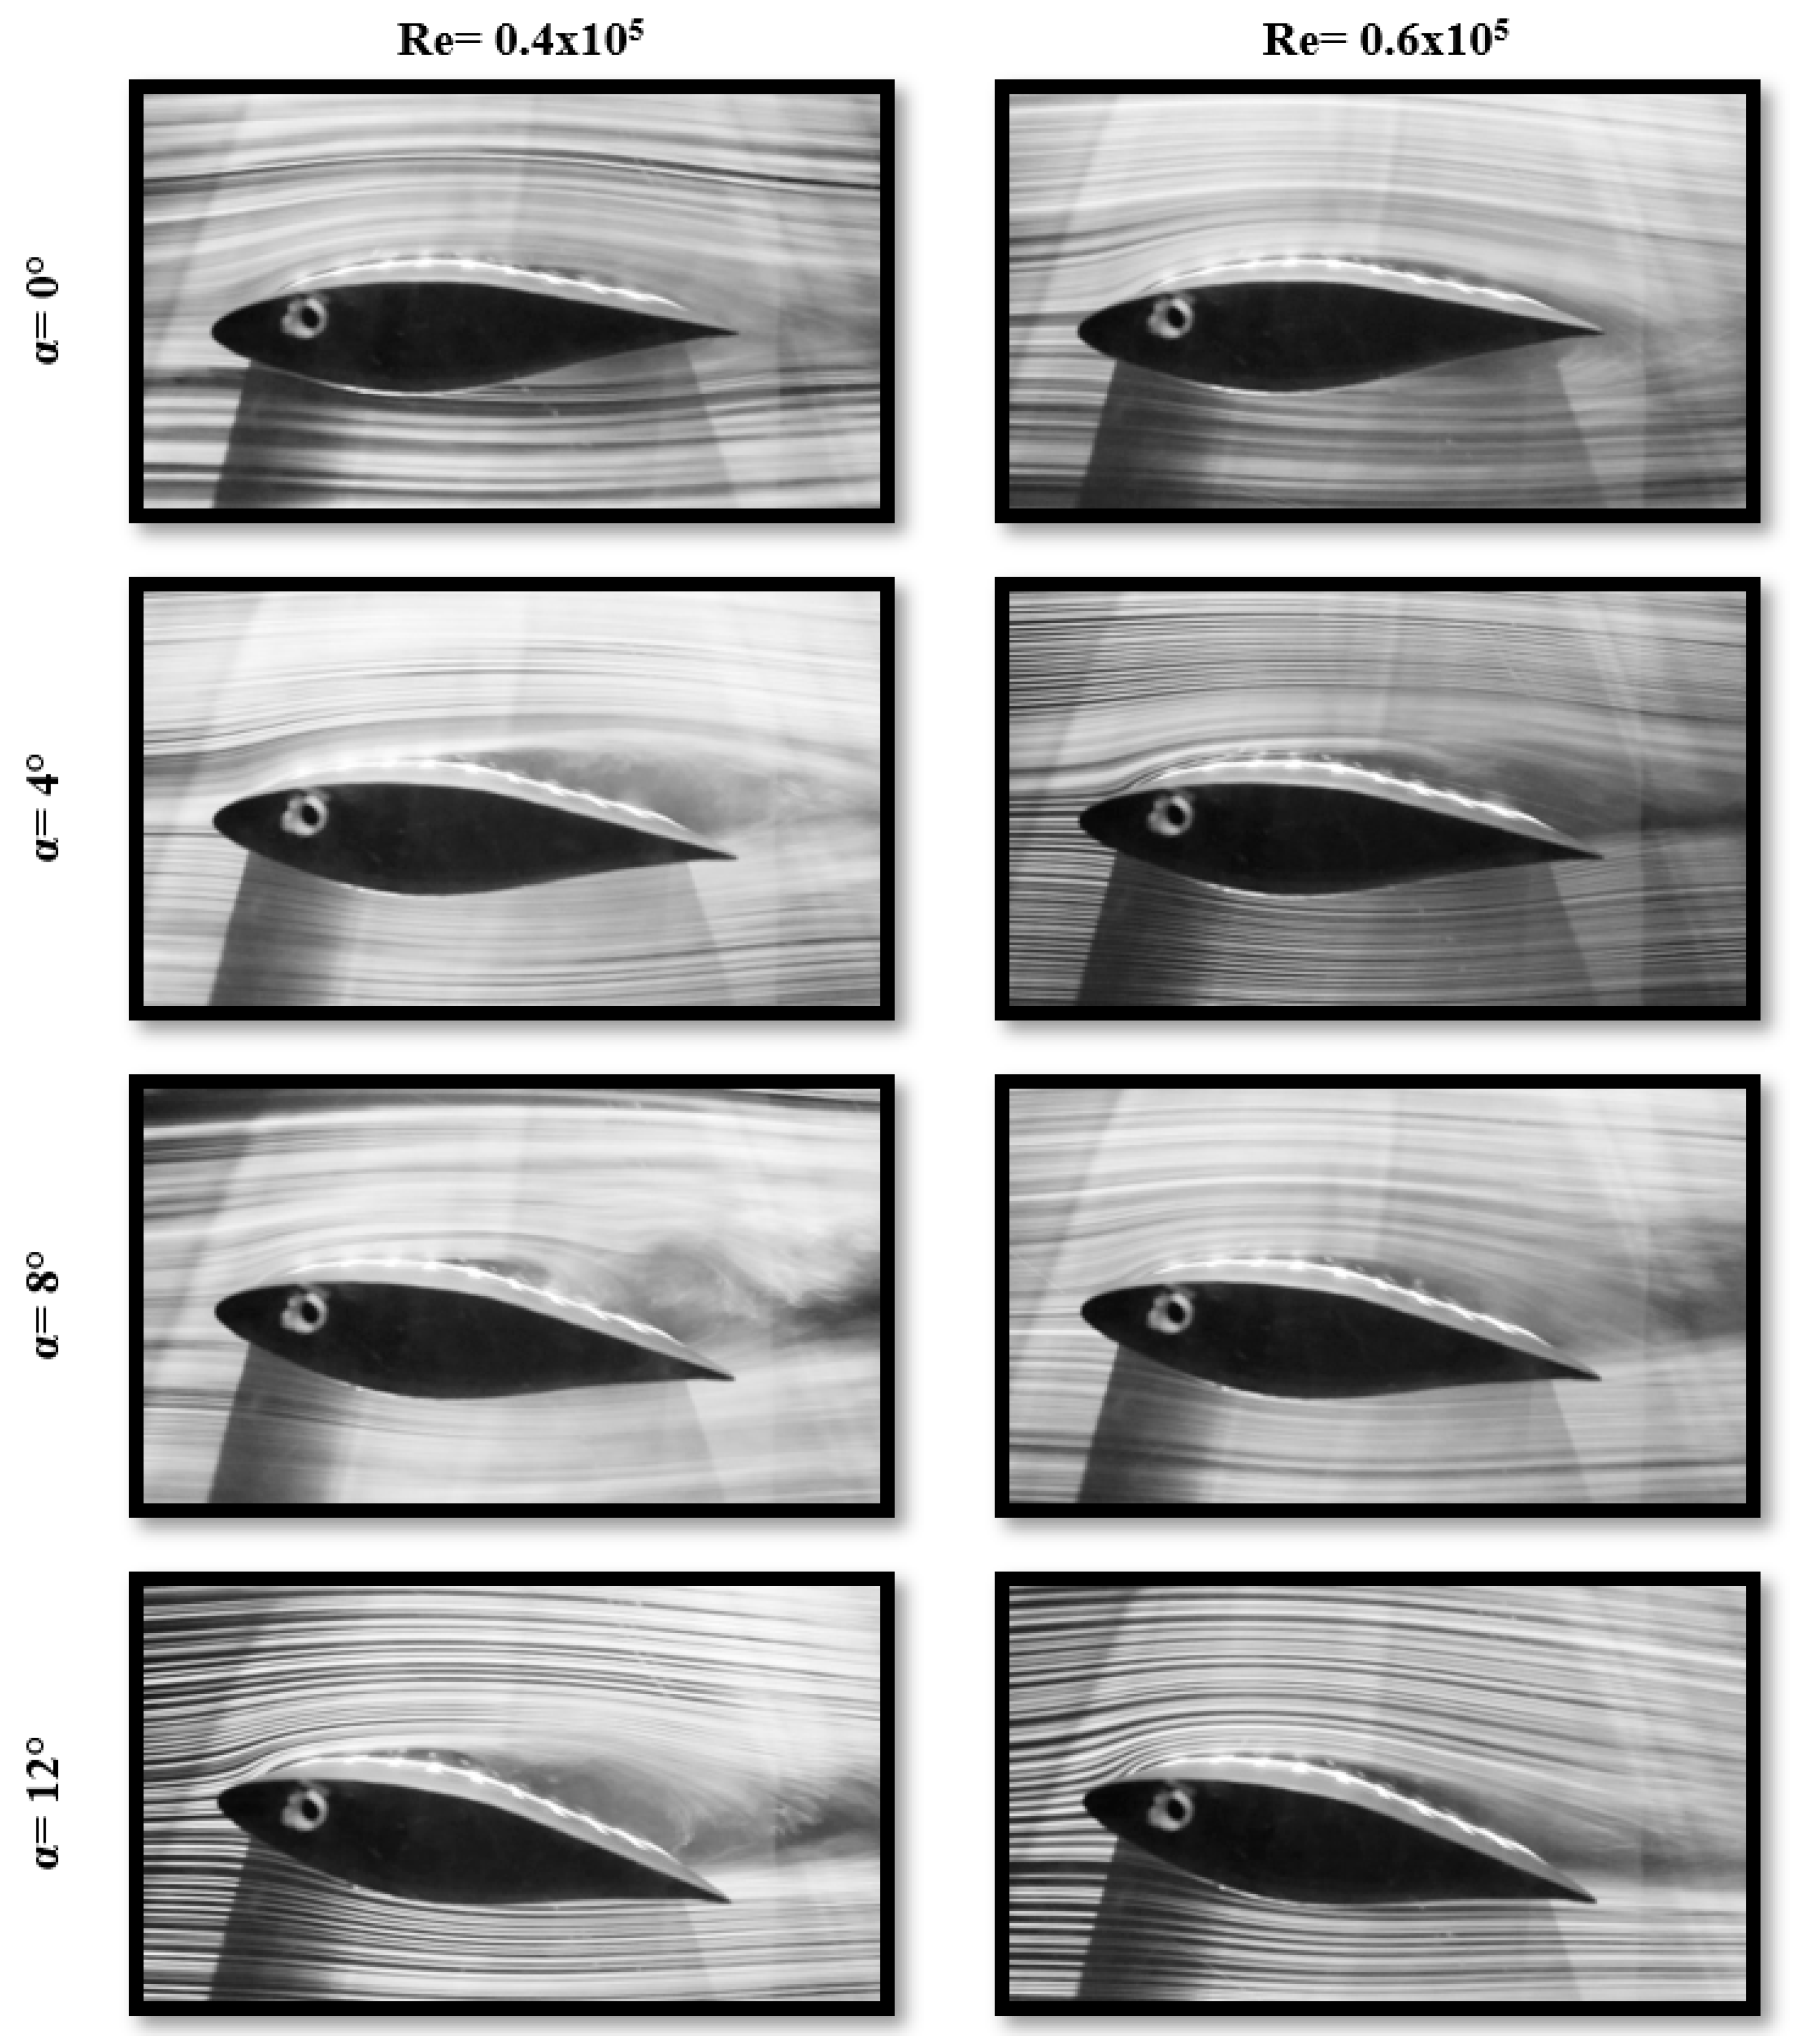
The instantaneous flow images formed over the suction surface of the uncontrolled S809 airfoil are shown in Figure 6 by capturing them from the smoke-wire test at Re = 0.4 × 10⁵ and 0.6 × 10⁵. As the smoke-wire experiment did not allow for quality images to be obtained at higher speeds, the tests could be performed at these Reynolds numbers. For Re = 0.4 × 10⁵, the LSB was seen at the trailing-edge part of the S809 airfoil at α = 0°, and as expected, it started to move towards the leading edge when the angle of attack increased with the intervals of 4°. After a while, the flow started to separate from the solid surface with the dominant adverse pressure gradients (APGs), causing the presence of the leading-edge flow separation with the LSB burst at α = 12°. As mentioned in the detailed study presented by the current authors [11], vortex shedding, which gave information with regard to the progress of the LSB, was also illustrated, especially at larger angles of attack. It played a crucial role in terms of both the observation of the LSB characterization and how it affected the wake region of the airfoil. The size of the LSB was relatively minimized when the Reynolds number increased to Re = 0.6 × 10⁵ as a result of the increasing inertial forces. This caused the APGs to overcome their effects, and there was no boundary layer separation, at least until α = 8°. However, at α = 12°, the flow separated nearly at x/c = 0.3, causing leading-edge separation.
In this part, the numerical results at α = 8° for three different Reynolds numbers were compared with the experimental results [53] in Table 4 for validation. The experimental results at α = 8°, which corresponded with our numerical results, were used for comparison. When all the results in Table 4 were examined, it was observed that our numerical results were close to the experimental results [53]. This shows that our numerical studies are reasonable and consistent. Thus, the VG studies were continued.
The aerodynamic forces as well as their ratios for α = 12° and Re = 0.4 × 10⁵ were acquired by means of numerical simulation for the controlled S809 airfoil configurations, as illustrated in Table 5. The objective of Table 5 is to determine the S809 airfoil using VG configurations that exhibited the best aerodynamic performance. In this regard, the S809 airfoil named VGs_Case 3 with a CL/CD value of 13.27 as a single VGs application, and the S809 airfoil named VGs_Case 7 with a CL/CD value of 11.01 as a double VGs application were selected as the best performance configurations and are examined in detail in the rest of the paper.
In the numerical analysis, the vortex generators (single and double) were able to control the flow at low Reynolds number flows and at high angles of attack (α > 10°). In Table 6, the numerical results of the aerodynamic force coefficient for the S809 airfoils without/with VGs are presented at α = 12° for different Reynolds numbers. As seen in the table, the increases in the lift forces were at low levels, and the drag force decreased due to the eddies. With the double vortex generator application, the lift increase was more significant at low Reynolds number flows, while the drag force also increased. This is due to the eddies that occur when a vortex generator is used on both surfaces, and as the lift is increased, the drag necessarily grows.
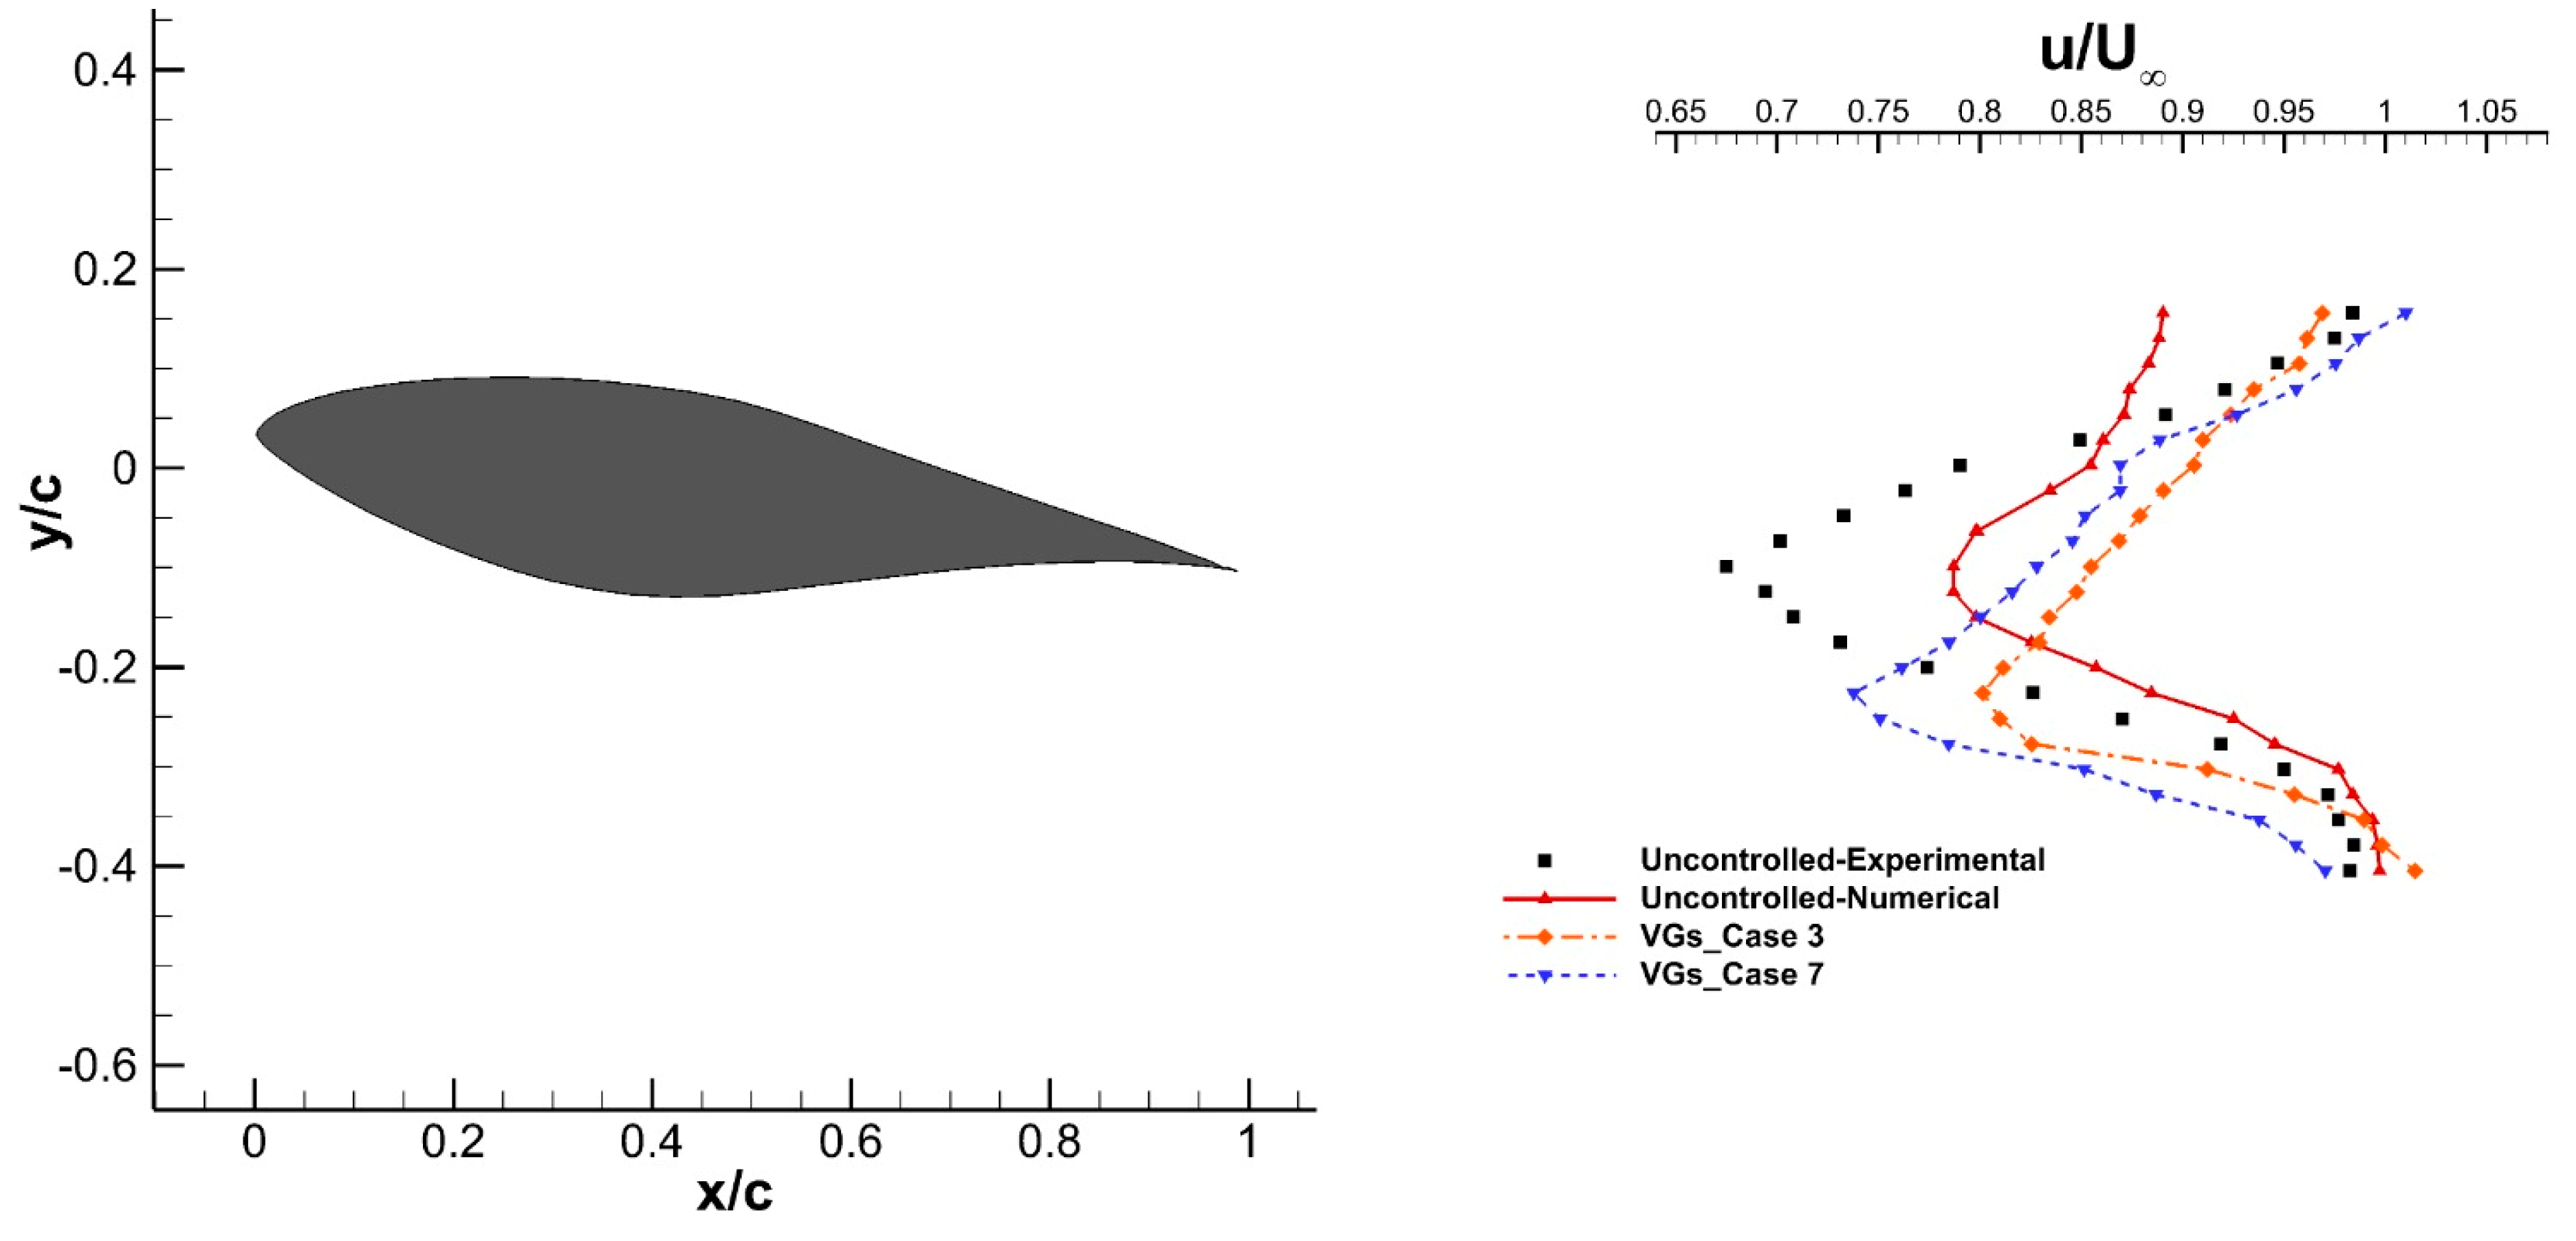
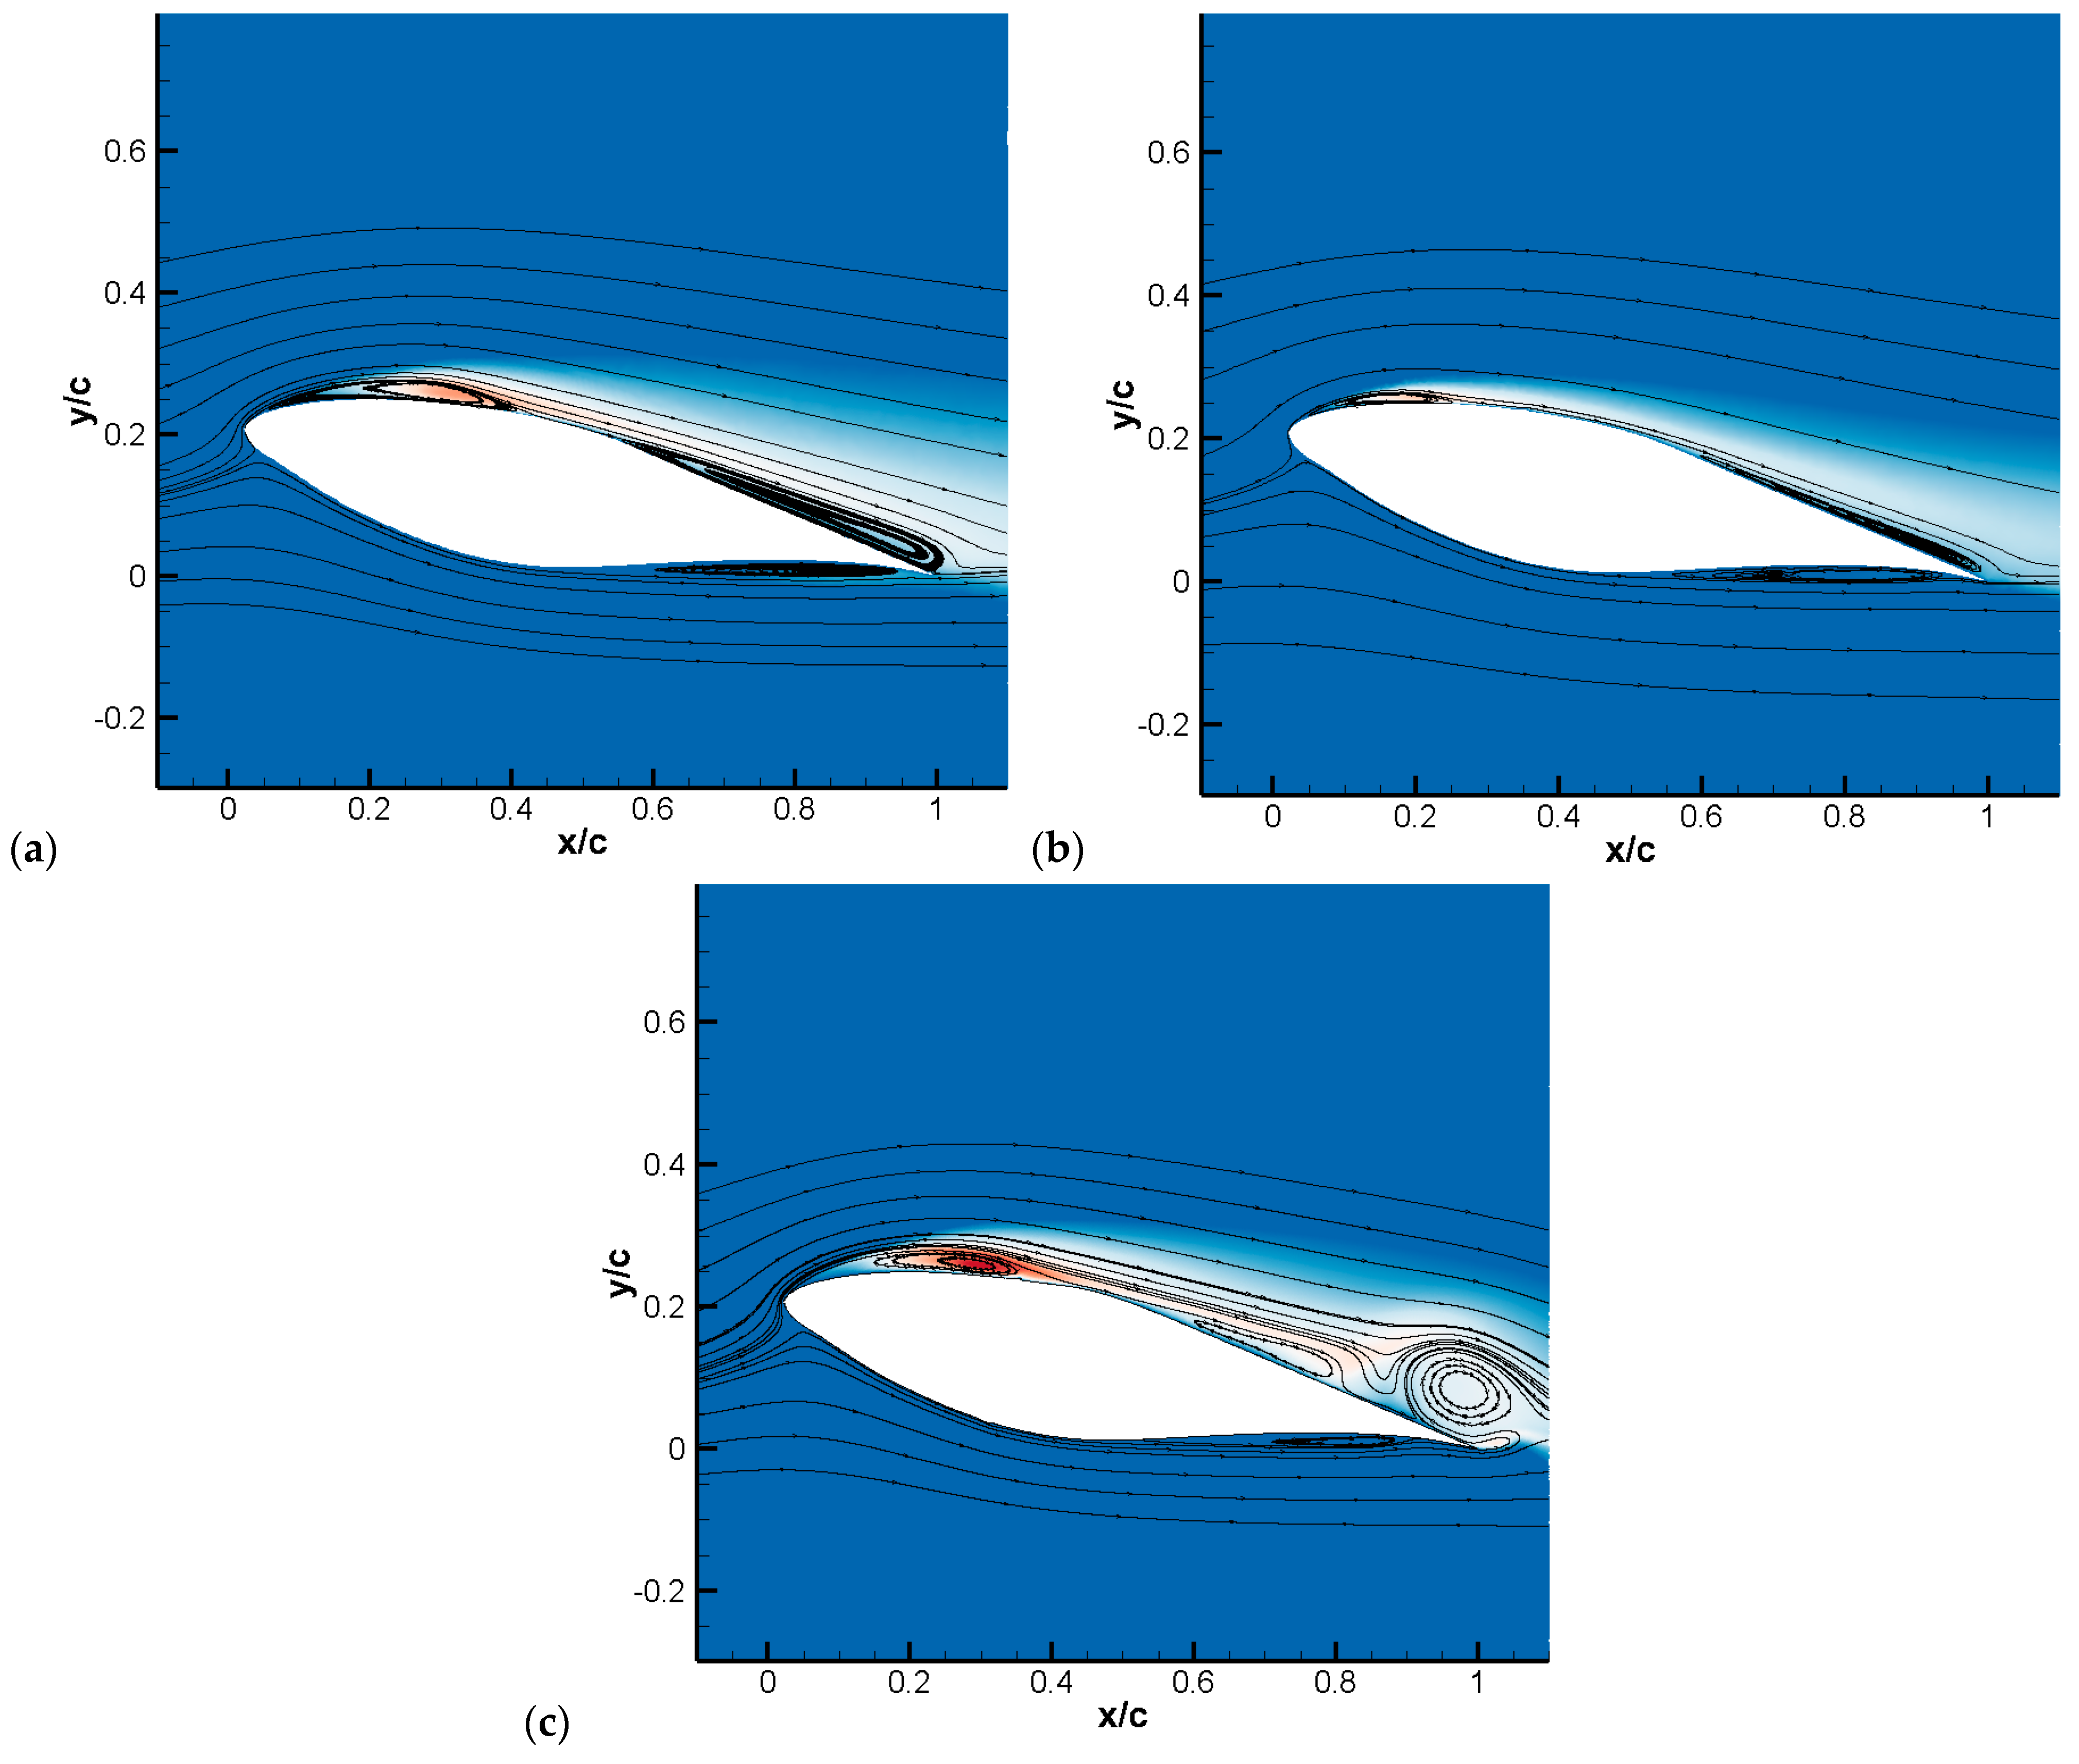
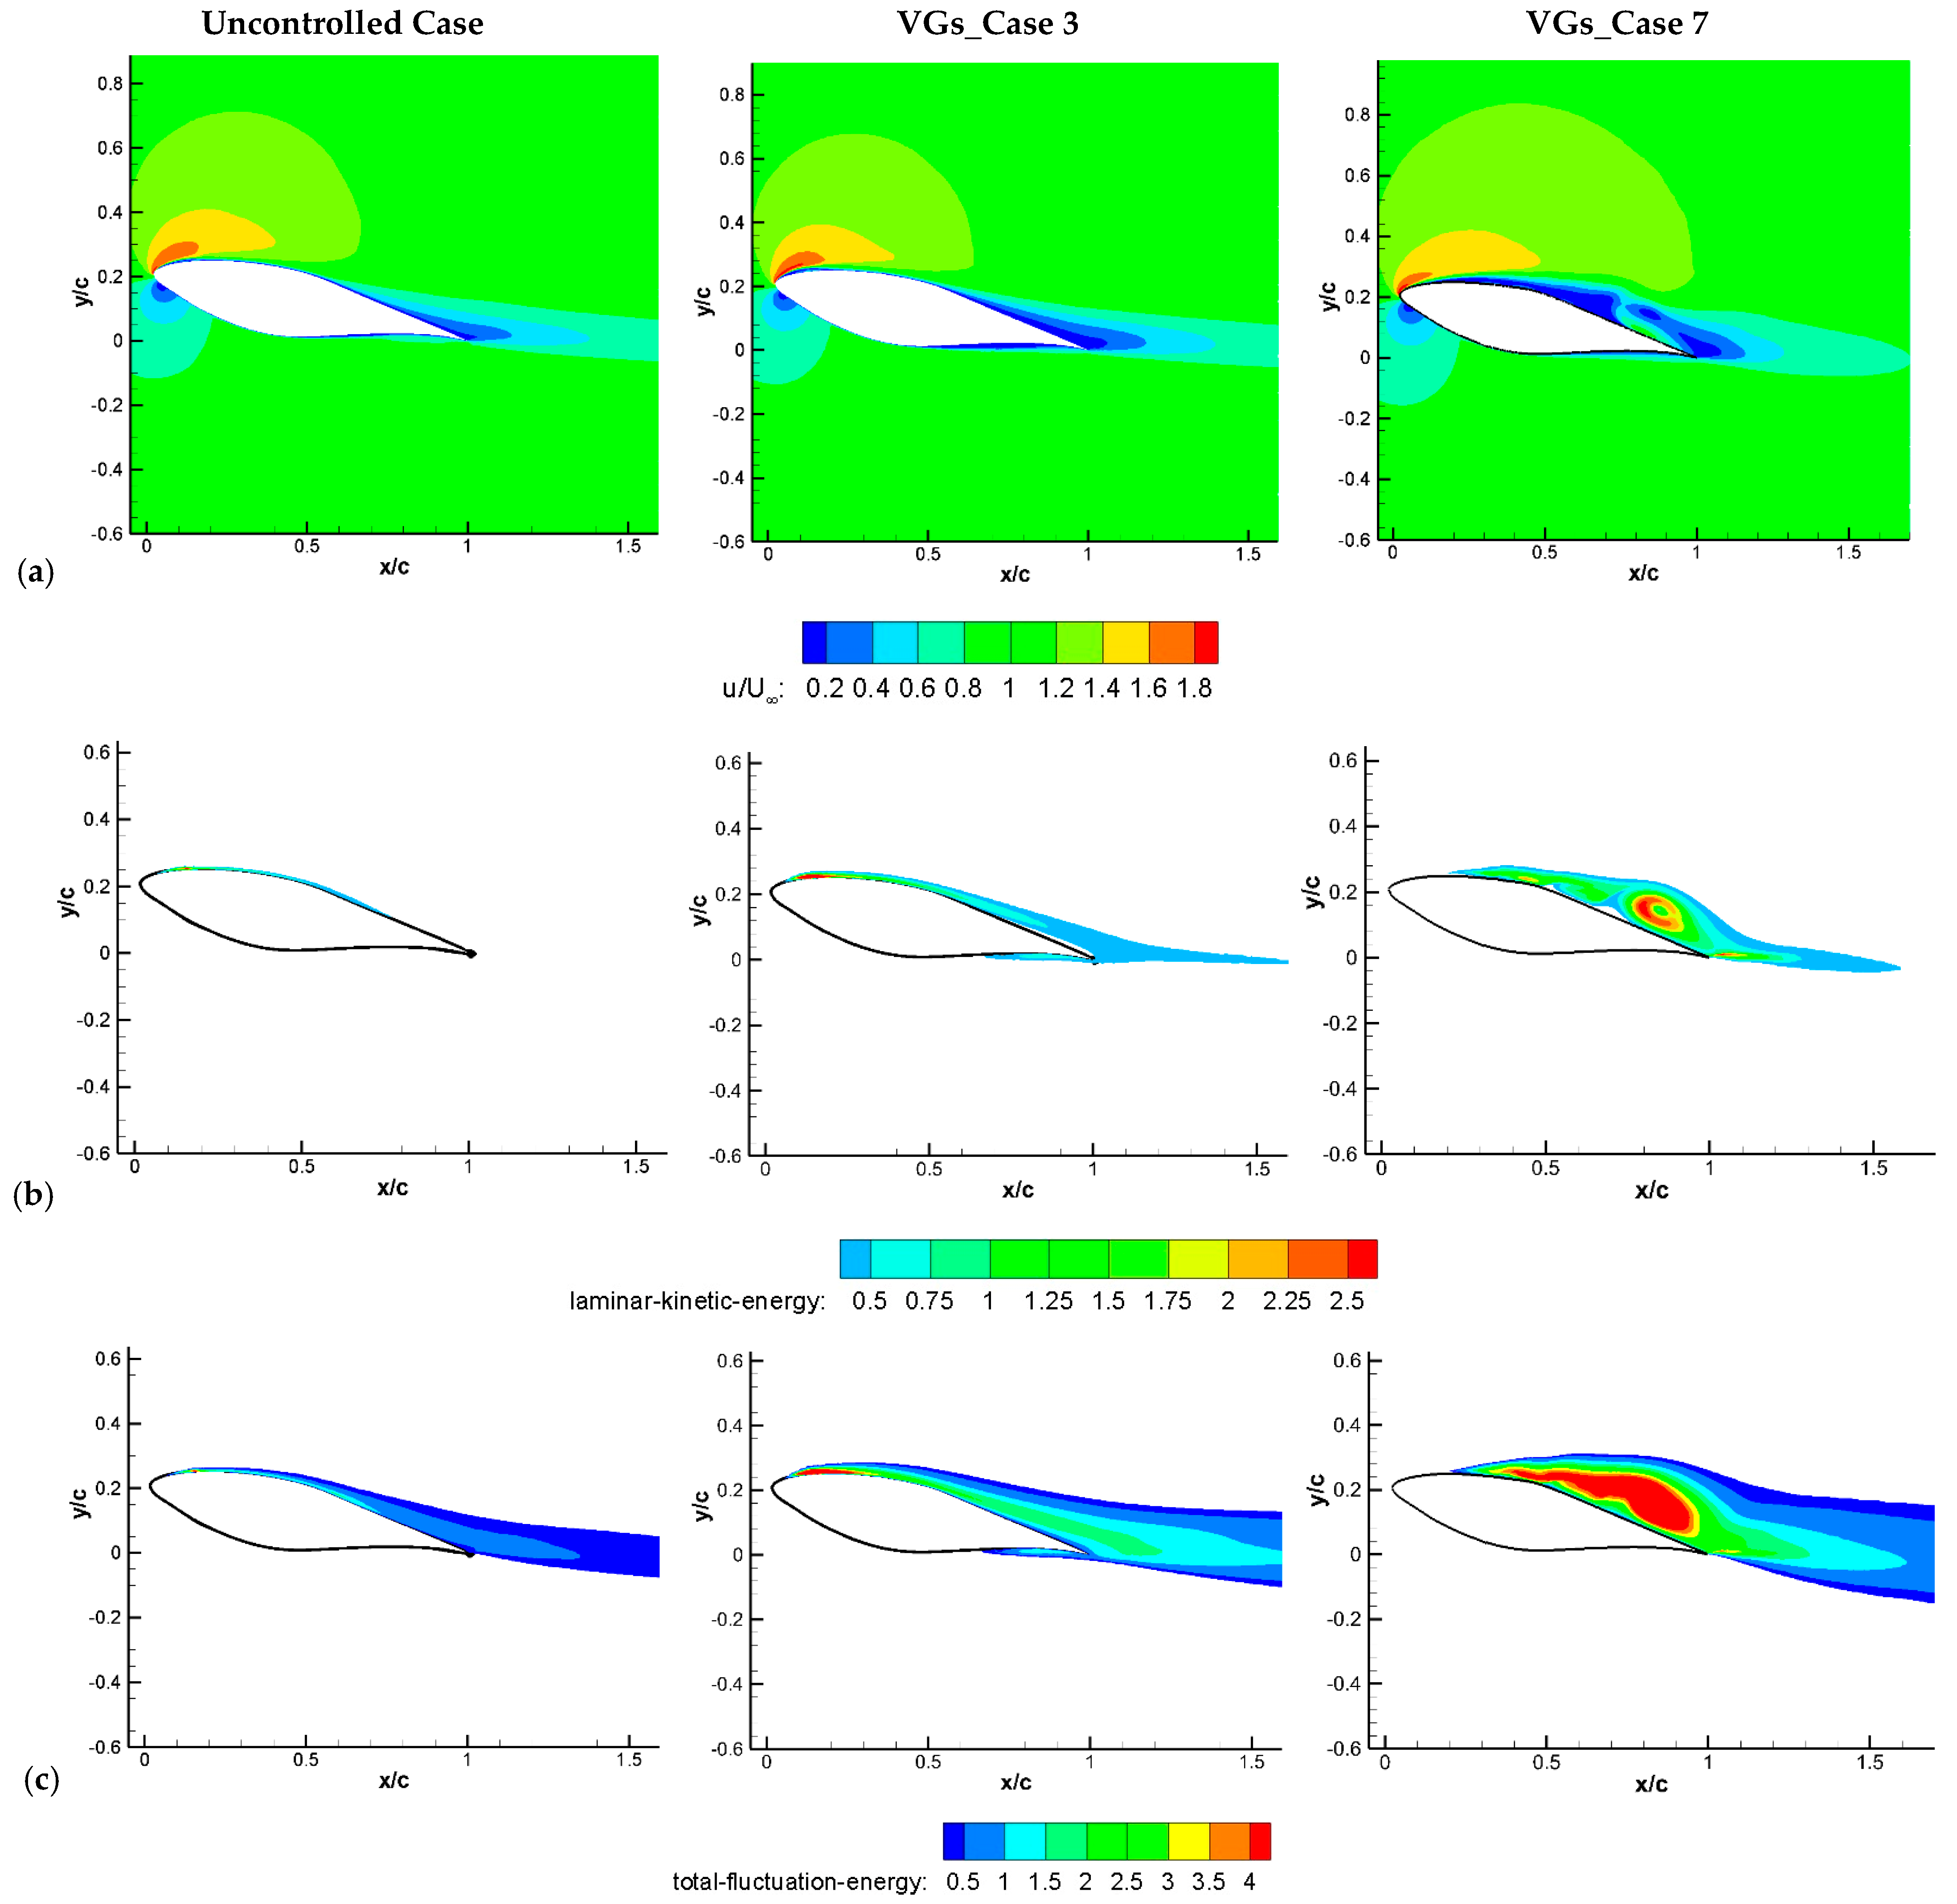
The vortex shedding forms because of the presence of LSB, or flow separation. After formation, those flow phenomena move along the chord as denoted in Figure 7. The LSB-induced vortex shedding moved downwind on the suction surface, while the trailing-edge-induced vortex shedding moved downwind on the pressure surface. As mentioned in the vortex-shedding-based studies, both the LSB and trailing-edge flow separation induce vortex shedding mixed in the wake region, leading the velocity profile to decrease in the wake region (Figure 8). It is clearly seen that the value of u/U obtained from the experiments for the uncontrolled case decreased from 1.00 to 0.65, meaning that the velocity value decreased by 0.35. In addition to the experimental result, the value of u/U obtained from the numerical simulation for the uncontrolled case decreased from 0.90 to 0.77. The curve trends of those two results exhibited good coherence with each other. In relation to the results of the controlled cases, the value of u/U obtained from the numerical simulation for the VGs_Case 3 decreased from 0.97 to 0.80, while it decreased from 1.00 to 0.74 for the VGs_Case 7. The velocity value decreased by 17% and 26% for VGs_Case 3 and VGs_Case 7, respectively. It was clearly seen that the deficit in the velocity values for the uncontrolled case was more than those that occurred in the controlled cases. Utilizing VGs as a flow control technique ensured that the deficit in the velocity value was minimized. Technically speaking, the size of the LSB or effectiveness of the flow separation was minimized by means of VGs, as seen in the single VG application in Figure 9b, resulting in the presence of smaller and weaker vortex shedding, just as mentioned in the studies by the current authors [11] and by Ducoin et al. [54]. In Figure 9a, for the uncontrolled case, the LSBs at the leading edge and the trailing edge were observed, and the single VG case shortened the LSBs over the suction side, but not the LSB on the pressure side. Otherwise, the double VG application shortened the LSBs on the pressure side due to the vortex generator on the lower surface, the vortex formation gained more momentum due to the short LSB, and this merged with the vortex over the suction side at the trailing edge of the airfoil. This caused larger eddies to form, which created a vacuum effect that caused more flow to be formed from the upper surface of the airfoil. Thus, the velocity increase region over the suction side of the airfoil rose, as seen in the velocity contours for VGs_Case 7 in Figure 10a, which meant there was an increase in the pressure difference, and hence, the lift coefficient. However, as seen in Figure 10b,c, increases in laminar kinetic energy and total kinetic energy occurred, which pointed out an increase in fluctuations in the flow. All of this caused an increase in the drag force.
In order to understand how VG application impacts the flow characteristics, the graphs belonging to the flow and turbulence statistics, including u/U, laminar kinetic energy and total fluctuation energy at α = 12° and Re = 0.4 × 10⁵ are shown in Figure 10. As seen in the graphs of u/U (Figure 10a), the boundary layer separation occurred at the trailing edge of the airfoil. Those separated flows at the trailing edge were much bigger because of small eddies that were produced by single VGs (VGs_Case 3). In VGs_Case 7, the vortex generator utilized at the pressure surface also generated small eddies, which caused the alteration at the wake region. This alteration caused the flow to be reattached near the trailing edge of the suction surface, resulting in an enhancement in the aerodynamic performance. In the graphs depicting the laminar kinetic energy, which were obtained from the solution of the transport equation by means of the k-kL- ω transition model (Figure 10b), it can be observed that the VGs induced small eddies that triggered the transition to turbulence, and they forced the flow to bypass the transition, as seen from the increases in the turbulence kinetic energy at x/c = 0.3 in Figure 9b,c. In VGs_Case 7, the kinetic energy at the trailing edge was increased via small eddies produced by the vortex generator at the pressure surface. This led the flow to gain more momentum as larger eddies formed at the trailing edge of the suction surface, resulting in the presence of flow reattachment. These situations were clearly supported by the graphs depicting the fluctuation energy distribution (in Figure 10c); the flow was energized by those vortex generators. Furthermore, it was clearly revealed that there were different pressure distributions at both the suction and pressure sides of the airfoil, as denoted in Figure 10a. In particular, the activity value of the velocity region for the uncontrolled case was less than those that occurred at VGs_Case 7. This shows that utilizing VGs with Case 7 led to the velocity increasing close to the leading edge of the airfoil. Based on Bernoulli’s principle, the pressure distribution was lower at the region where the velocity distribution was higher, resulting in more lift force.

4. Conclusions

The electricity demand has expanded even more over the years. Despite many challenges, the renewable energy sector is improving in many countries. This study presents a new method using double vortex generators to increase aerodynamic efficiency. The passive control method using VG application on the surfaces of the S809 airfoil is proposed in this study. The novelty of this paper is the utilization of both single and double VG application on more cambered airfoil, which is a rare study (even absent) in the literature. The effects of the positions of 2D VGs mounted on the pressure and suction surfaces were experimentally and numerically investigated at different Reynolds numbers and angles of attack after the design optimization of VG locations was performed. The novel findings from this study are the following:
-Concerning the appropriate position of VG applications, the numerical results point out that the best optimized position was ensured for both the single and double VG applications when it was employed at a 30% chord length of the S809 airfoil. The CL/CD was 13.27 at VGs_Case 3, while the CL/CD was 11.01 at VGs_Case 7.
-It was found that VGs_Case 3 exhibited better performance at Re = 0.6 × 10⁵ and lower angles of attack. However, the aerodynamic performance obtained from VGs_Case 7 was better than that obtained by VGs_Case 3 when the angle of attack was 12°. VGs_Case 7 led the aerodynamic performance to be enhanced by ~17%. This also shows that double VG application was more reliable at higher angles of attack.
-In VGs_Case 7, the kinetic energy at the trailing edge was increased via small eddies produced by the vortex generator at the pressure surface. This led the flow to gain more momentum with larger eddies formed at the trailing edge of the suction surface, resulting in the presence of flow reattachment.
-In the graphs depicting the laminar kinetic energy, it was observed that VG-induced small eddies triggered the transition to turbulence, and they forced the flow to bypass the transition. These situations were clearly supported by the graphs depicting the fluctuation energy distribution.

Author Contributions

Conceptualization, M.Ö. and M.S.G.; methodology, M.Ö. and M.S.G.; software, M.Ö. and M.S.G.; validation, M.Ö. and M.S.G.; formal analysis, M.Ö., M.S.G. and K.K.; investigation, M.Ö., M.S.G. and K.K.; resources, M.Ö., M.S.G. and K.K.; data curation, M.Ö., M.S.G. and K.K.; writing—original draft preparation, M.Ö., M.S.G. and K.K.; writing—review and editing, M.Ö., M.S.G. and K.K.; visualization, M.Ö. and K.K.; supervision, M.S.G.; project administration, M.S.G.; funding acquisition, M.Ö. All authors have read and agreed to the published version of the manuscript.

Funding

This research was supported by the Scientific and Technological Research Council of Turkey (2211/C).

Data Availability Statement

Not applicable.

Acknowledgments

Mustafa Özden thanks the Scientific and Technological Research Council of Turkey (TÜBİTAK) for the Doctoral Scholarship for Priority Areas 2211/C.

Conflicts of Interest

The authors declare no conflict of interest.

References

  1. Ung, S.K.; Chong, W.T.; Mat, S.; Ng, J.H.; Kok, Y.H.; Wong, K.H. Investigation into the aerodynamic performance of a vertical axis wind turbine with endplate design. Energies 2022, 15, 6925. [Google Scholar] [CrossRef]
  2. Çiftci, C.; Erdoğan, A.; Genç, M.S. Investigation of the Mechanical Behavior of a New Generation Wind Turbine Blade Technology. Energies 2023, 16, 1961. [Google Scholar] [CrossRef]
  3. Özden, M.; Genç, M.S.; Koca, K. Investigation of the effect of hidden vortex generator-flap integrated mechanism revealed in low velocities on wind turbine blade flow. Energy Convers. Manag. 2023, 287, 117107. [Google Scholar] [CrossRef]
  4. Das, T.K.; Samad, A. Influence of stall fences on the performance of Wells turbine. Energy 2020, 194, 116864. [Google Scholar] [CrossRef]
  5. Gerrie, C.; Islam, S.Z.; Gerrie, S.; Turner, N.; Asim, T. 3D CFD Modelling of Performance of a Vertical Axis Turbine. Energies 2023, 16, 1144. [Google Scholar] [CrossRef]
  6. Anup, K.C.; Whale, J.; Urmee, T. Urban wind conditions and small wind turbines in the built environment: A review. Renew. Energy 2019, 131, 268–283. [Google Scholar]
  7. Açıkel, H.H.; Genç, M.S. Flow control with perpendicular acoustic forcing on NACA 2415 aerofoil at low Reynolds numbers. Proc. Inst. Mech. Eng. Part G J. Aerosp. Eng. 2016, 230, 2447–2462. [Google Scholar] [CrossRef]
  8. Zhong, J.; Li, J.; Liu, H. Dynamic mode decomposition analysis of flow separation control on wind turbine airfoil using leading-edge rod. Energy 2023, 268, 126656. [Google Scholar] [CrossRef]
  9. Karasu, İ.; Genç, M.S.; Açıkel, H.; Akpolat, M.T. An experimental study on laminar separation bubble and transition over an aerofoil at low Reynolds number. In Proceedings of the 30th AIAA Applied Aerodynamics Conference, AIAA-3030, New Orleans, LA, USA, 25–28 June 2012. [Google Scholar]
  10. Genç, M.S.; Lock, G.; Kaynak, Ü. An experimental and computational study of low Re number transitional flows over an aerofoil with leading edge slat. In Proceedings of the 26th Congress of ICAS and 8th AIAA ATIO, AIAA-8877, Anchorage, AK, USA, 14–19 September 2008. [Google Scholar]
  11. Koca, K.; Genç, M.S.; Açıkel, H.H.; Çağdaş, M.; Bodur, T.M. Identification of flow phenomena over NACA 4412 wind turbine airfoil at low Reynolds numbers and role of laminar separation bubble on flow evolution. Energy 2018, 144, 750–764. [Google Scholar] [CrossRef]
  12. Koca, K.; Genç, M.S.; Özkan, R. Mapping of laminar separation bubble and bubble-induced vibrations over a turbine blade at low Reynolds numbers. Ocean. Eng. 2021, 239, 109867. [Google Scholar] [CrossRef]
  13. Koca, K.; Genç, M.S.; Veerasamy, D.; Özden, M. Experimental flow control investigation over suction surface of turbine blade with local surface passive oscillation. Ocean. Eng. 2022, 266, 113024. [Google Scholar] [CrossRef]
  14. Das, T.K.; Islam, N.; Samad, A.; Pasha, A.A. Passive flow control via tip grooving and stall fencing mechanisms of a marine energy harvesting turbine. Sci. Rep. 2023, 13, 2677. [Google Scholar] [CrossRef] [PubMed]
  15. Karasu, İ. Flow control over a diamond-shaped cylinder using slits. Exp. Therm. Fluid Sci. 2020, 112, 109992. [Google Scholar] [CrossRef]
  16. Qian, Y.; Zhang, Y.; Sun, Y.; Wang, T. Numerical investigations of the flow control effect on a thick wind turbine airfoil using deformable trailing edge flaps. Energy 2023, 265, 126327. [Google Scholar] [CrossRef]
  17. Genç, M.S.; Kaynak, Ü. Control of flow separation and transition point over an aerofoil at low Re number using simultaneous blowing and suction. In Proceedings of the 19th AIAA Computational Fluid Dynamics, AIAA-3672, San Antonio, TX, USA, 22–25 June 2009. [Google Scholar]
  18. Koca, K.; Genç, M.S.; Bayır, E.; Soğuksu, F.K. Experimental study of the wind turbine airfoil with the local flexibility at different locations for more energy output. Energy 2022, 239, 121887. [Google Scholar] [CrossRef]
  19. Dong, H.; Xia, T.; Chen, L.; Liu, S.; Cui, Y.D.; Khoo, B.C.; Zhao, A. Study on flow separation and transition of the airfoil in low Reynolds number. Phys. Fluids 2019, 31, 103601. [Google Scholar]
  20. Tumse, S.; Karasu, I.; Sahin, B. Experimental investigation of ground effect on the vortical flow structure of a 40° swept Delta Wing. J. Aerosp. Eng. 2022, 35, 04022055. [Google Scholar] [CrossRef]
  21. Özden, K.S.; Karasu, İ.; Genç, M.S. Experimental investigation of the ground effect on a wing without/with trailing edge flap. Fluid Dyn. Res. 2020, 52, 045504. [Google Scholar] [CrossRef]
  22. Demir, H.; Genç, M.S. An experimental investigation of laminar separation bubble formation on flexible membrane wing. Eur. J. Mech. B/Fluids 2017, 65, 326–338. [Google Scholar] [CrossRef]
  23. Genç, M.S.; Demir, H.; Özden, M.; Bodur, T.M. Experimental analysis of fluid-structure interaction in flexible wings at low Reynolds number flows. Aircr. Eng. Aerosp. Technol. 2021, 93, 1060–1075. [Google Scholar] [CrossRef]
  24. Genç, M.S.; Koca, K.; Açıkel, H.H. Investigation of pre-stall flow control on wind turbine blade airfoil using roughness element. Energy 2019, 176, 320–334. [Google Scholar] [CrossRef]
  25. Genç, M.S.; Koca, K.; Demir, H.; Açıkel, H.H. Traditional and New Types of Passive Flow Control Techniques to Pave the Way for High Maneuverability and Low Structural Weight for UAVs and MAVs. In Autonomous Vehicles; IntechOpen: London, UK, 2020. [Google Scholar]
  26. Arcondoulis, E.J.G.; Doolan, C.J.; Zander, A.C.; Brooks, L.A. A Review of Trailing Edge Noise Generated by Airfoils at Low to Moderate Reynolds Number. Acoust. Aust. 2010, 38, 129–133. [Google Scholar]
  27. Sheikhnejad, Y.; Nassab, S.A.G. Enhancement of Solar Chimney Performance by passive vortex generator. Renew. Energy 2021, 169, 437–450. [Google Scholar] [CrossRef]
  28. Zhu, C.; Wang, T.; Wu, J. Numerical investigation of passive vortex generators on a wind turbine airfoil undergoing pitch oscillations. Energies 2019, 12, 654. [Google Scholar] [CrossRef] [Green Version]
  29. Meana-Fernández, A.; Fernández Oro, J.M.; Argüelles Díaz, K.M.; Velarde-Suárez, S. Turbulence-model comparison for aerodynamic-performance prediction of a typical vertical-axis wind-turbine airfoil. Energies 2019, 12, 488. [Google Scholar] [CrossRef] [Green Version]
  30. Ye, X.; Hu, J.; Zheng, N.; Li, C. Numerical study on aerodynamic performance and noise of wind turbine airfoils with serrated gurney flap. Energy 2023, 262, 125574. [Google Scholar] [CrossRef]
  31. Taylor, H.D. The Elimination of Diffuser Separation by Vortex Generators; Technical Report No. R-4012-3; United Aircraft Corporation: Moscow, Russia, 1947. [Google Scholar]
  32. Gao, L.; Liu, Y.; Han, S.; Yan, J. Aerodynamic performance of a blunt trailing-edge airfoil affected by vortex generators and a trailing-edge wedge. In Proceedings of the 3rd Renewable Power Generation Conference (RPG 2014), Naples, Italy, 24–25 September 2014; pp. 1–6. [Google Scholar]
  33. Gao, L.; Zhang, H.; Liu, Y.; Han, S. Effects of vortex generators on a blunt trailing-edge airfoil for wind turbines. Renew. Energy 2015, 76, 303–311. [Google Scholar] [CrossRef]
  34. Prince, S.A.; Badalamenti, C.; Regas, C. The application of passive air jet vortex-generators to stall suppression on wind turbine blades. Wind. Energy 2017, 20, 109–123. [Google Scholar] [CrossRef]
  35. Seshagiri, A.; Cooper, E.; Traub, L.W. Effects of vortex generators on an airfoil at low Reynolds numbers. J. Aircr. 2009, 46, 116–122. [Google Scholar] [CrossRef]
  36. Baldacchino, D.; Ferreira, C.; Tavernier, D.D.; Timmer, W.A.; Van Bussel, G.J.W. Experimental parameter study for passive vortex generators on a 30% thick airfoil. Wind. Energy 2018, 21, 745–765. [Google Scholar] [CrossRef] [Green Version]
  37. Sutardi, S.; Nurcahya, A.E. Experimental study on the effect of vortex generator on the aerodynamic characteristics of Nasa ls-0417 airfoil. Appl. Mech. Mater. 2015, 758, 63–69. [Google Scholar] [CrossRef]
  38. Godard, G.; Stanislas, M. Control of a decelerating boundary layer. Part 1: Optimization of passive vortex generators. Aerosp. Sci. Technol. 2006, 10, 181–191. [Google Scholar] [CrossRef]
  39. Wang, H.; Zhang, B.; Qiu, Q.; Xu, X. Flow control on the NREL S809 wind turbine airfoil using vortex generators. Energy 2017, 118, 1210–1221. [Google Scholar] [CrossRef]
  40. Zhao, Z.; Zeng, G.; Wang, T.; Xu, B.; Zheng, Y. Numerical research on effect of transition on aerodynamic performance of wind turbine blade with vortex generators. J. Renew. Sustain. Energy 2016, 8, 063308. [Google Scholar] [CrossRef]
  41. Tian, Q.Q.; Corson, D.; Baker, J.P. Application of vortex generators to wind turbine blades. In Proceedings of the 34th Wind Energy Symposium, San Diego, CA, USA, 4–8 January 2016; p. 518. [Google Scholar]
  42. Manolesos, M.; Voutsinas, S.G. Experimental investigation of the flow past passive vortex generators on an airfoil experiencing three-dimensional separation. J. Wind. Eng. Ind. Aerodyn. 2015, 142, 130–148. [Google Scholar] [CrossRef] [Green Version]
  43. Forster, K.J.; White, T.R. Numerical investigation into vortex generators on heavily cambered wings. AIAA J. 2014, 52, 1059–1071. [Google Scholar] [CrossRef]
  44. Fouatih, O.M.; Medale, M.; Imine, O.; Imine, B. Design optimization of the aerodynamic passive flow control on NACA 4415 airfoil using vortex generators. Eur. J. Mech. -B/Fluids 2016, 56, 82–96. [Google Scholar] [CrossRef]
  45. Zhu, C.; Feng, Y.; Shen, X.; Dang, Z.; Chen, J.; Qiu, Y.; Feng, Y.; Wang, T. Effects of the height and chordwise installation of the vane-type vortex generators on the unsteady aerodynamics of a wind turbine airfoil undergoing dynamic stall. Energy. 2023, 266, 126418. [Google Scholar] [CrossRef]
  46. Zhu, C.; Qiu, Y.; Feng, Y.; Wang, T.; Li, H. Combined effect of passive vortex generators and leading-edge roughness on dynamic stall of the wind turbine airfoil. Energy Conv Manag. 2022, 251, 115015. [Google Scholar] [CrossRef]
  47. Genç, M.S.; Koca, K.; Açıkel, H.H.; Özkan, G.; Kırış, M.S.; Yıldız, R. Flow characteristics over NACA4412 airfoil at low Reynolds number. In EPJ Web Of Conferences; EDP Sciences: Les Ulis, France, 2016; Volume 114. [Google Scholar]
  48. Koca, K.; Genç, M.S.; Ertürk, S. Impact of local flexible membrane on power efficiency stability at wind turbine blade. Renew. Energy 2022, 197, 1163–1173. [Google Scholar] [CrossRef]
  49. Wang, P.; Liu, Q.; Li, C.; Miao, W.; Yue, M.; Xu, Z. Investigation of the aerodynamic characteristics of horizontal axis wind turbine using an active flow control method via boundary layer suction. Renew. Energy 2022, 198, 1032–1048. [Google Scholar] [CrossRef]
  50. Zhu, C.; Chen, J.; Wu, J.; Wang, T. Dynamic stall control of the wind turbine airfoil via single-row and double-row passive vortex generators. Energy. 2019, 189, 116272. [Google Scholar] [CrossRef]
  51. Chen, T.Y.; Liou, L.R. Blockage corrections in wind tunnel tests of small horizontal-axis wind turbines. Exp. Therm. Fluid Sci. 2011, 35, 565–569. [Google Scholar] [CrossRef]
  52. Karasu, İ.; Özden, M.; Genç, M.S. Performance assessment of transition models for three-dimensional flow over NACA4412 wings at low Reynolds numbers. J. Fluids Eng. 2018, 140, 121102. [Google Scholar] [CrossRef]
  53. Qu, H.; Hu, J.; Gao, X. The impact of Reynolds number on two-dimensional aerodynamic airfoil flow. In Proceedings of the 2009 World Non-Grid-Connected Wind Power and Energy Conference, Nanjing, China, 24–26 September 2009; pp. 1–4. [Google Scholar]
  54. Ducoin, A.; Loiseau, J.C.; Robinet, J.C. Numerical investigation of the interaction between laminar to turbulent transition and the wake of an airfoil. Eur. J. Mech. -B/Fluids 2016, 57, 231–248. [Google Scholar] [CrossRef] [Green Version]
Figure 1. Schematic of the VG setting.
Energies 16 05339 g001
Figure 2. The sketch of the smoke-wire experiment at the test chamber.
Energies 16 05339 g002
Figure 3. Scheme of the hotwire experiment.
Energies 16 05339 g003
Figure 4. The close view of the flow domain.
Energies 16 05339 g004
Figure 5. Mesh independency study at Re = 1.2 × 10⁵.
Energies 16 05339 g005
Figure 6. The instantaneous images of the uncontrolled S809 airfoil at different Reynolds numbers and angles of attack.
Energies 16 05339 g006
Figure 7. Visualization of LSB and trailing-edge vortex shedding: (a) current experimental result for the S809 airfoil at Reynolds number of 0.4 × 10⁵; (b) experimental result from study performed by the current authors [11] for the NACA4412 airfoil at Reynolds number of 0.25 × 10⁵; (c) numerical study performed by Ducoin et al. [54] for the SD7003 airfoil at Reynolds number of 0.2 × 10⁵.
Energies 16 05339 g007
Figure 8. Values of u/U at the wake of the uncontrolled and controlled S809 airfoil at α = 8° and Re = 0.6 × 10⁵.
Energies 16 05339 g008
Figure 9. Streamlines with turbulent kinetic energy contours at α = 12° and Re = 0.4 × 10⁵ for (a) uncontrolled, (b) VGs_Case 3, (c) VGs_Case 7 cases.
Energies 16 05339 g009
Figure 10. Graphs showing flow statistics at α = 12°, Re = 0.4 × 10⁵.
Energies 16 05339 g010
Table 1. The relevant studies in the literature with regard to VG applications.
Test SpecimenReynolds Number Range or Free-Stream VelocityStudy TypeExplanationCitation
DU-97-W-3003 × 106CFD simulationUsing VGs resulted in both an increment in the maximum lift and increase in the stall angle.[32,33]
NACA 23012C
NACA 632217
0.7 × 10⁶ < Rec < 1.1 × 10⁶
0.27 × 10⁶ < Rec < 1.3 × 10⁶
Wind tunnel researchFor both airfoils, an increase in CL, max and delay in drag rise was observed. Furthermore, suppression of trailing-edge flow separation was observed.[34]
LS(1)-0417GA(W)-10.8 × 10⁵ and 1.6 × 10⁵Wind tunnel researchAt higher Reynolds number, a rise in both the stall angle and maximum lift coefficient was observed.[35]
DU-97-W-3002 × 106Wind tunnel researchUsing VGs helped the stall to decrease. Furthermore, the load fluctuations were increased in the stall regime employing VGs.[36]
NASA LS-04170.83 × 105 and 1.18 × 10⁵Wind tunnel researchThe improvement in airfoil performance did not occur when implementing NASA LS-0417 at given Reynolds numbers. But at a larger Reynolds number, CL/CD increased by approximately 36%.[37]
Simpler (2D) geometryBetween 1 m/s and 10 m/sWind tunnel researchTwo different VG applications were investigated. The results show that VGs with counter-rotating types ensured better results compared to VGs with co-rotating configurations. [38]
NREL S809_11 × 106CFD simulationTheir results indicate that the installation of VGs at the 10% chord position caused the stall phenomenon to increase from 14° to 18°. In addition, the output power was extracted around 96.48% when the double VG configuration was utilized. [39]
DU91-W2-2502 × 106CFD simulationThe used computational models are compared with the experimental results presented in the literature. They exhibited great coherence between each other. Moreover, the vortex sheds coming from the VGs caused the stream flow to remain attached to the solid surface.[40]
NACA 4415
S814
1.5 × 10⁶CFD simulationTheir results conclude that the stall was postponed, and the maximum lift increased. [41]
NTUA-T180.87 × 106Wind tunnel researchThe stall cell was postponed for α = 5°, and the lift rose to α = 15°[42]
RAF-191.93 × 10⁵CFD simulationThe positive effects of VGs exhibited a more dominant and crucial role in more cambered airfoils than less cambered airfoils. [43]
NACA 44152 × 105Wind tunnel researchIn terms of controlling the boundary layer separation, the triangular VG type was best suited. Also, using the coupled VGs ensured the maximum lift coefficient increase by 21%, while the flow separation was postponed by 17°. [44]
NREL S809_21 × 106CFD simulationThe vortex generators located at different x/c on the airfoil suction surface were investigated numerically. In addition to the location, a detailed study was conducted on the height of the vortex generator.[45,46]
Table 2. Technical features of the wind tunnel [48].
DesignSuction Type and Low Speed
Length of tunnel13 m
Test section Length (4 m), Height (0.5 m), Width (0.5 m)
MotorType: DC motor; Power: 15 kW; Frequency: 50 Hz
ModelH4, 1000/15A
Capacity45,000 m3/h, 450 PA
Flow velocity3 m/s < U < 40 m/s
Turbulence level0.3% < Tu < ~0.9%
NozzleContraction cone: 9:1
Table 3. The configuration of VGs.
ConfigurationsPositions of VGsSketches
Case 1Suction surface
x/c = 0.1
Energies 16 05339 i001
Pressure surface
Not applied
Case 2Suction surface
x/c = 0.2
Energies 16 05339 i002
Pressure surface
Not applied
Case 3Suction surface
x/c = 0.3
Energies 16 05339 i003
Pressure surface
Not applied
Case 4Suction surface
x/c = 0.4
Energies 16 05339 i004
Pressure surface
Not applied
Case 5Suction surface
x/c = 0.5
Energies 16 05339 i005
Pressure surface
Not applied
Case 6Suction surface
x/c = 0.3
Energies 16 05339 i006
Pressure surface
x/c = 0.2
Case 7Suction surface
x/c = 0.3
Energies 16 05339 i007
Pressure surface
x/c = 0.3
Case 8Suction surface
x/c = 0.3
Energies 16 05339 i008
Pressure surface
x/c = 0.4
Table 4. The validation of the results of lift force coefficient for S809 airfoil at different Reynolds numbers for α = 8°.
CL at α = 8°Re = 0.4 × 10⁵Re = 0.8 × 10⁵Re = 1.2 × 10⁵
Uncontrolled Experimental [53]0.510.850.90
Uncontrolled Numerical 0.550.820.90
Table 5. The aerodynamic force coefficients for S809 airfoil cases with different configurations of VGs at α = 12° and Re = 0.4 × 10⁵.
Case No.CLCDCL/CD
VGs_Case 10.72030.15904.53
VGs_Case 21.04000.078713.21
VGs_Case 30.98000.073813.27
VGs_Case 40.72300.15604.63
VGs_Case 50.73100.15404.75
VGs_Case 60.92850.17615.27
VGs_Case 71.16880.105811.01
VGs_Case 81.02850.14896.90
Uncontrolled0.96380.086811.10
Table 6. The numerical results of aerodynamic force coefficients for S809 airfoils at α = 12°.
α = 12° UncontrolledVGs_Case_3VGs_Case_7
Reynolds NumberCLCDCLCDCLCD
Re = 0.4 × 1050.96380.08680.98000.07381.16880.1058
Re = 0.6 × 1051.15770.07811.04350.07011.38350.1689
Re = 0.8 × 1051.01200.07521.02250.07141.14500.0741
Re = 1.2 × 1051.12050.06851.10290.06821.19640.0681
Disclaimer/Publisher’s Note: The statements, opinions and data contained in all publications are solely those of the individual author(s) and contributor(s) and not of MDPI and/or the editor(s). MDPI and/or the editor(s) disclaim responsibility for any injury to people or property resulting from any ideas, methods, instructions or products referred to in the content.