1. Introduction
Decarbonizing the entire energy system is one of the critical objectives of the European
Fit for 55 Package [
1]. Although the rapid expansion of renewable energies can decarbonize the electricity supply, it is far more difficult to achieve in other sectors [
2]. For example, the heavy transport, aviation, shipping, steel and chemical industries are difficult to electrify [
3]. The use of hydrogen is one promising option to overcome the significant challenge of those industries that are lagging behind [
4].
Hydrogen has numerous potential applications in manufacturing, transportation, and energy generation via indirect electrification [
5]. However, current European hydrogen production results in considerable CO
2 emissions. Decarbonized hydrogen production by electrolysis can eliminate this disadvantage. During the use of hydrogen, no additional CO
2 emissions occur. Hence, the European hydrogen strategy set a target of a 40 GW electrolyzer capacity by 2030 [
6,
7]. Several countries published national hydrogen strategies, setting individual goals by 2030 to meet the European expansion targets on a national level. These electrolyzers should use electricity to generate decarbonized renewable hydrogen. The generation of the used electricity must not emit any CO
2 emissions. They must separate hydrogen and oxygen from deionized water. Hydrogen can be stored and used when needed. This can be carried out seasonally through relatively inexpensive storage options. Finally, fuel cells can convert hydrogen into electricity. This combination can help provide electricity when Renewable energy sources for electricity (RES-E) are in short supply [
8].
The incorporation of hydrogen provides three types of flexibility. The first is the already described end-use flexibility. This includes using hydrogen to decarbonize industry, transportation, and energy without relying on direct electrification. Second, hydrogen can be stored in order to change the timing of hydrogen production. Hence, the production can be decoupled from the actual demand because immediate coverage is not necessary. These storage units allow for the optimization of hydrogen production based on available electricity or the actual current electricity price. This gives the electricity market time flexibility. Third, spatial flexibility potential is provided. Hydrogen can be used to transport renewable energy to areas where the transmission grid is insufficient and causing congestion. However, the required pipeline infrastructure is expensive, thus increasing end-user hydrogen prices [
9].
These types of flexibility can support the integration of RES-E in the electricity market because a sector coupling between the electricity and the hydrogen market would be carried out implicitly. On the one hand, electricity is used to produce hydrogen; on the other hand, hydrogen is used to produce electricity to meet peak demand [
10]. This flexibility is critical in electricity markets with a disproportionately high share of RES-E [
11].
The core objective of this study is to model the interaction of the electricity and hydrogen markets. The economic effects of this sector coupling on short-term and seasonal storage are evaluated. Hence, the following research questions will be addressed.
- (i)
How does sector coupling influence the Consumer surplus (CS)?
- (ii)
Does the Producer surplus (PS) for different generation and storage units increase or decrease?
- (iii)
How do electricity and hydrogen prices affect the PS of hydrogen market participants?
- (iv)
How do electricity and hydrogen prices affect Economic welfare (EW) shifts both between consumers and producers and between the electricity and hydrogen market?
- (v)
What types of hydrogen are produced without external policies, and how does this affect the overall electricity mix?
This paper is organized as follows.
Section 2 examines the state of the art.
Section 3 discusses the methodology used to link the electricity and hydrogen markets.
Section 4 describes the optimization model.
Section 5 presents the results, including the datasets used for various scenarios.
Section 6 discusses the methodology and results. Finally,
Section 7 concludes the paper.
2. State of the Art
This paper examines sector coupling between the electricity and hydrogen markets. The European electricity market model
EDisOn uses electrolyzers and fuel cells as coupling technologies [
12].
2.1. Sector Coupling in Electricity Market Models
The integration and interaction of two or more energy systems is referred to as sector coupling. This method is defined as one strategy for achieving climate neutrality [
13] through increased generation, demand, and storage flexibility [
14]. The electricity market is shifting from a system in which inflexible demand is met by flexible generation to one in which flexible demand is met by inflexible generation [
15]. To provide demand flexibility, several sectors can be linked with the electricity market. Electric vehicles [
16] or fuel cell electric vehicles [
17] are being used in the transportation sector. On a larger scale, heating is provided by decentralized heat pumps in the home and district heating grids [
18,
19]. The hydrogen sector is being developed by combining hydrogen production with the flexibility provided by industry, heating, and transportation [
20].
This paper focuses on the sector coupling of the electricity and hydrogen markets, which includes components of the transportation, heating, and industrial sectors [
5]. Because of hydrogen’s increased flexibility, there is less demand for peak-load power plants and more hydrogen consumption. Furthermore, there is a strong link between the use of battery storage and the use of hydrogen to meet peak demand [
5]. Moreover, synergetic effects between hydrogen, Pumped hydro-power storage units (PHS), and battery storage units occur on a European scale [
21]. The use of hydrogen as a form of flexibility can increase the market value of not only storage units but also wind and Photovoltaic (PV) systems. The market values of these generation types will stabilize even in 2050 [
22]. From an economic standpoint, this makes further investments feasible. High RES-E shares will lower electricity prices and prevent further investment decisions without additional demand or flexibility. Green hydrogen, in particular, boosts RES-E PS [
23].
Sector coupling between the electricity, hydrogen and methane markets will significantly impact demand and the resulting electricity prices on a national scale [
24,
25]. It will not only increase electricity demand but also provide flexibility. This is especially important in electricity markets with a disproportionately high share of RES-E. Flexibility aids in balancing generation and demand [
11]. Frischmuth and Philip [
5] investigated the impact of this flexibility on hydrogen investment decisions. While they focused on investments in hydrogen technology, this study examines the EW effects if national hydrogen plans are met. Furthermore, a more comprehensive view of the interaction of various technologies is taken. The participants’ interactions in the hydrogen market of storage units, thermal power plants, electrolyzers, fuel cells, and RES-E are assessed. Furthermore, the impact on consumers is taken into account.
Seasonal storage units and sector coupling are critical for decarbonized electricity systems [
26]. They are required to compensate for seasonal variations in generation and demand. While PHS with large storage capacities are ideal for seasonal storage, specific geographic conditions must be met. This limits their potential for growth [
27]. In general, battery storage units with high round-trip efficiency but high capacity investment cost cannot be used for seasonal storage. Hydrogen storage systems with lower round-trip efficiency but lower investment costs are a possibility [
28], particularly in an electricity market with a remarkably high share of RES-E [
29]. Using hydrogen as seasonal storage in this future electricity market can abate the final 5–10% of CO
2 emissions in a zero-emission energy system [
30]. Hence, the potential for using hydrogen as seasonal storage is assessed in this work.
2.2. Hydrogen Integration Models
Aside from the perspective of energy system planning, many publications deal with specific hydrogen business models. Hydrogen as seasonal storage can be a sufficient business model for an energy provider if the local community aims to be self-sufficient [
26]. In this case, hydrogen can help to balance the seasonal variations in generation and demand. However, a sufficient grid capacity is required to maximize profits with larger storage capacities. The use of electrolyzers increases the grid capacity requirements and the reactive power demand [
31]. A comparison of different storage technologies reveals that hydrogen systems can be used for seasonal storage, while batteries are useful for household-sized storage [
28]. A more general investigation of CO
2 emissions and hydrogen as seasonal storage using an Mixed integer linear programming (MILP) was carried out by Petkov and Gabrielli [
30] in a zero-emission energy system. Budny et al. [
24] investigated the profitability of investments in hydrogen storage units such as pipes or salt caverns.
While these studies focused on hydrogen storage units, the economic potential of electrolyzers is critical. For example, in the Netherlands, a high demand for hydrogen combined with an electricity market with a remarkably high share of RES-E has reduced the volatility of electricity prices. A CO
2 price of at least 150 EUR/t is needed to operate economically [
10]. Aside from the CO
2 price, the electricity price significantly impacts investments in electrolyzers [
32]. An extremely low exogenous defined CO
2 emission target [
33] is another possibility for increasing the competitiveness of investments in green hydrogen systems. Furthermore, the competitiveness between steam–methane reforming and electrolyzers is crucial in an unregulated hydrogen market. The relationship between natural gas and hydrogen prices significantly impacts the type of hydrogen produced [
34].
Dadkhah et al. [
35] investigated a more complex business model of a hydrogen refuelling station that purchased RES-E from the electricity market to cover the hydrogen demand of the mobility sector in Belgium. The hydrogen systems were made up of an electrolyzer, compressors, and hydrogen storage units. The electrolyzers generated additional revenue by participating in ancillary service markets. The problem was formulated as MILP to account for the nonlinear effects of the electrolyzer and the grid. The 2020 and 2030 scenarios showed that participating in the reserve market lowers the break-even price of hydrogen. The additional revenue generated by electrolyzers that provide ancillary services has no negative impact on electrolyzer lifetime [
27]. However, from a system frequency control standpoint, it is not recommended to frequently switch the electrolyzers completely on and off in stand-alone systems. Hence, to provide an adequate response to grid frequency variation and to meet the required technical specifications, the electrolyzer is expected to operate continuously in a variable manner to avoid start-up and shut-down.
All electricity market participants are influenced by hydrogen production. Higher revenue can be obtained for wind and PV systems. This was calculated using a Monte Carlo simulation of the 2050 electricity market [
22]. Roach and Meeus [
36] addressed the issue of low, zero, or even negative electricity prices and spillage in an electricity market with a remarkably high share of RES-E. Their analysis employed a ten-period test system and an exogenously defined gas demand that can be compensated for by conventional gas or hydrogen. They also investigated the welfare effects in both sectors. They came to the conclusion that subsidizing electrolyzers can help reduce the costs of RES-E subsidies. Another approach was taken in Germany [
24] and the Netherlands [
25] to investigate overall EW benefits in 2050. These models included the electricity, hydrogen, and methane markets. Each sector was modeled with a unique demand profile, and the corresponding prices were computed. These papers focused on the national level, and thus, a European investigation, such as the one conducted in this paper, is required to cover the interactions in the liberalized European electricity market.
2.3. Hydrogen System Benefits
In the electricity market, hydrogen integration can aid in developing a self-sufficient energy system [
26]. RES-E curtailment and negative electricity prices can be avoided [
36]. Profits from wind and PV systems can be increased [
22], whereas the volatility of electricity prices can be reduced [
10,
20]. Electrolyzers can also provide ancillary services [
27,
35]. Hydrogen can be used in industries other than the electricity market. Sectors that are difficult or impossible to electrify face significant decarbonization challenges [
4]. Using hydrogen is one promising option for those sectors [
5,
11]. It is possible to decarbonize transportation by using fuel cell electric vehicles, trucks, ships, and airplanes. These fuel cells can be used to replace natural gas in the heating sector. Numerous industrial applications exist, such as steel or chemistry production [
3].
2.4. Hydrogen Market
One goal of the European hydrogen strategy [
6] and the European hydrogen backbone [
37] is unrestricted cross-border hydrogen trade. This should compensate for the uneven distribution of hydrogen demand and production capacity across countries. Furthermore, it affects hydrogen production in countries based on their installed electricity generation capacity and the resulting electricity price [
5,
38]. However, pipeline infrastructure for hydrogen trade is expensive, resulting in higher end-user hydrogen prices. As a result, only large hydrogen producers and consumers can use them economically [
9]. Furthermore, the achieved hydrogen price influences decisions regarding investments in generation capacity [
32]. A price of at least 79 EUR/MWh
H2 is needed to influence the heat, transport, and industry sectors using hydrogen [
5]. A price of at least 100 EUR/MWh
H2 is required to achieve sufficient revenue for hydrogen storage units, such as pipes or salt caverns [
24]. Otherwise, surplus electricity is insufficient to generate significant amounts of hydrogen [
39]. Although these studies promote the need for a sufficiently high hydrogen prices, the natural gas price must still be competitive [
34]. Otherwise, natural gas steam reformation would be more profitable than electrolyzers, resulting in significantly higher CO
2 emissions. This demonstrates the strong relationship between the hydrogen price, hydrogen production, and the competitiveness of the electrolyzer as assessed in this work.
2.5. Hydrogen Types
Various methods of producing hydrogen result in varying CO
2 emissions. Their production capacity is a constraint. A color scheme is used to differentiate between these methods, as follows [
40]:
Gray hydrogen is produced by a steam methane reforming process that uses natural gas, resulting in high CO2 emissions.
Blue hydrogen is created through a steam methane reforming process that uses natural gas, followed by carbon capture and storage, resulting in low CO2 emissions.
Turquoise hydrogen is produced by methane pyrolysis using natural gas, resulting in medium CO2 emissions. This process results in hydrogen and solid carbon, which can be used in various applications, including steel production and battery storage units.
Yellow hydrogen is created by electrolyzing water with electricity from any available power plant. The associated CO2 emissions depend highly on the actual dispatch or generation mix.
Pink hydrogen is produced by electrolyzing water with nuclear power plant electricity. This process does not lead to any CO2 emissions.
Green hydrogen is created by electrolyzing water with RES-E. There are no direct CO
2 emissions from this process. However, every technology causes a certain level of CO
2equ emissions throughout their lifecycle [
5].
Most research articles make no distinction between the various types of hydrogen. They are considered collectively, or the green hydrogen quota is analyzed [
23]. This would only display the PS change for RES-E. This paper focuses on producing hydrogen through electrolysis to meet the goals of the European hydrogen strategy [
6]. While this strategy defines preferred renewable hydrogen as hydrogen produced by the use of RES-E, this paper includes green, pink and yellow hydrogen. As a result, an evaluation of the various hydrogen types is possible without the use of external policies. For example, in France, the national hydrogen includes green and pink hydrogen [
41].
2.6. Progress beyond State of the Art
This study assesses the impact of sector coupling between the European electricity market and national hydrogen markets. Electrolyzers can generate hydrogen, whereas fuel cells can meet peak electricity demands. Hydrogen storage units allow for long-term energy storage by shifting energy over time. Optimizing for the entire year can provide useful information about seasonal effects [
21]. The contribution of this study is as follows:
- (i)
An implementation of sector coupling is proposed between the European electricity market and national hydrogen markets. Conversion technologies allow these markets to interact. A joint EW optimum is obtained. Because the hydrogen market is not modeled as a price taker, increased demand or production can influence electricity prices.
- (ii)
An examination of sector coupling is carried out one the one hand solely by the production of hydrogen and on the other hand by its functionality as seasonal storage and hydrogen reconversion to electricity.
- (iii)
A comprehensive analysis of the changes in CS, PS, and EW and welfare trade-offs between the two markets is performed. This is accomplished in a near-future scenario in 2030 and in a nearly fully decarbonized energy system in 2040. The surpluses for thermal power plants, RES-E, storage units, and hydrogen market participants in 13 central European countries are thoroughly evaluated.
- (iv)
An assessment of the various hydrogen types produced without external policy and a change in the overall electricity mix is performed.
3. Methodology
3.1. Sector Coupling Approach
The European electricity market model
EDisOn [
12] is extended to model the electricity and hydrogen market sector coupling.
Figure 1 gives an overview of the sector-coupled model.
The blocks on the left (electricity market, electricity generators, and electricity demand) are already part of the EDisOn model. The blocks on the right (hydrogen market, hydrogen storage, hydrogen generators, and hydrogen consumers) are model extensions. Several signals connect these two markets. The clearing price of the electricity market has an impact on the hydrogen market. It alters the production of hydrogen and the use of hydrogen to generate electricity. The first causes increased electricity demand, which influences electricity generation and price. The latter can have an impact on electricity generation and, thus, on electricity prices. As a result, the electricity and hydrogen markets impact one another. Thus, they are optimized together to achieve a holistic EW optimum. This methodology enables the identification of a holistic optimum for the electricity and hydrogen markets. It is preferable to avoid an iterative solution in which the hydrogen market acts as a price taker and the electricity market acts as a price setter.
3.2. Economic Welfare
3.2.1. Without Sector Coupling
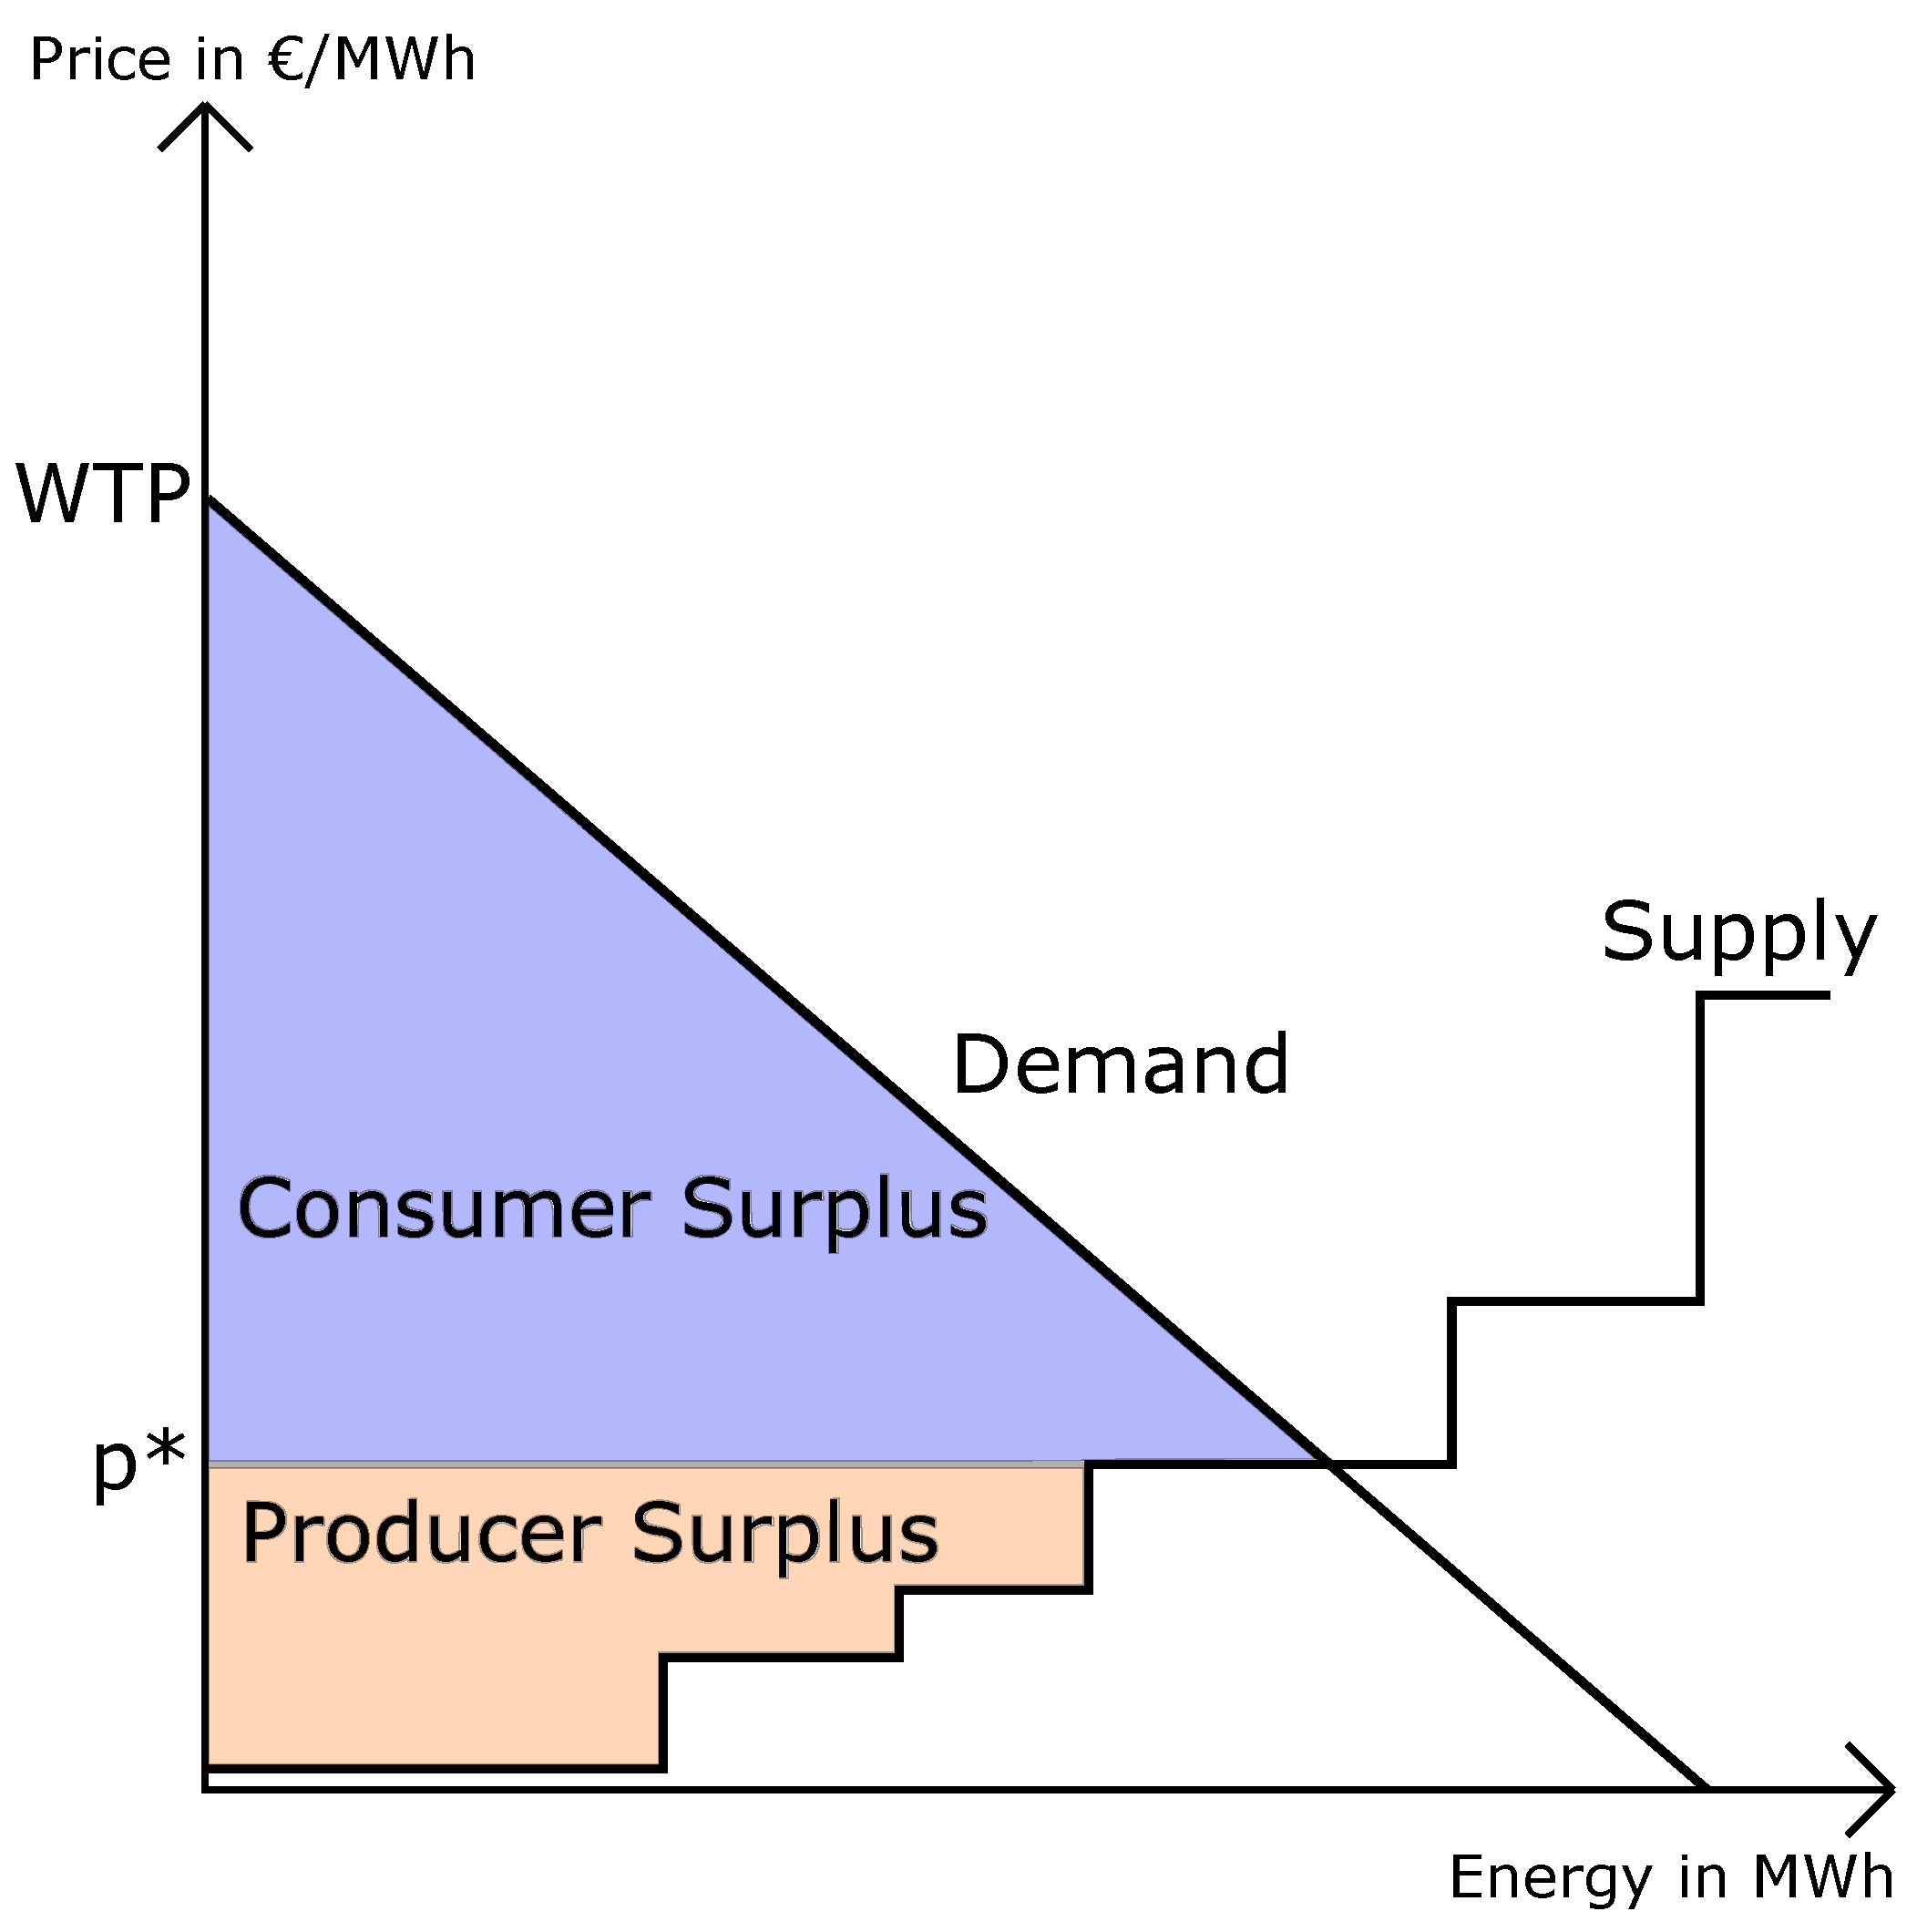
In economics theory, the electricity demand is elastic. A relationship exists between the actual demand and the price (
Figure 2). This implementation cannot solve the large-scale electricity market model in a reasonable time. As a result, electricity demand is assumed to be inelastic, but demand-side flexibility is implemented (
Figure 3). The demand remains constant until the electricity price equals the Willingness to pay (WTP), an exogenous predefined maximum electricity price.
Section 5 describes the EW and the associated surplus calculation in detail. In
Figure 2 and
Figure 3 the EW is illustrated as the sum of the PS and the CS. The PS describes the area between the cost of electricity generation (supply curve) and the resulting clearing price (
). The CS is calculated by multiplying the difference between the clearing price and the WTP by the hourly electricity demand (
Figure 3). Hence, the WTP directly determines this value. Because this analysis considers the difference from a reference scenario, the chosen value does not affect the results.
3.2.2. With Sector Coupling
Figure 2 depicts the electricity market clearing without sector coupling to the hydrogen market. The intersection of the supply curve and the demand curve results in a market clearing price (
). The corresponding PS is highlighted in the light orange area, and the CS is highlighted in the light blue area.
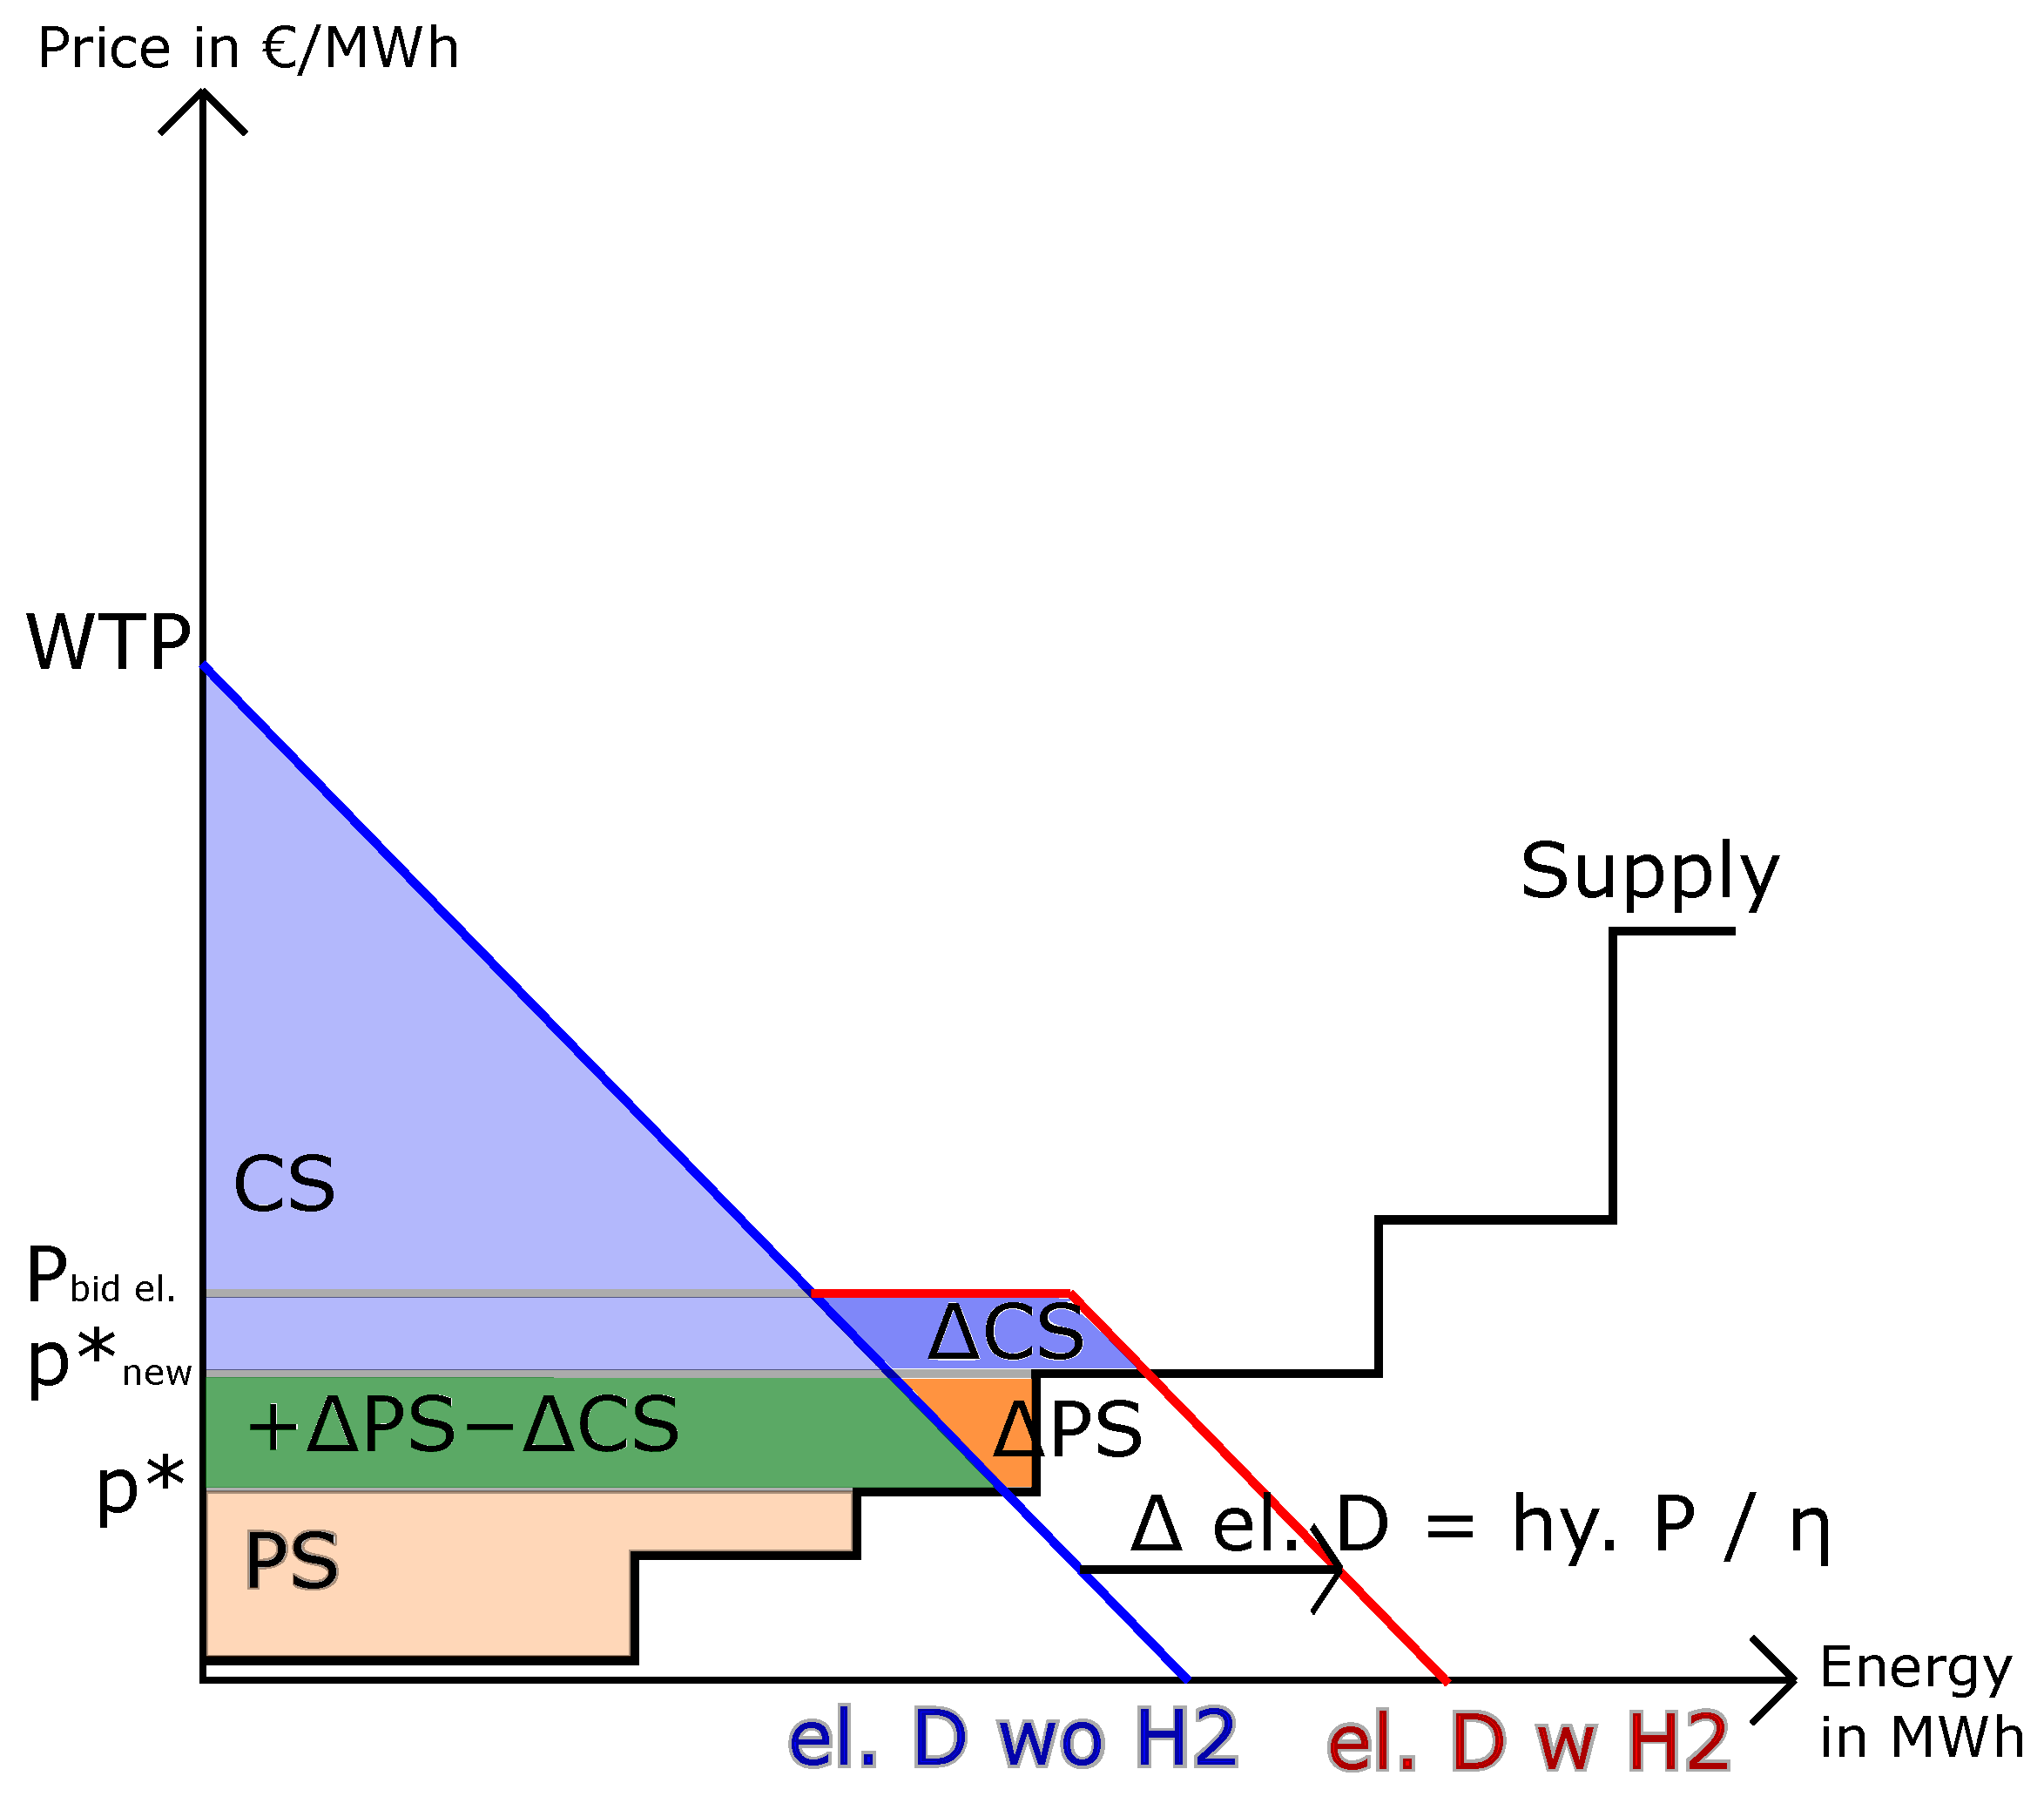
Figure 4 depicts the impact of increased electricity demand due to hydrogen production.
The electricity demand without sector coupling (blue line) raises (red line) due to the electrolyzer’s demand (). This additional electricity demand will exist until a predetermined exogenous market clearing price is realized (). If possible, the additional demand will be so high that the new clearing price () at the intersection between the supply curve and the new demand curve (red line) corresponds to the maximum bid price of the hydrogen producers on the electricity market (). This is the maximum bid made by hydrogen producers on the electricity market. It depends on the associated hydrogen price that will exist until production becomes economically viable. The amount of this additional electricity demand is determined by the amount of hydrogen produced and the efficiency of the electrolyzers.
If the clearing price without the additional demand is already higher than P
bid el., there will be no additional demand. The additional demand of hydrogen producers is limited by their installed capacity. Hence, the demand will not always rise until
corresponds to P
bid el.. This case is shown in
Figure 4. The raised market clearing price increases the PS (green and dark orange areas). Part of this increased PS is due to a reduction in CS (green area). Additionally, the CS rises due to the increased electricity demand of hydrogen producers (dark blue area).
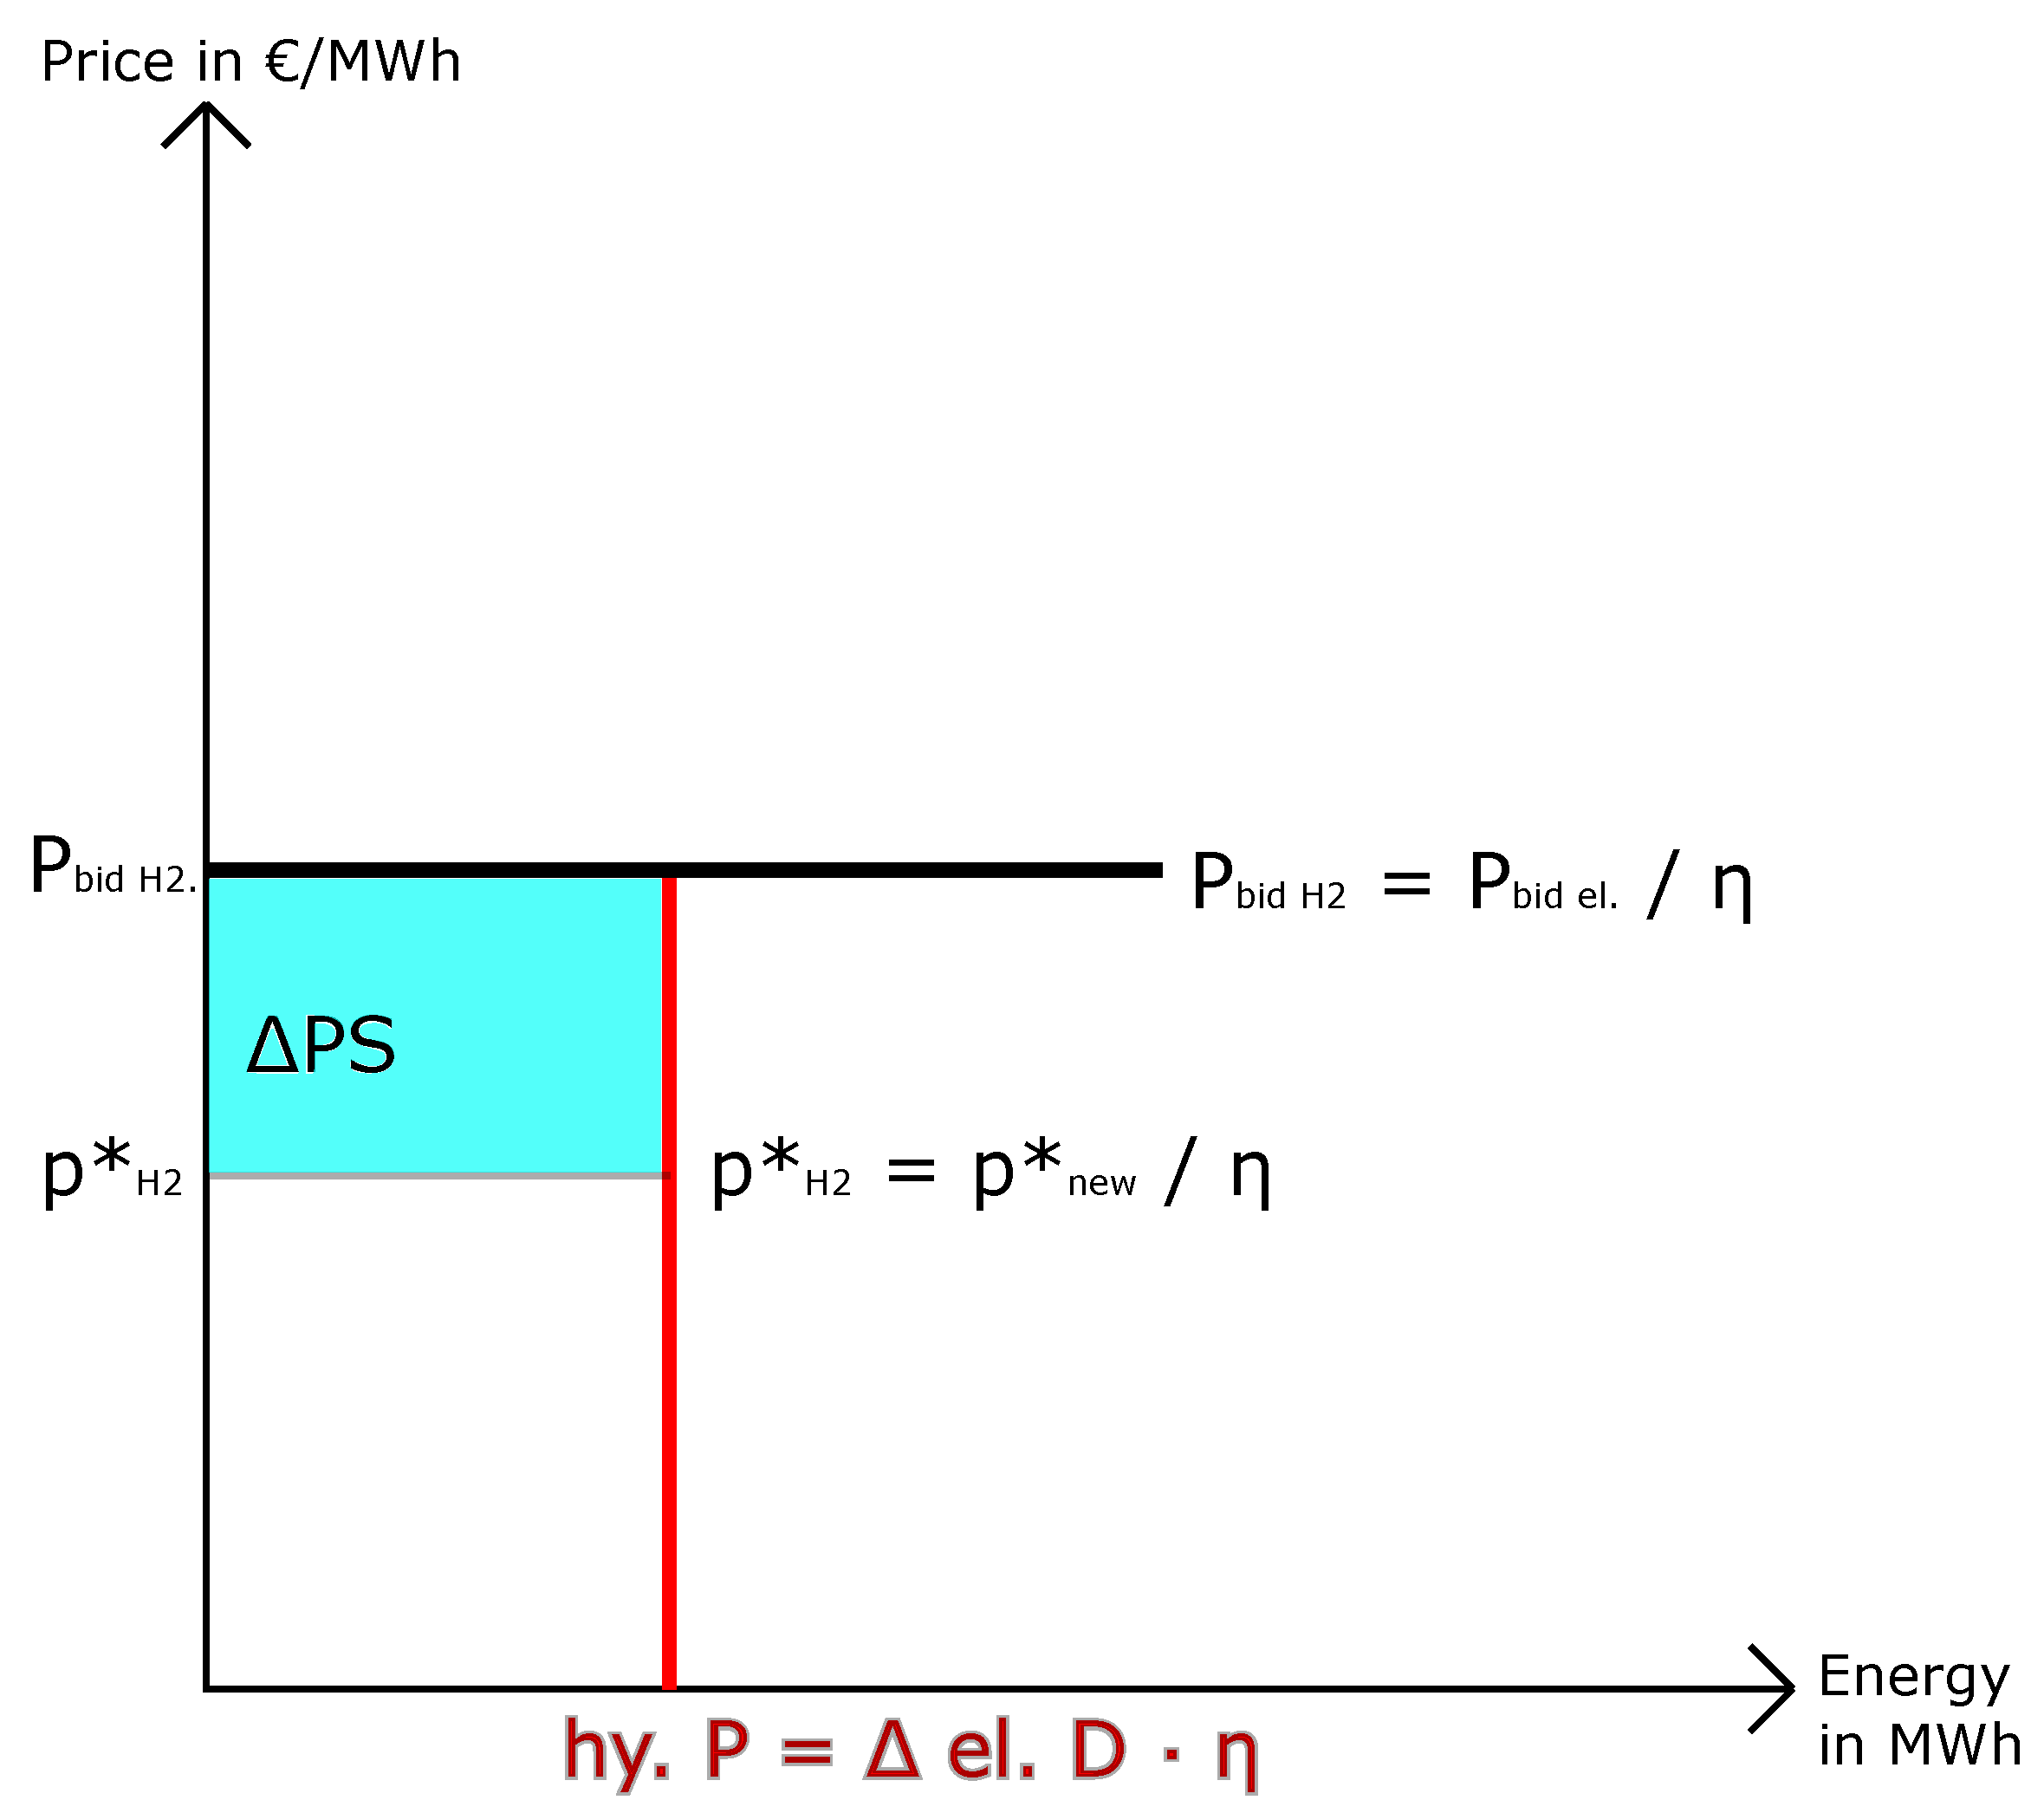
Figure 5 depicts the hydrogen market merit order and especially the additional PS obtained on the hydrogen market. The amount of hydrogen produced (hy. P; red line) is proportional to the increase in the electricity demand (
) on the electricity market via the electrolyzer efficiency (
). Moreover, the hydrogen market clearing price (
) is proportional to the electricity clearing price (
). A PS (turquoise area) occurs if the hydrogen market clearing price is lower than the maximum hydrogen price (
). In this case, the hydrogen PS is calculated by multiplying the difference between the clearing price and the maximum bid price by the hourly hydrogen generation. If these two prices are the same, the benefits of the market coupling are fully captured by the increase in CS in the electricity market. This occurs if there is more electrolyzer capacity installed than needed.
Fuel cells that generate electricity by utilizing hydrogen are another available generation method (e.g.
Figure 2). These are used if the electricity prices exceed their Short-run marginal costs (SRMC). The required hydrogen must be produced ahead of time. This can result in hydrogen production even if the market clearing price (
) is higher than the maximum hydrogen price (
). This corresponds to a negative electrolyzer PS.
4. Implementation of the Sector-Coupled Electricity Market Model
The European electricity market model
EDisOn [
12] minimizes the overall electricity generation costs of the electricity and hydrogen system. This corresponds to maximizing EW. This model is an Linear programming (LP) unit commitment model of the European electricity market implemented in MATLAB. The model determines the lowest dispatch cost for all thermal power plants, RES-E curtailment, and storage unit utilization. The RES-E generation technologies, namely PV, Run-of-the-river hydroelectricity (RoR), and wind, are not dispatchable, and their generation profiles are defined exogenously. One node represents each country in the model. The optimization takes into account and implicitly reserves transfer capacities between bidding zones.
Figure 6 depicts the used market area, nodes, and transmission grid.
The decision variables in the current study are always written in lowercase, and exogenously defined constants are written in uppercase.
4.1. Objective Function
The objective function of the model (
1) minimizes the overall electricity generation costs due to the generation (
), which is proportional to the SRMC and start-up costs (
) [
42] of thermal power plants, RES-E Operation and maintenance costs (O&M) (
), PHS turbine O&M costs (
) and Not-supplied energy (NSE) fee (
).
The RES-E O&M costs are proportional to RES-E generation (
) minus their curtailment (
). PHS turbine O&M costs are proportional to the turbined electricity (
). The coupling of the two markets is conducted via the amount of hydrogen produced (
) and the amount of hydrogen used to generate electricity (
). These hydrogen quantities influence the objective function in proportion to the hydrogen price bid (
).
4.2. Constraints
The electricity demand (
) must be compensated for in every node for each timestamp (
2). The electrolyzers that produce hydrogen generate additional electricity demand (
). The compensation for demand is carried out by thermal generation (
), fuel cells (
), PHS turbine generation (
), storage discharging (
), RES-E generation (
) minus their curtailment (
), and NSE (
).
Demand rises due to PHS pump utilization (
) and storage charging (
). A power exchange (exch) between nodes connects various bidding zones. The dual variable of this constraint (
) provides the local electricity market clearing price as an hourly profile. This figure is used to calculate the CS, PS, and EW.
Conversion technologies are used to connect the electricity and hydrogen markets. Production (
p) in one sector causes demand (
d) in the other. The superscript describes the target sector, whereas the subscript describes the source sector. Electrolyzers couple the electricity and hydrogen markets (
3) according to
The coupling from the hydrogen to the electricity market is performed by fuel cells (
4),
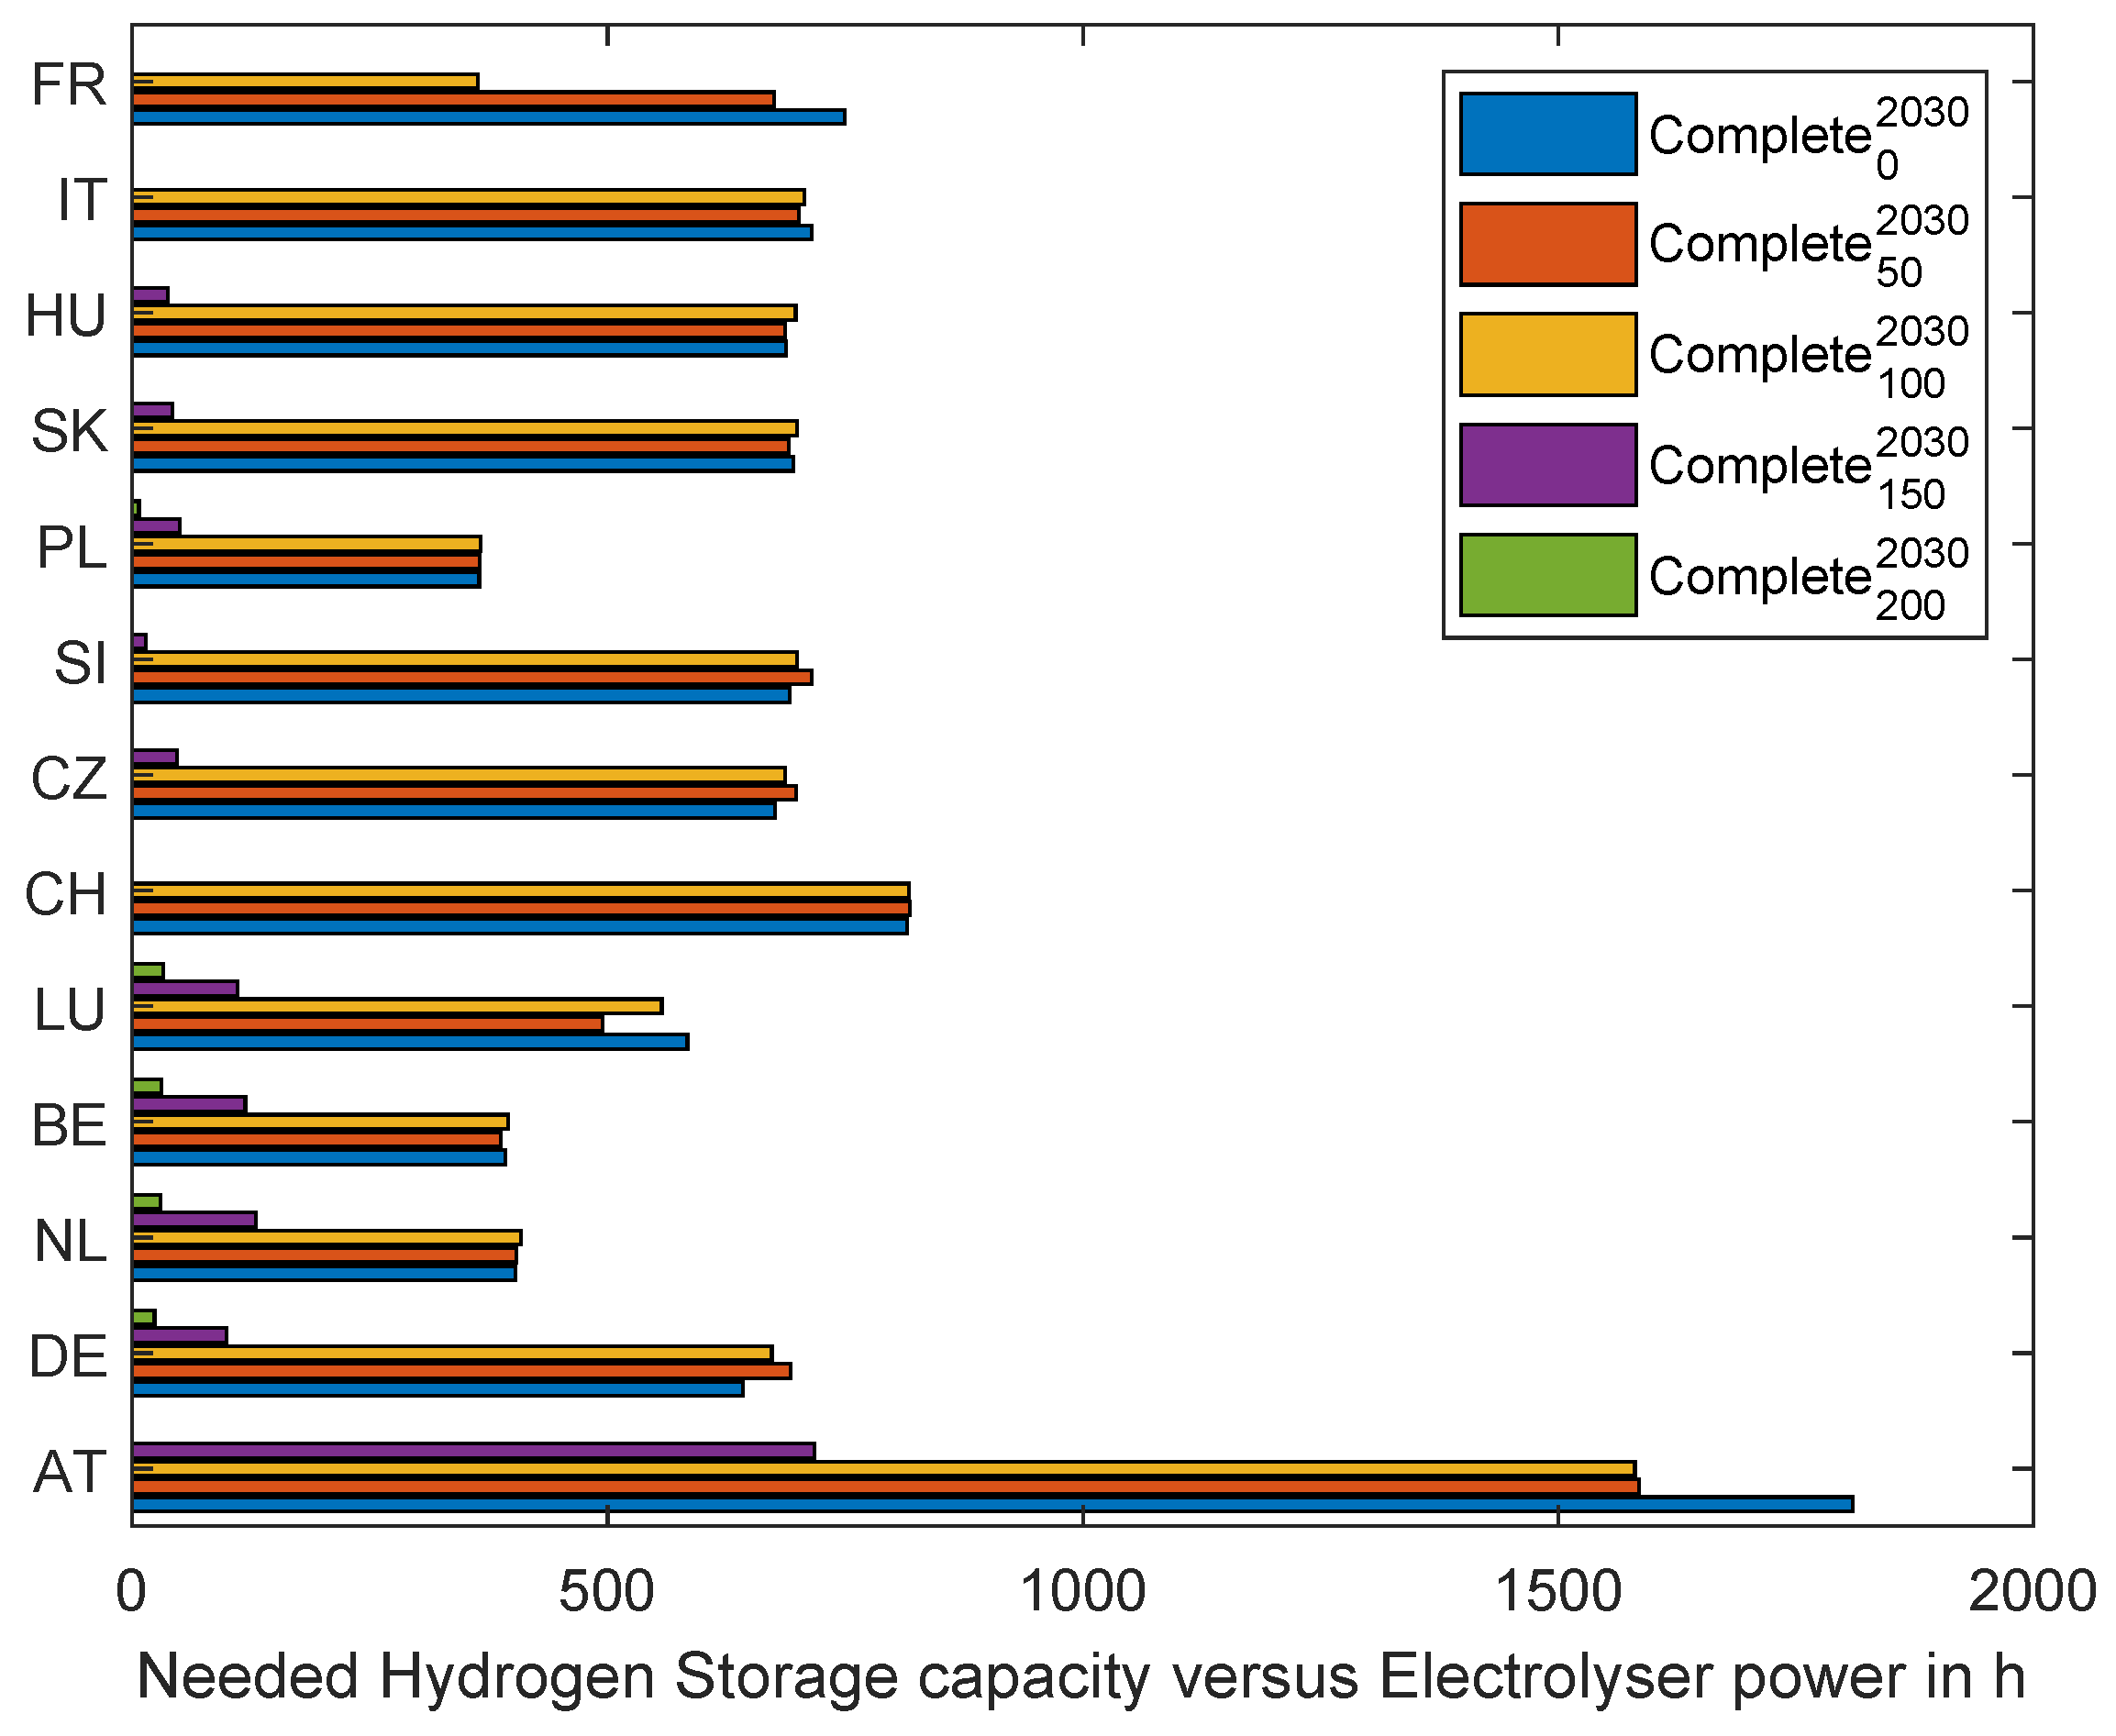
The power output of both technologies is within their limitations. All electrolyzers and fuel cells in a node share hydrogen storage without capacity restrictions. The storage capacity required for optimal operation is calculated ex post. Thus, fuel cells can only be used if sufficient hydrogen has been produced over the year in the respective node.
The operation of a thermal power plant is limited by a ramp rate and their technical minimum and maximum capacities, which are implemented as a linear function to account for start-up costs [
42]. The RES-E technologies’ power generation is represented by a yearly profile with hourly temporal resolution and installed capacity per node. Storage units have limited power and capacity. Furthermore, PHS benefit from a natural inflow, which results in more available energy. The power exchange (exch) between the nodes is limited by the net transfer capacities of transmission lines [
43].
4.3. Model Validation
The European electricity market model was validated without including the sector coupling to the hydrogen market [
12]. Furthermore, the results show that the sector coupling of electrolyzers with a hydrogen price of 0 EUR/MWh
H2 results, on the one hand, in no hydrogen production. On the other hand, the dispatch is the same as without sector coupling. Furthermore, the results in
Section 5.5 show that the overall EW always increases and never decreases.
4.4. Economic Welfare Calculation
As discussed in
Section 3, sector coupling results in a welfare shift away between the electricity market and the hydrogen market. The overall EW change is calculated to evaluate this (
5).
It corresponds to the sum of the PS and CS on the electricity and hydrogen market and other costs that are part of the electricity market (
5). This includes, e.g., thermal power plants ramp-up costs or congestion rents of transmission lines. A reference scenario with no sector coupling is required for this calculation method. The CS in the hydrogen market is zero because the bid for hydrogen is inelastic and unaffected by the amount of hydrogen produced. This implies that the WTP for hydrogen is the same as the bid price for hydrogen.
The electricity market CS with sector coupling consists of two parts (
6).
The electricity demand is multiplied by the difference between the WTP and the resulting market clearing price. The additional electricity demand of the electrolyzer multiplied by the difference between the price bid on the electricity market (
) and the resulting market clearing price results in a surplus. The price bid on the electricity market (
7) results from the price bid on the hydrogen market and the electrolyzer efficiency.
The PS on the electricity market (
8) is calculated by the generated electricity of thermal and renewable generation units multiplied by the market clearing price minus their generation costs.
On the hydrogen market, the PS is given as the electrolyzer PS as the sum of produced hydrogen multiplied by the difference between the hydrogen price bid and clearing price on the hydrogen market (
9) and the fuel cell PS equivalent to that of thermal power plants (10).
The clearing price on the hydrogen market (
) results from the clearing price on the electricity market and the electrolyzer efficiency (11).
4.5. Input Data
All 13 countries (Austria, Germany, Netherlands, Belgium, Luxembourg, Czech Republic, Slovenia, Switzerland, Poland, Slovakia, Hungary, Italy, and France) within the optimized area are expected to complete the European National energy and climate plans (NECP) [
44] by 2030 (
Figure 6). This includes expanding renewable energy sources and decommissioning, for example, coal-fired power plants. According to Austria’s NECP, RES-E compensates for 100% of the yearly electricity demand. The
National trends (NT) 2030 and
NT 2040 scenarios we used, which are provided by the European network of transmission system operators (ENTSO-E), are based on the fulfillment of these plans [
45]. The SRMC of thermal power plants include a CO
2 price of 70 EUR/t in 2030 and 90 EUR/t in 2040.
4.5.1. Hydrogen Data
The available capacities were based on the individual countries’ national hydrogen strategies. All installed electrolyzer and fuel cell capacities are listed in
Table 1. As a result, the overall expansion is slightly less than the European target of 40 GW by 2030 [
7]. If available, the national hydrogen strategies’ expansion targets were used. If no capacity was specified, it was estimated based on predicted hydrogen demand. Furthermore, 4000 full-load hours of electrolyzers per year were assumed [
46]. If no other targets existed, we expected the capacity to double by 2040 compared to 2030. The fuel cell capacity was equal to 60% of the electrolyzer capacity. The hydrogen storage units within each country were not capacity-limited prior to the optimization. The optimal required storage sizing for each country was calculated ex post in
Appendix B.3. The electrolyzer efficiency (
) is 70%, and the fuel cell efficiency (
) is 60%.
4.5.2. Cost Assumptions
The cost assumptions made for the CS, PS, and EW calculations are listed in
Table 2. The hydrogen price on the hydrogen market (
) is given in EUR/MWh
H2. Hydrogen prices are often given in EUR/kg. By introducing the energy content of 33 kWh/kg hydrogen, a price of 3.3 EUR/kg results from, e.g., 100 EUR/MWh
H2.
5. Results
This section defines scenarios for 2030 and 2040. These were calculated using the input data described in
Section 4.5, and the results are examined.
5.1. Scenarios
Each optimization was conducted with 8760 one-hour timesteps. It was carried out for the years 2030 (superscript written
2030) and 2040 (superscript written
2040). For both years, a distinction was made between using only electrolyzers (
Production) or electrolyzers, fuel cells, and storage units (
Complete). This distinction allowed us to evaluate the impact of the two components (demand-side flexibility and seasonal storage) separately. This resulted in four scenarios. Each scenario was optimized for a range of hydrogen prices as a sensitivity analysis (
Table 2). Hence, five different prices (subscript written
0–
200) were assumed. This resulted in the optimization runs shown in
Table A2.
All scenarios use the
and
scenarios, with a hydrogen prices of 0 EUR/MWh
H2, as a reference scenario. There was no incentive for the system to produce hydrogen in these scenarios. On the one hand, additional PS or CS could not be obtained (
Section 4.4). On the other hand, there were no fuel cells to stimulate hydrogen production through sufficient electricity price fluctuations.
5.2. Price Effects of Sector Coupling
The integration of flexibility into the electricity market directly affects electricity prices.
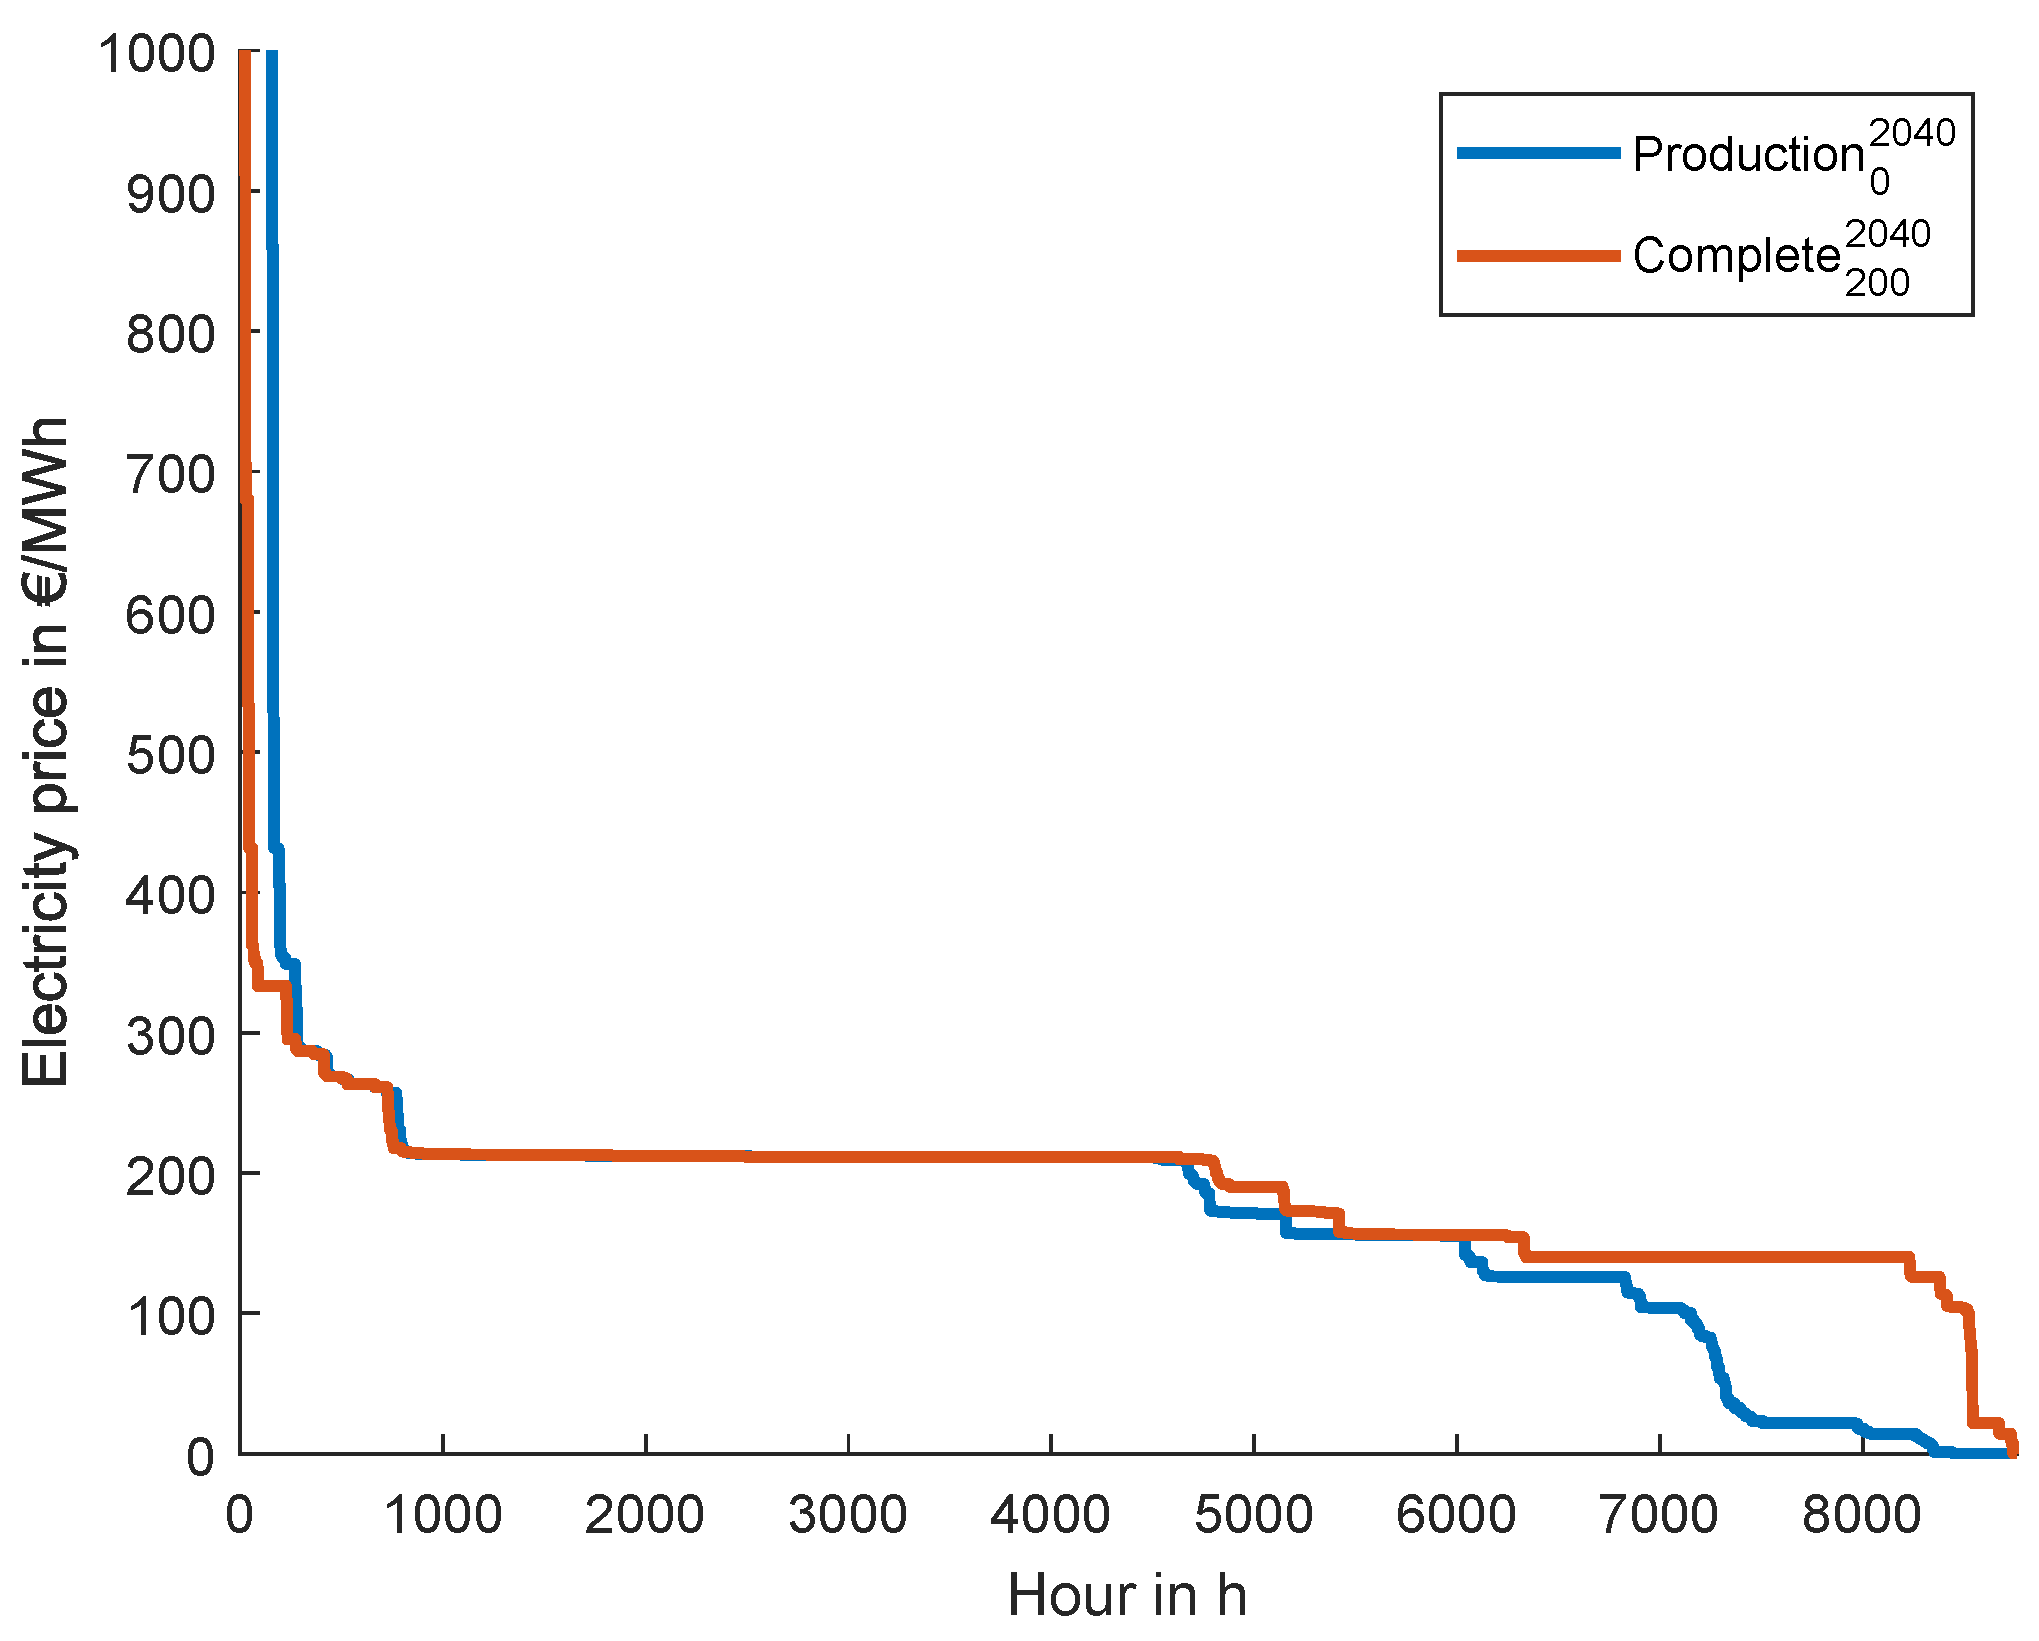
Figure 7 shows this using the scenarios
and
.
If the clearing price on the electricity market without hydrogen production is less than the bidding price for electricity on the electricity market (
), an additional electricity demand occurs, which is limited by the capacity of the electrolyzer (
Section 3). In addition, the electricity demand will only rise until the clearing price of the electricity market is not greater than the bidding price for electricity on the electricity market (
). This price increase is caused by a shift in the merit order (
Section 3.2.2). This can be seen on the right-hand side of the annual duration curves for electricity prices in
Figure 7. In turn, fuel cells are used when the electricity prices on the market are extremely high. If the fuel cell SRMC are below the electricity clearing price, they are used to cover parts of the demand. The SRMC are determined by the bidding price for hydrogen hydrogen (
) and the fuel cell efficiency (
). The reduction in the frequency of price peaks can be seen on the left-hand side of the electricity price annual duration curves in
Figure 7.
5.3. Producer Surplus
The following sections analyze the impact of sector coupling on the PS. The plots depict the PS increase or decrease compared to the reference scenarios (
and
). Additional results that are not directly within the scope of this paper but are required for the interpretation of our results can be found in
Appendix B.1,
Appendix B.2,
Appendix B.3,
Appendix B.4.
5.3.1. Thermal Power Plant Producer Surplus
This section depicts the PS (
Section 4.4) for various types of thermal power plants.
Gas,
oil,
coal,
lignite, and
nuclear power plants are distinguished. Other generation types and power plants that are not precisely defined are examined as
OtherNonRES. All these power plants are dispatchable thermal power plants (
Section 4).
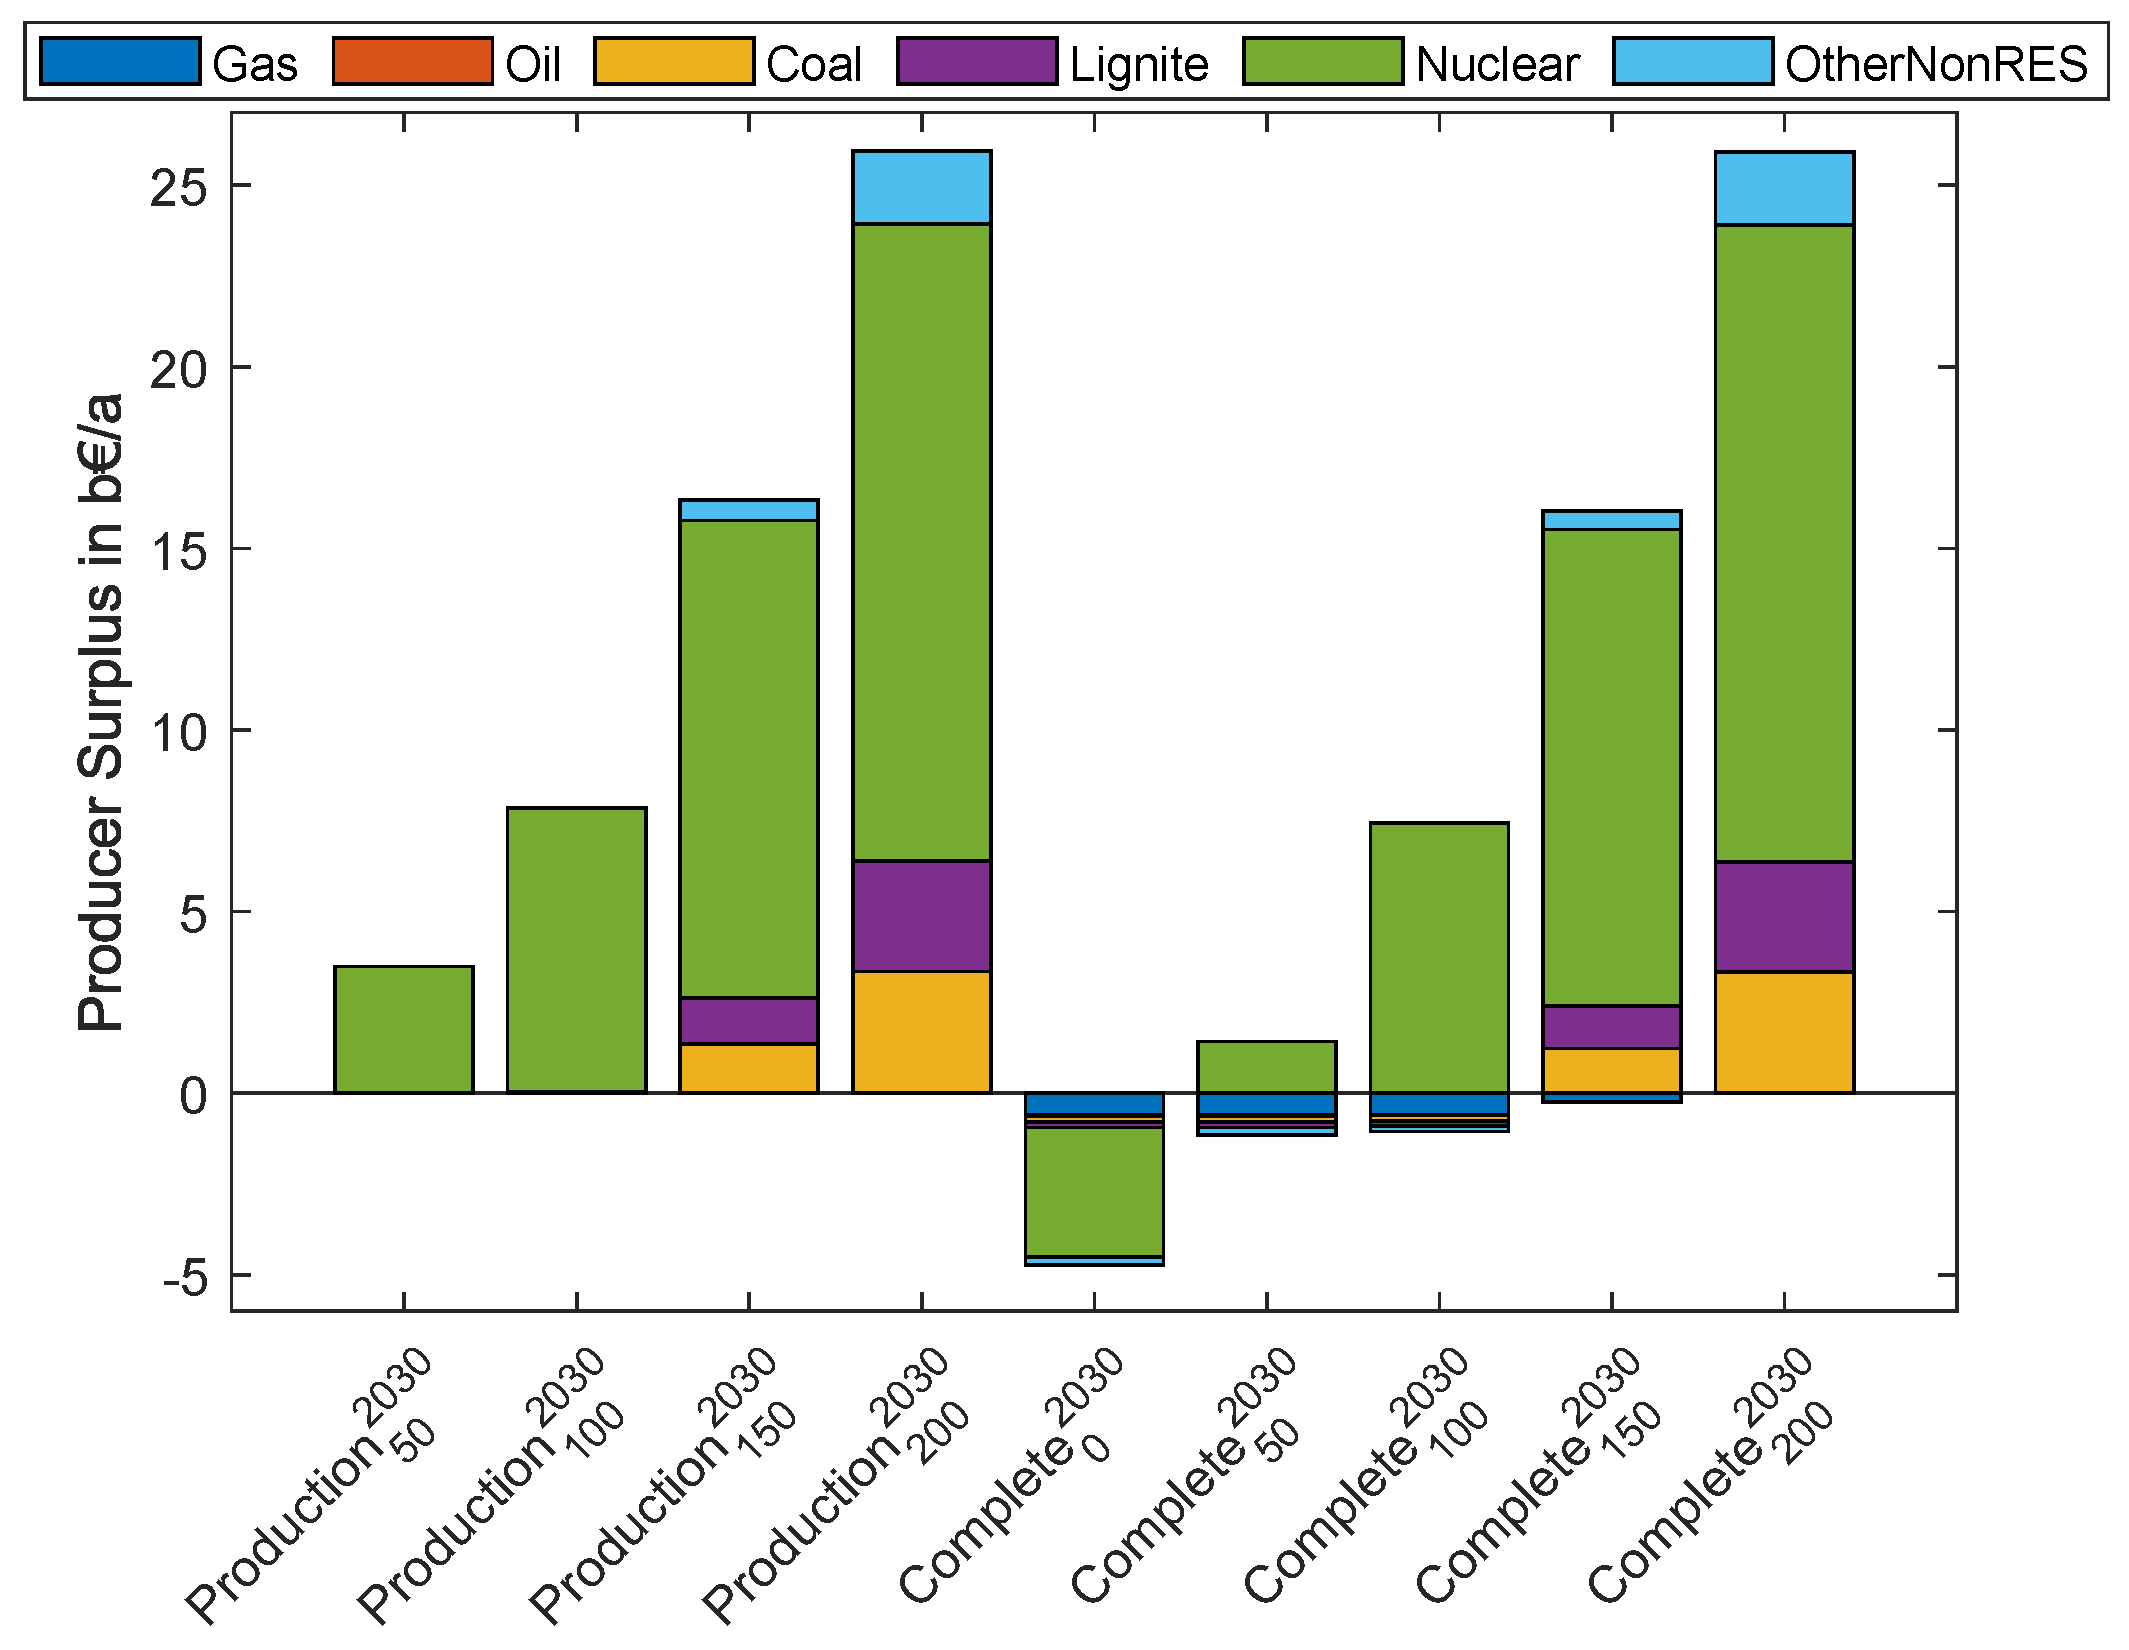
The
Production scenarios result in a significant increase in nuclear power plant PS in 2030 (
Figure 8). This is due to their extremely low SRMC. The changed electricity generation reflects France’s significantly increased use of nuclear power plants to produce hydrogen (
Appendix B.4). Pink hydrogen accounts for a sizable proportion of total hydrogen production (
Section 5.6). The PS increases for all types of thermal power plants if their respective SRMC are less than the price bid to produce hydrogen on the electricity market (
). In this case, these power plants are used to cover the demand (
Section 4.2). Hence, their PS increases starting from 150 EUR/MWh
H2. Otherwise, sector coupling does not increase their PS. Low electricity prices are raised by the electrolyzers (
Figure 7), but they are still smaller than the SRMC of the corresponding thermal power plants. In times of high electricity prices, no hydrogen is produced, and thus, the electricity demand, the dispatch, and the PS of the electricity price remain unchanged (Equations (
1) and (
2)).
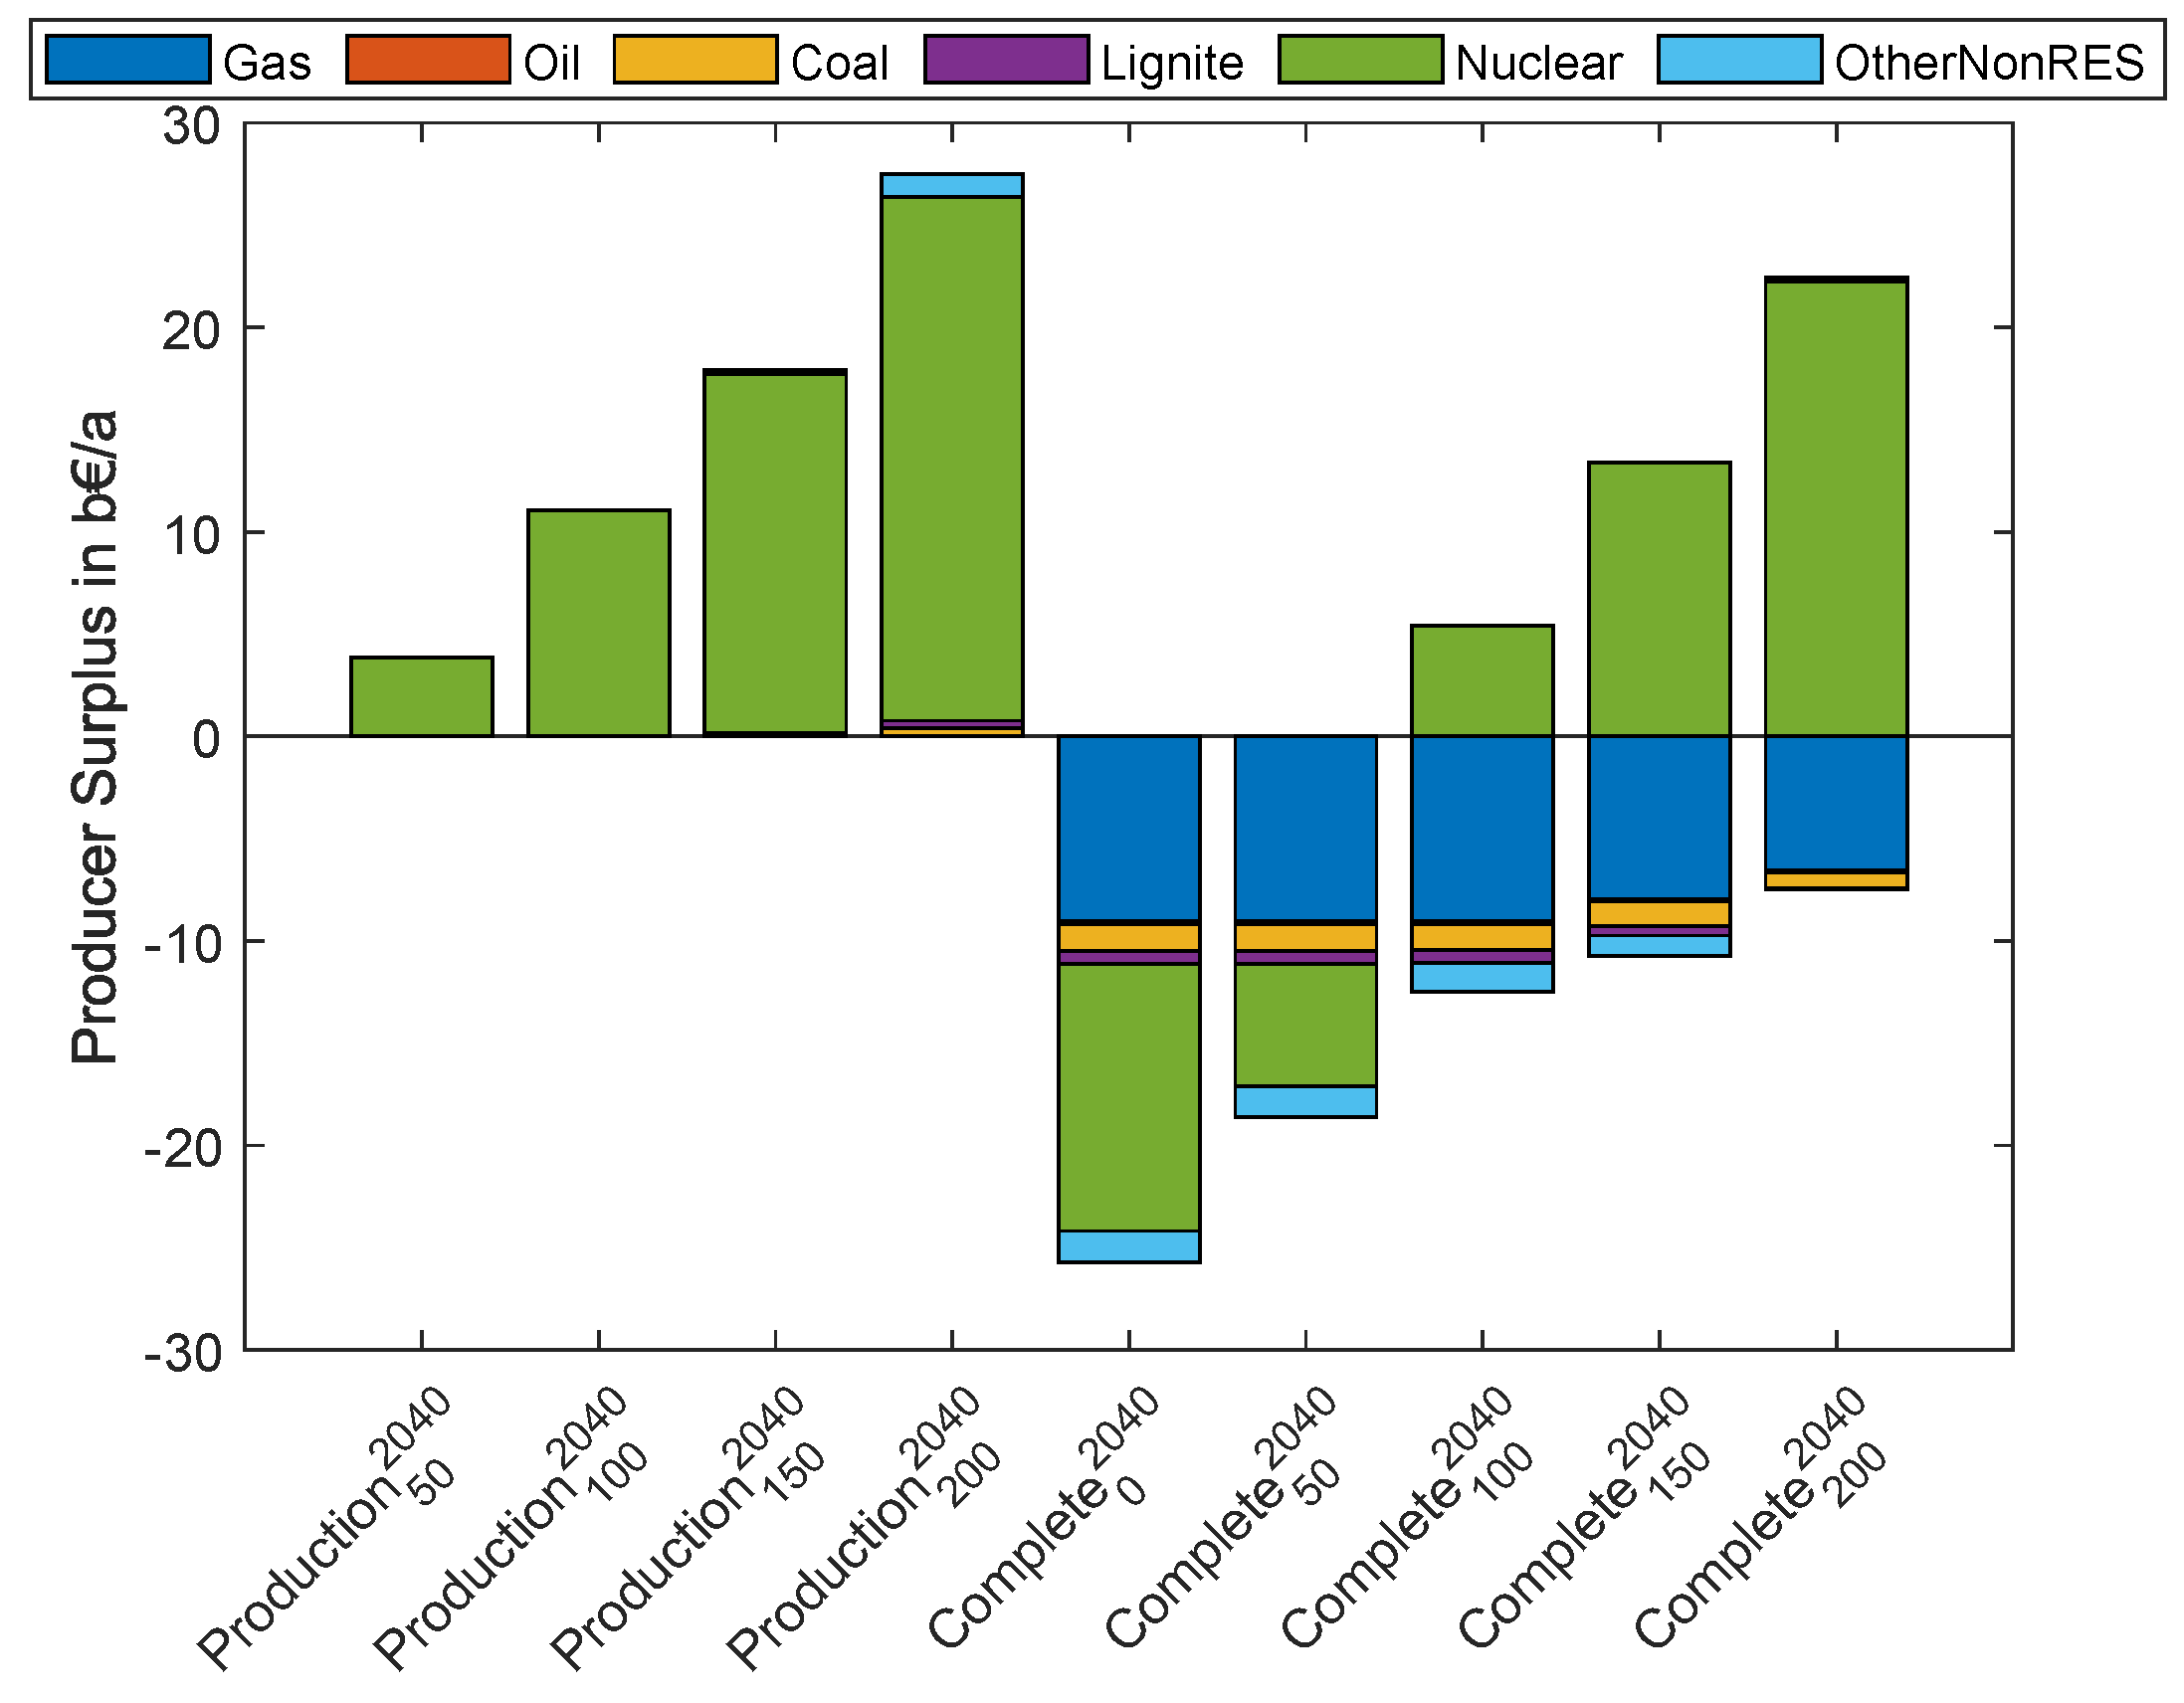
This changes if hydrogen can be used to generate electricity in the Complete scenarios. Hydrogen is produced even at a hydrogen price of 0 EUR/MWhH2 to lower electricity price peaks via fuel cells. On the one hand, these lower price peaks reduce the PS of thermal power plants. On the other hand, price-setting power plants are replaced by fuel cells, further lowering the PS. Consequently, fuel cells are becoming the new price-setting power plants. This is evident in scenarios with lower fuel cell SRMC than those of other thermal power plants and, therefore, also sufficient low hydrogen prices (up to 100 EUR/MWhH2). From 150 EUR/MWhH2 onwards, there are only minimally reduced PS compared with the Production scenarios.
The
Production scenarios for 2040 (
Figure 9) show similar results to those in 2030. If fuel cells are implemented, the thermal power plant PS is drastically reduced. This is because of the extremely high price peaks in 2040 and times when demand cannot be fully compensated. The WTP is reached as the electricity market clearing price several times. Fuel cells can avoid or significantly reduce these extreme price peaks, leading to a thermal power plant PS decrease.
5.3.2. Renewable Energy Producer Surplus
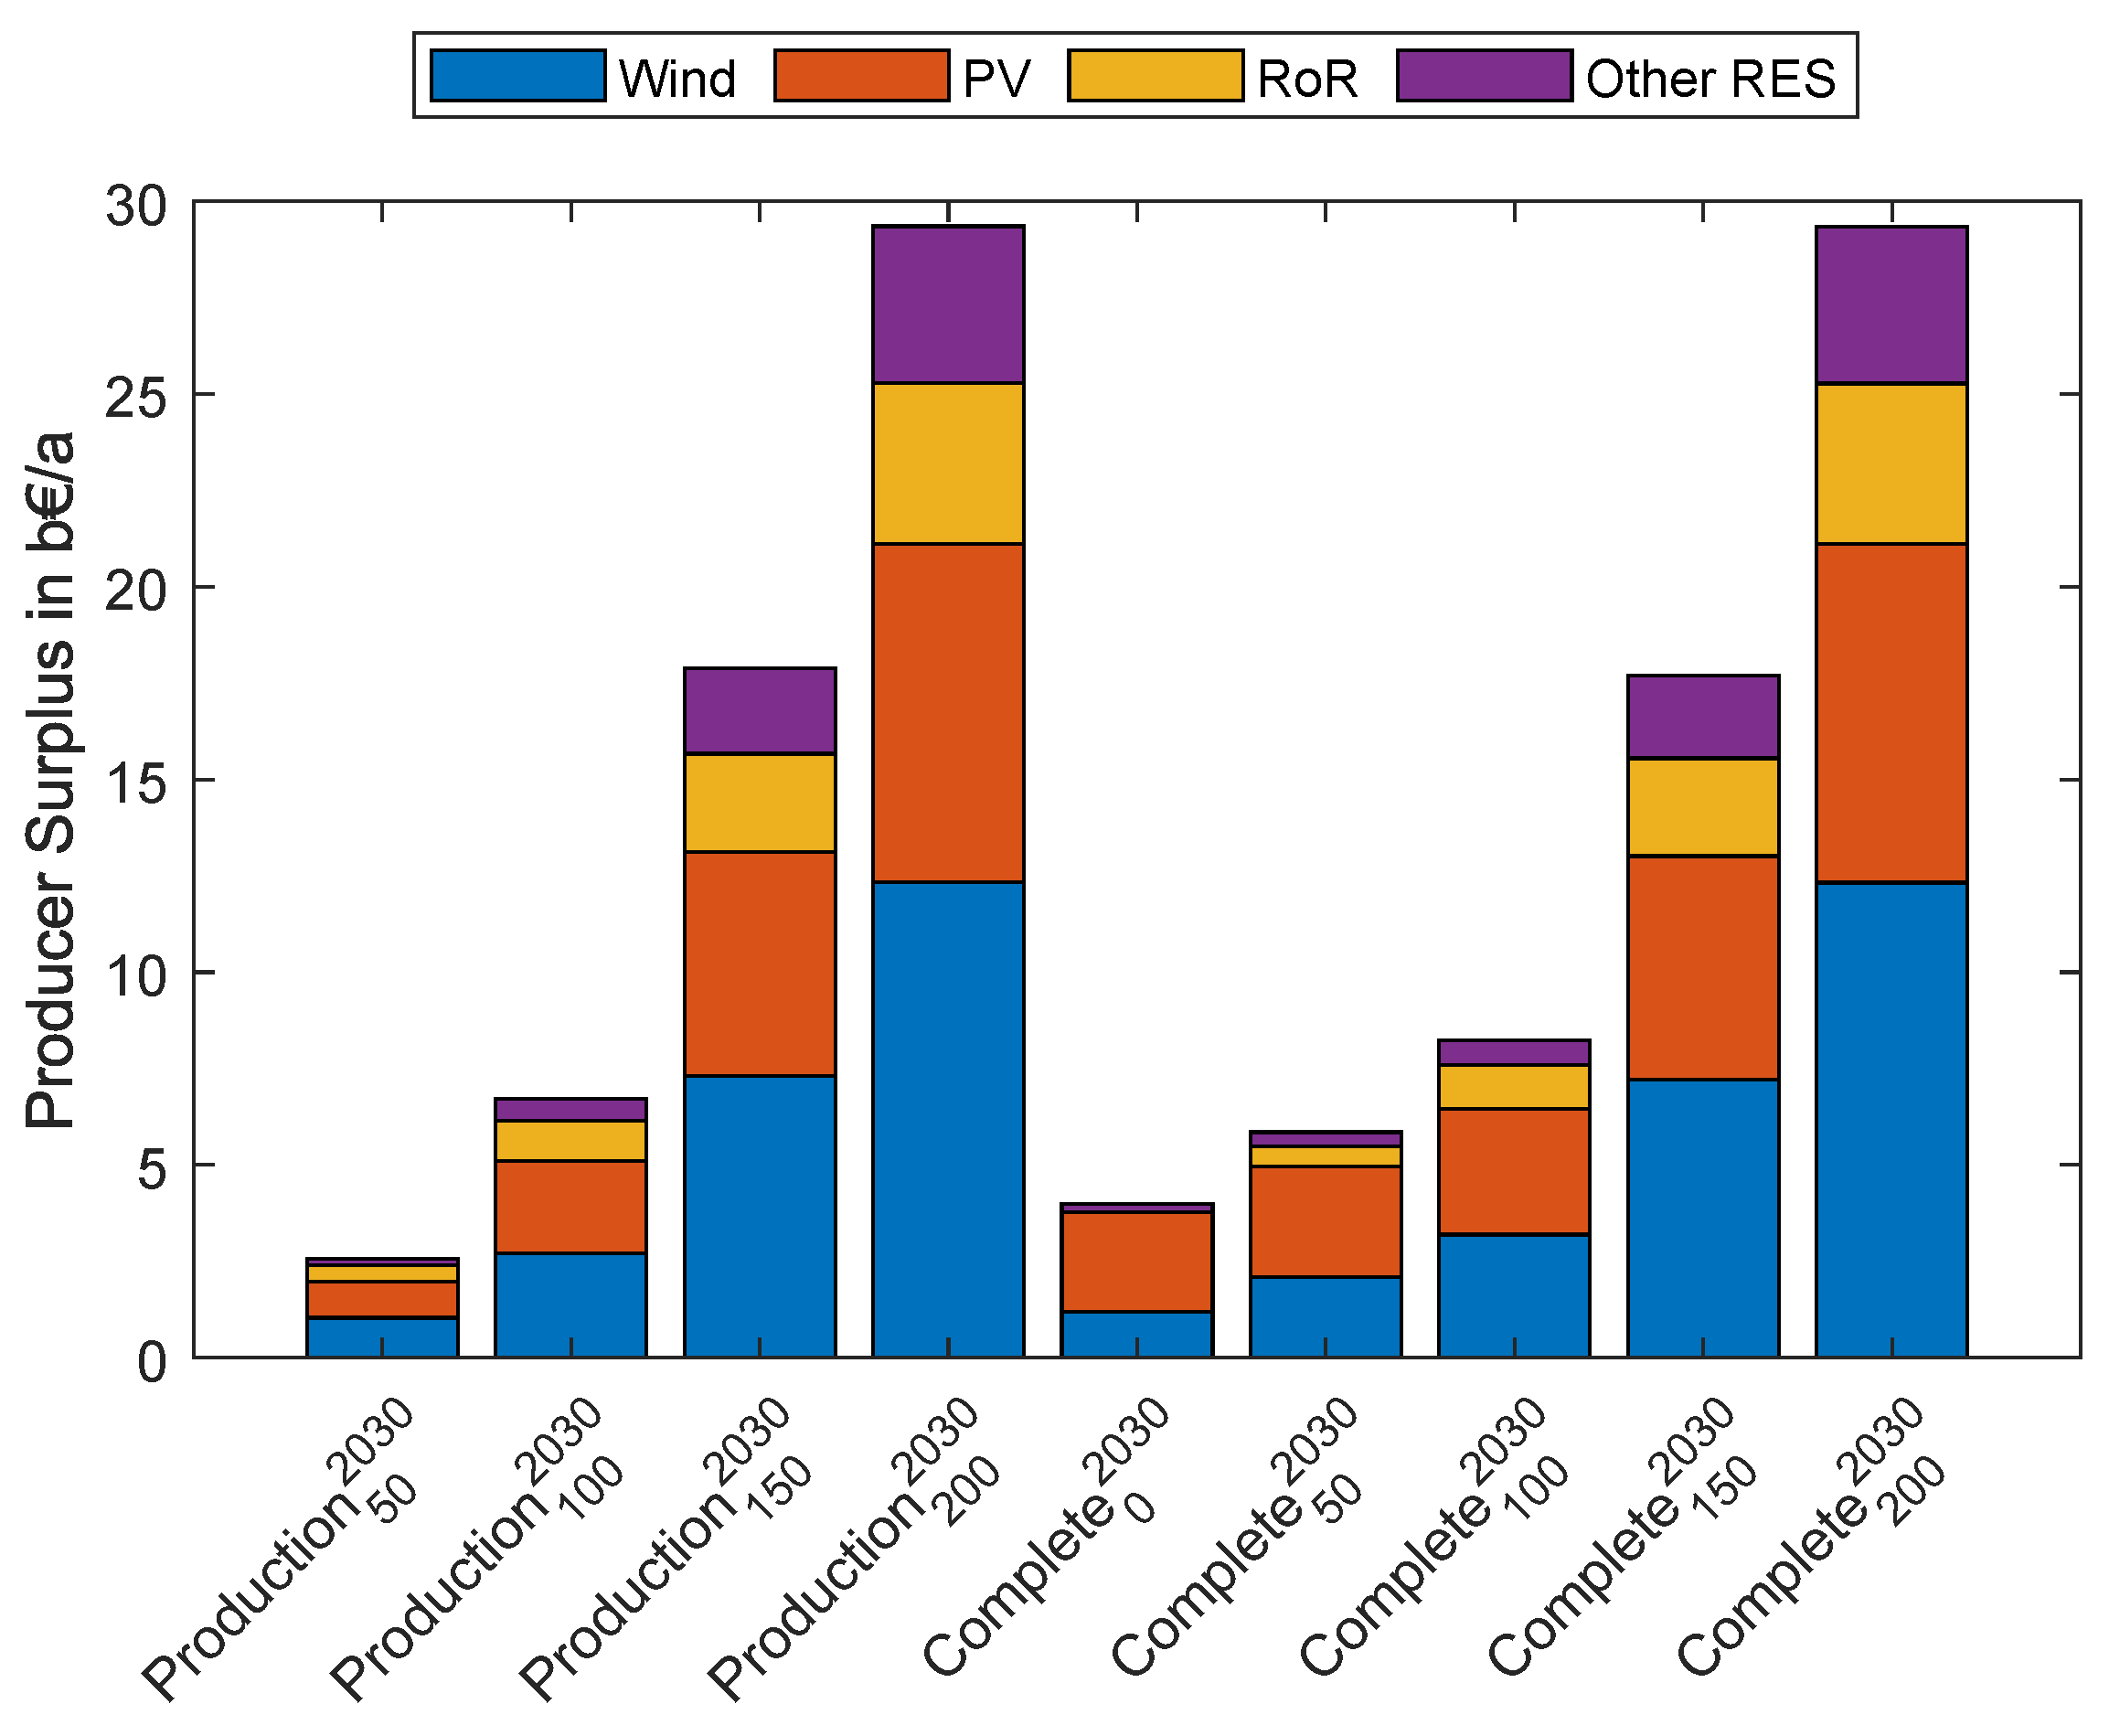
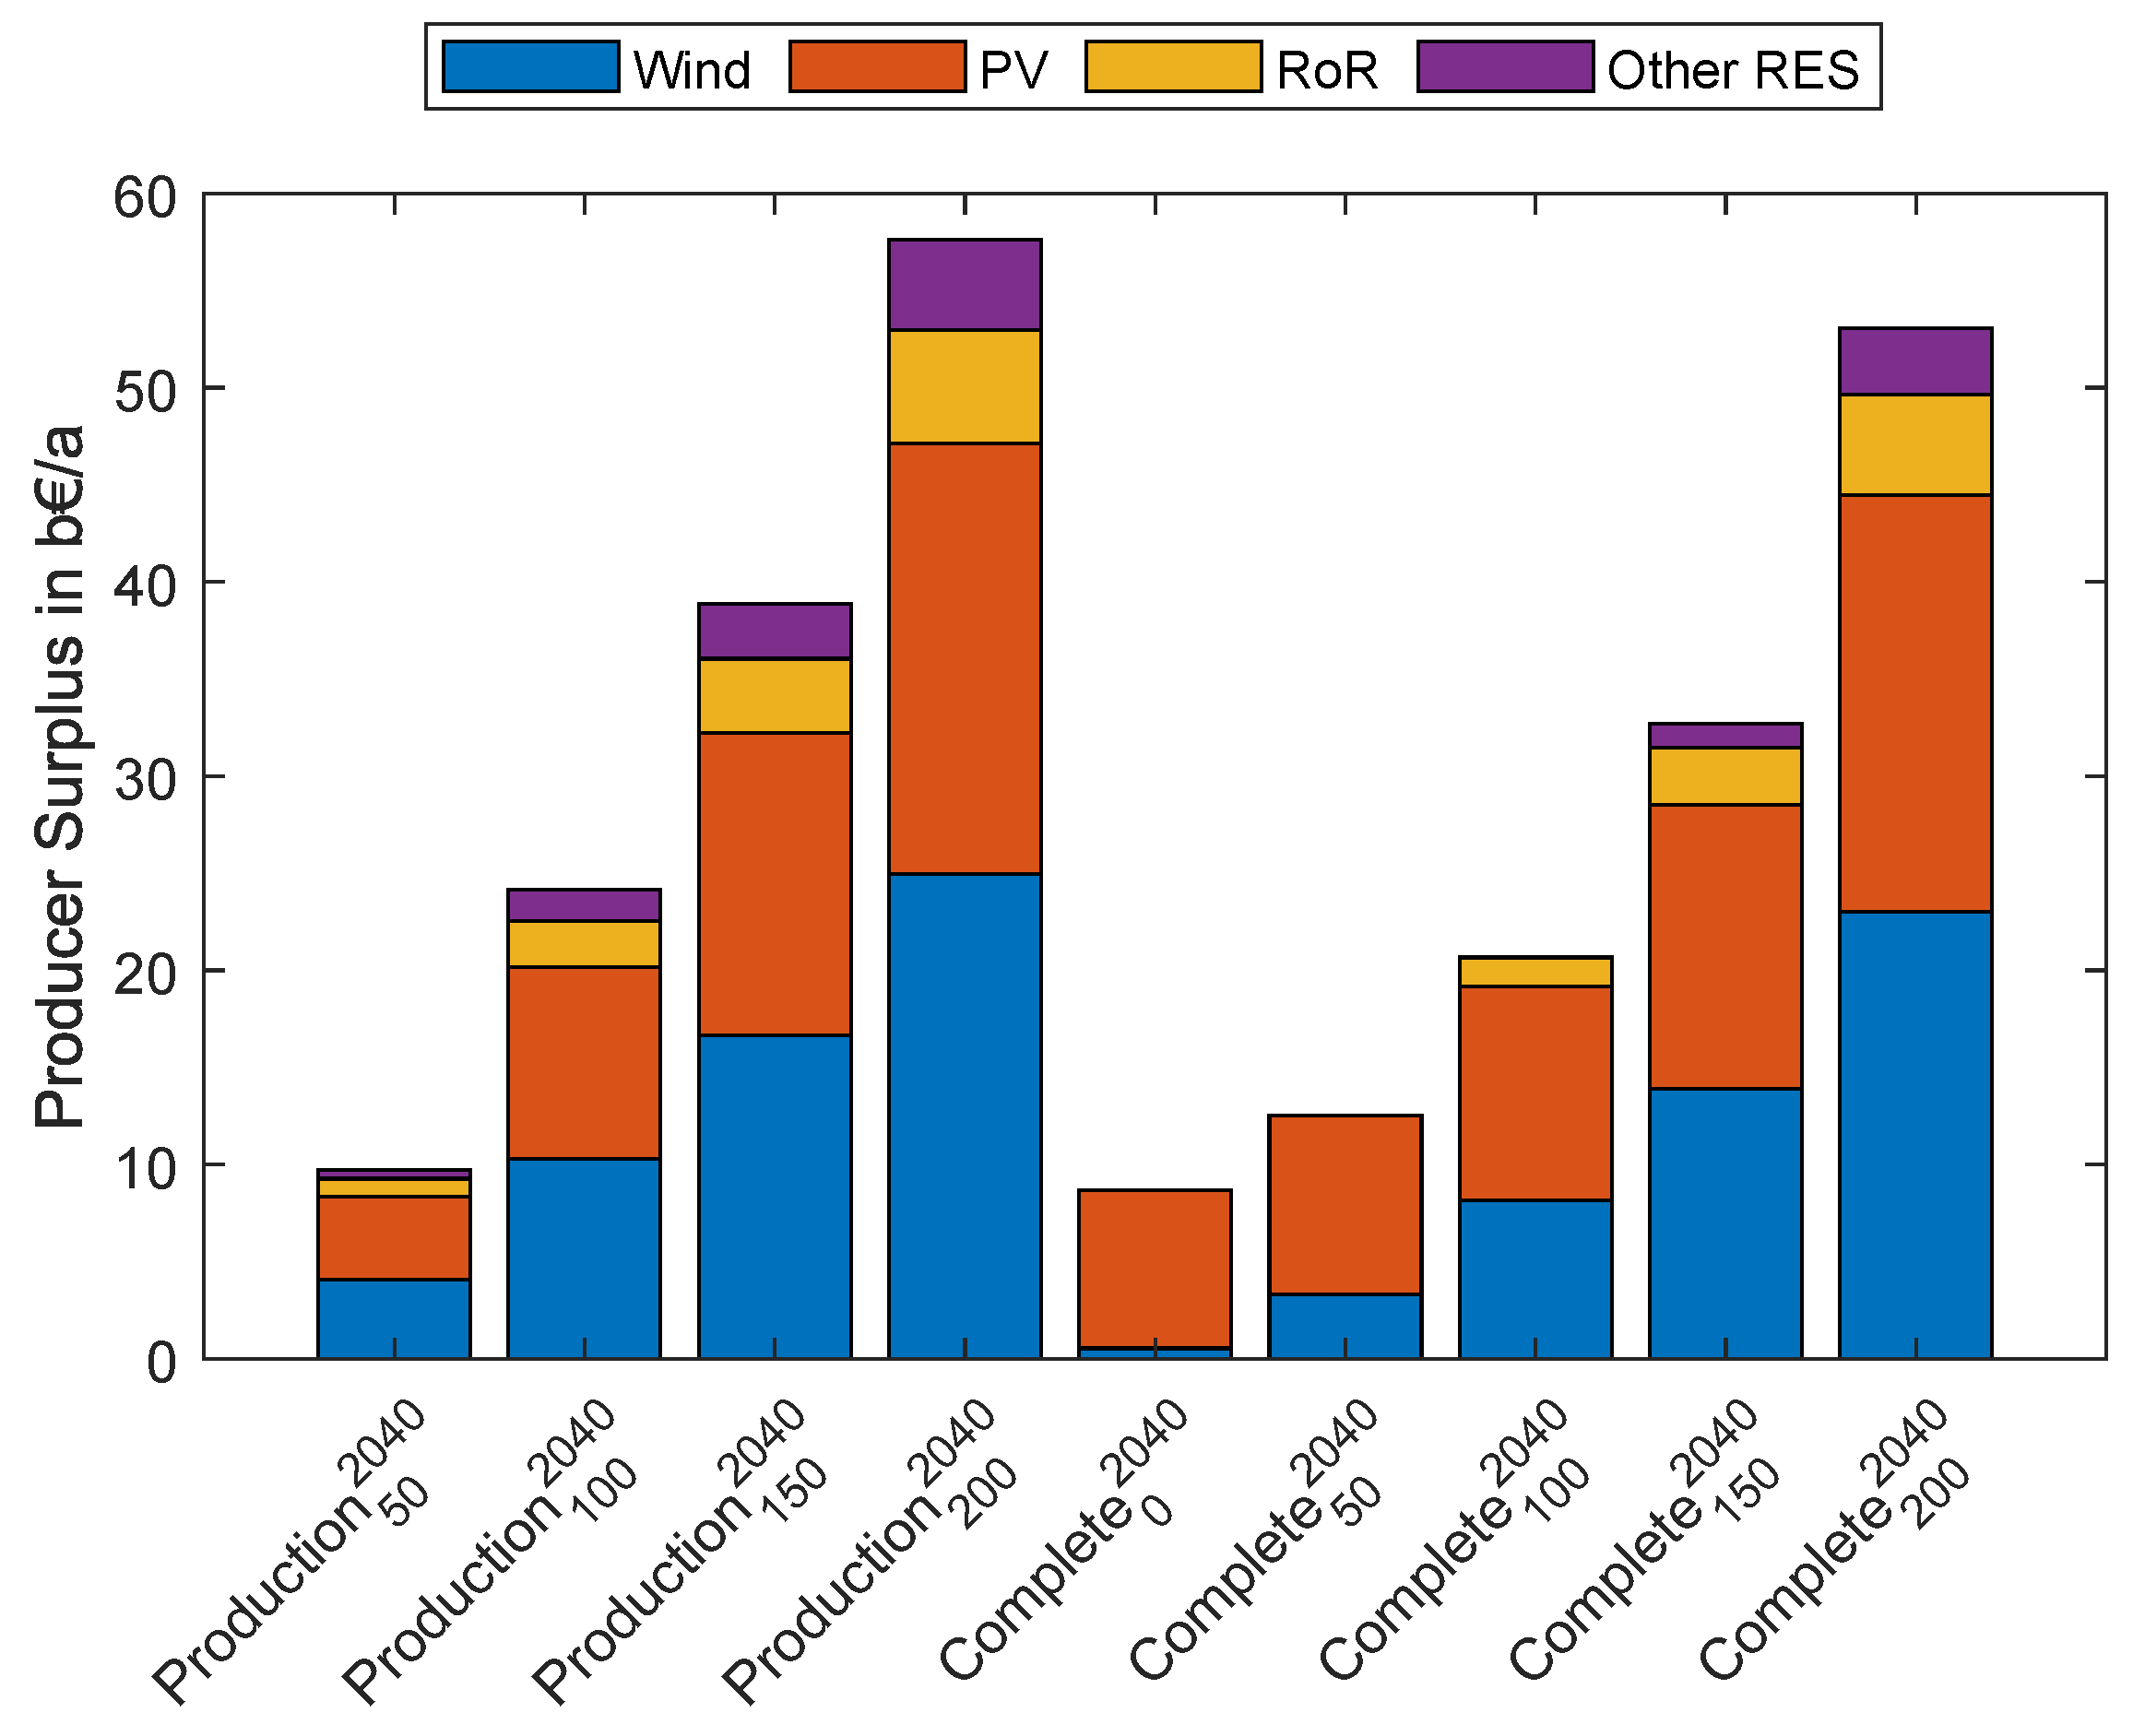
In contrast to thermal power plants, RES-E PS increase in 2030 (
Figure 10) and 2040 (
Figure 11) due to sector coupling.
On the one hand, the marginally small SRMC of RES-E (Equation (
1)) result in a PS increase if the clearing price of electricity rises (
Section 4.4). On the other hand, RES-E curtailment is reduced, resulting in additional electricity generation and a PS increase. In 2030, there is barely any difference in the PS between the two hydrogen coupling variants. In contrast, in 2040, fuel cell utilization increases the PS at a hydrogen price of 50 EUR/MWh
H2. Hence, the PS increase due to higher electricity prices and reduced curtailment outweighs the PS reduction due to lower peak prices. Starting at 100 EUR/MWh
H2, hydrogen-to-electricity conversion results in a PS reduction compared to pure hydrogen production due to lower electricity price peaks.
5.3.3. Hydrogen Producer Surplus
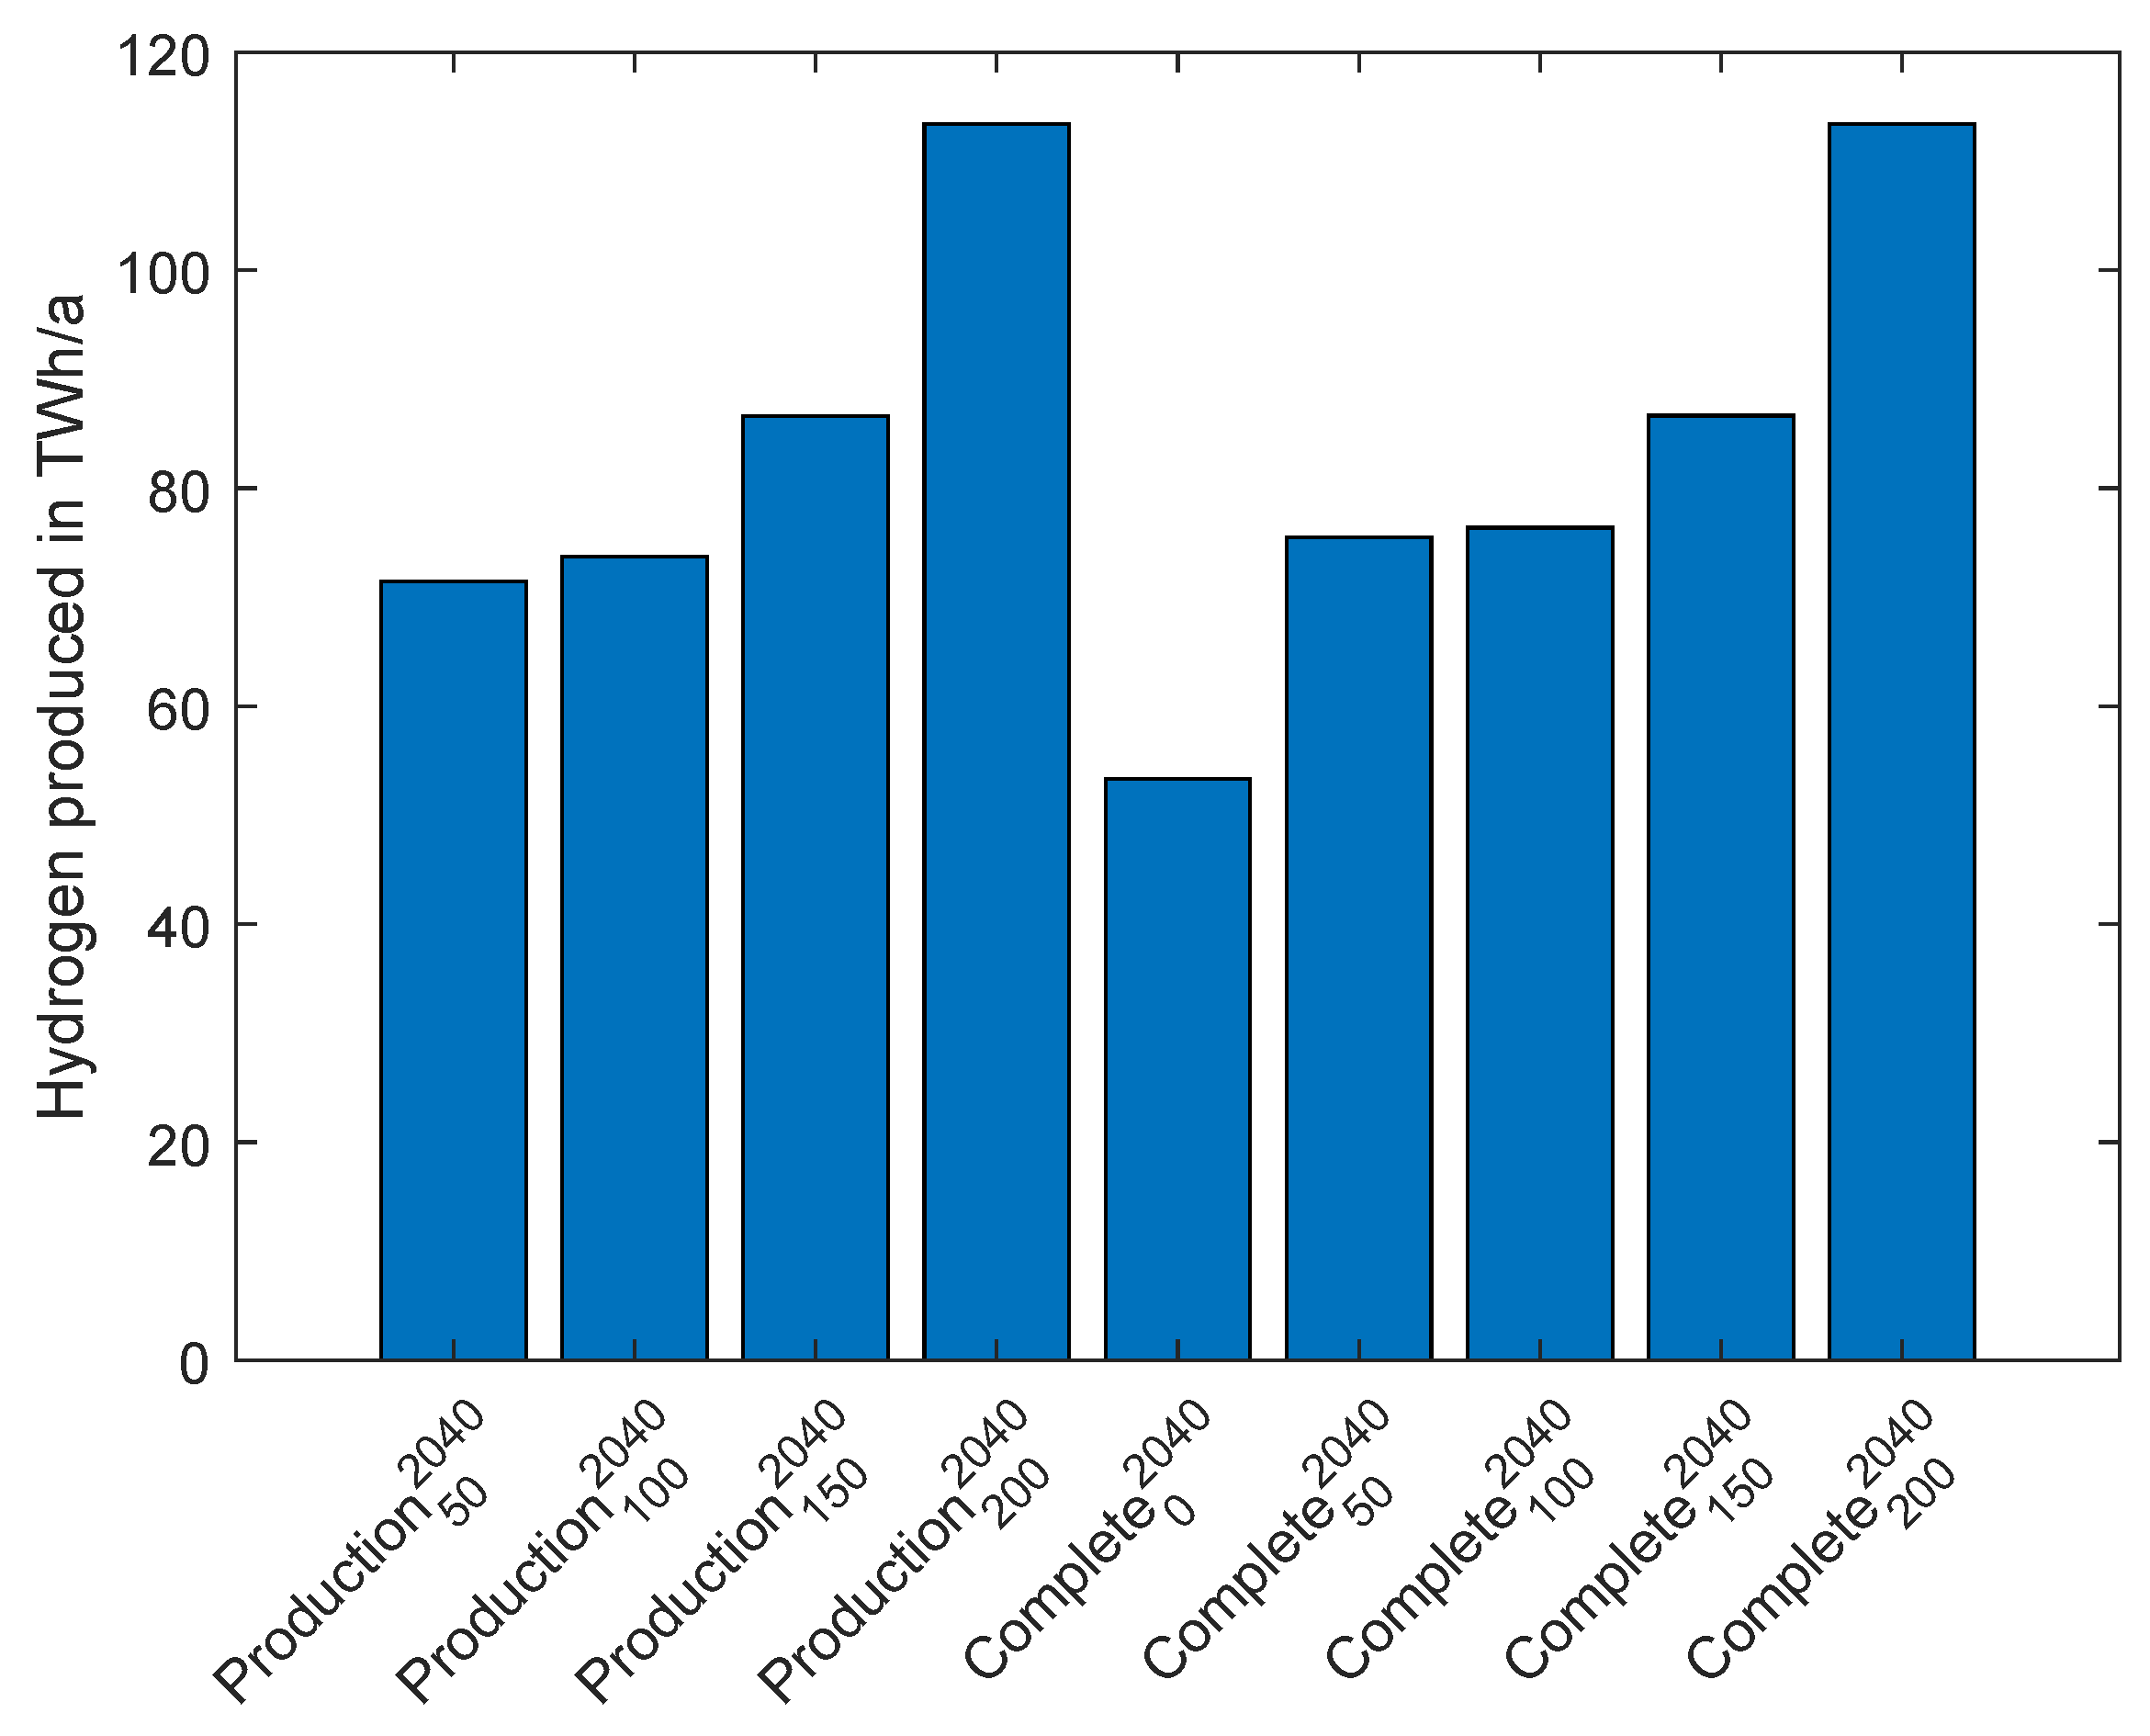
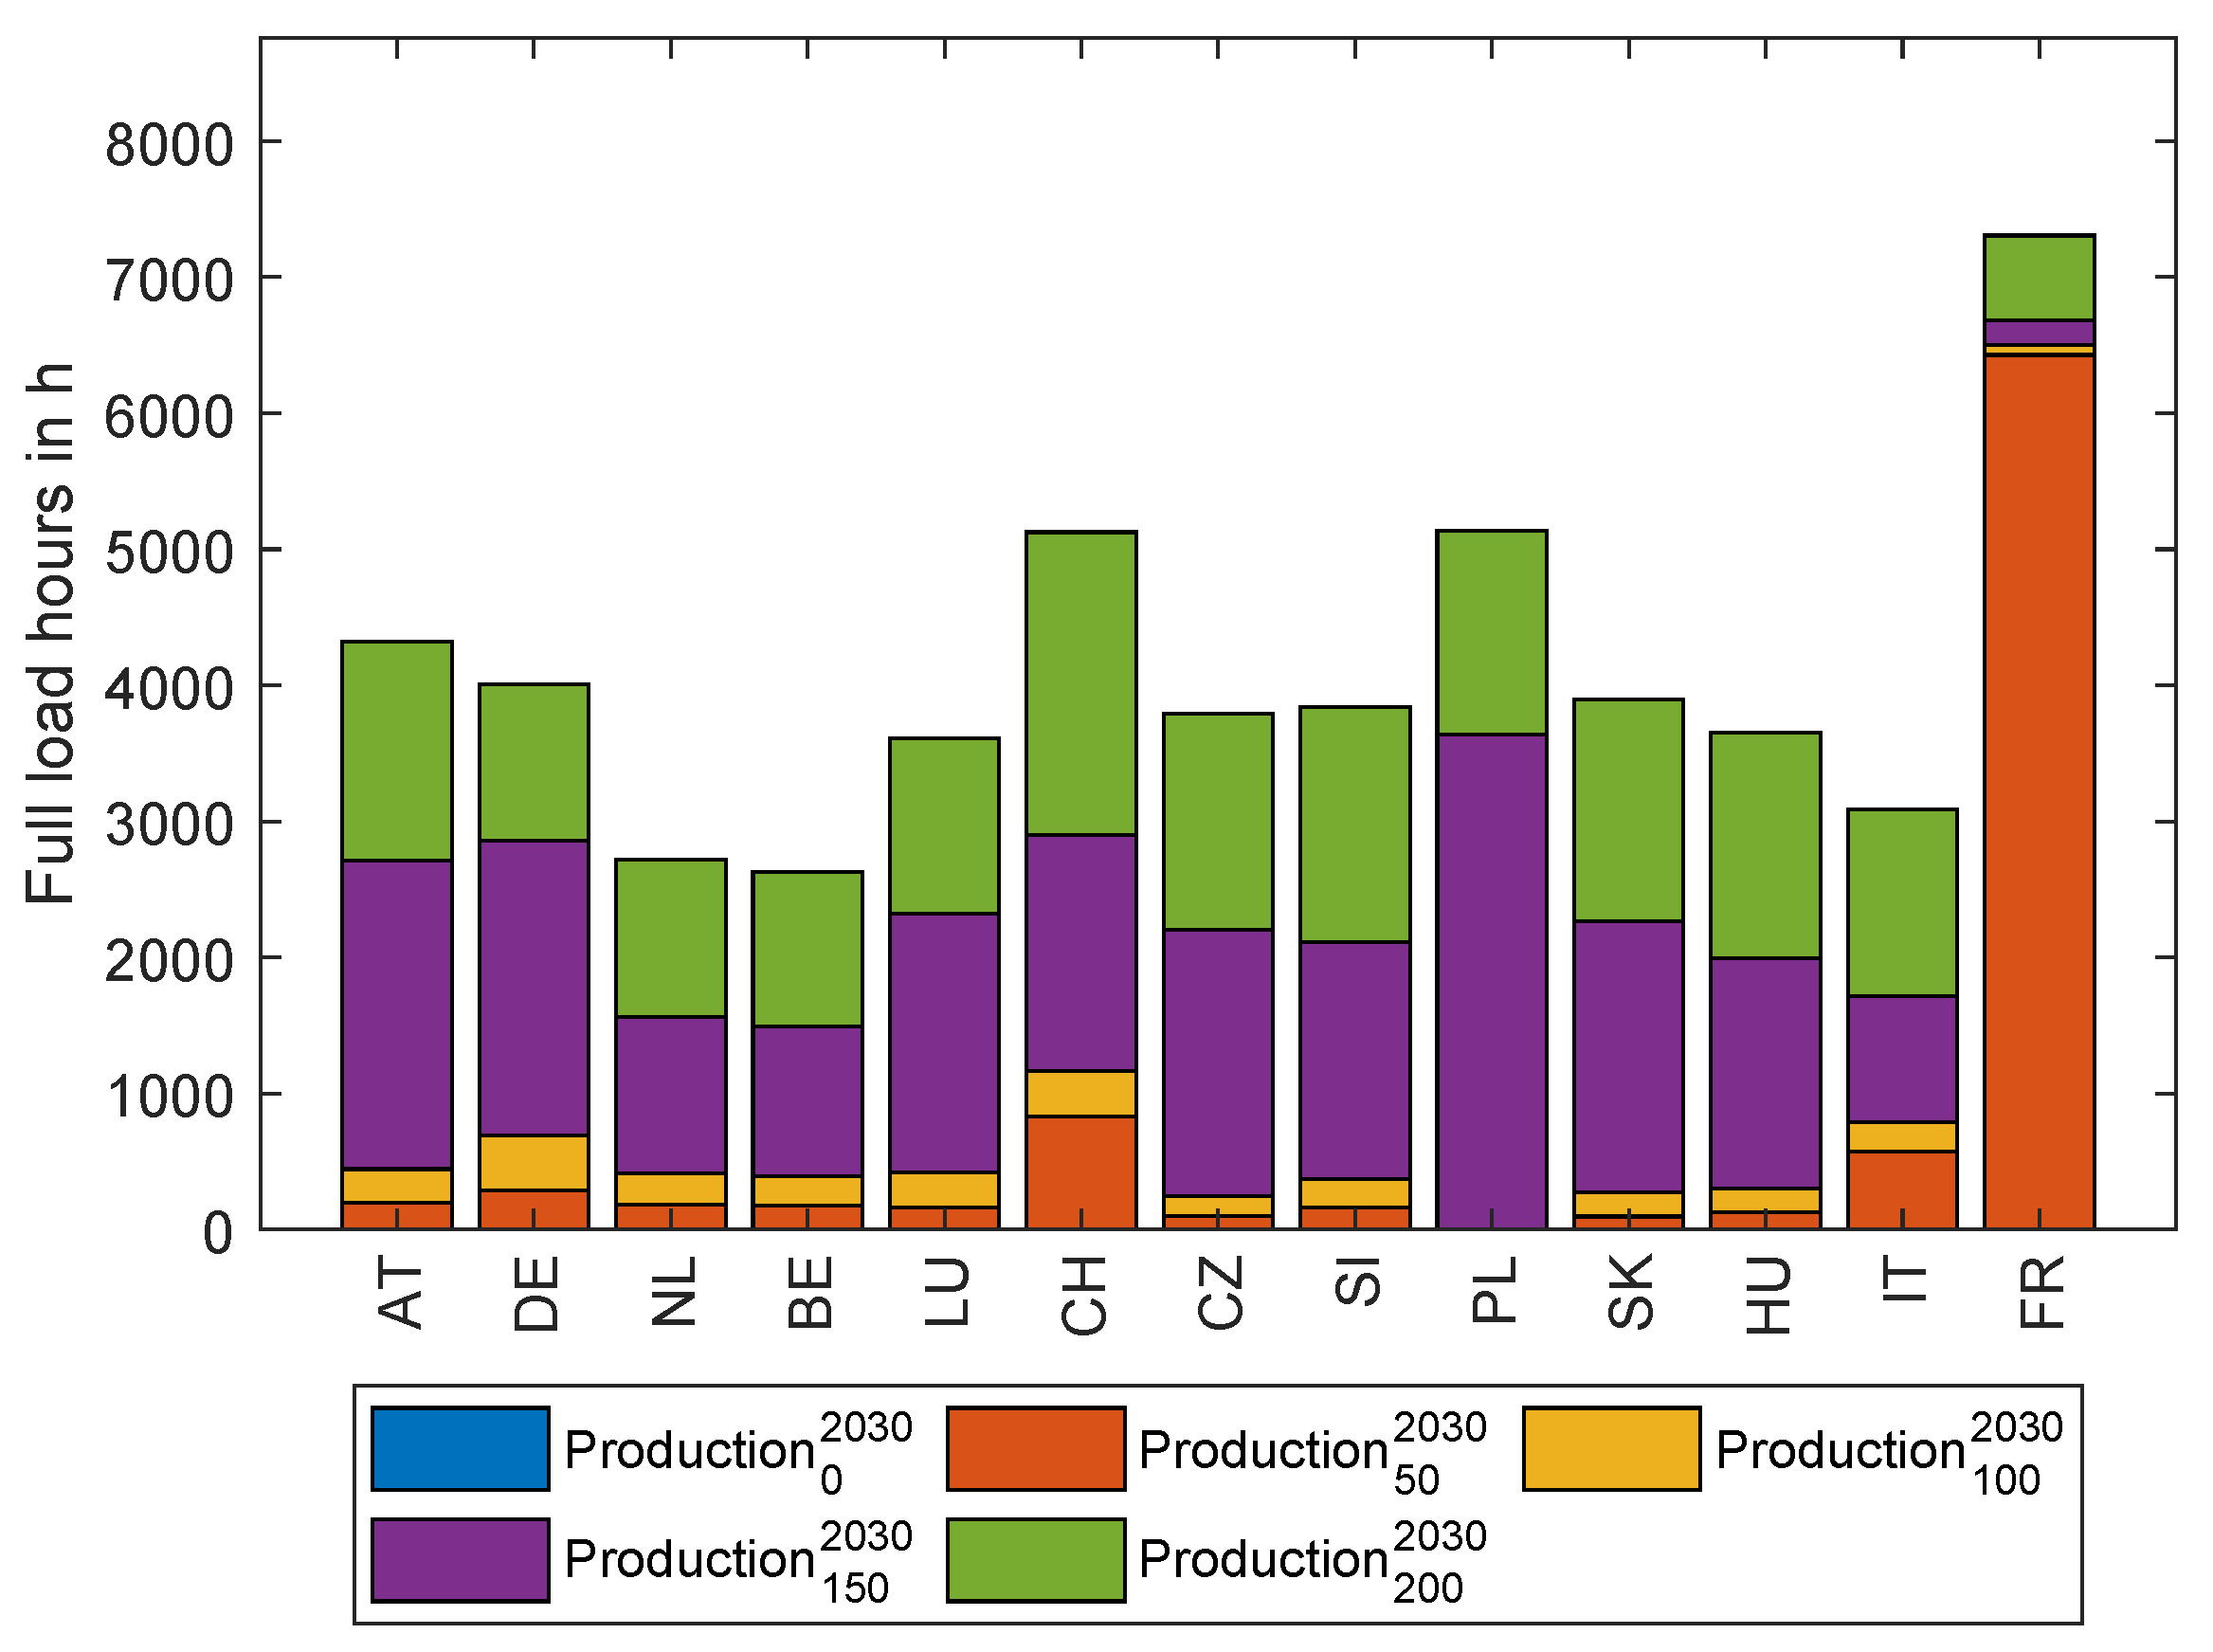
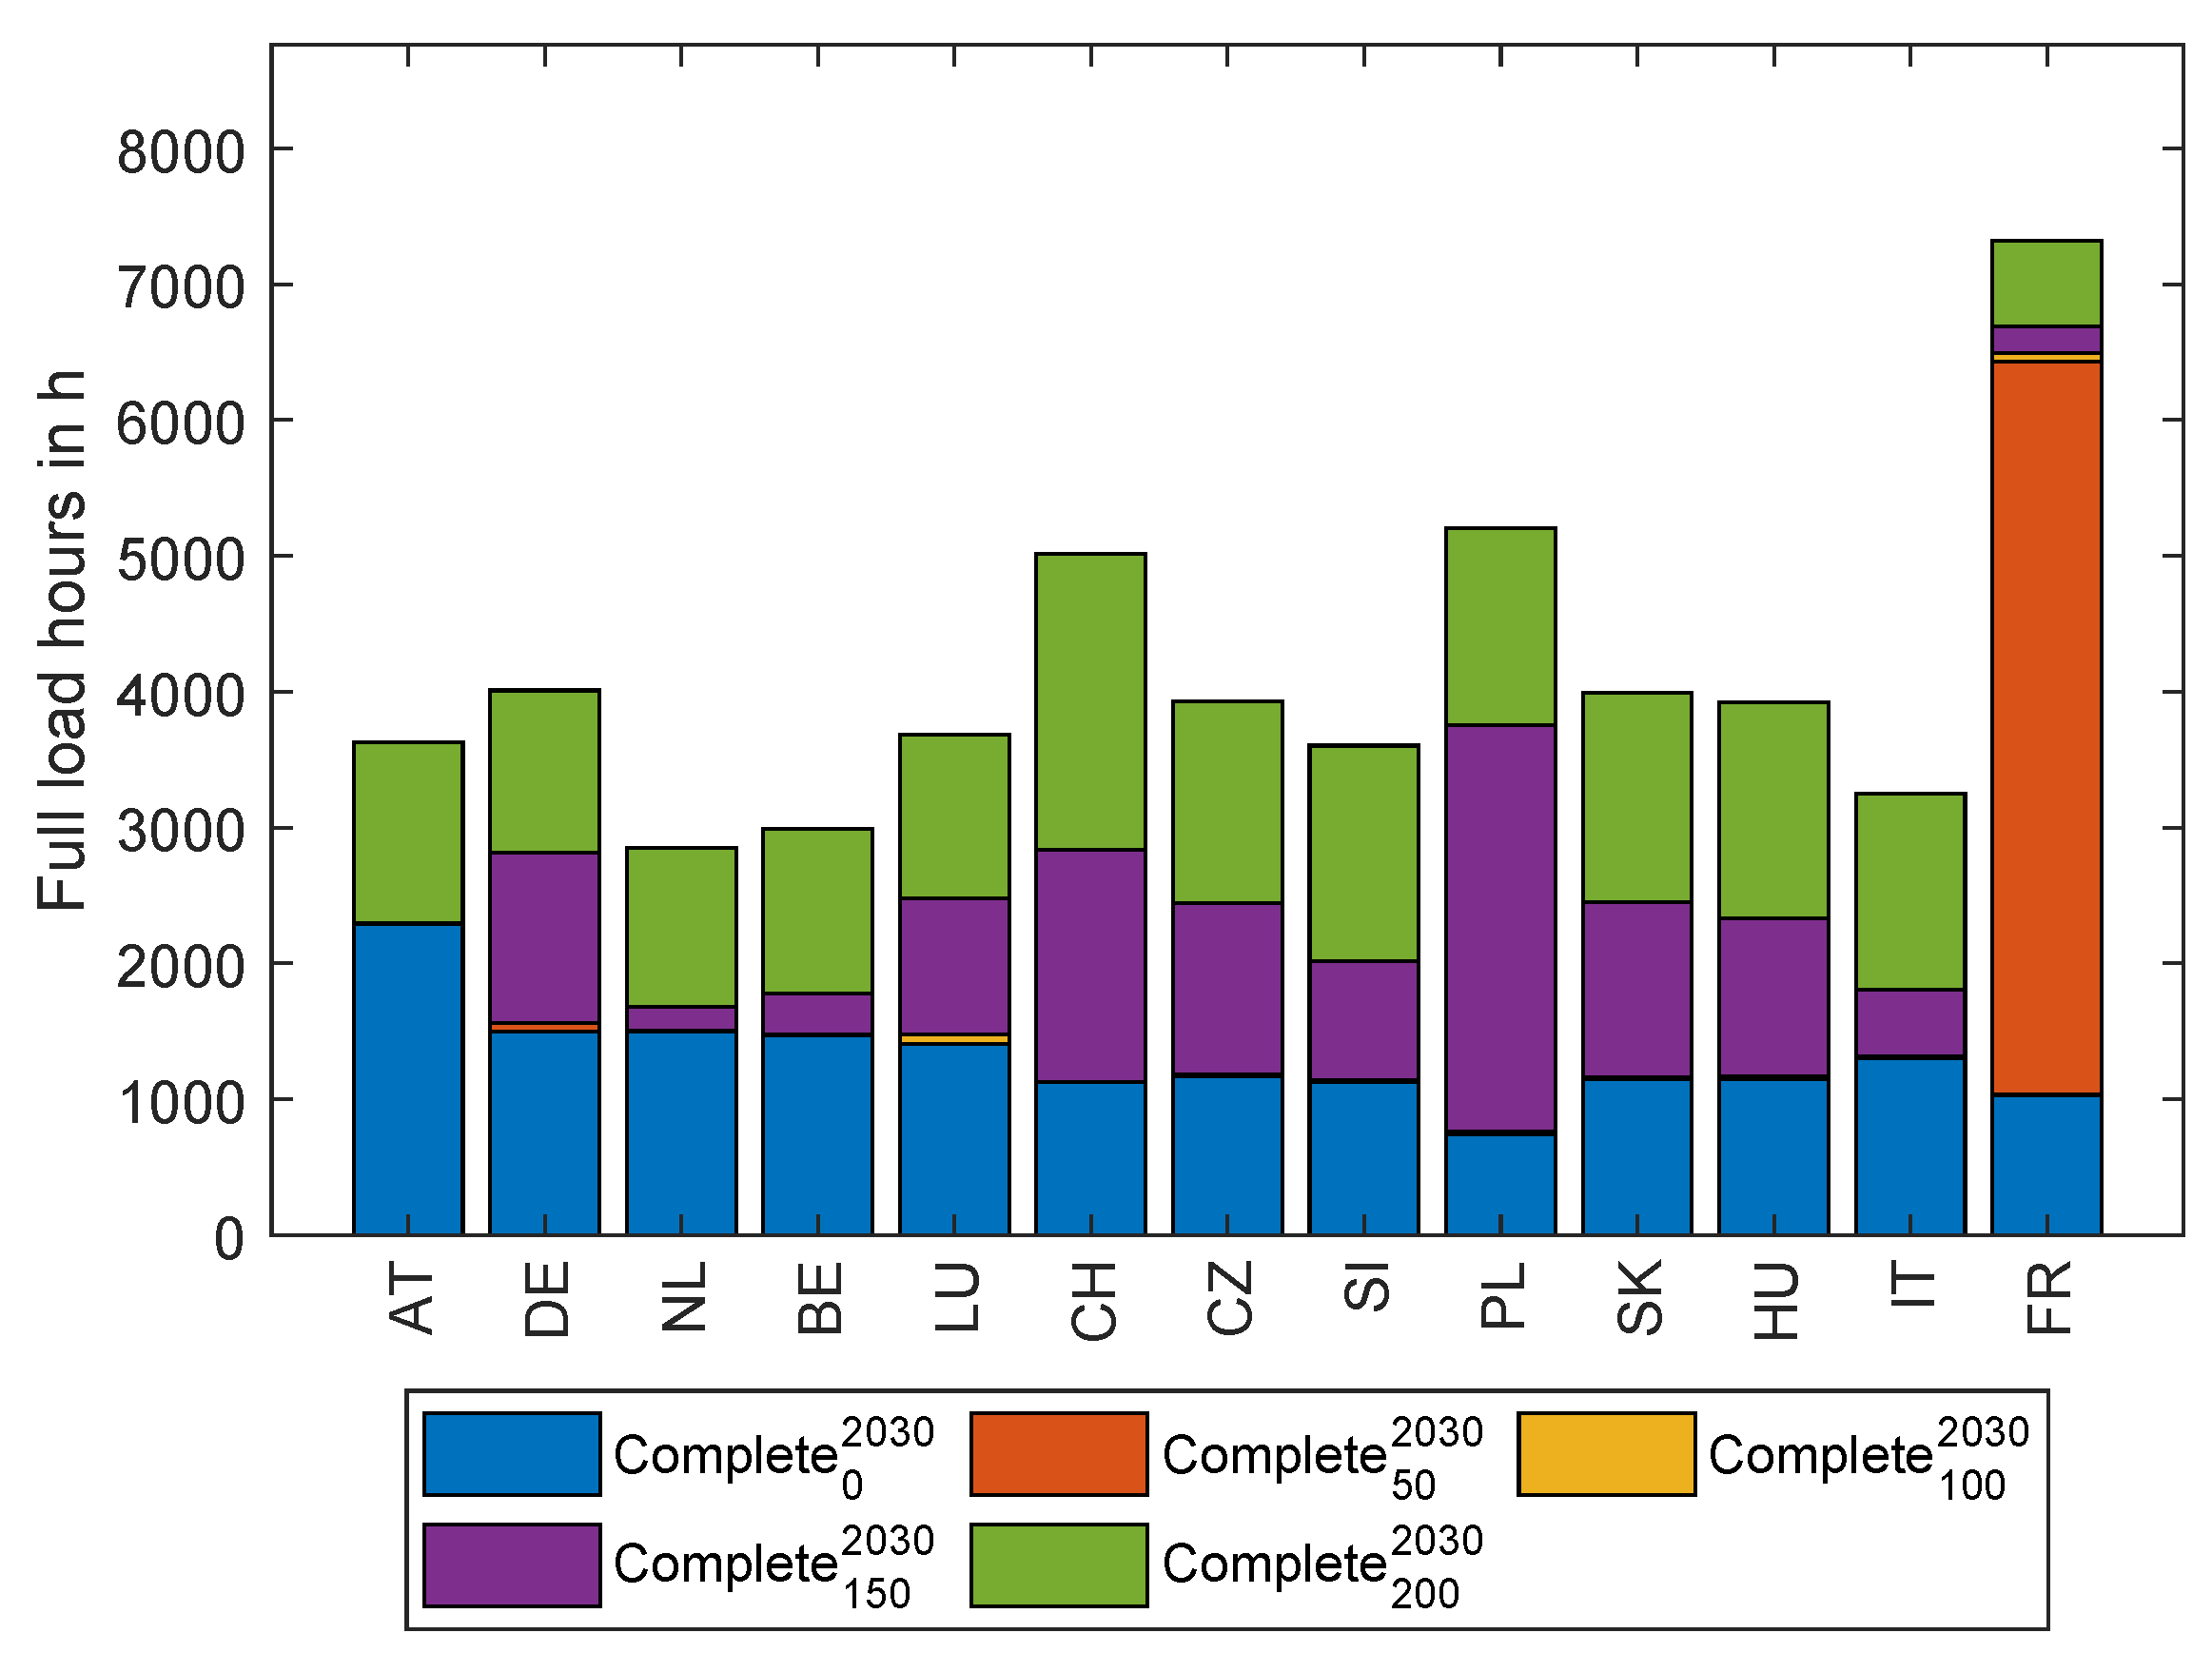
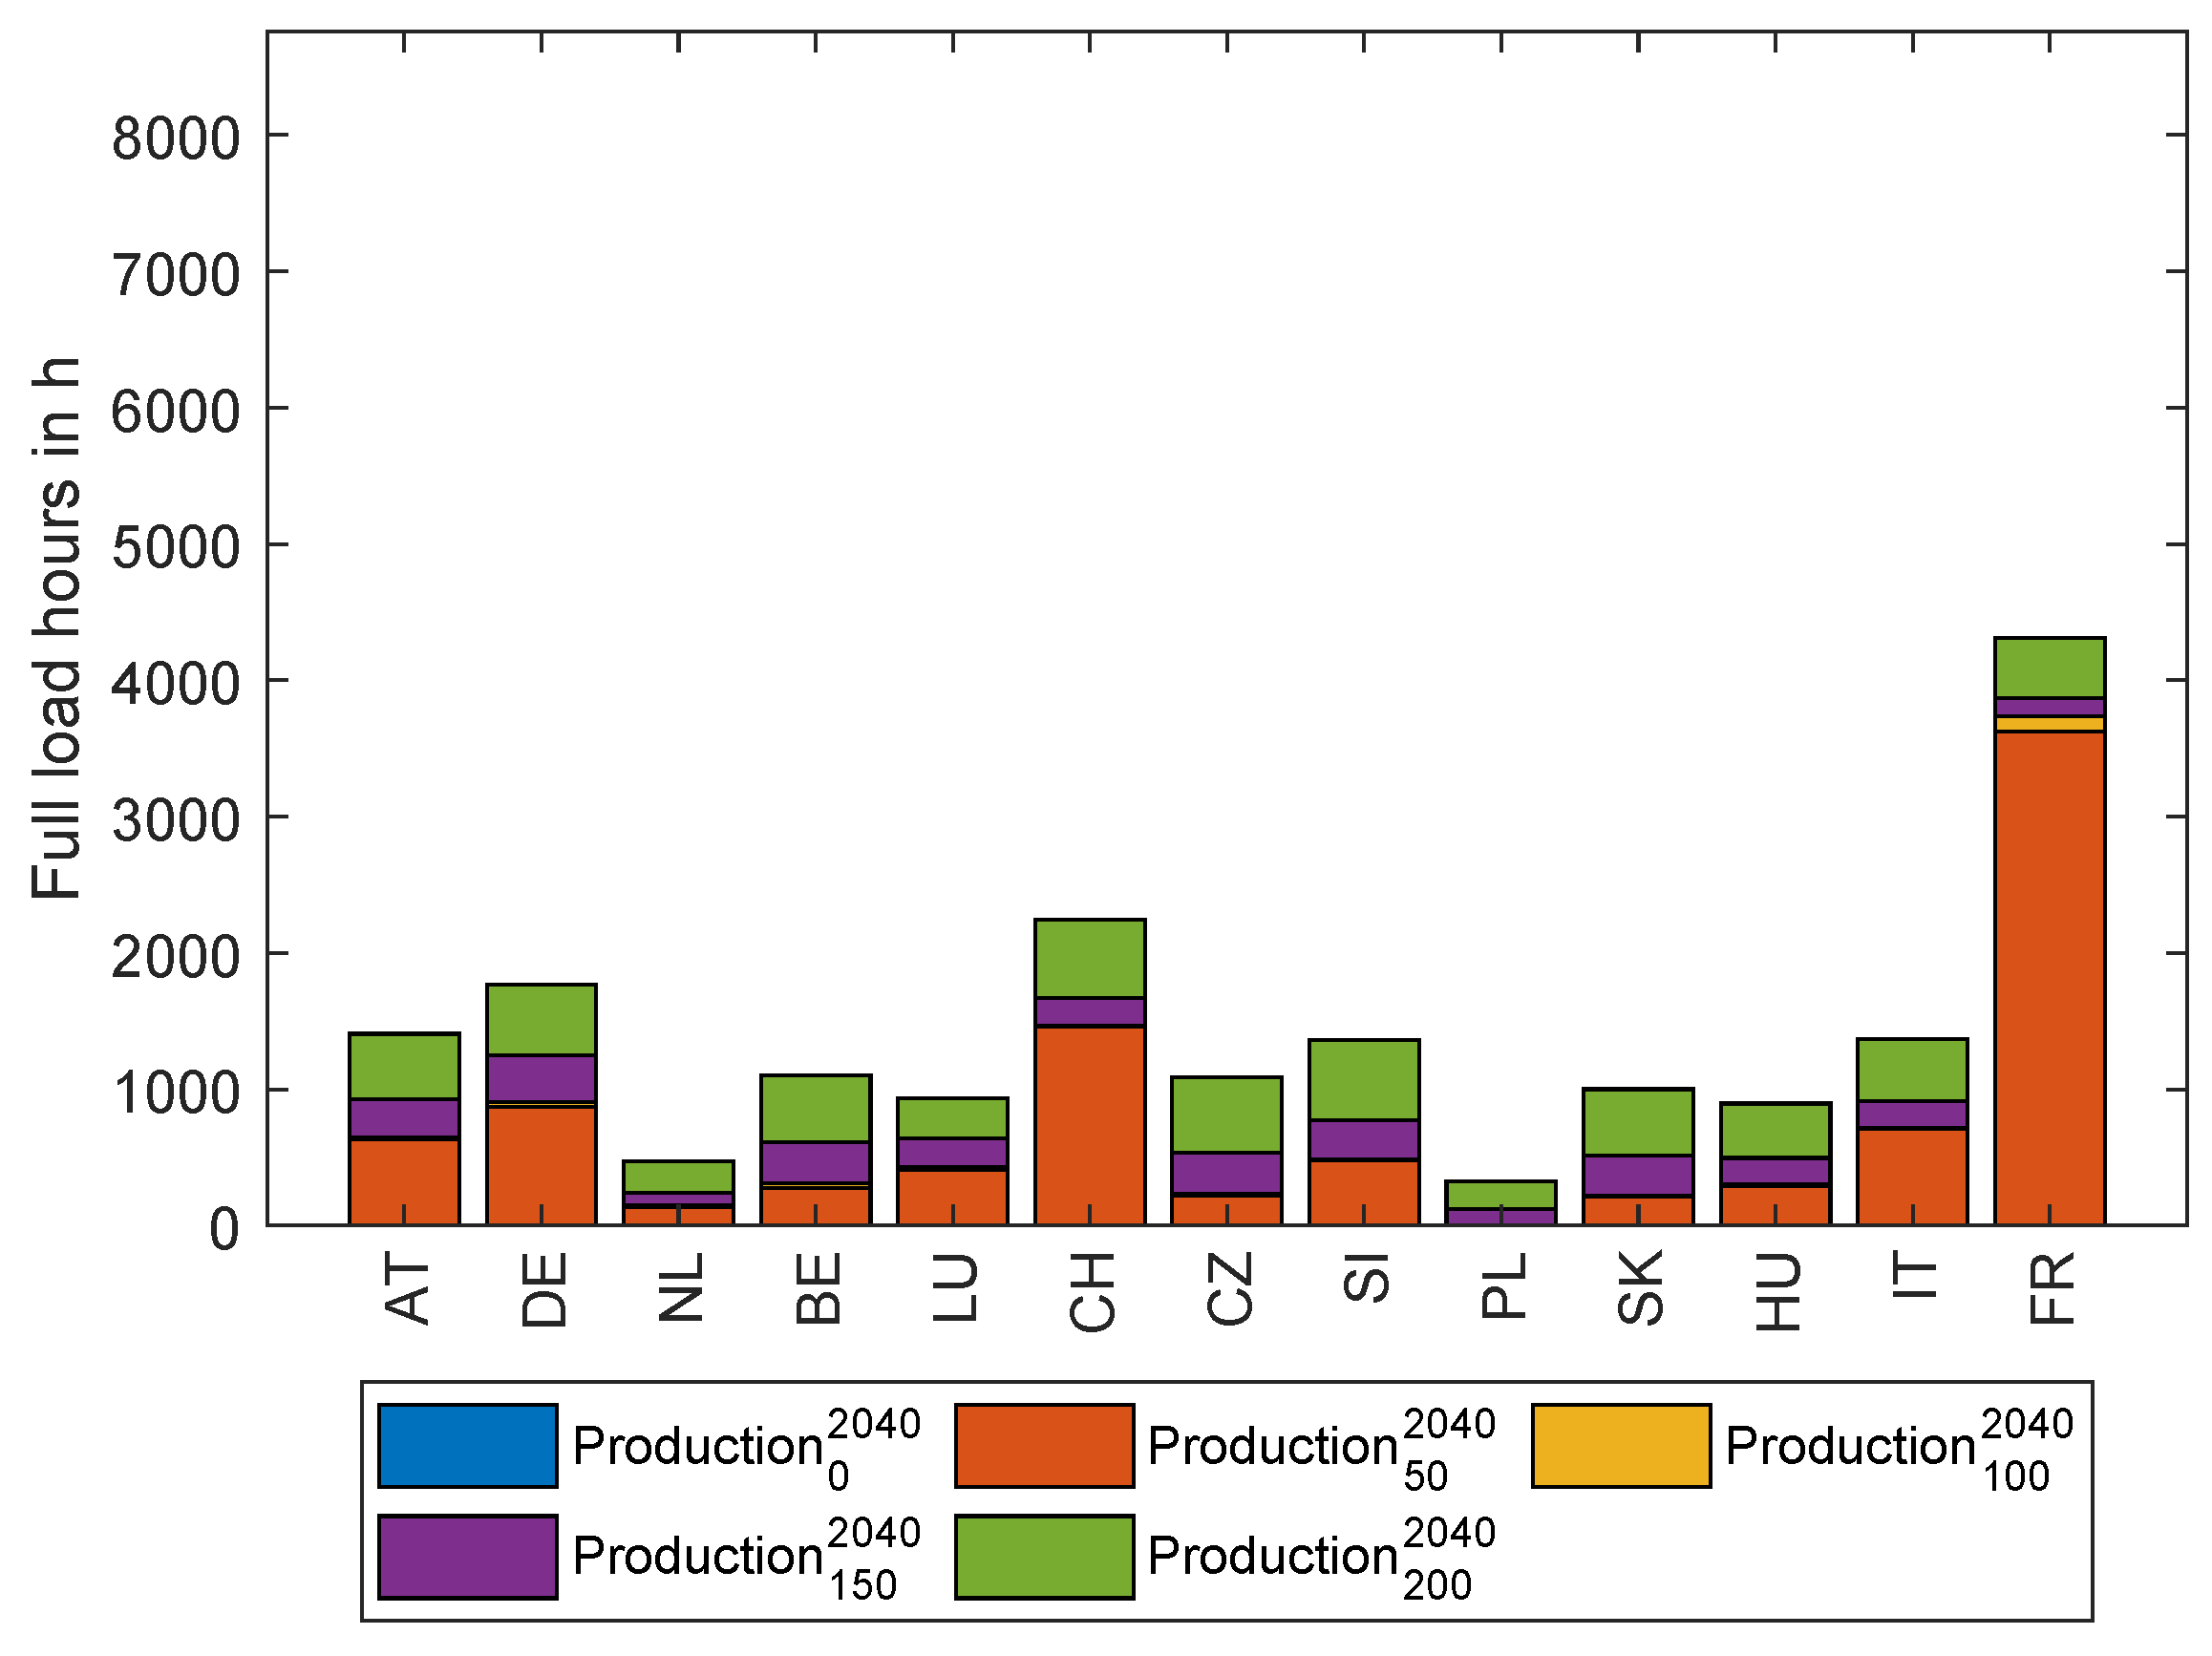
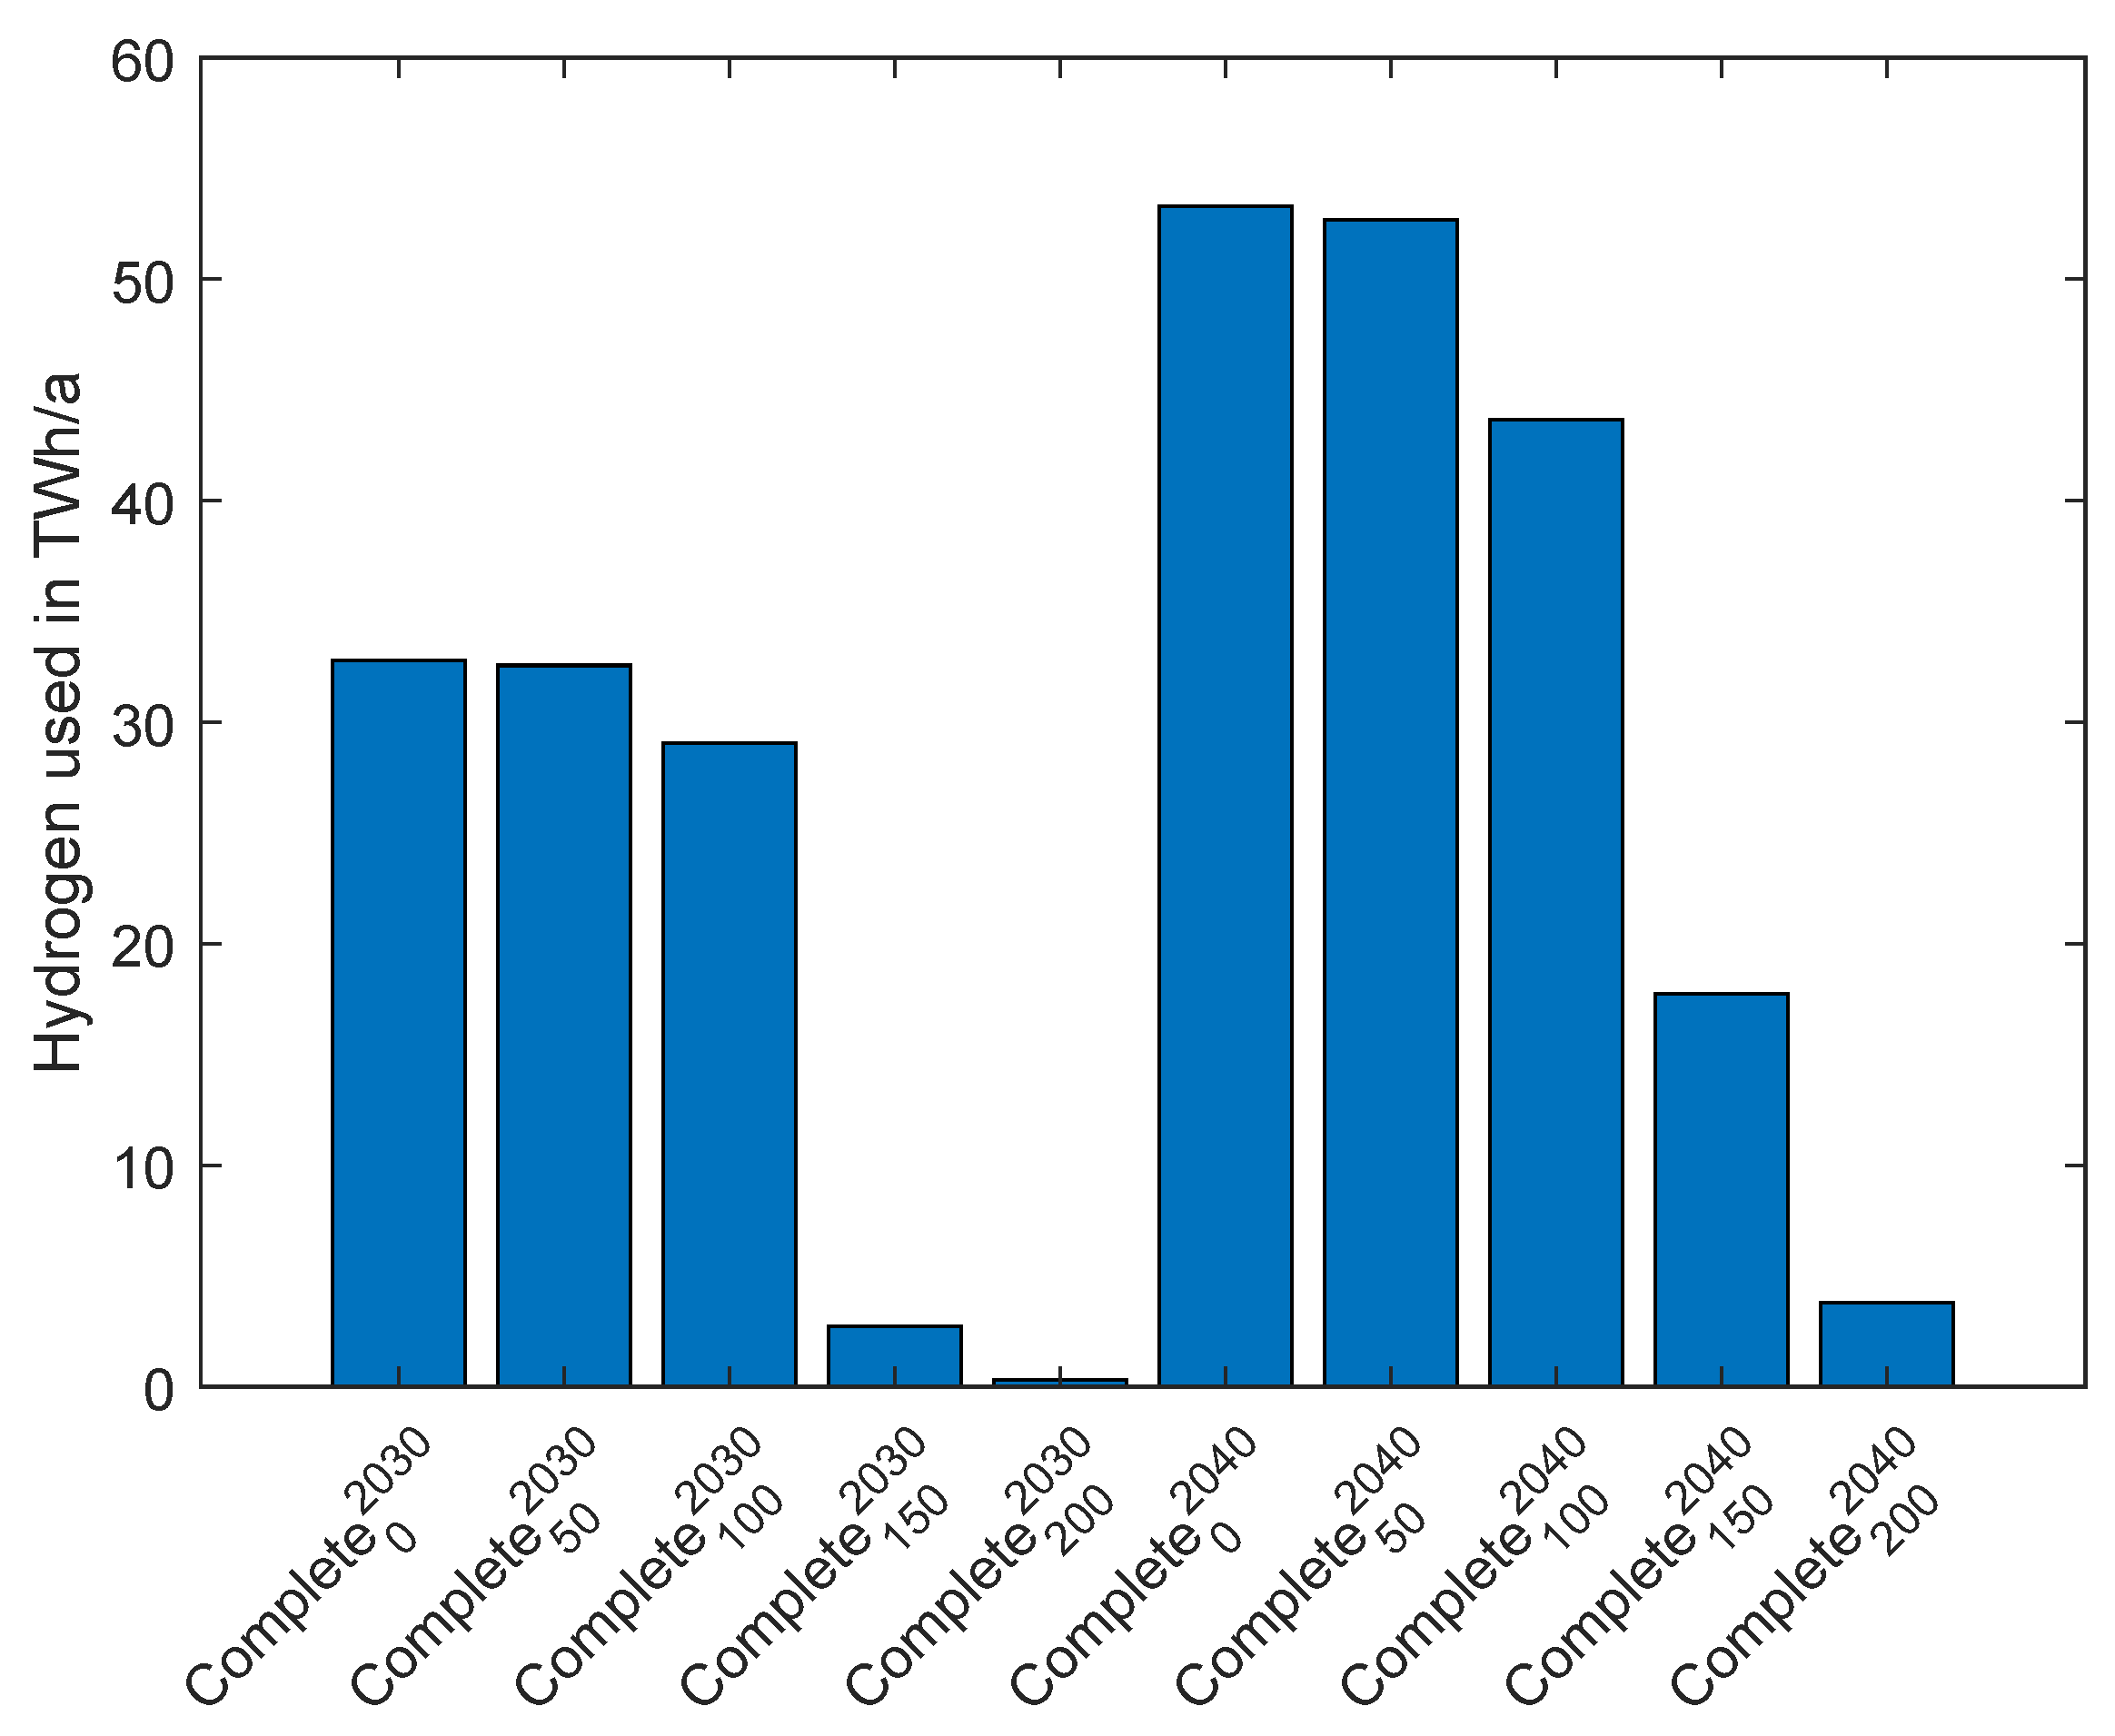
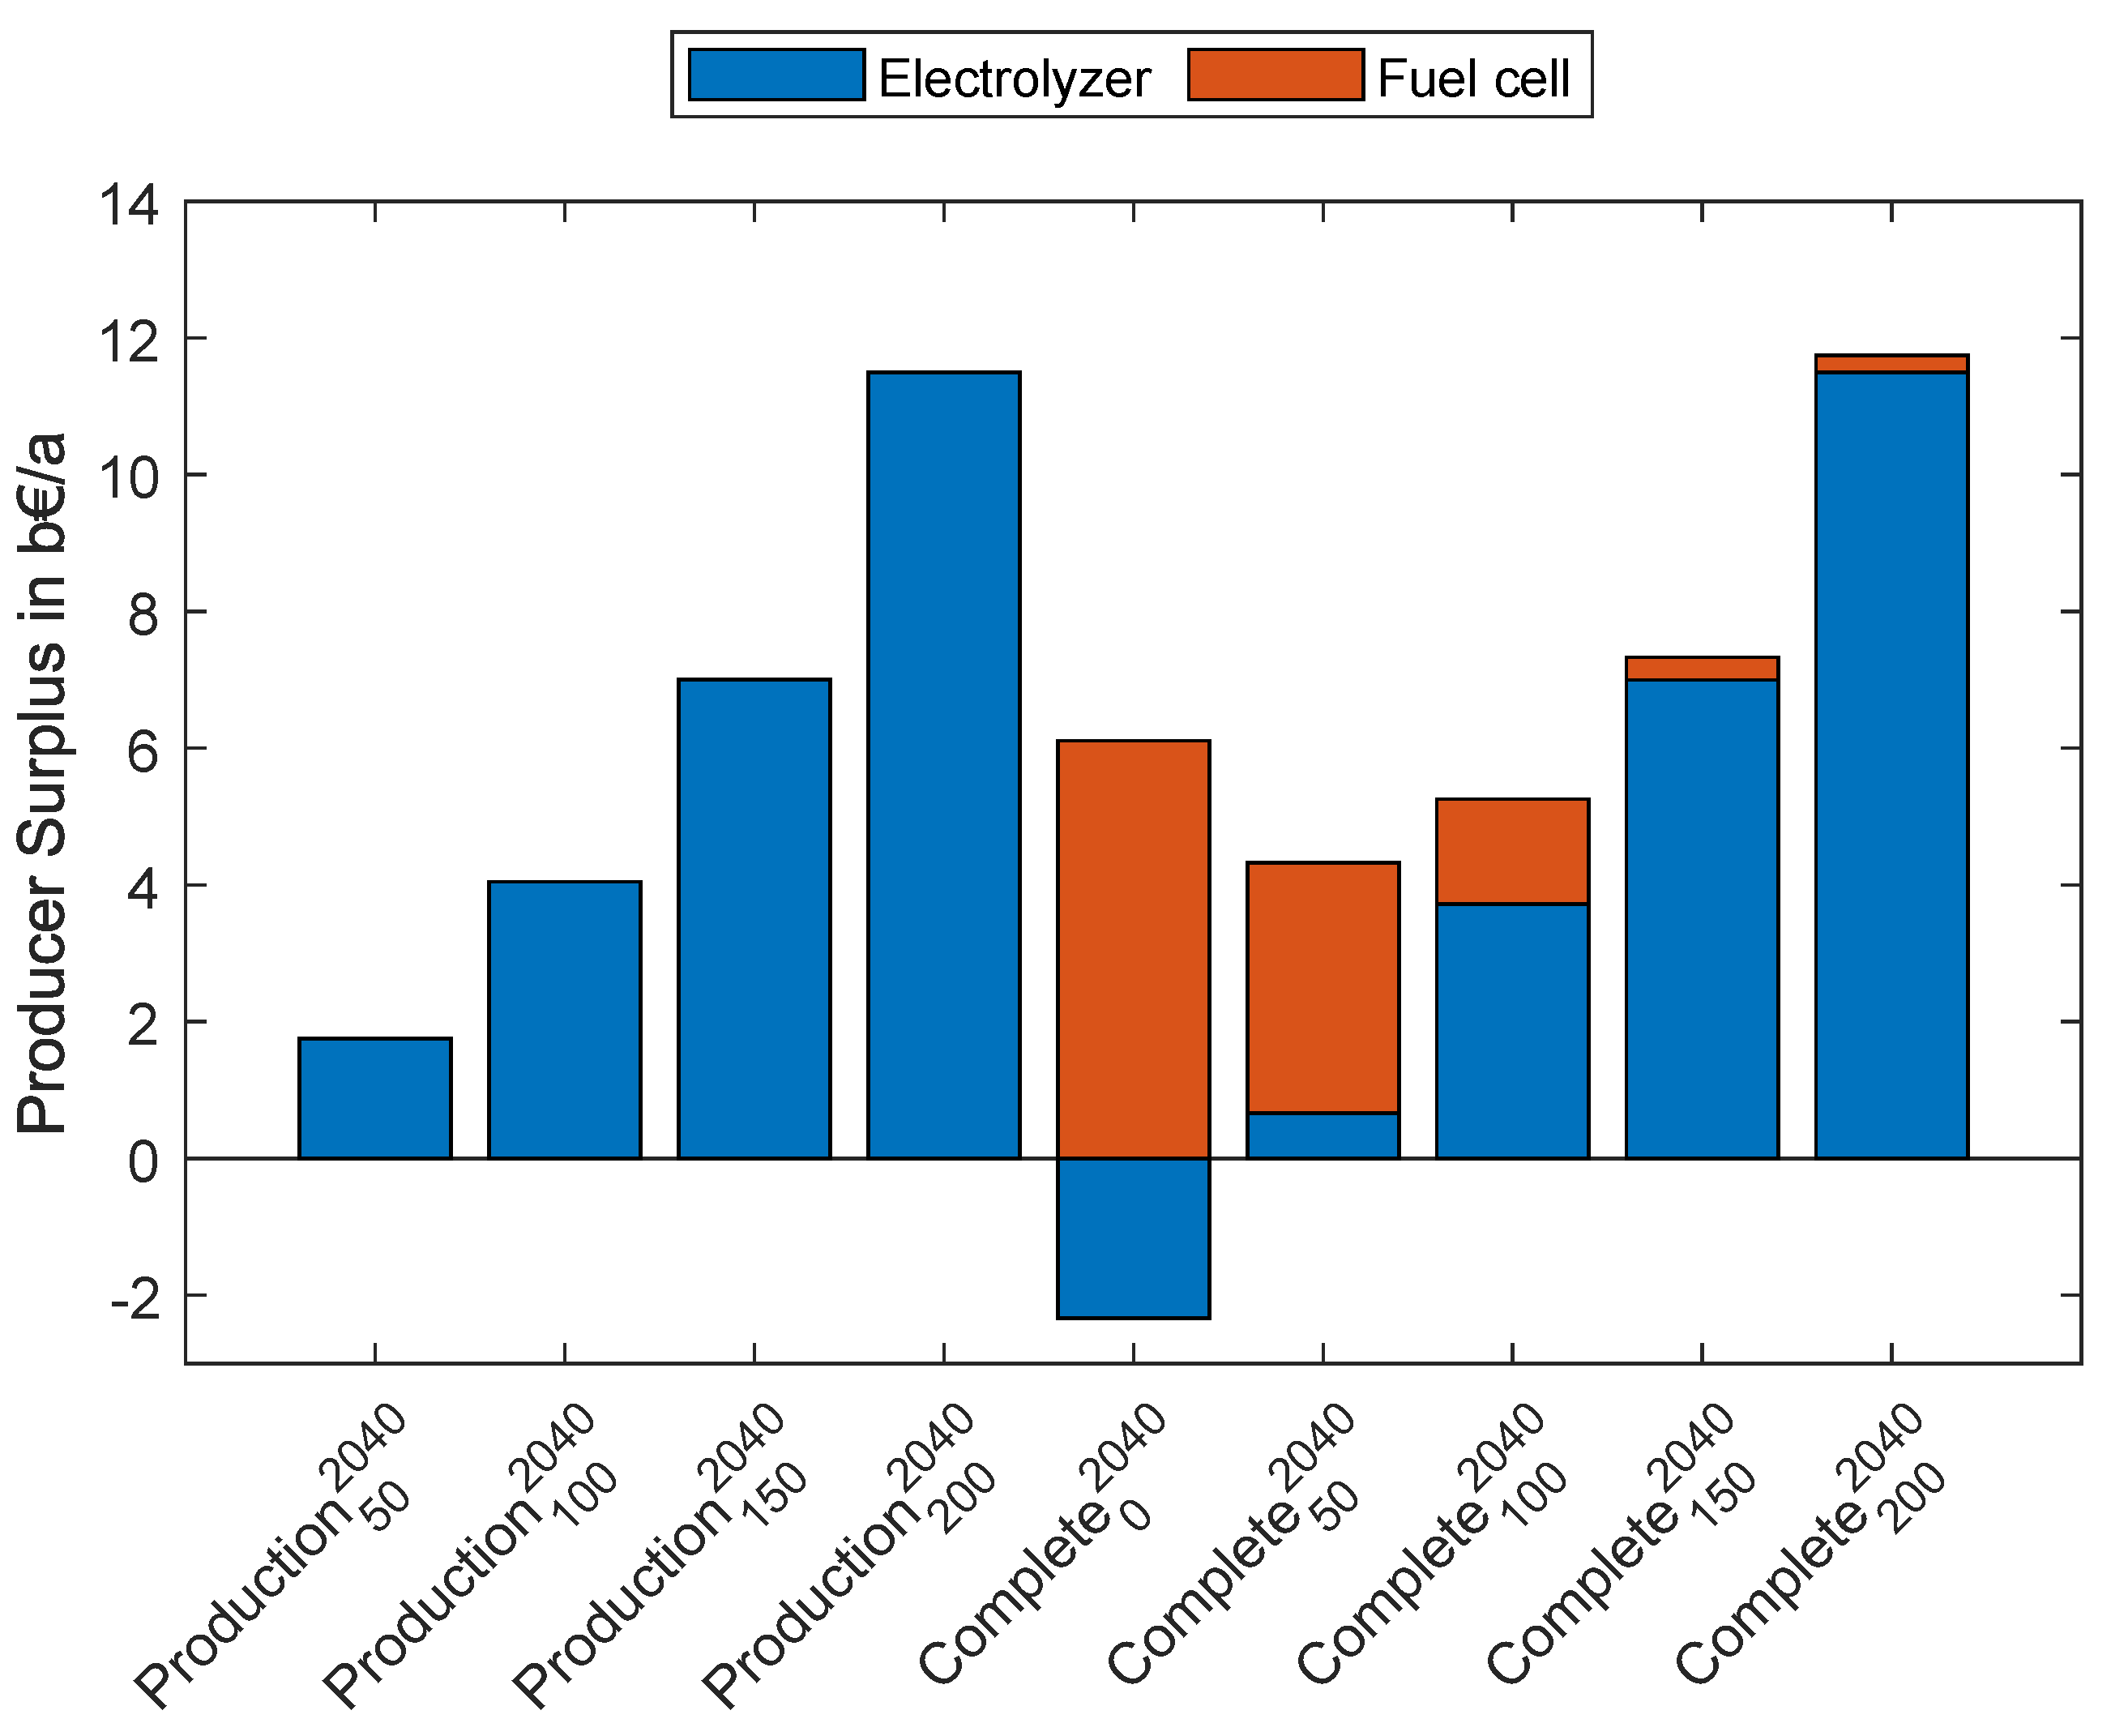
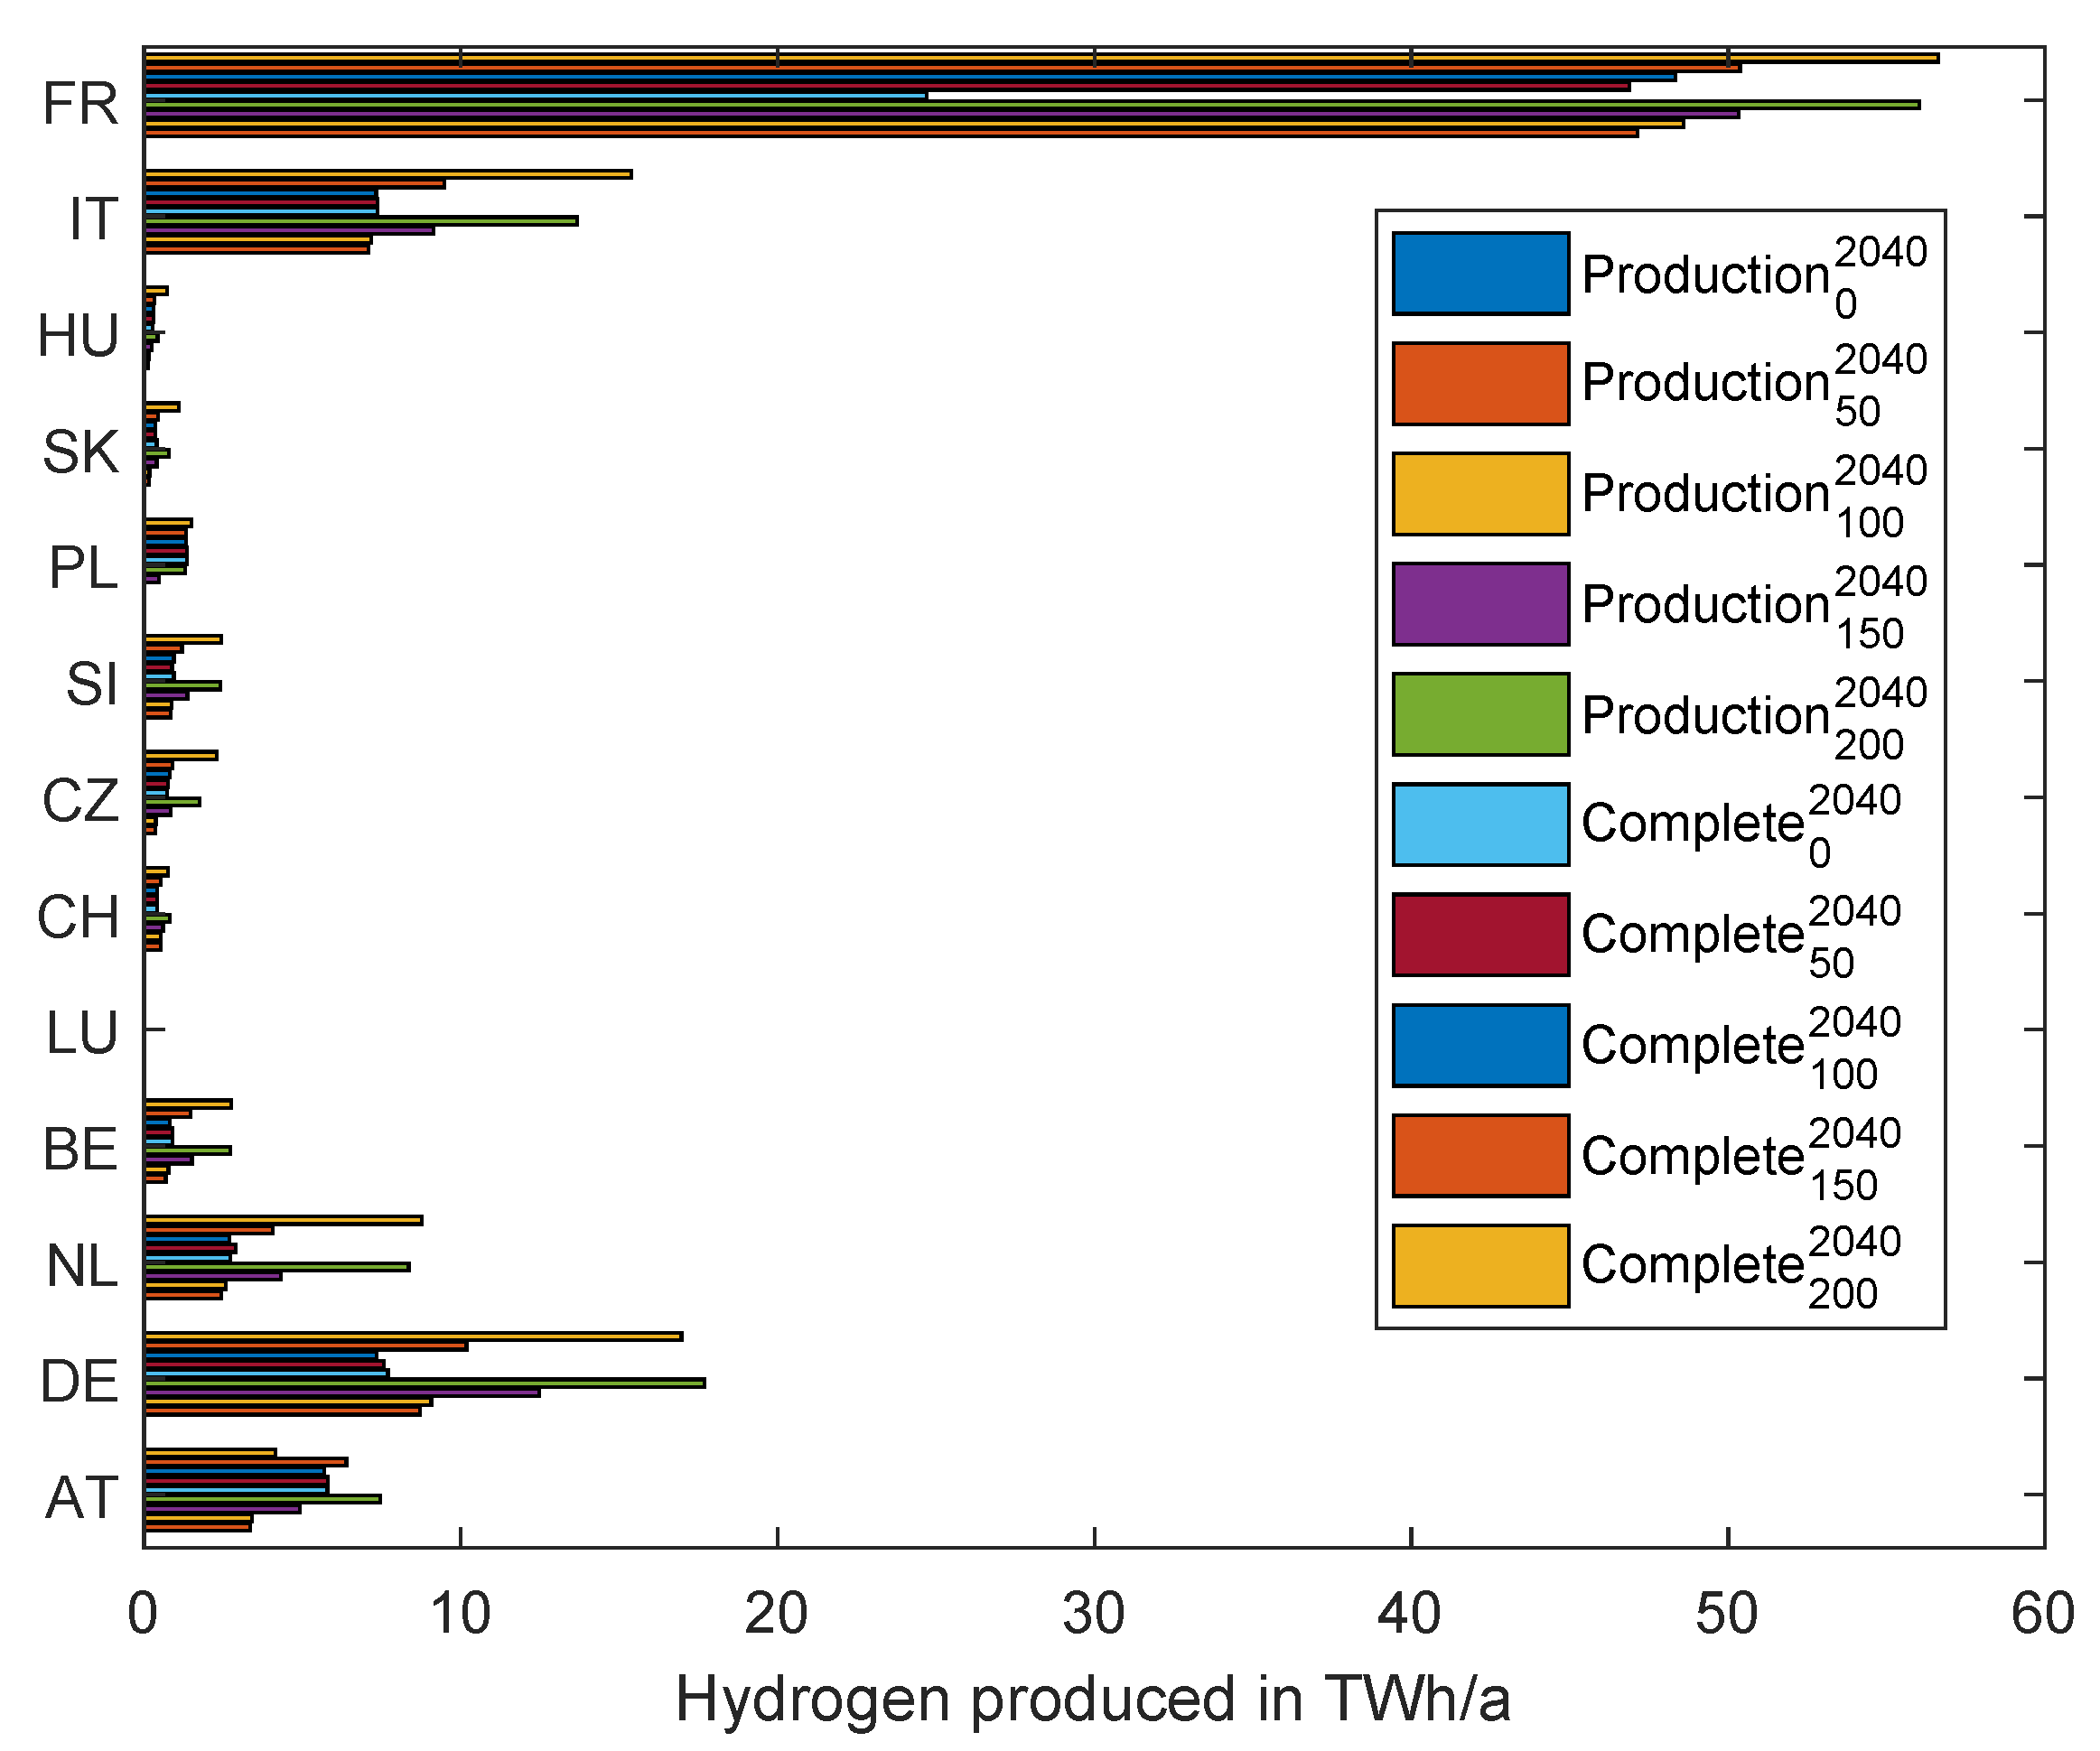
This section describes the PS of hydrogen market participants, electrolyzers, and fuel cells. Although the installed electrolyzer capacity increases by 163% (
Table 1), the electrolyzer PS does not increase in 2040 (
Figure 12) compared to 2030 (
Figure 13). A detailed country-by-country examination of hydrogen production reveals that it changes between 2030 (
Figure 14) and 2040 (
Figure 15). For instance, it increases in Austria and France, while falling in the Netherlands and Poland. More detailed hydrogen production results, including full-load hours, can be found in
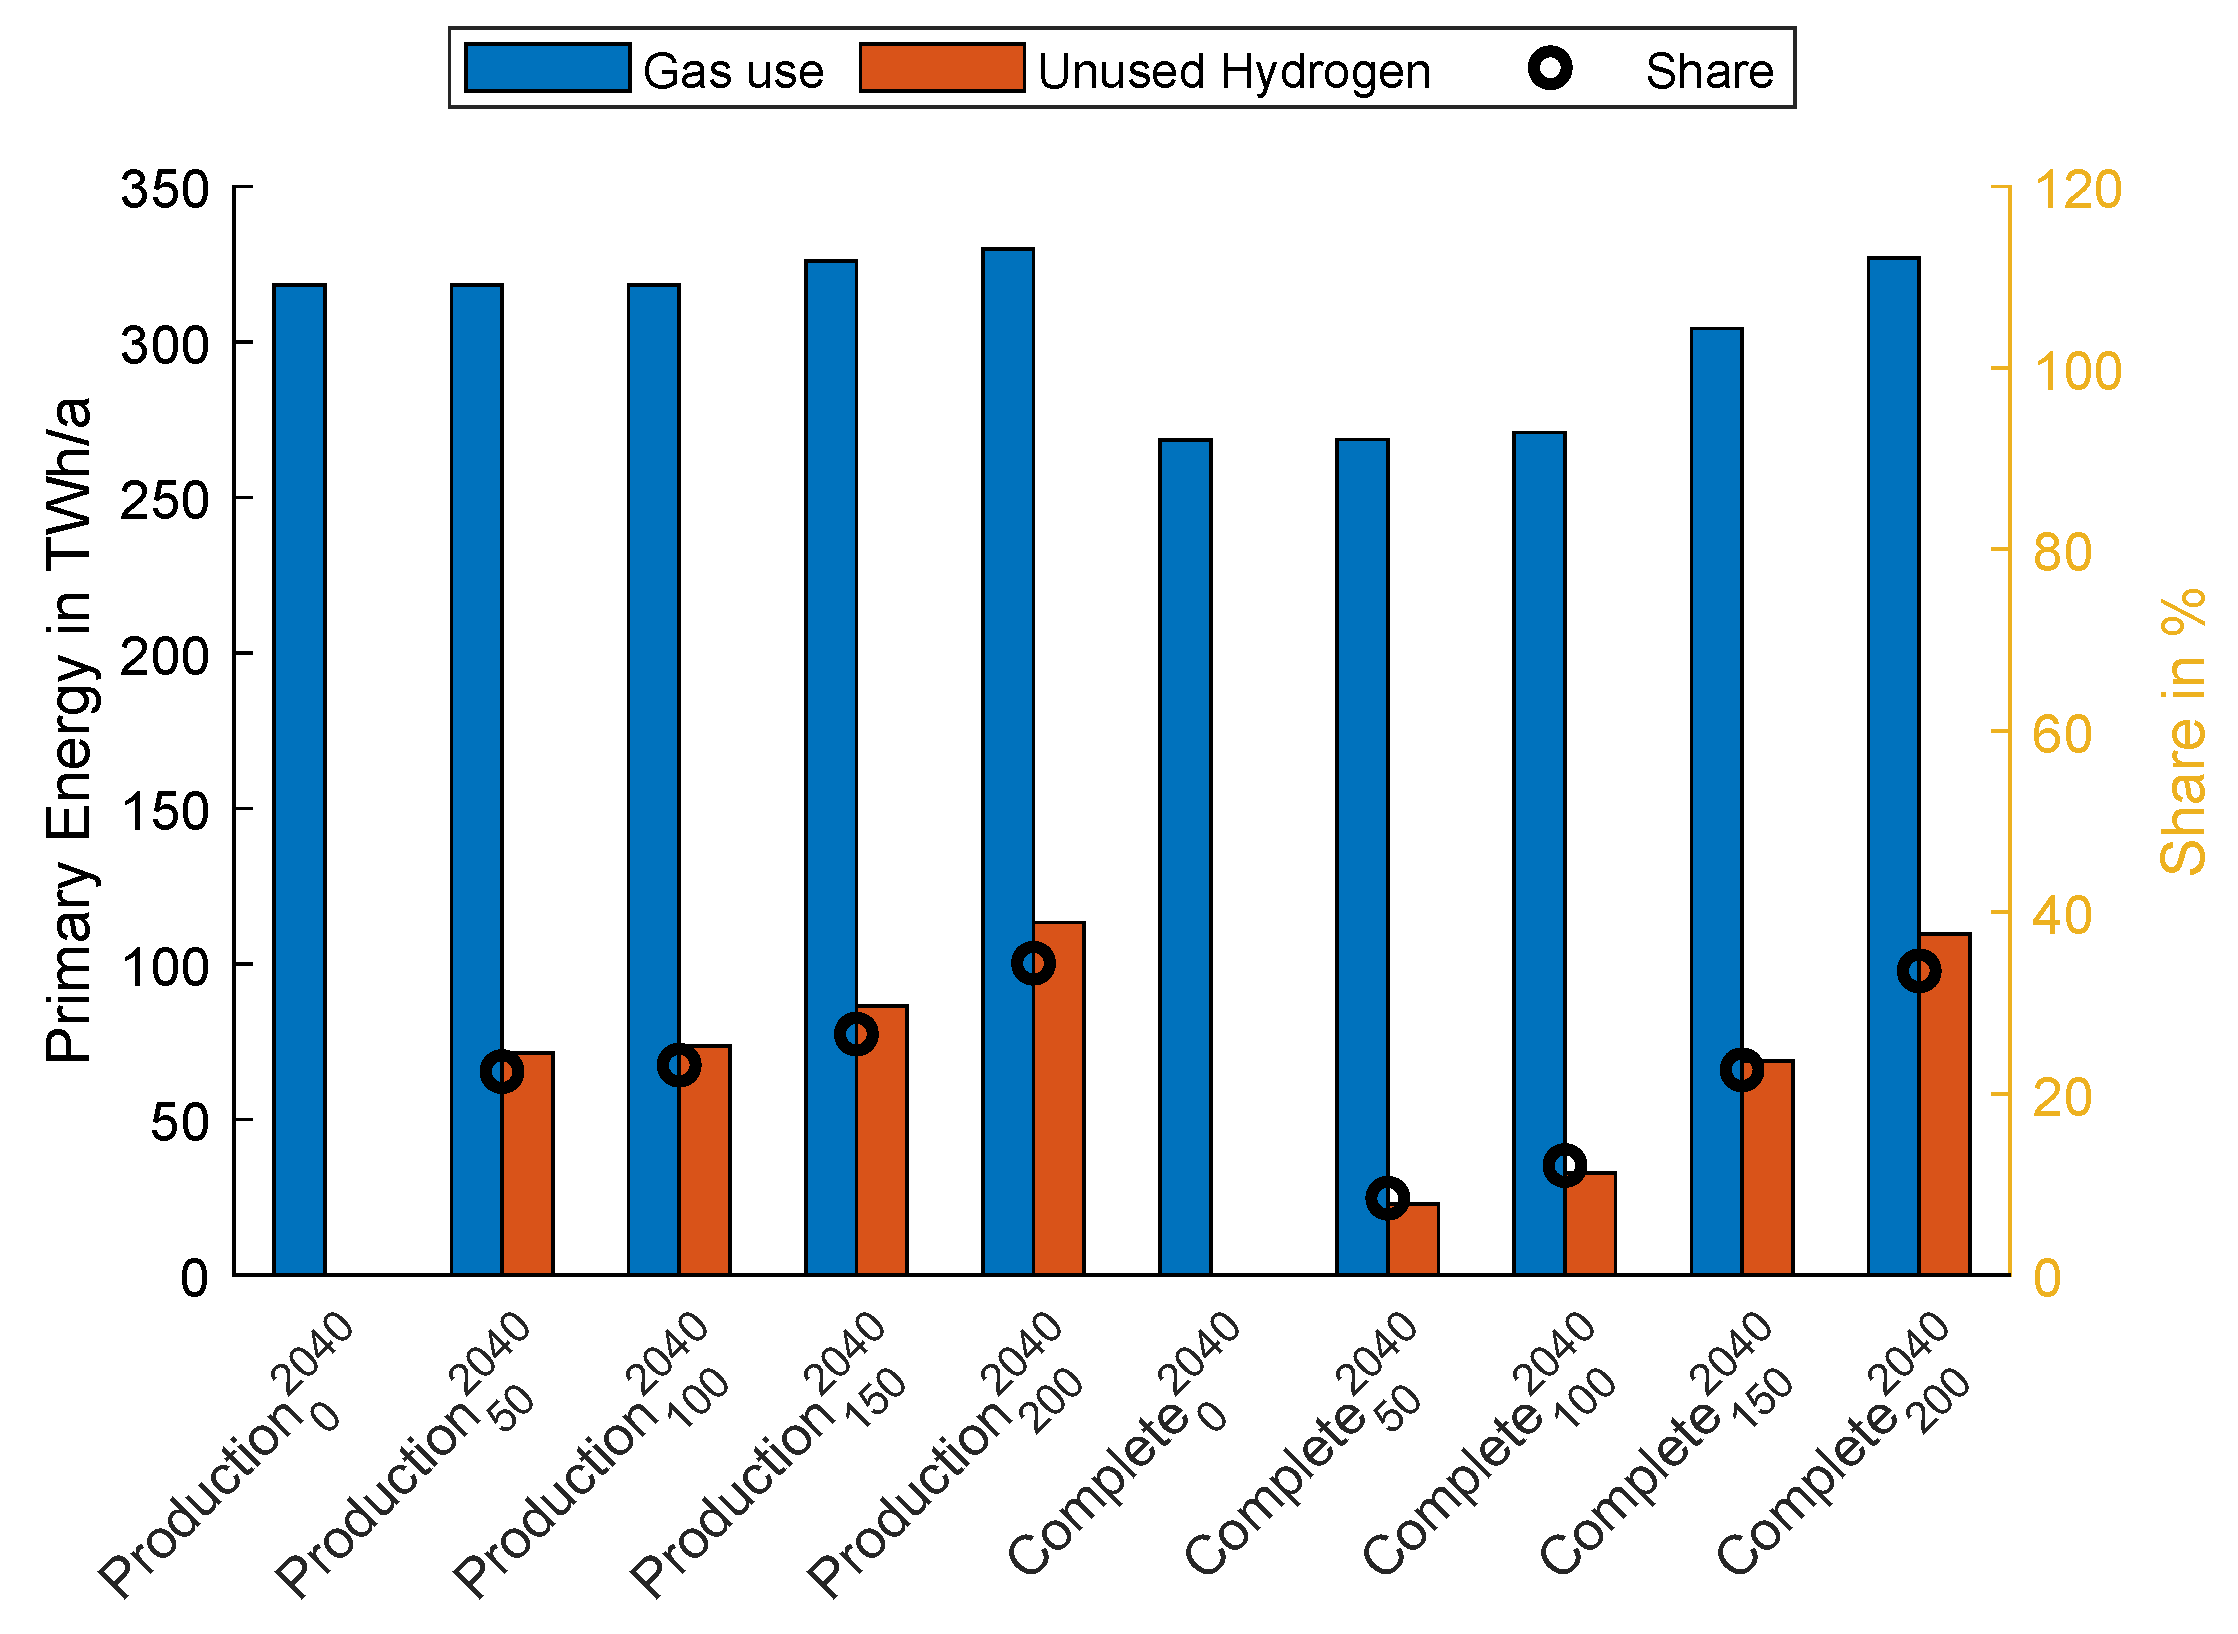
Appendix B.1. This hydrogen can mix or substitute natural gas in Combined-cycle gas turbine (CCGT) (
Appendix B.5).
Per the definition of the sector coupling, there is always a PS increase in the
Production scenarios (
Section 3). Hydrogen is only produced if it increases the PS (
Section 3.2.2). The integration of fuel cells in the
Complete scenarios changes this. In the scenarios without a hydrogen price (0 EUR/MWh
H2), it is not an electrolyzer PS increase that triggers hydrogen production but the utilization by fuel cells to cover electricity price peaks. These price peaks are linked with electricity demand peaks (Equation
2). This results in an increased fuel cell PS at lower hydrogen prices due to lower fuel cell SRMC. In 2030, fuel cells will be used instead of thermal power plants up to a hydrogen price of 100 EUR/MWh
H2 (
Appendix B.2). By 2040, the price peaks are even higher, leading to fuel cell utilization even with higher hydrogen prices.
5.3.4. Storage Unit Producer Surplus
This section describes the storage PS of battery storage units as short-term storage and PHS as seasonal storage units.
In 2030 (
Figure 16), the battery storage PS decreases, while PHS PS increases. Moreover, sector coupling reduces the use of storage units in all countries except France (
Appendix B.4). Thus, if mostly pink hydrogen is produced, storage use increases, while green hydrogen decreases storage use. This arises because electrolyzers are an alternative to storage use for low-cost electricity. The different results for battery storage and PHS are due to their different methods of energy storage. While battery storage methods have to buy electricity from the market, PHS have natural inflows from rain and meltwater. If the fuel cell SRMC is lower than that of thermal power plants, their use reduces electricity price peaks and storage PS.
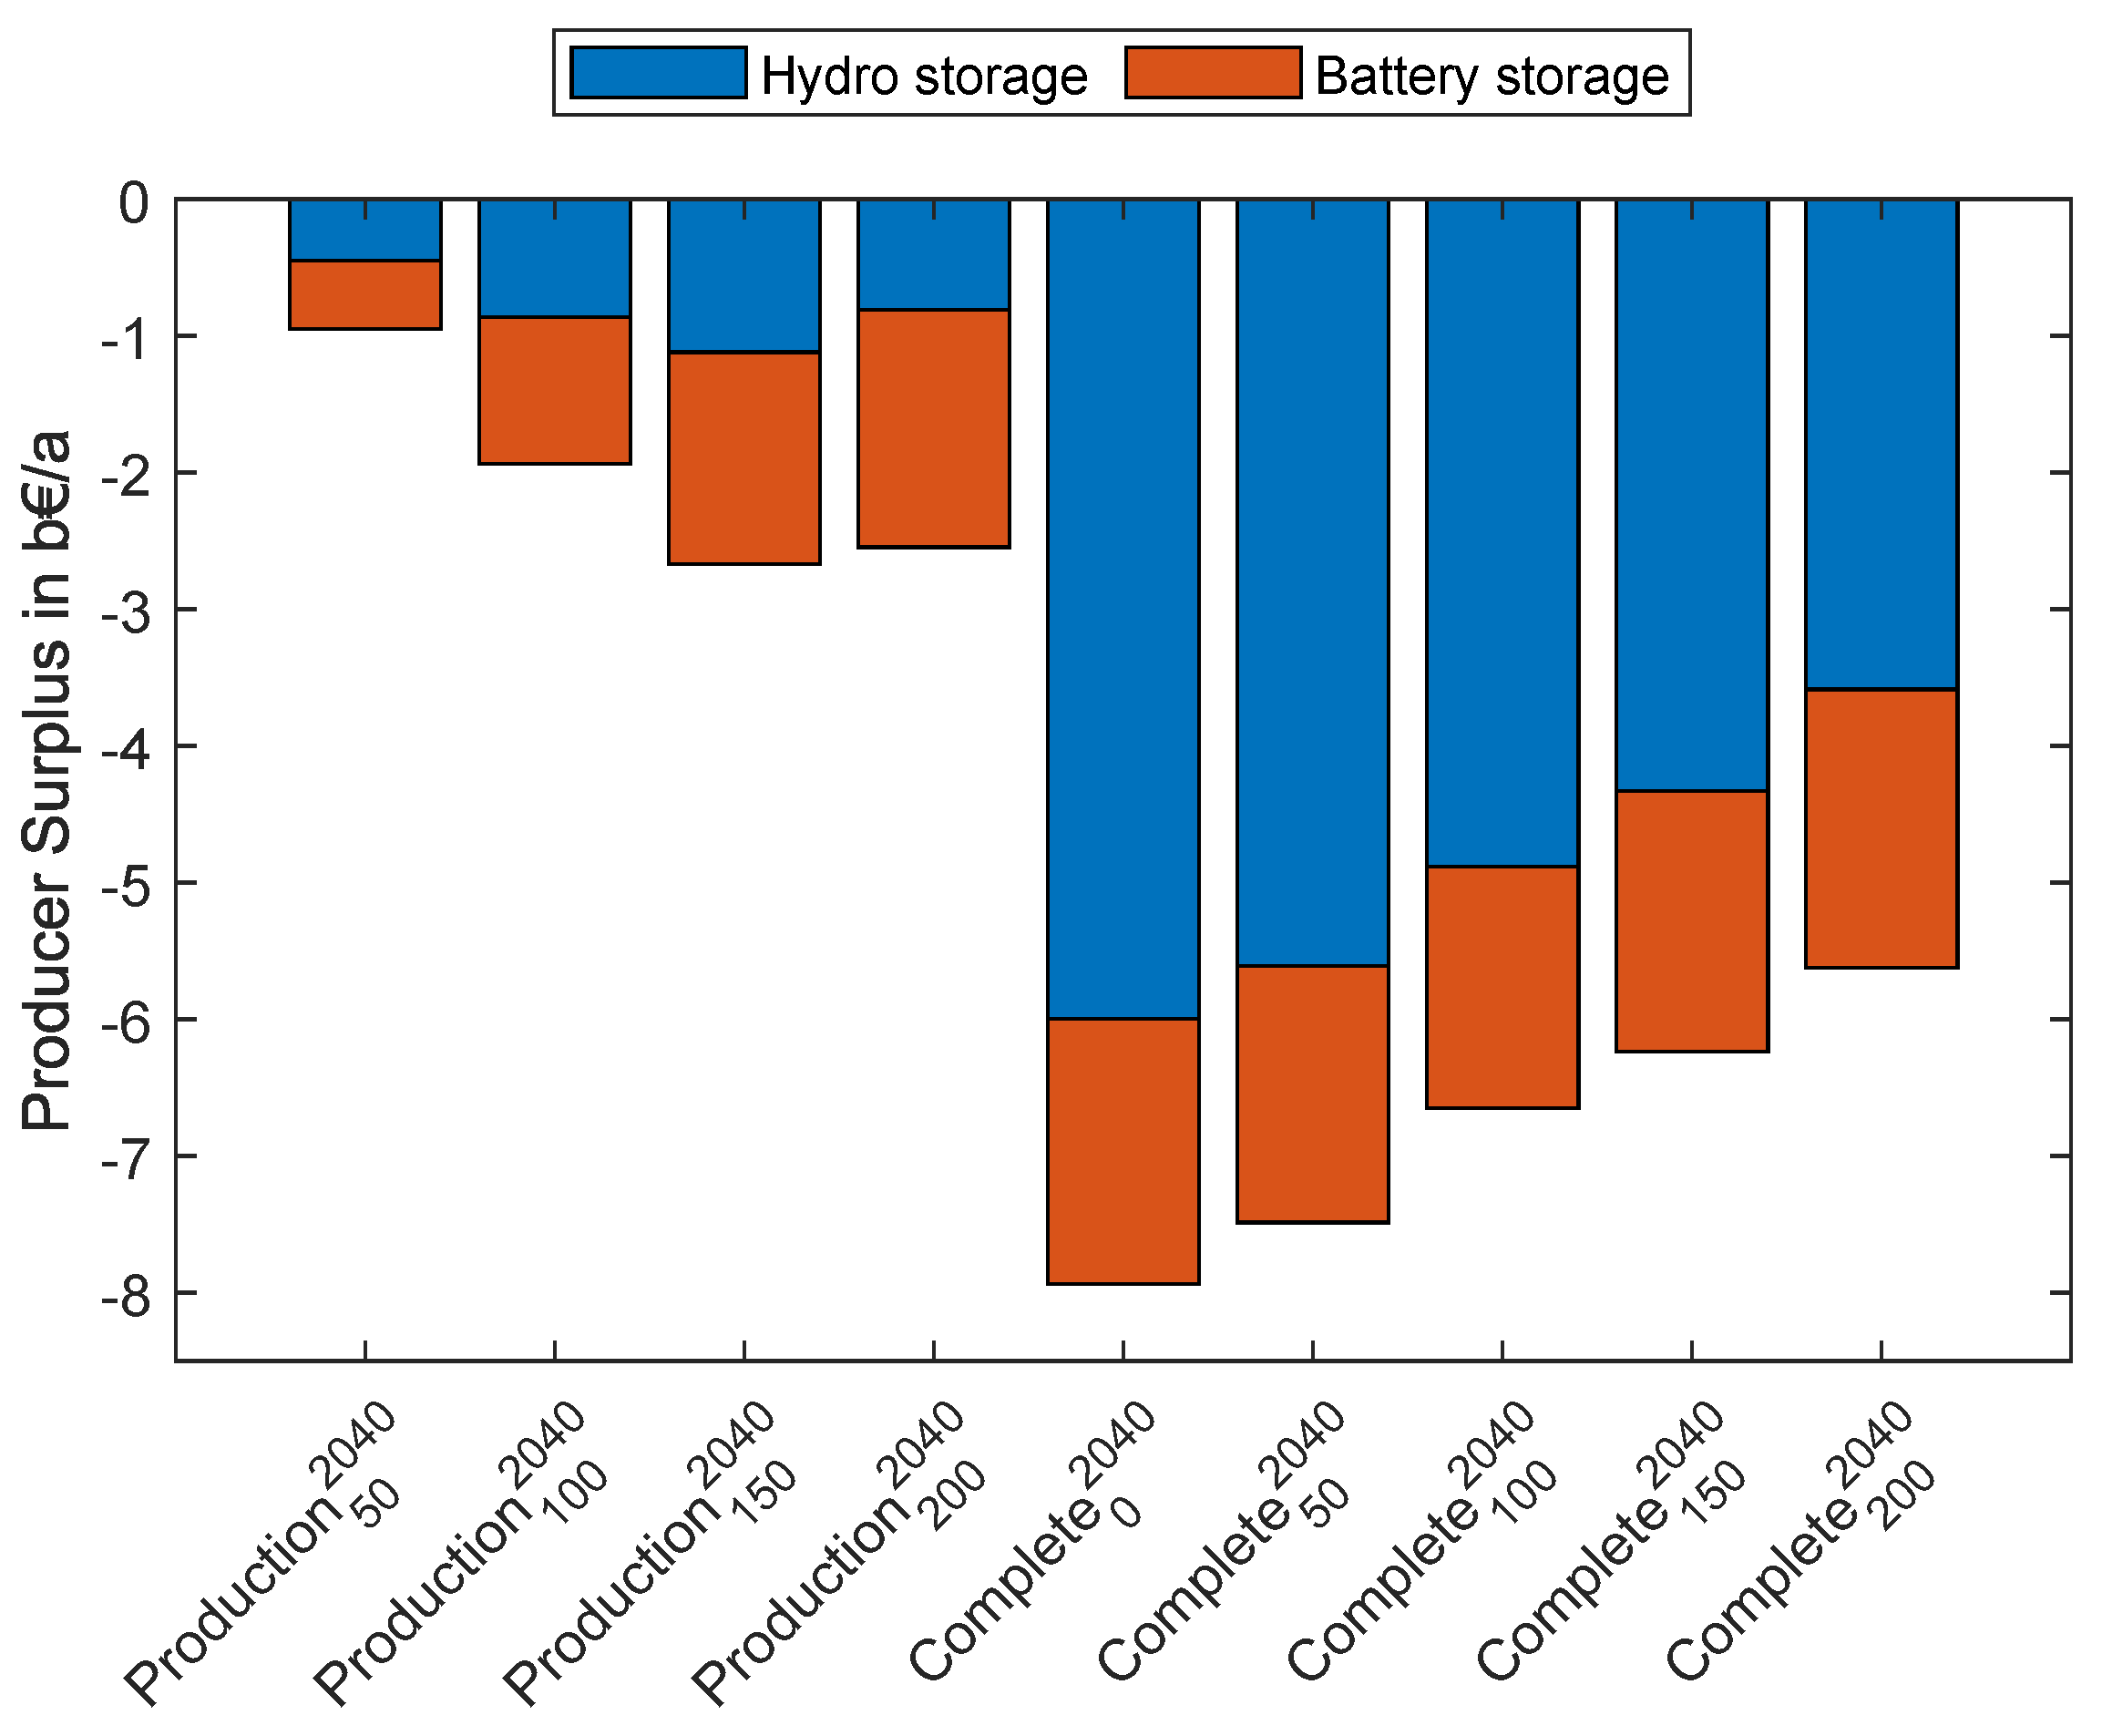
Sector coupling results in a PS reduction in all scenarios for both storage types in 2040 (
Figure 17). In the
Complete scenarios, lower peak prices result in significantly reduced PS.
5.4. Consumer Surplus
This section investigates the impact of sector coupling on CS. All scenarios are compared to the corresponding reference scenario that does not include sector coupling.
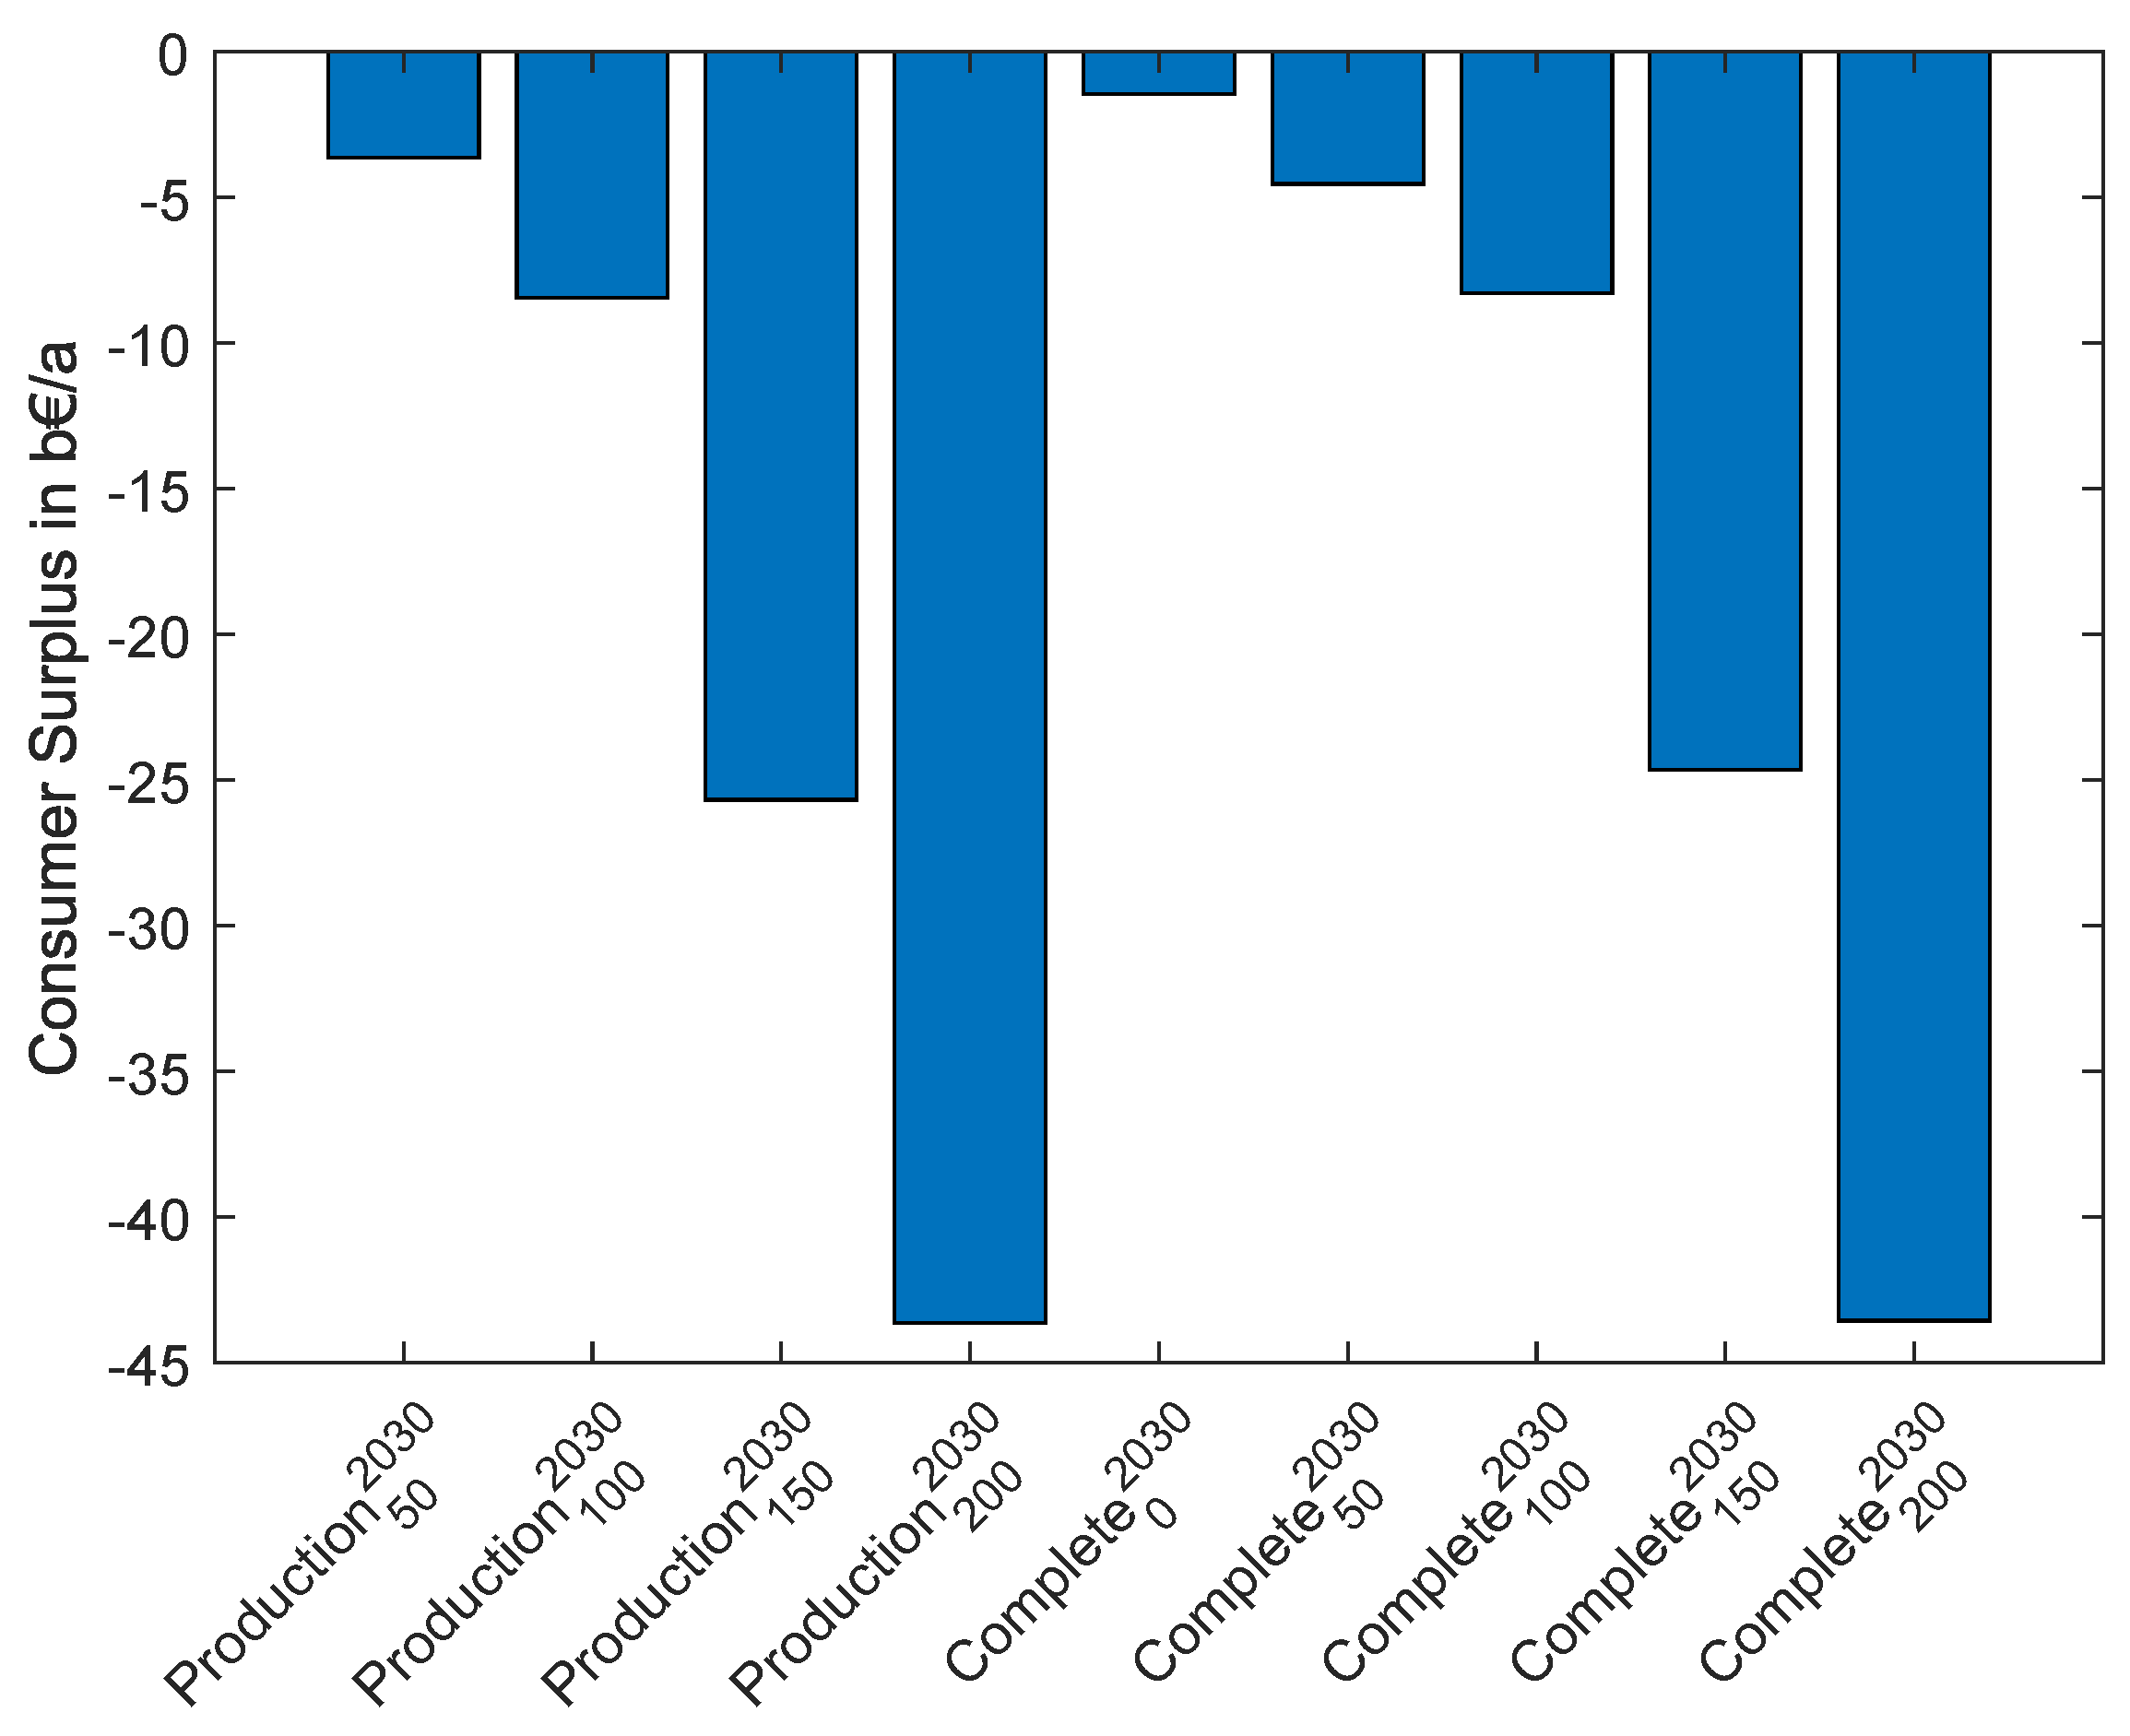
Sector coupling reduces the CS in all scenarios in 2030 (
Figure 18) as electricity prices rise. Fuel cells are used (
Appendix B.2), but the electricity peak prices are not high enough to achieve a total CS increase.
In 2040 (
Figure 19), the produced hydrogen is used by fuel cells to reduce high electricity peak prices (
Section 5.3.3). This results in a significant CS increase in the
Complete scenarios.
5.5. Economic Welfare
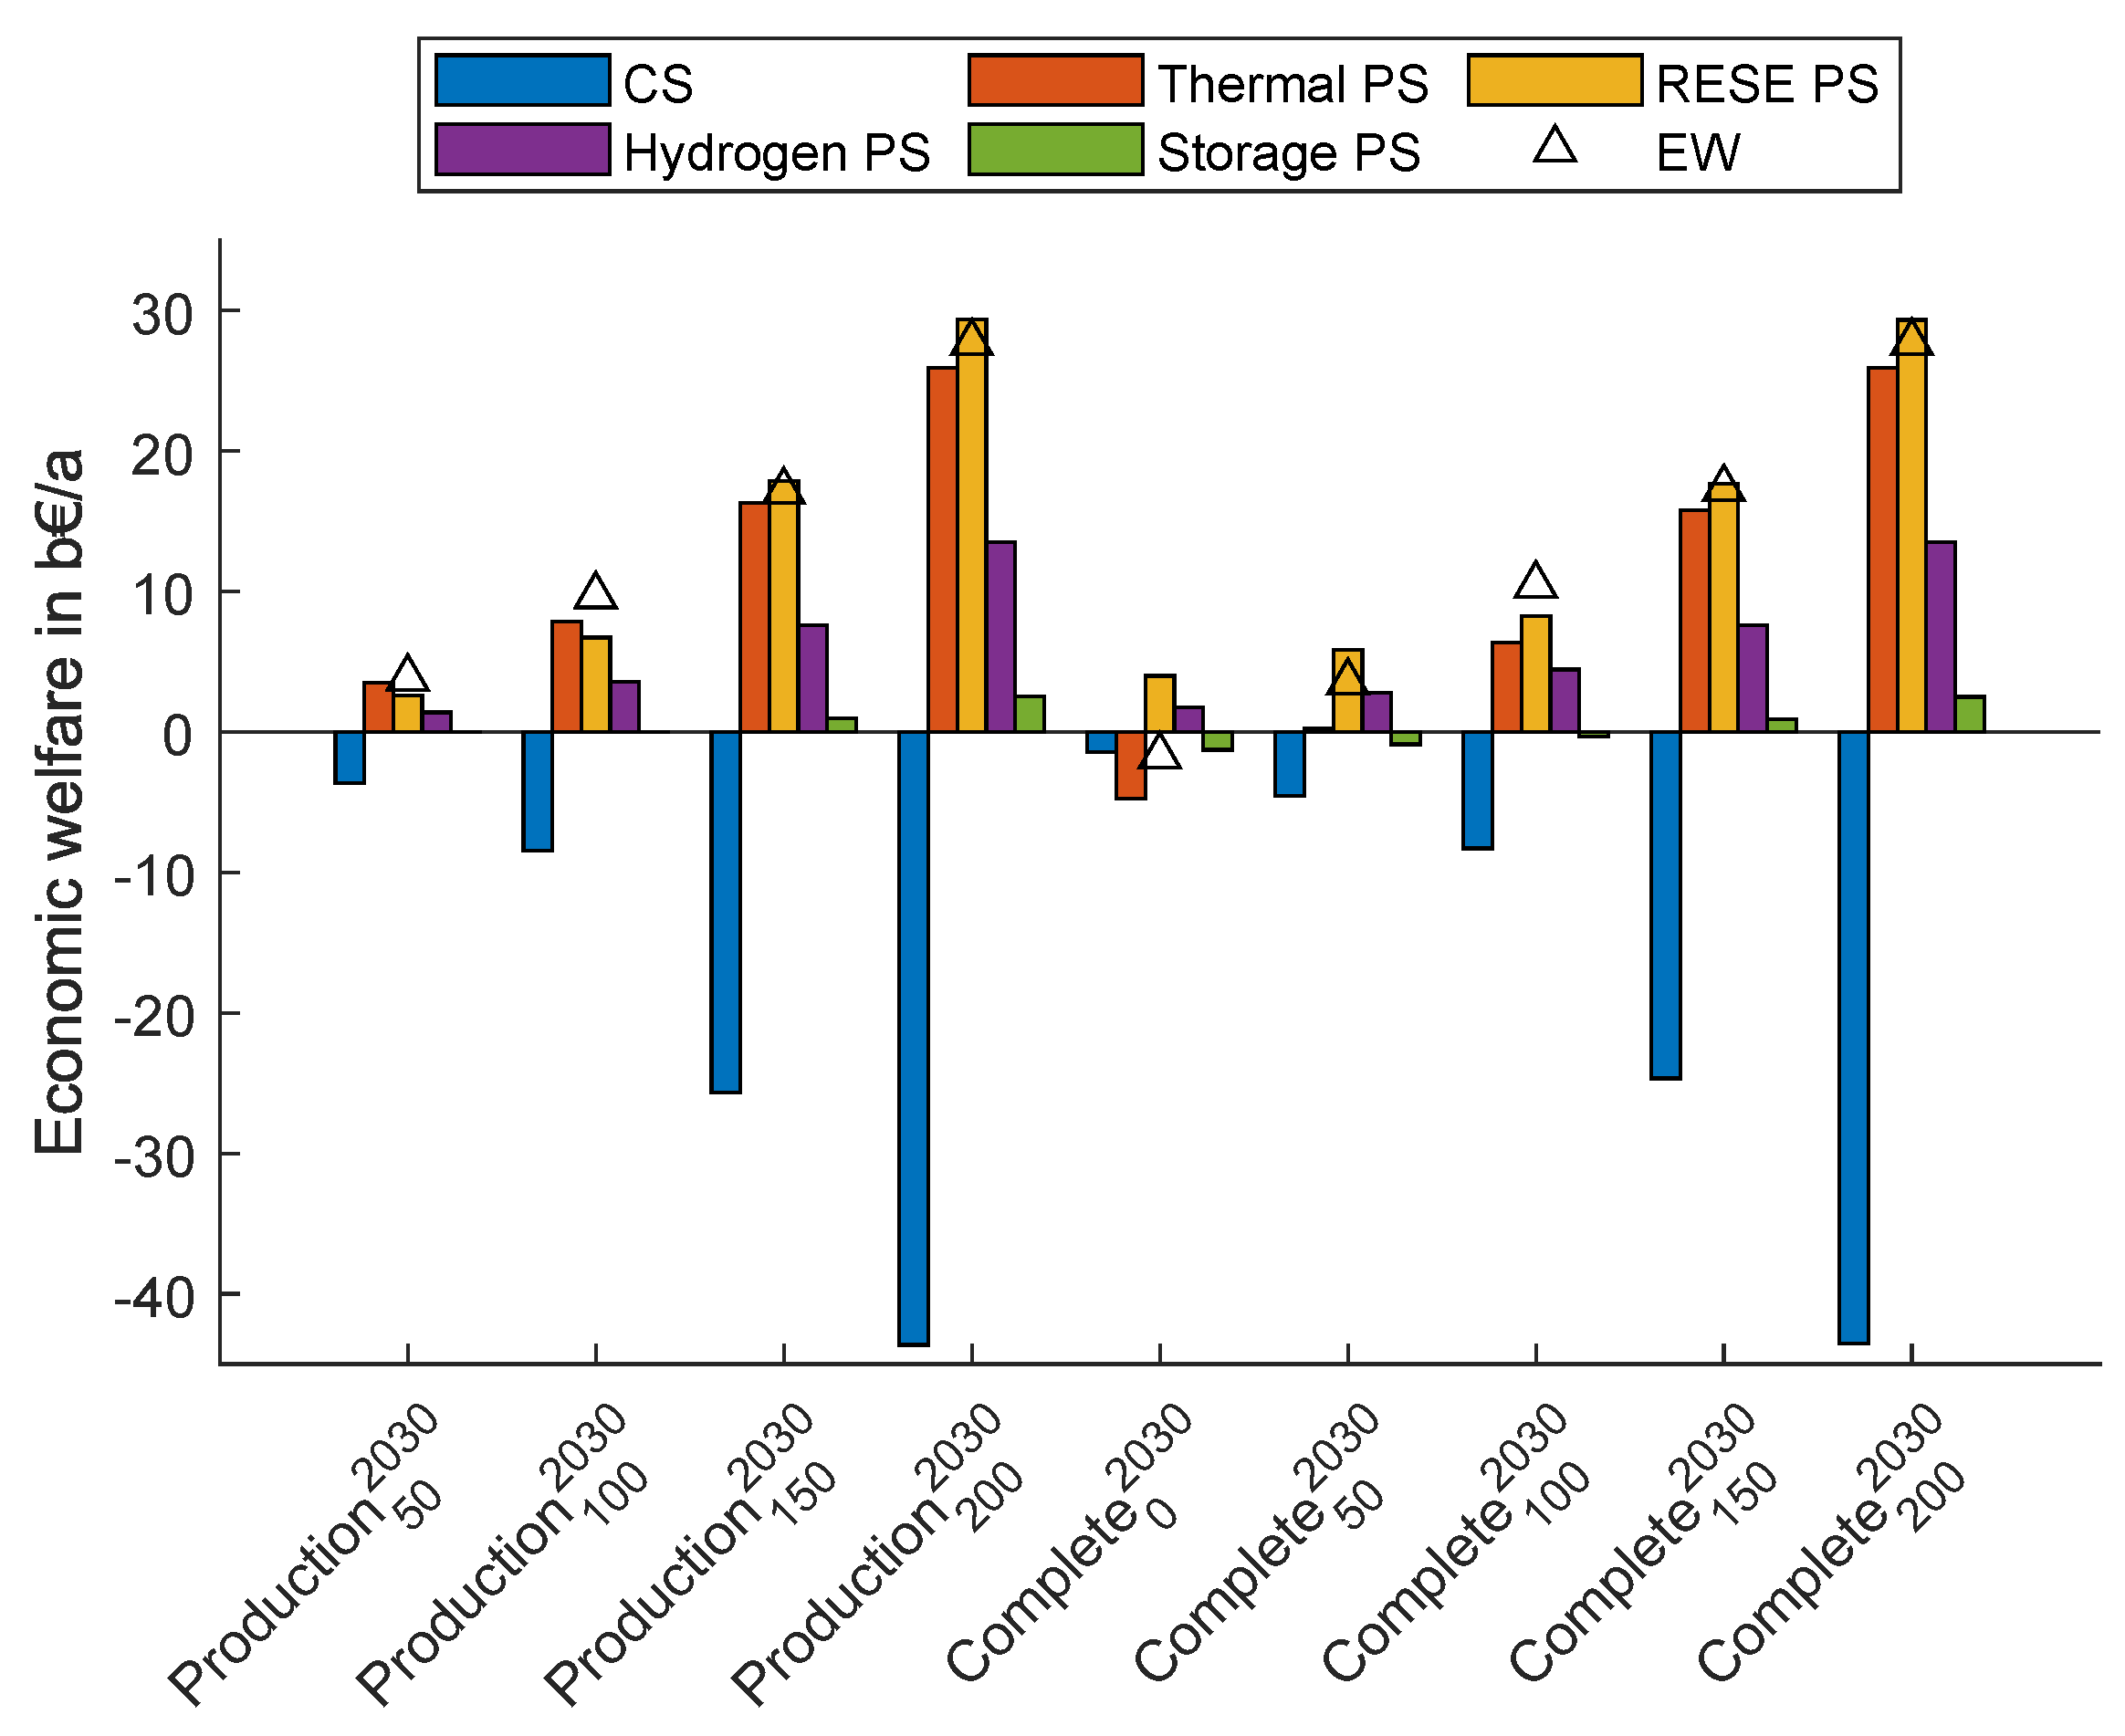
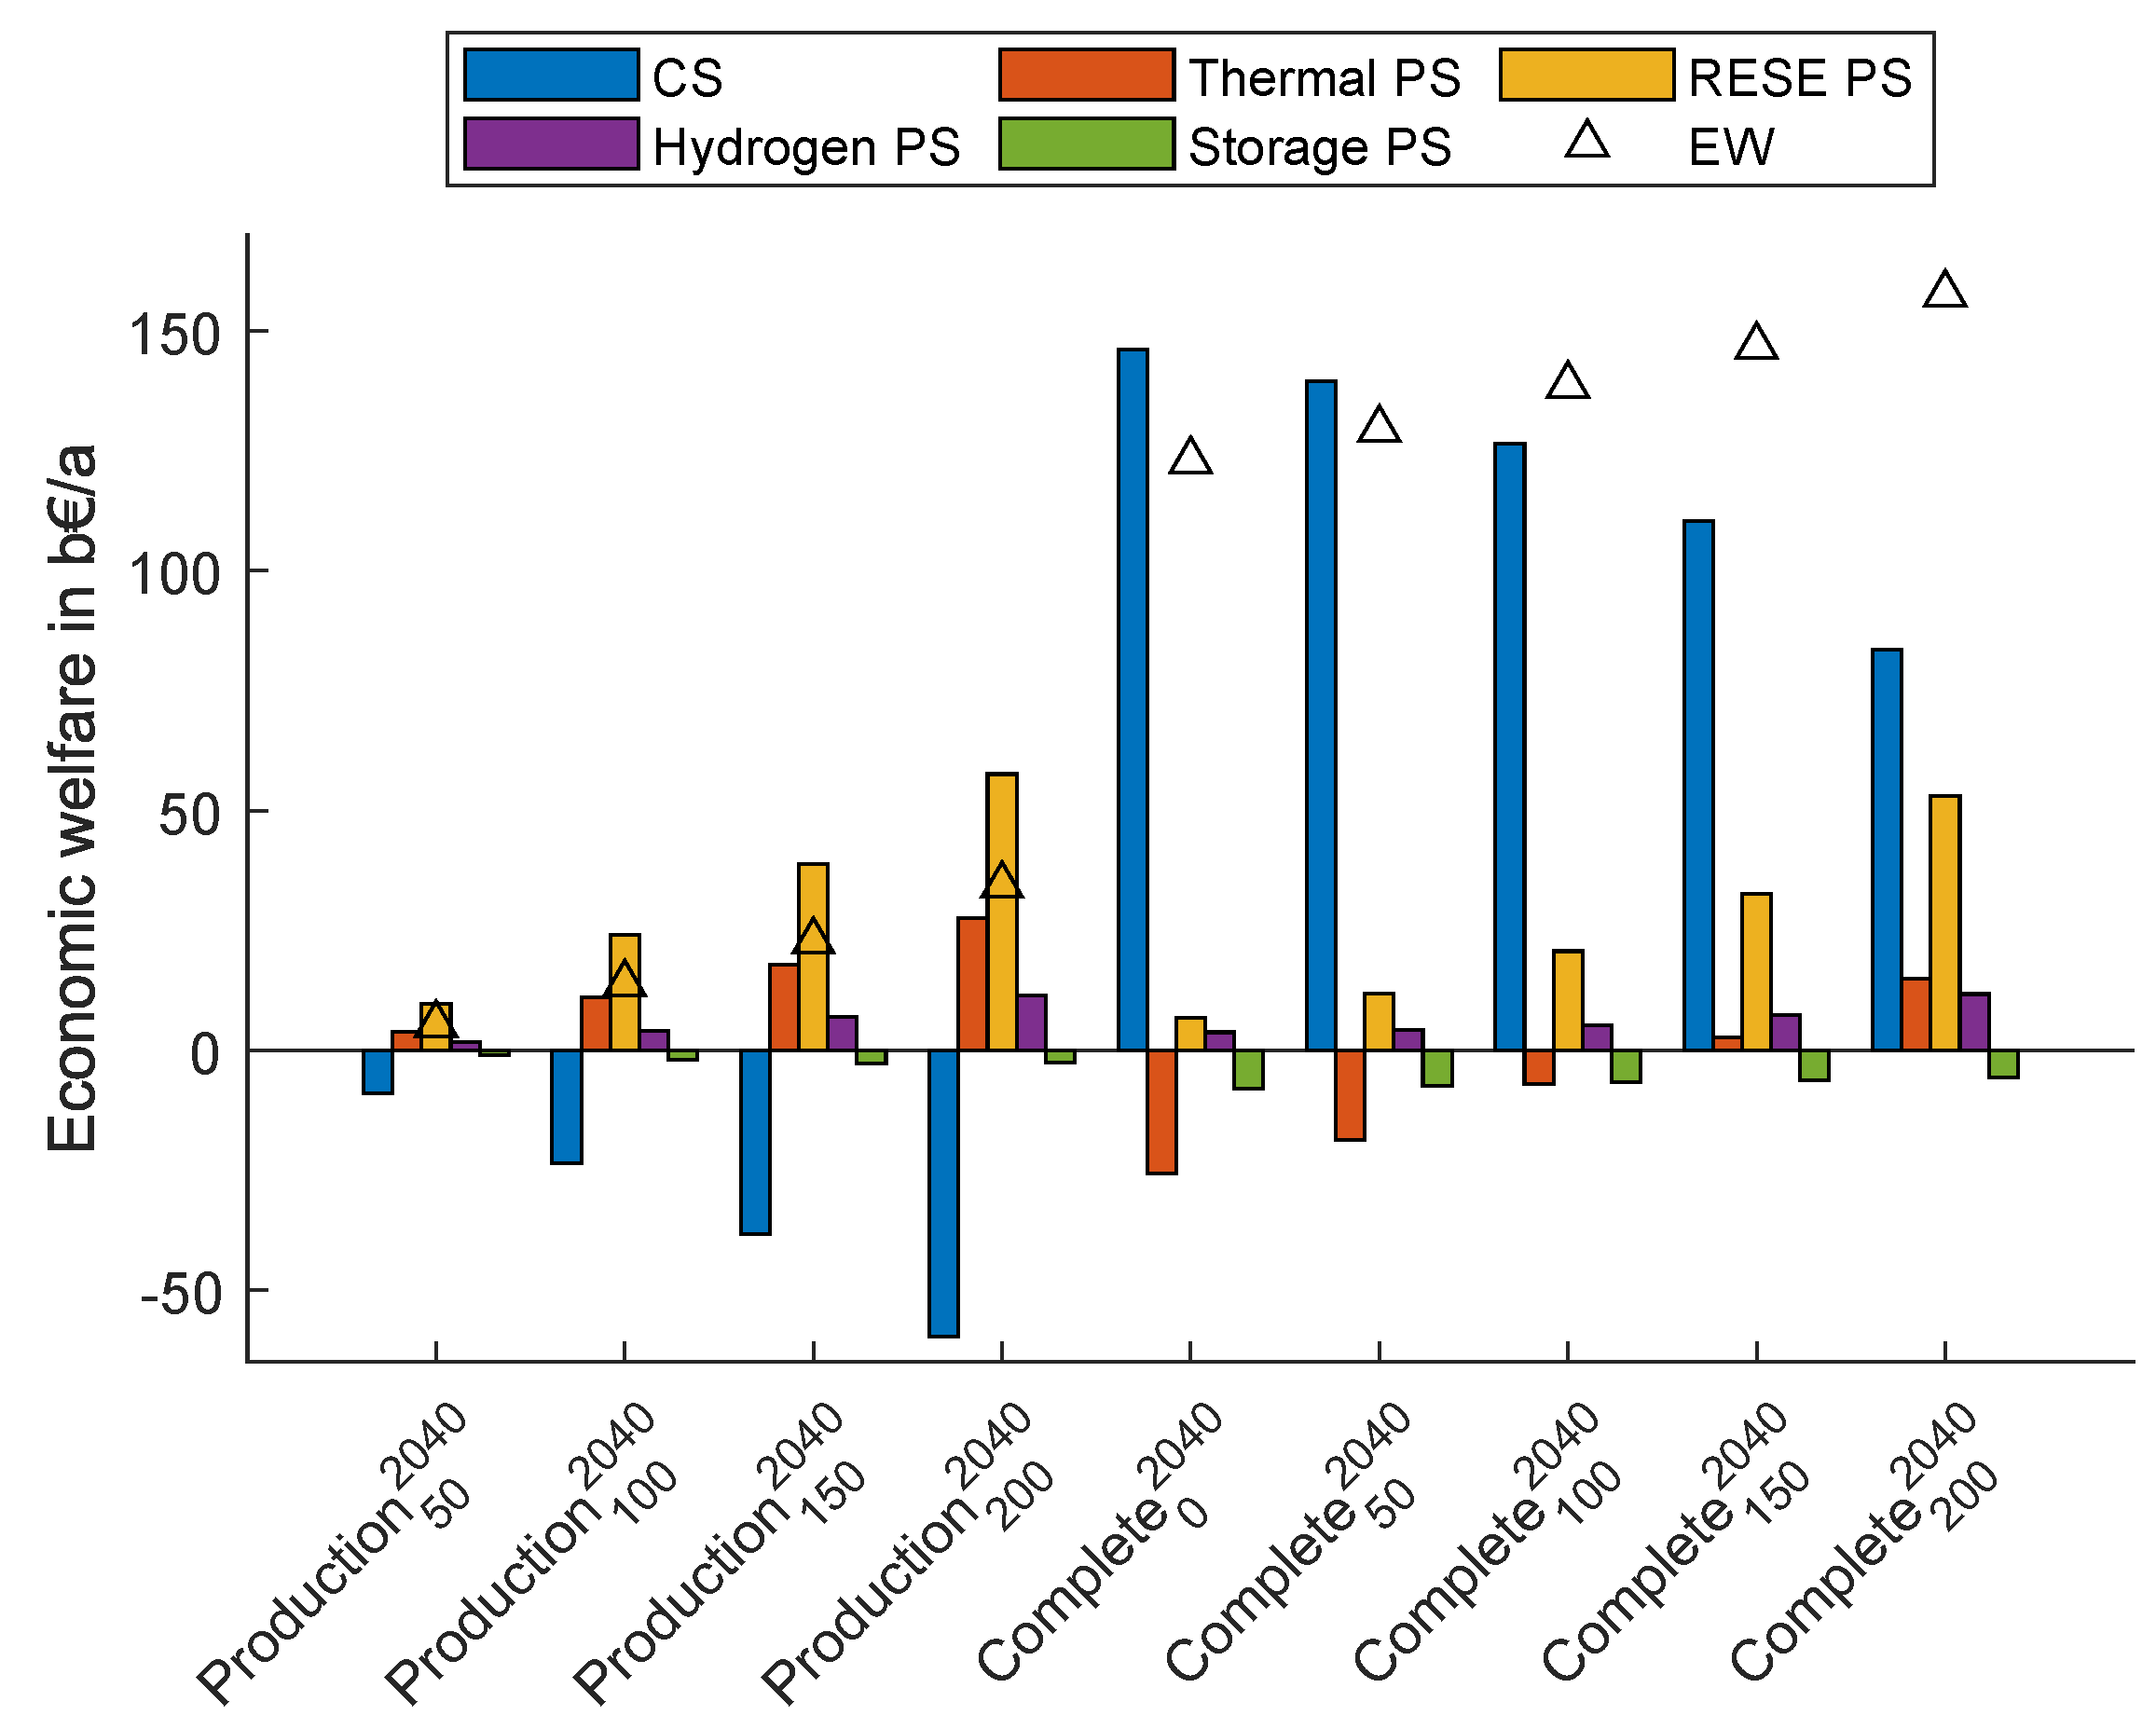
The individual PS and CS parts are summed up to analyze the overall EW benefit of sector coupling. The EW rises due to sector coupling in both 2030 (
Figure 20) and 2040 (
Figure 21).
The difference in 2030 (
Figure 20) between pure hydrogen production (
Production) and complete sector coupling with storage use (
Complete) is negligible. The EW in the
Complete scenarios is slightly higher up to a hydrogen price of 100 EUR/MWh
H2. Although the thermal and the storage PS are reduced, in particular, the higher electrolyzer PS results in an EW increase. Sector coupling benefits both thermal power plants and RES-E.
In 2040 (
Figure 21), there is a significant difference between scenarios involving hydrogen production (
Production) and complete sector coupling, including storage units and reconversion (
Complete). In the
Production scenarios, there is a welfare shift from consumers to electricity producers analogous to 2030. Fuel cell utilization reverses this. Consumers benefit, while thermal power plants and storage units PS decrease. However, because of their large share in the generation mix, RES-E benefit more than thermal power plants.
5.6. Hydrogen Types
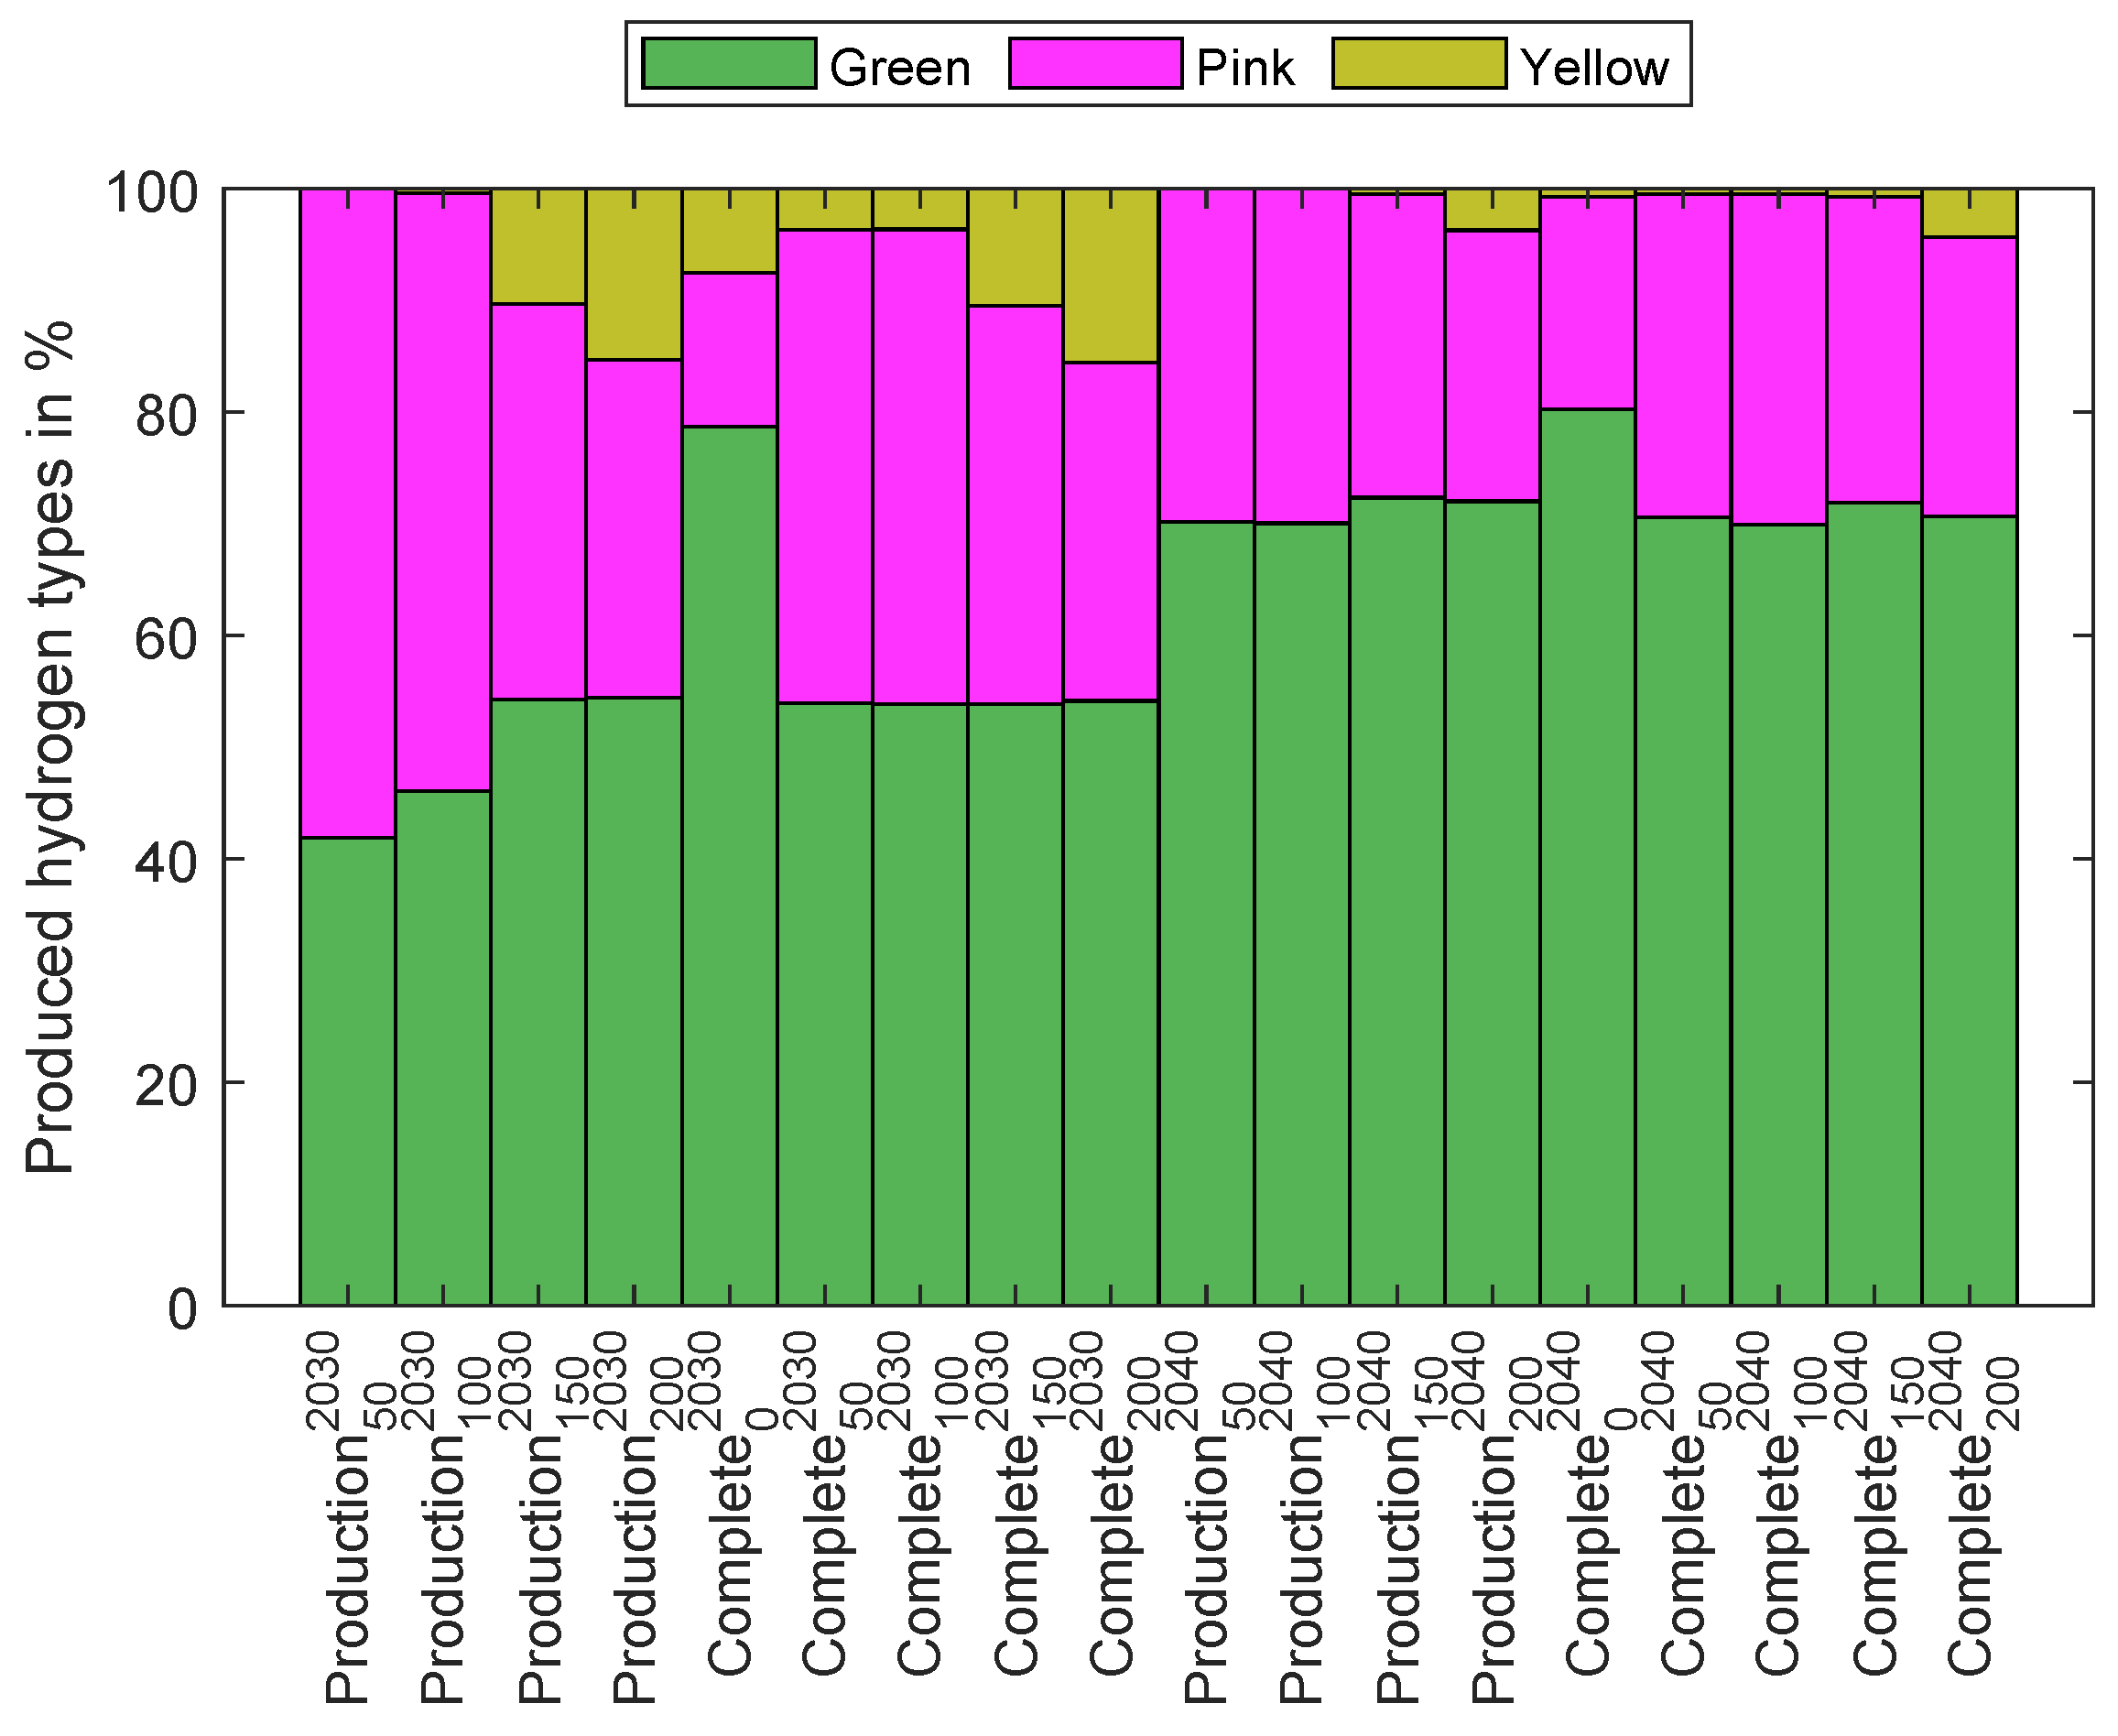
Figure 22 depicts the proportion of green, pink, and yellow hydrogen in the total production across all scenarios. The proportion of each type of hydrogen depends heavily on the scenarios. Pink hydrogen reaches a peak of 58% in the
Production-2030-50 scenario in 2030. In general, higher hydrogen prices reduce the share of pink hydrogen while increasing the amount of hydrogen produced (
Appendix B.1). An exception occurs in the scenarios with a hydrogen price of 0 EUR/MWh
H2 because the production is triggered by electricity price peaks and not by electrolyzer PS. Green hydrogen accounts for the majority of the produced hydrogen, while yellow hydrogen has little impact. Pink hydrogen is nearly entirely produced in France (
Figure A10 and
Figure A11). All other countries mostly produce green hydrogen.
6. Discussion
The results show that a change in electricity prices caused by sector coupling directly causes PS and CS changes (
Section 5.2). Low electricity prices stimulate hydrogen production, which raises the electricity price. High electricity prices trigger the dispatch of fuel cells, resulting in a price reduction. As a result, the extent of extremely low and extremely high electricity prices becomes lower. The average and standard deviation of electricity prices are reduced, while the median electricity price remains unchanged. As a result, observing the median price in isolation is not a reliable method for analyzing the effects of sector coupling. It is critical to consider the respective surpluses.
Hydrogen production drastically increases nuclear power plant PS (
Section 5.3.1). They stand to gain significantly from hydrogen production if the public accepts pink hydrogen. Generation units with higher SRMC, such as coal, lignite, oil, or gas can only achieve additional PS if the hydrogen price is sufficiently high. The use of fuel cells reduces their PS because they compensate for price peaks.
Because of the RES-E with marginally low SRMC, an increase in electricity prices always increases their PS (
Section 5.3.2). Even in the fuel cell scenarios, price peaks and spillage reduction lead to an increase in PS over the year. As a result, the increase in PS through higher clearing prices is greater than the decrease in PS due to lower clearing prices. Hydrogen integration benefits wind and PV in particular.
According to the sector coupling definition, the electrolyzer PS increases in scenarios without hydrogen-to-electricity conversion. When fuel cells are used in conjunction with a hydrogen price of 0 EUR/MWhH2, hydrogen production is only triggered by the use of fuel cells. This results in a negative electrolyzer PS. Higher hydrogen prices result in higher electrolyzer PS but lower fuel cell PS. Only if the fuel cell SRMC are lower than those of other generation units are they used instead of them. This demonstrates the fuel cell PS’s strong reliance on primary energy prices such as natural gas and hydrogen prices.
In all scenarios in 2030, the short-term flexibility of battery storage units competes with the flexibility provided by sector coupling. Hence, the PS of battery storage falls (
Section 5.3.4). PHS have more storage capacity and a natural inflow and can be used for longer periods. As a result of higher electricity prices, their PS rises. Sector coupling reduces the PS in all scenarios in 2040 for both storage types due to the increased availability of flexibility through sector coupling.
Sector coupling reduces the CS in all scenarios by 2030 as electricity prices rise due to electrolyzers (
Section 5.4). In 2040, CS increases through significant price peaks. Otherwise, from the standpoint of the electricity market, consumers do not benefit from sector coupling. This does not necessarily imply that there is no overall CS increase if other sectors such as heating and transportation are considered as well. However, a reduction in CS generally induces a disadvantage for consumers who do not require hydrogen. This entails a significant social redistribution of costs and benefits.
In all scenarios, the overall EW rises (
Section 5.5). Thermal power plants and RES-E benefit equally from sector coupling in 2030. There is a shift in welfare from consumers to electricity producers. In 2040, there is a significant difference between scenarios with hydrogen production and complete sector coupling, including storage units and reconversion. In the scenarios with hydrogen production, there is a welfare shift from consumers to electricity producers. Fuel cell utilization reverses this welfare shift. If significant electricity peaks can be compensated for by fuel cells, the consumers will benefit the most from sector coupling. This, however, is not limited to fuel cells. In addition to other flexibility options, CCGT can use hydrogen as well.
The proportion of each type of hydrogen depends heavily on the scenarios (
Section 5.6). Green hydrogen accounts for the most hydrogen produced, while yellow hydrogen has little impact. However, pink hydrogen sets up a high share of overall production. In the scenarios, pink hydrogen is nearly entirely produced in France. However, the results indicate that hydrogen from nuclear power plants could play an important role depending on political and regulatory decisions.
The modelling approach used does not limit hydrogen storage capacity. As a result, the required capacity is calculated ex post (
Appendix B.3). If the available hydrogen storage capacities are smaller than those calculated ex post, this will change the PS, CS, and EW results. Hence, the available hydrogen storage capacity has the great impact on the results, especially in 2040 with high electricity price peaks.
7. Conclusions
This paper proposes a method for implementing sector coupling between the European electricity market and national hydrogen markets. Electrolyzers, fuel cells, and other high-efficiency hydrogen-to-electricity converters such as CCGT function as conversion technologies. They allow energy trade between these markets. The modified PS, CS, and EW trade-offs are analyzed. Moreover, the types of hydrogen produced and the altered overall electricity mix are investigated.
This methodology allows hydrogen technologies to not act as price takers and the electricity market to not act as price setters; instead, a joint optimum is found. Hydrogen production increases electricity demand, influencing electricity generation and, as a result, the electricity price. The latter influences electricity generation via hydrogen utilization by fuel cells and thus the price of electricity. Hence, the electricity and hydrogen markets affect each other. As a result, they are optimized jointly to achieve a holistic EW optimum. A unit commitment market is required to achieve this in real markets. In particular, the dependence of the electrolyzer’s electricity demand on the market clearing price necessitates a fully integrated market with very precise generation and demand prediction models in use. Demand bids could fulfill this as part of the electricity market design.
The methodology used to integrate the hydrogen market is not limited to hydrogen. Rather, with appropriate parameter selection and conversion technologies, it can be easily adapted to integrate other sectors. While this research focuses on integrating hydrogen via electrolysis and fuel cells, future work may include hydrogen methanation as part of our modelling framework. Methane is also used in conventional gas turbines to generate electricity and heat. The additional losses of the methanation process will necessitate higher electricity price spreads than fuel cells, but this method can provide vast amounts of installed capacity. Electricity, hydrogen, and heating sector coupling can generate enormous additional EW potential. This can have an impact on fuel cell utilization, particularly in Northern Europe during the winter. In this work, the mixture potential of natural gas and hydrogen for use by CCGT is evaluated ex post.
The results indicate that the sector coupling of the electricity and hydrogen markets has enormous flexibility potential. This flexibility potential can be further increased by blue hydrogen through an additional market. RES-E especially benefit from this if they dominate the generation mix. In turn, investment incentives are created, making their expansion even more appealing. If electricity price peaks occur, the use of hydrogen to generate electricity will significantly reduce them. Consequently, consumers benefit significantly from sector coupling in this case. Meanwhile, pure hydrogen production raises electricity prices to the detriment of consumers. Because of the unequal distribution of costs and benefits in the population, additional regulatory compensation measures may be required. The described RES-E investment incentives induce a long-term change in the power plant fleet subject to the hydrogen price. Hence, the described results represent a short-term optimum based on political goals. To examine the resulting investments, it is necessary to extend the model to an investment model. This can reevaluate the investment incentives in shorter time steps of a couple of years and react to them with investment decisions.
Furthermore, the results show that yellow hydrogen accounts for only a minor portion of the generated hydrogen. However, the scenarios assume an electricity market dominated by RES-E. Until these expansion goals are met, the share of yellow hydrogen could be significantly higher, resulting in higher CO2 emissions. Furthermore, pink hydrogen accounts for a significant portion of total hydrogen production. This pink hydrogen is nearly entirely produced in France. It has a large decarbonization potential, but its production and use are heavily reliant on political and regulatory decisions and social acceptance. The model currently has no policy or regulatory limitations implemented. The split of hydrogen production among the different types depends on the corresponding power plant fleet and thus on the scenario choice. Since the focus in this work is based on compliance with the NECP, there is a strong focus on pink hydrogen in France, while the other countries produce almost exclusively green hydrogen. The choice of an alternative power plant fleet would require the inclusion of additional constraints that would cause compliance with national legislation. This is easily possible in the used model but was not implemented in this work as the focus was explicitly on the effects of sector coupling without external policies or regulatory constraints.
This paper limits hydrogen trade to national hydrogen markets with the same hydrogen price in each country. Further research could investigate the potential of unrestricted cross-border trade. The results may be affected if not all hydrogen producers and consumers are connected or if storage capacity is limited ex ante rather than calculated ex post.
If fuel cell SRMC are lower than those of other power plants, they are used instead. This implies that fuel cell PS is highly dependent on primary energy prices, such as natural gas and hydrogen prices. The used model assumes a fixed natural gas price with no dependency between the natural gas price and the hydrogen price. An additional sector coupling could be implemented to model this interaction and assess the impact of the natural gas price.

